
A Feasibility Study on Hydrate-Based Technology for Transporting CO2 from Industrial to Agricultural Areas


1
Graduate school of Engineering, The University of Tokyo, Tokyo 113-8656, Japan
2
Department of bioenvironmental and agricultural engineering, Nihon University, Fujisawa 252-0880, Japan
3
National Institute of Advanced Industrial Science and Technology (AIST), Tsukuba 305-8565, Japan
4
Graduate school of Engineering, The University of Tokyo, Tokyo 113-8656, Japan
*
Author to whom correspondence should be addressed.
Energies 2017, 10(5), 728; https://doi.org/10.3390/en10050728
Submission received: 15 April 2017
/
Revised: 16 May 2017
/
Accepted: 17 May 2017
/
Published: 20 May 2017
(This article belongs to the Special Issue Methane Hydrate Research and Development)
Abstract
:Climate change caused by global warming has become a serious issue in recent years. The main purpose of this study was to evaluate the effectiveness of the above system to quantitatively supply CO2 or CO2 hydrate from industrial to agricultural areas. In this analysis, several transportation methods, namely, truck, hydrate tank lorry, and pipeline, were considered. According to this analysis, the total CO2 supply costs including transportation ranged from 15 to 25 yen/kg-CO2 when the transportation distance was 50 km or less. The cost of the hydrate-based method increased with the transport distance in contrast to the liquefied CO2 approach. However, the technology of supplying CO2 hydrate had merit by using a local cooling technique for cooling specific parts of agricultural products.
1. Introduction
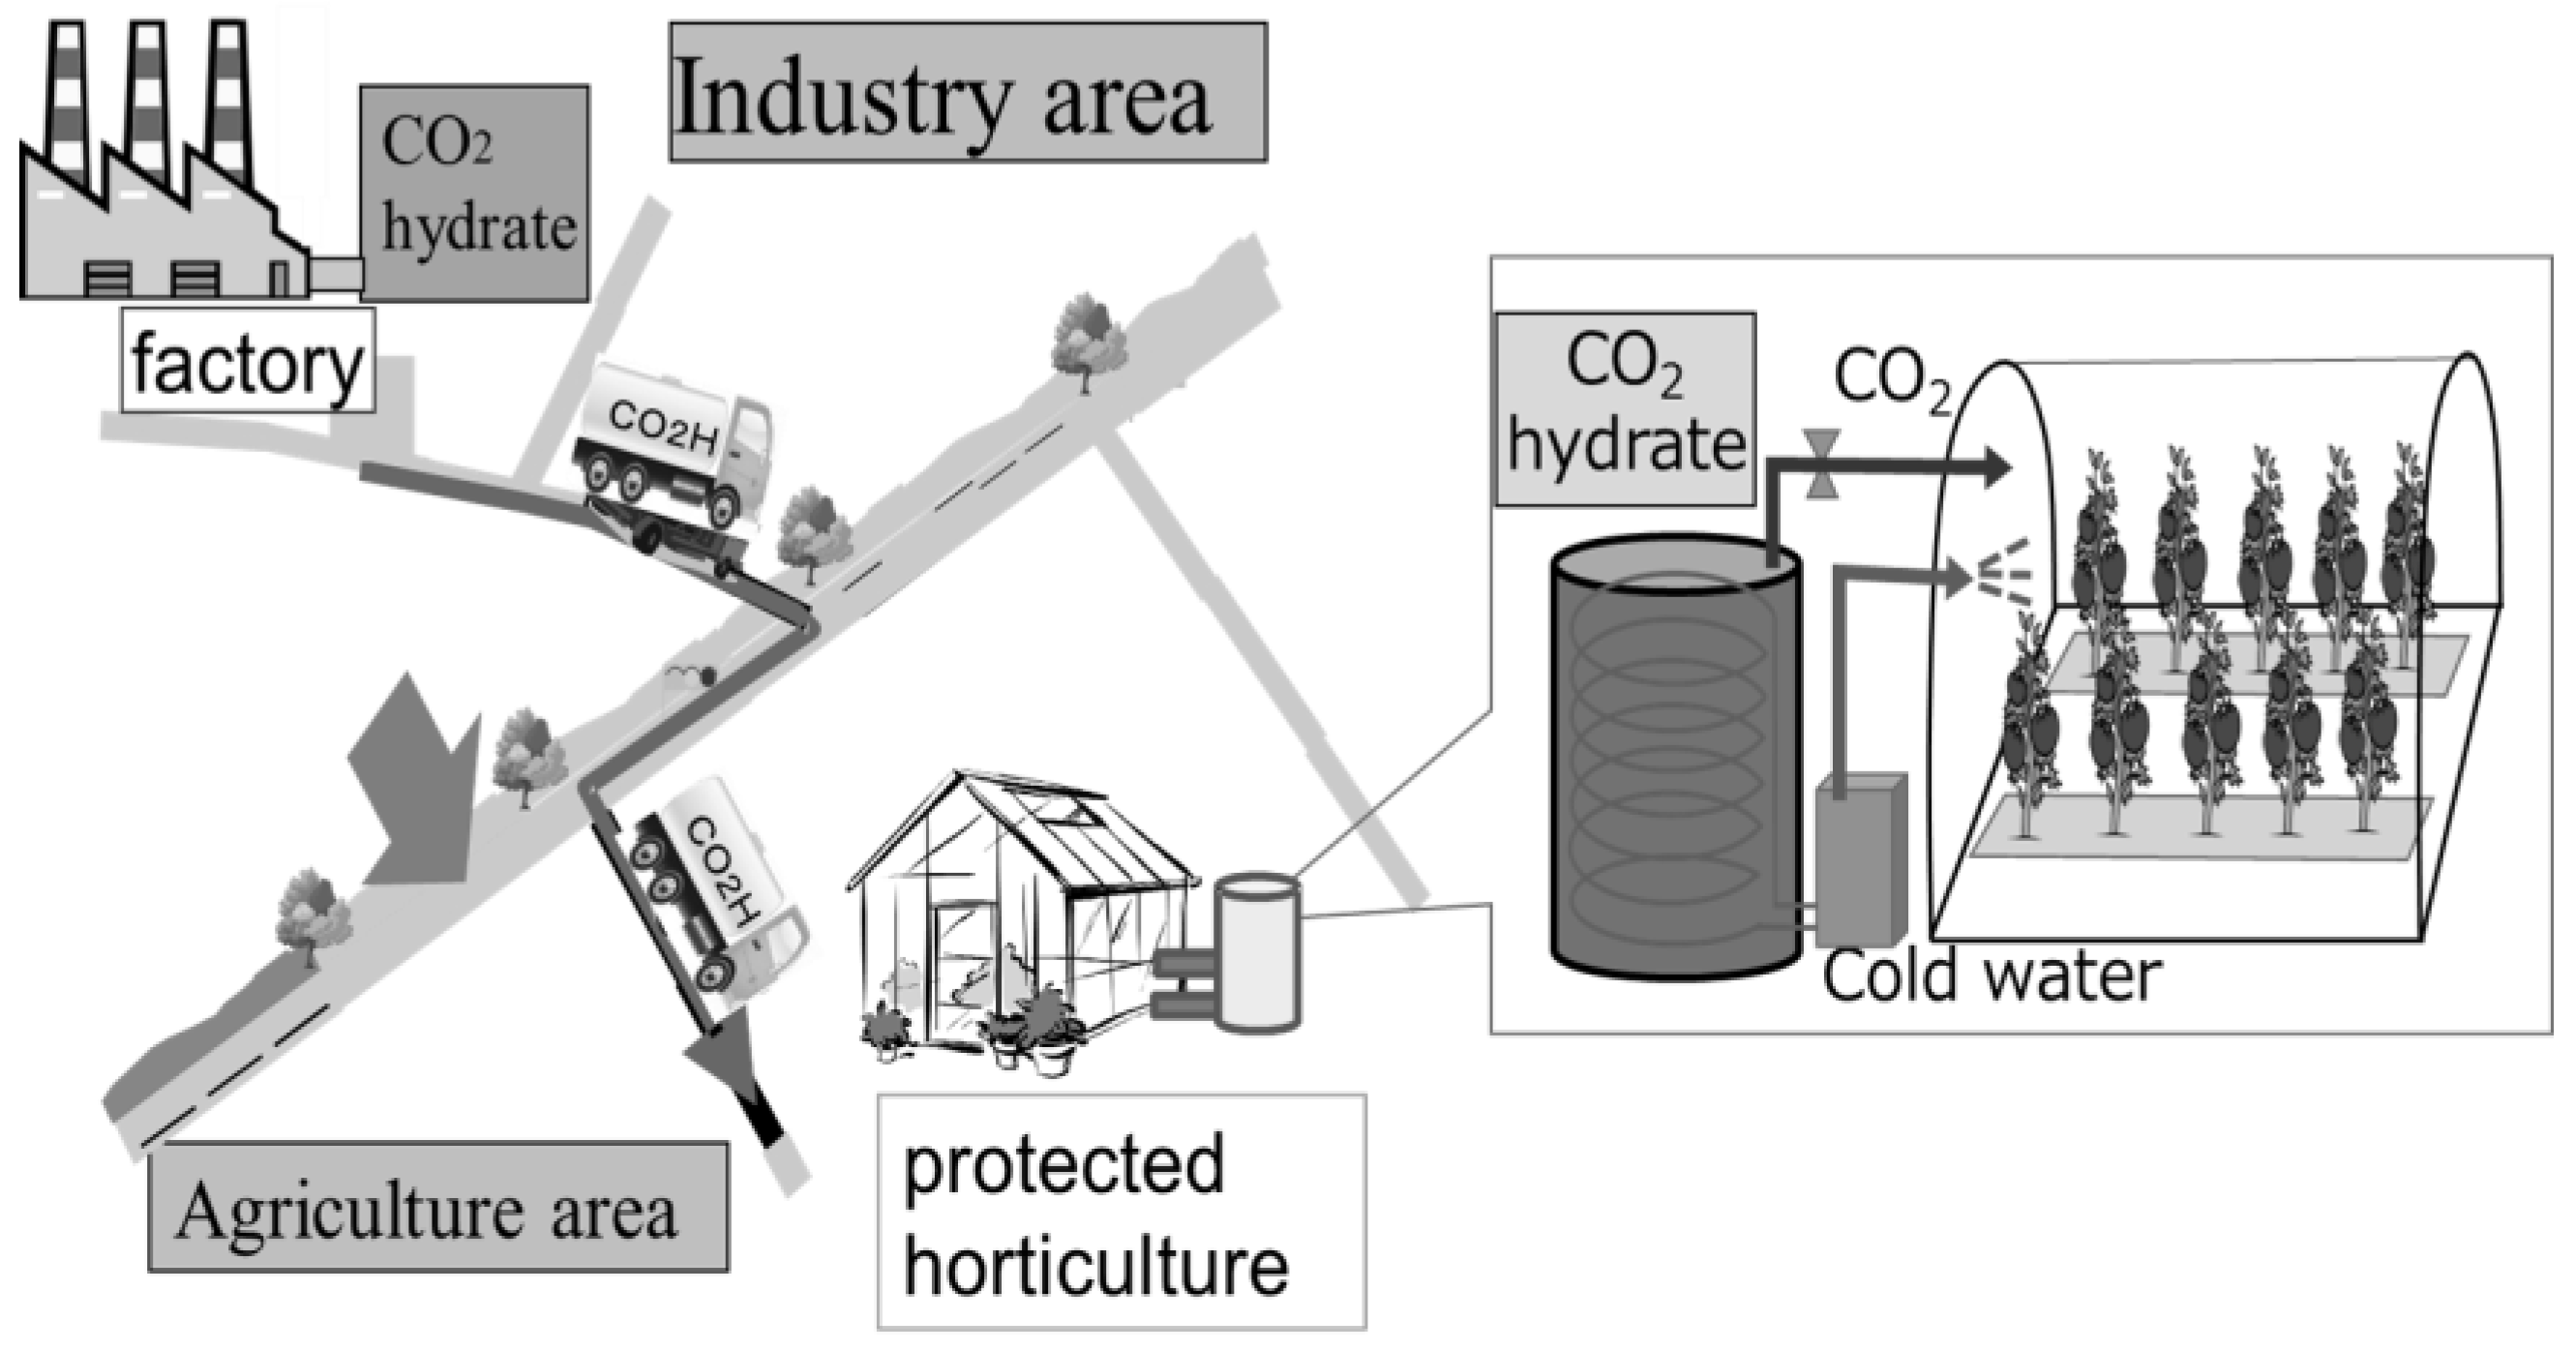
The climate changes caused by global warming has become a serious issue in recent years [1]. Thus, the reduction of CO2 emissions has become increasingly important. In this sense, solutions promoting industrial activity while reducing CO2 emissions are required. One effective way of selecting environmentally favorable CO2 sources for CO2 utilization is of importance [2], and we proposed an agro-industrial system [3] as is shown in Figure 1. In this system, industrial and agricultural areas are connected. The former releases CO2 and heat as a result of production processes, while the latter can make use of air-conditioning-derived heat and residual industrial heating for agricultural production. The main purpose of this study was to evaluate the effectiveness of the above system to quantitatively supply CO2 or CO2 hydrate from industrial to agricultural areas located within a distance of 50 km or less.
In this analysis, we focused on the utilization of hydrate transport technology in the agriculture field, especially facility horticulture. The supply of CO2 by hydrate has the merit that it can simultaneously supply cold heat necessary for cultivation. These simultaneous supplies can keep the CO2 concentration relatively high under suitable temperatures in greenhouses, so it is expected to increase the yield [4,5]. As an example of a city, more than 200 thousand tons of CO2 are discharged from one factory in a year. On the other hand, the CO2 necessary for photosynthesis is supplied by burning a boiler, and its supply amount is around 5–10 thousand tons a year in the agricultural field [1,4]. If CO2 is transported from industrial areas, it will be possible to reduce emissions of CO2 by the combustion of boilers in agricultural areas.
We calculated the energy consumption and cost for separating CO2 from an industrial exhaust gas stream via chemical absorption and transporting it to the agricultural area via boosting or hydration technologies. Several transportation methods, namely, truck, hydrate tank lorry, and pipeline, were considered. Finally, we compared the energy consumption and cost required for CO2 separation and transportation by these methods and subsequently evaluated the effectiveness of the proposed system connecting agricultural and industrial areas.
2. Outline of the CO2 Supply System from Industrial Areas
2.1. Outline of Some CO2 Supply Methods
We calculated the cost of the CO2 supply system involving the separation of CO2 from an industrial exhaust gas stream and the subsequent transportation of this CO2 from industrial to agricultural areas. In this calculation, the cost of the CO2 supply process was divided into transporting and collecting costs, and the collecting cost was further divided into separation and boosting costs. Table 1 shows some CO2 supply methods considered herein.
With regard to the pressurization and transportation of CO2, three cases were considered:
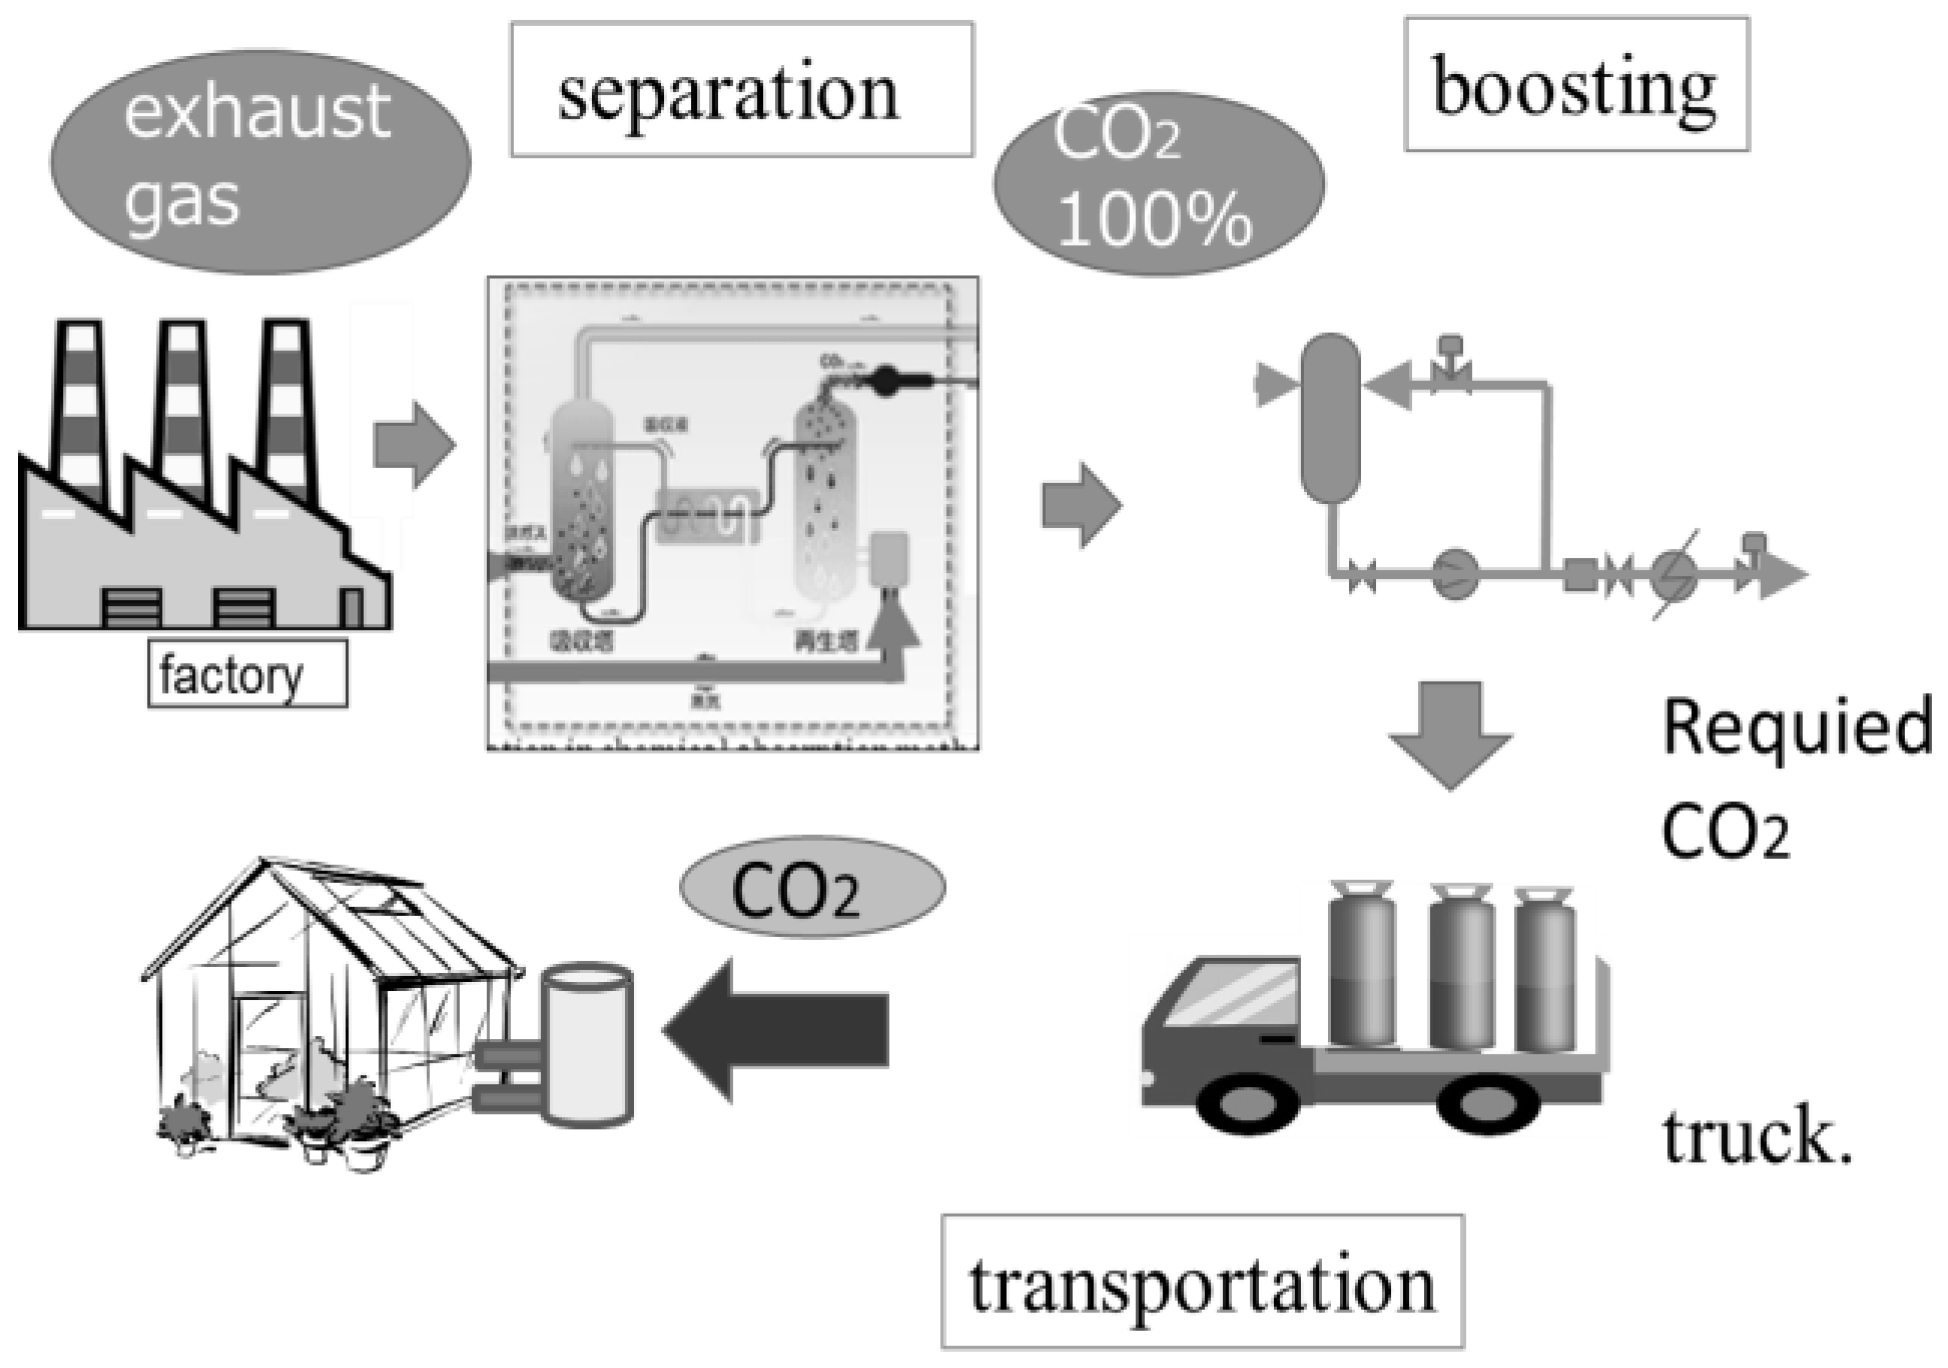
(1) Truck type
CO2 is separated from exhaust gas by chemical engineering, liquefied into the cylinder, and finally transported by truck.
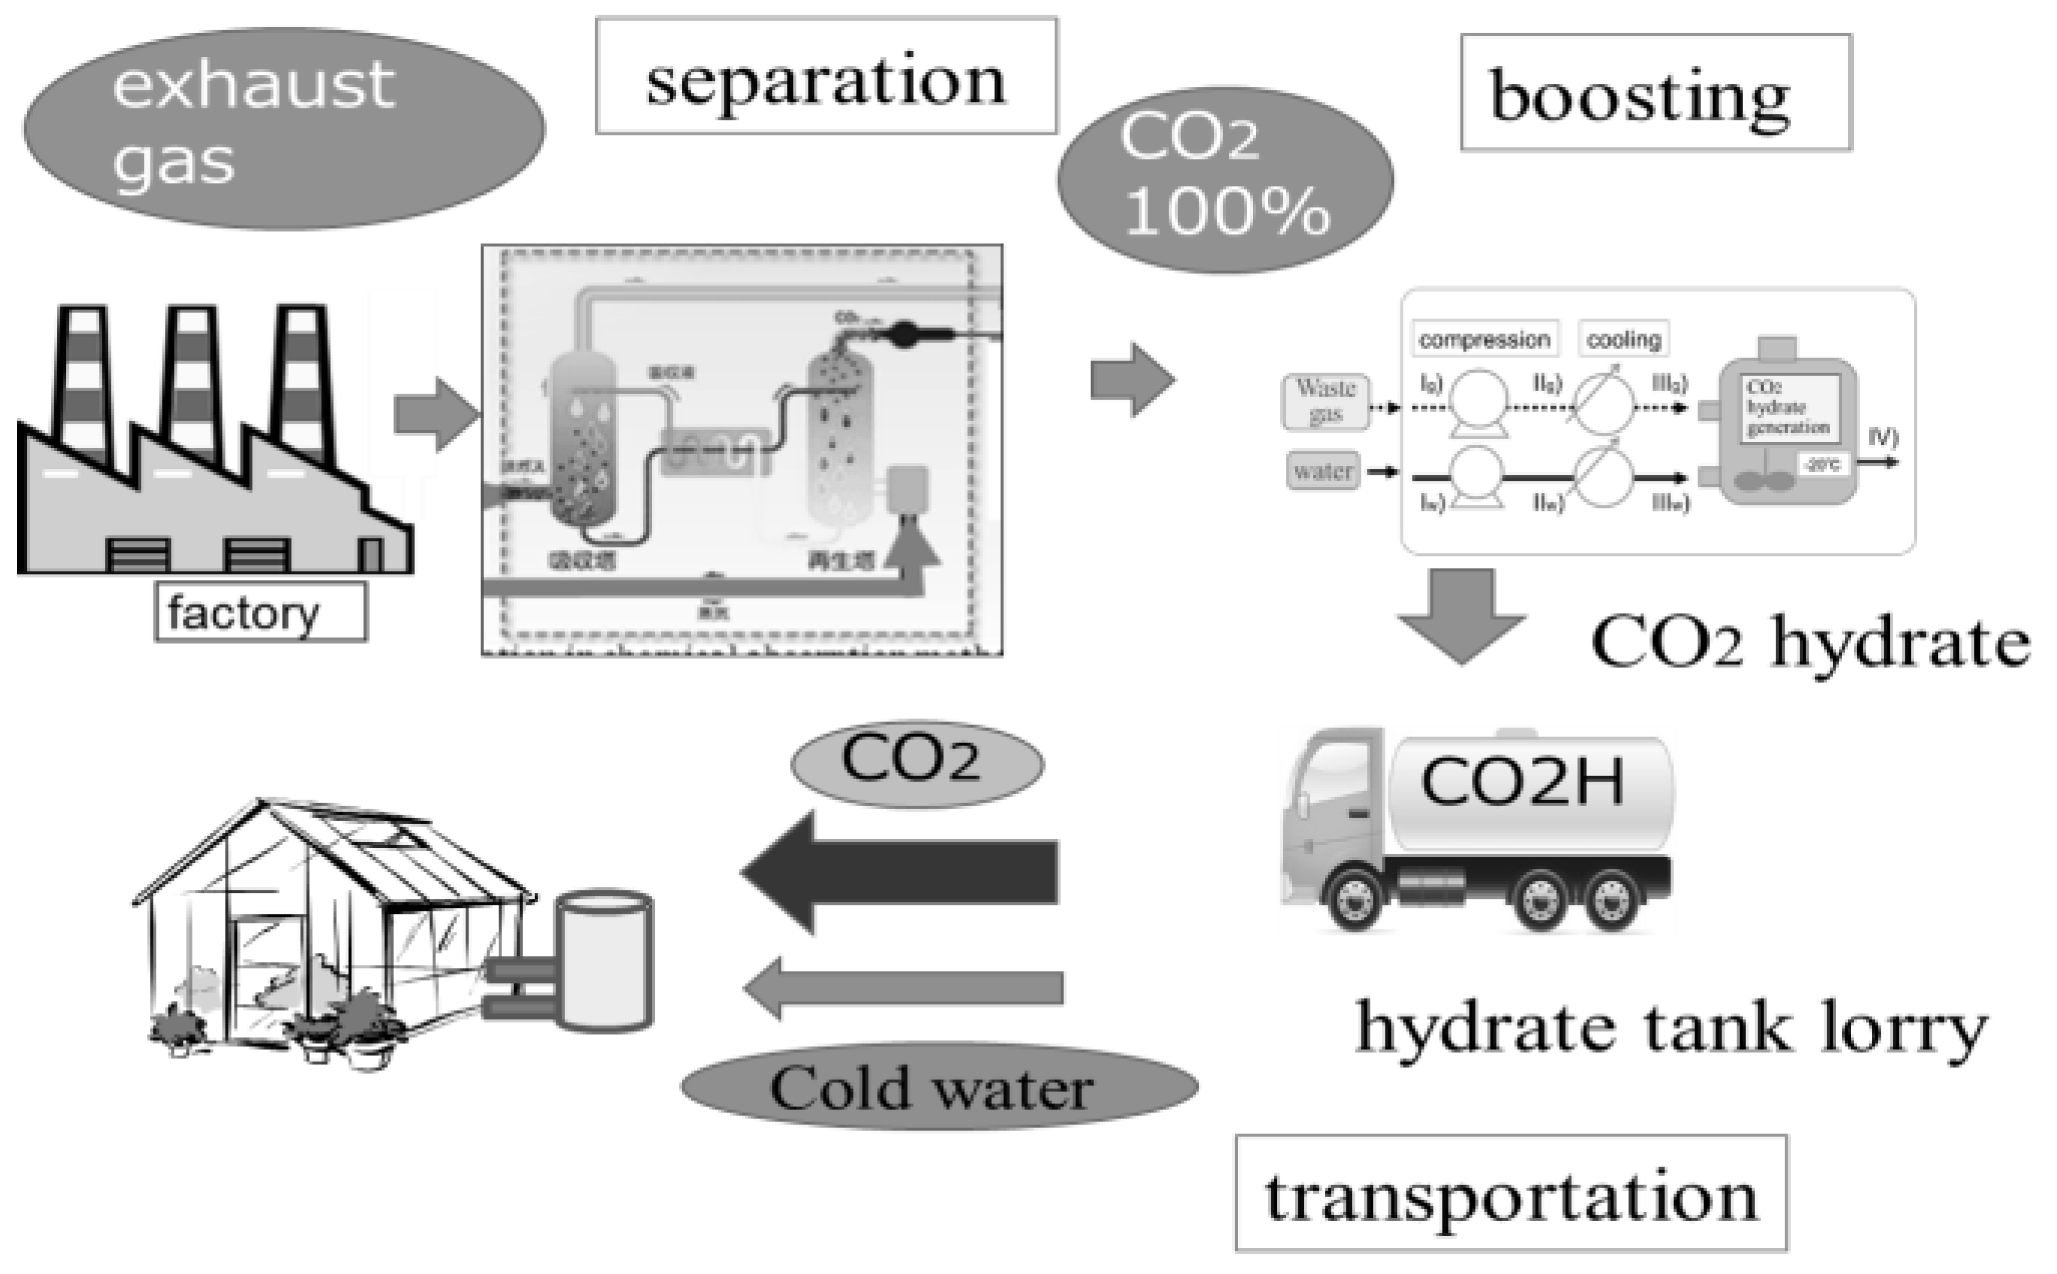
(2) CO2 hydrate type
CO2 is separated from exhaust gas by chemical engineering, hydrated, and finally transported by tank lorry.
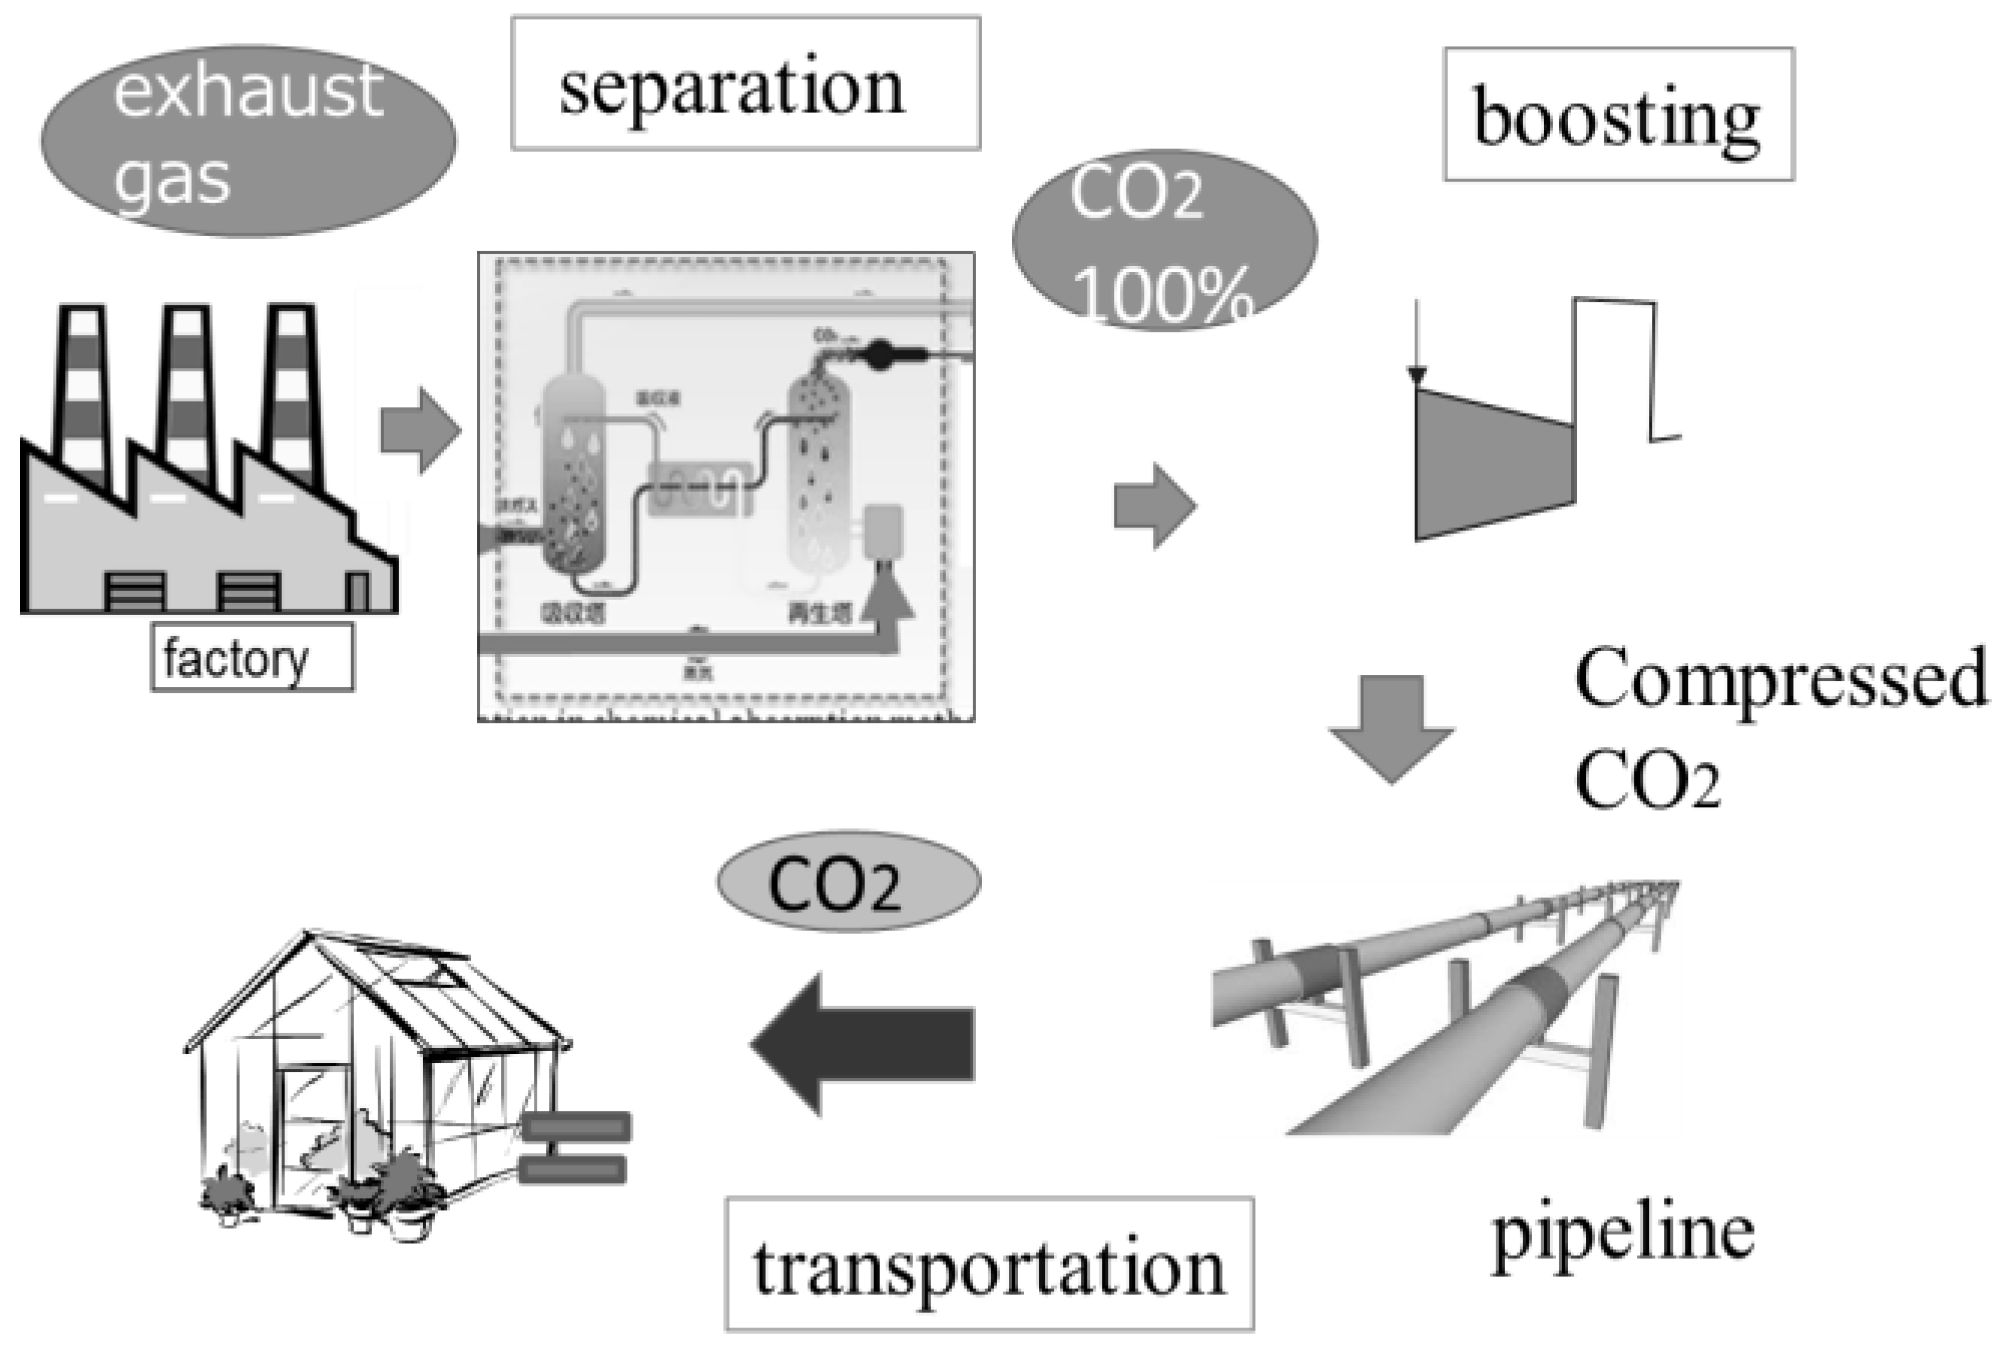
(3) Pipe line type
CO2 is separated from exhaust gas by chemical engineering, compressed to 3.5 MPa, and finally transported by pipeline.
2.2. Basic Principle of Various Applied Separation and Recovery Devices
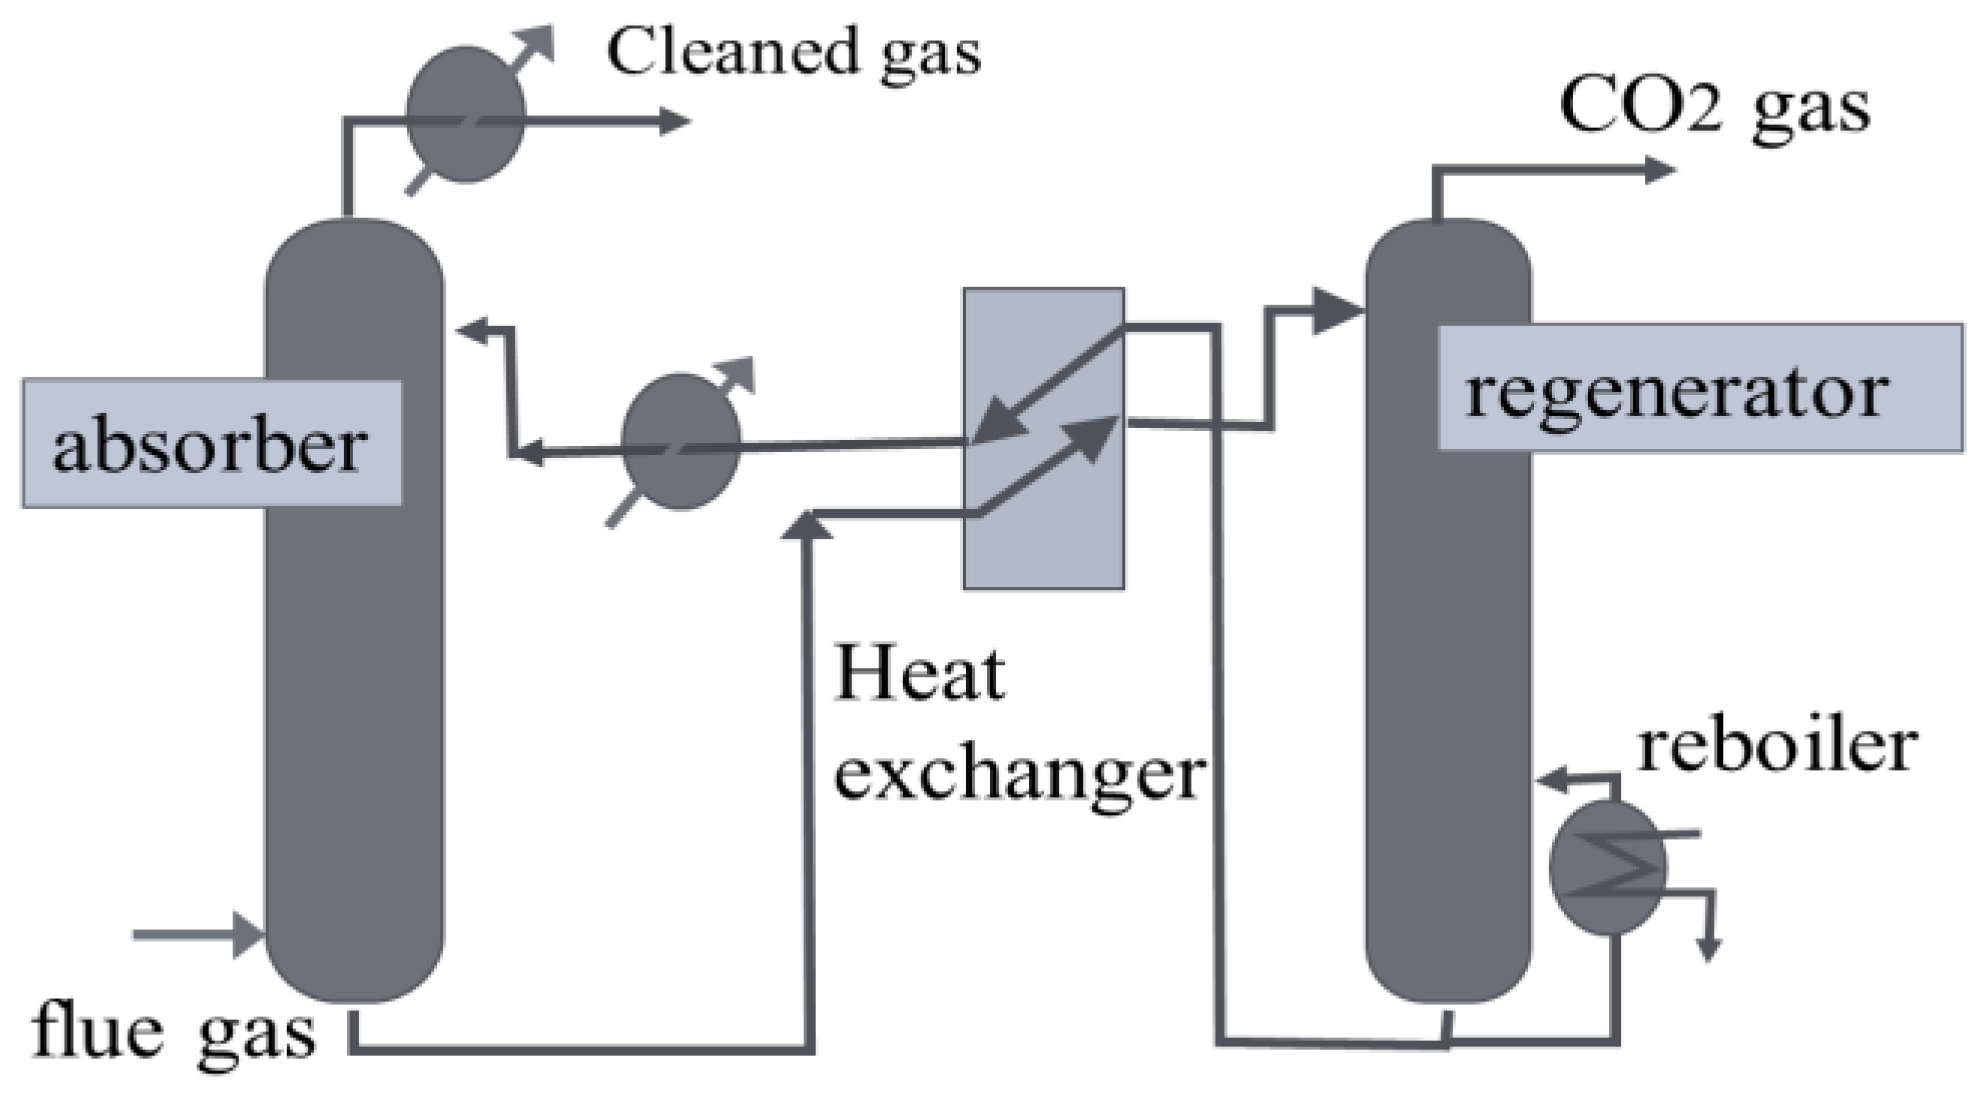
The CO2 separation method and the various compression methods considered herein are presented next. Figure 5 describes the principle of a standard amine-based CO2 absorption–desorption process [6]. The system was comprised of a simple absorber and desorber with a reboiler and a condenser, an amine/amine heat exchanger, pumps, and a cooler. The CO2 from an exhaust gas stream is absorbed in the absorption column containing the amine solvent. Once absorbed, the CO2-rich amine solution is pumped from the absorption column through the amine heat exchanger where it is heated before entering the stripper for regeneration.
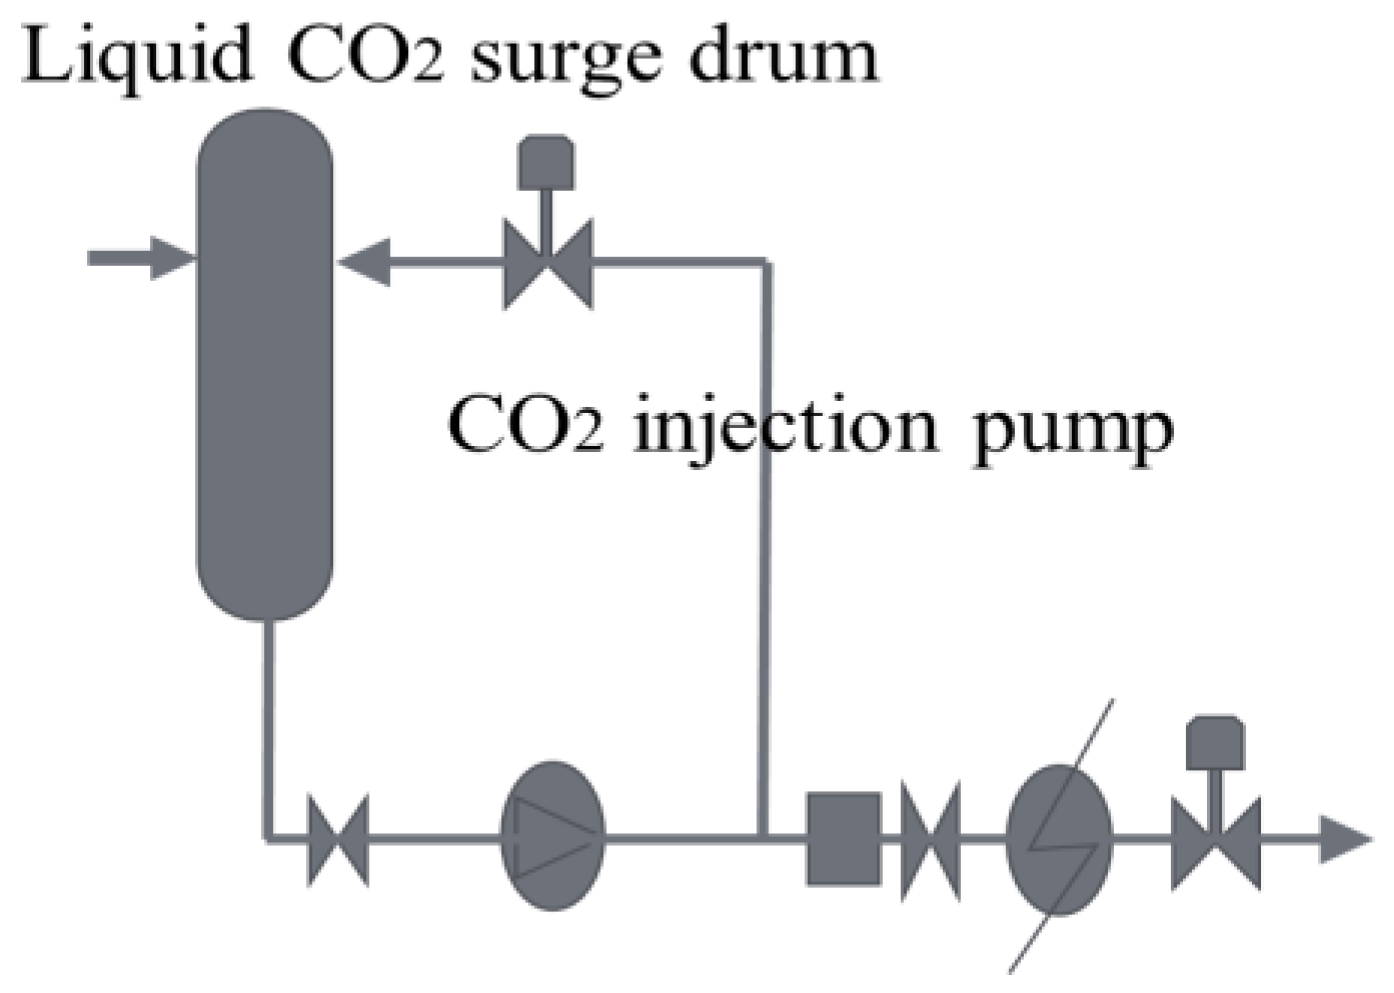
Figure 6 shows the liquefying system of CO2 [7], the CO2 was subsequently liquefied with a high-pressure pump. This system allows for a flexible operation depending on the supply while eliminating manual handling of large amounts of gases in cylinders. A self-contained storage vessel consisting of a low-temperature-grade carbon steel coded vessel and insulation and control systems equipped with approved class valves, piping, and fittings was considered.
So far, CO2 separation and capture from waste gas by means of CO2 hydrate has been proposed [8,9,10]. Figure 7 shows the CO2 hydrate production system [11]. This system was conducted in a stirring-vessel-type reactor at certain given conditions for hydrate formation. The pressure and temperature conditions for hydrate formation were set as operational variables for the energy consumption estimations. Herein, the base temperature and pressure were assumed to be 275 K and 2.0 MPa, respectively, and the hydrate formation rate depends on these conditions. The heat released during the formation of the hydrate was employed for pumping brine, while the cooling derived from the CO2 release was employed to recover the brine temperature.
3. Calculating the Cost of the CO2 Supply System
3.1. Calculating the Energy Consumption and Cost of the CO2 Collection System
The main conditions employed for calculating the cost of the collecting system are shown in Table 2. Here, CO2 collection efficiency and the collected rate of CO2 were based on the value of the literature of the chemical absorption method [6].
3.1.1. Energy and Cost of Separating CO2
Table 3 shows the cost and energy consumption of the main devices required for the operating chemical absorption method obtained from the literature [6]. With regard to the separation energy, we considered the power consumptions of main devices, such as the wash column, absorber, regenerator, reflux drum, heat exchange, booster fan, pomp, CO2 pomp, and CO2 compressor.
In the calculation of separation costs, capital (fixed) costs and operating (variable) costs were considered. Capital cost is the expense required to make the project commercially viable, and equipment costs and labor costs were considered in this analysis. The operating cost is the expenses related to the operation of equipment or equipment, in which we considered the electric power, the heat supplied, and the cooling water in this system. The total amount of electric power was calculated by considering the total power required for the separating equipment.
3.1.2. Boosting Energy and Cost of the Collected CO2
(1) Liquefaction and compression
The boosting energy (i.e., the energy produced upon increasing the pressure of the exhausted gas) can be derived from Equation (1) under the assumption of an ideal gas adiabatically compressed [12].
Here, Cv denotes the specific heat at a constant volume of CO2, T is the absolute temperature before compression, p is the pressure before compression, p’ is the pressure after compression, and γ is the fraction of specific heat of CO2 in the exhausted gas.
The boosting cost of the liquefying facility requiring the pressurization of CO2 is defined by Equation (2) obtained from the literature [7].
(2) Hydration
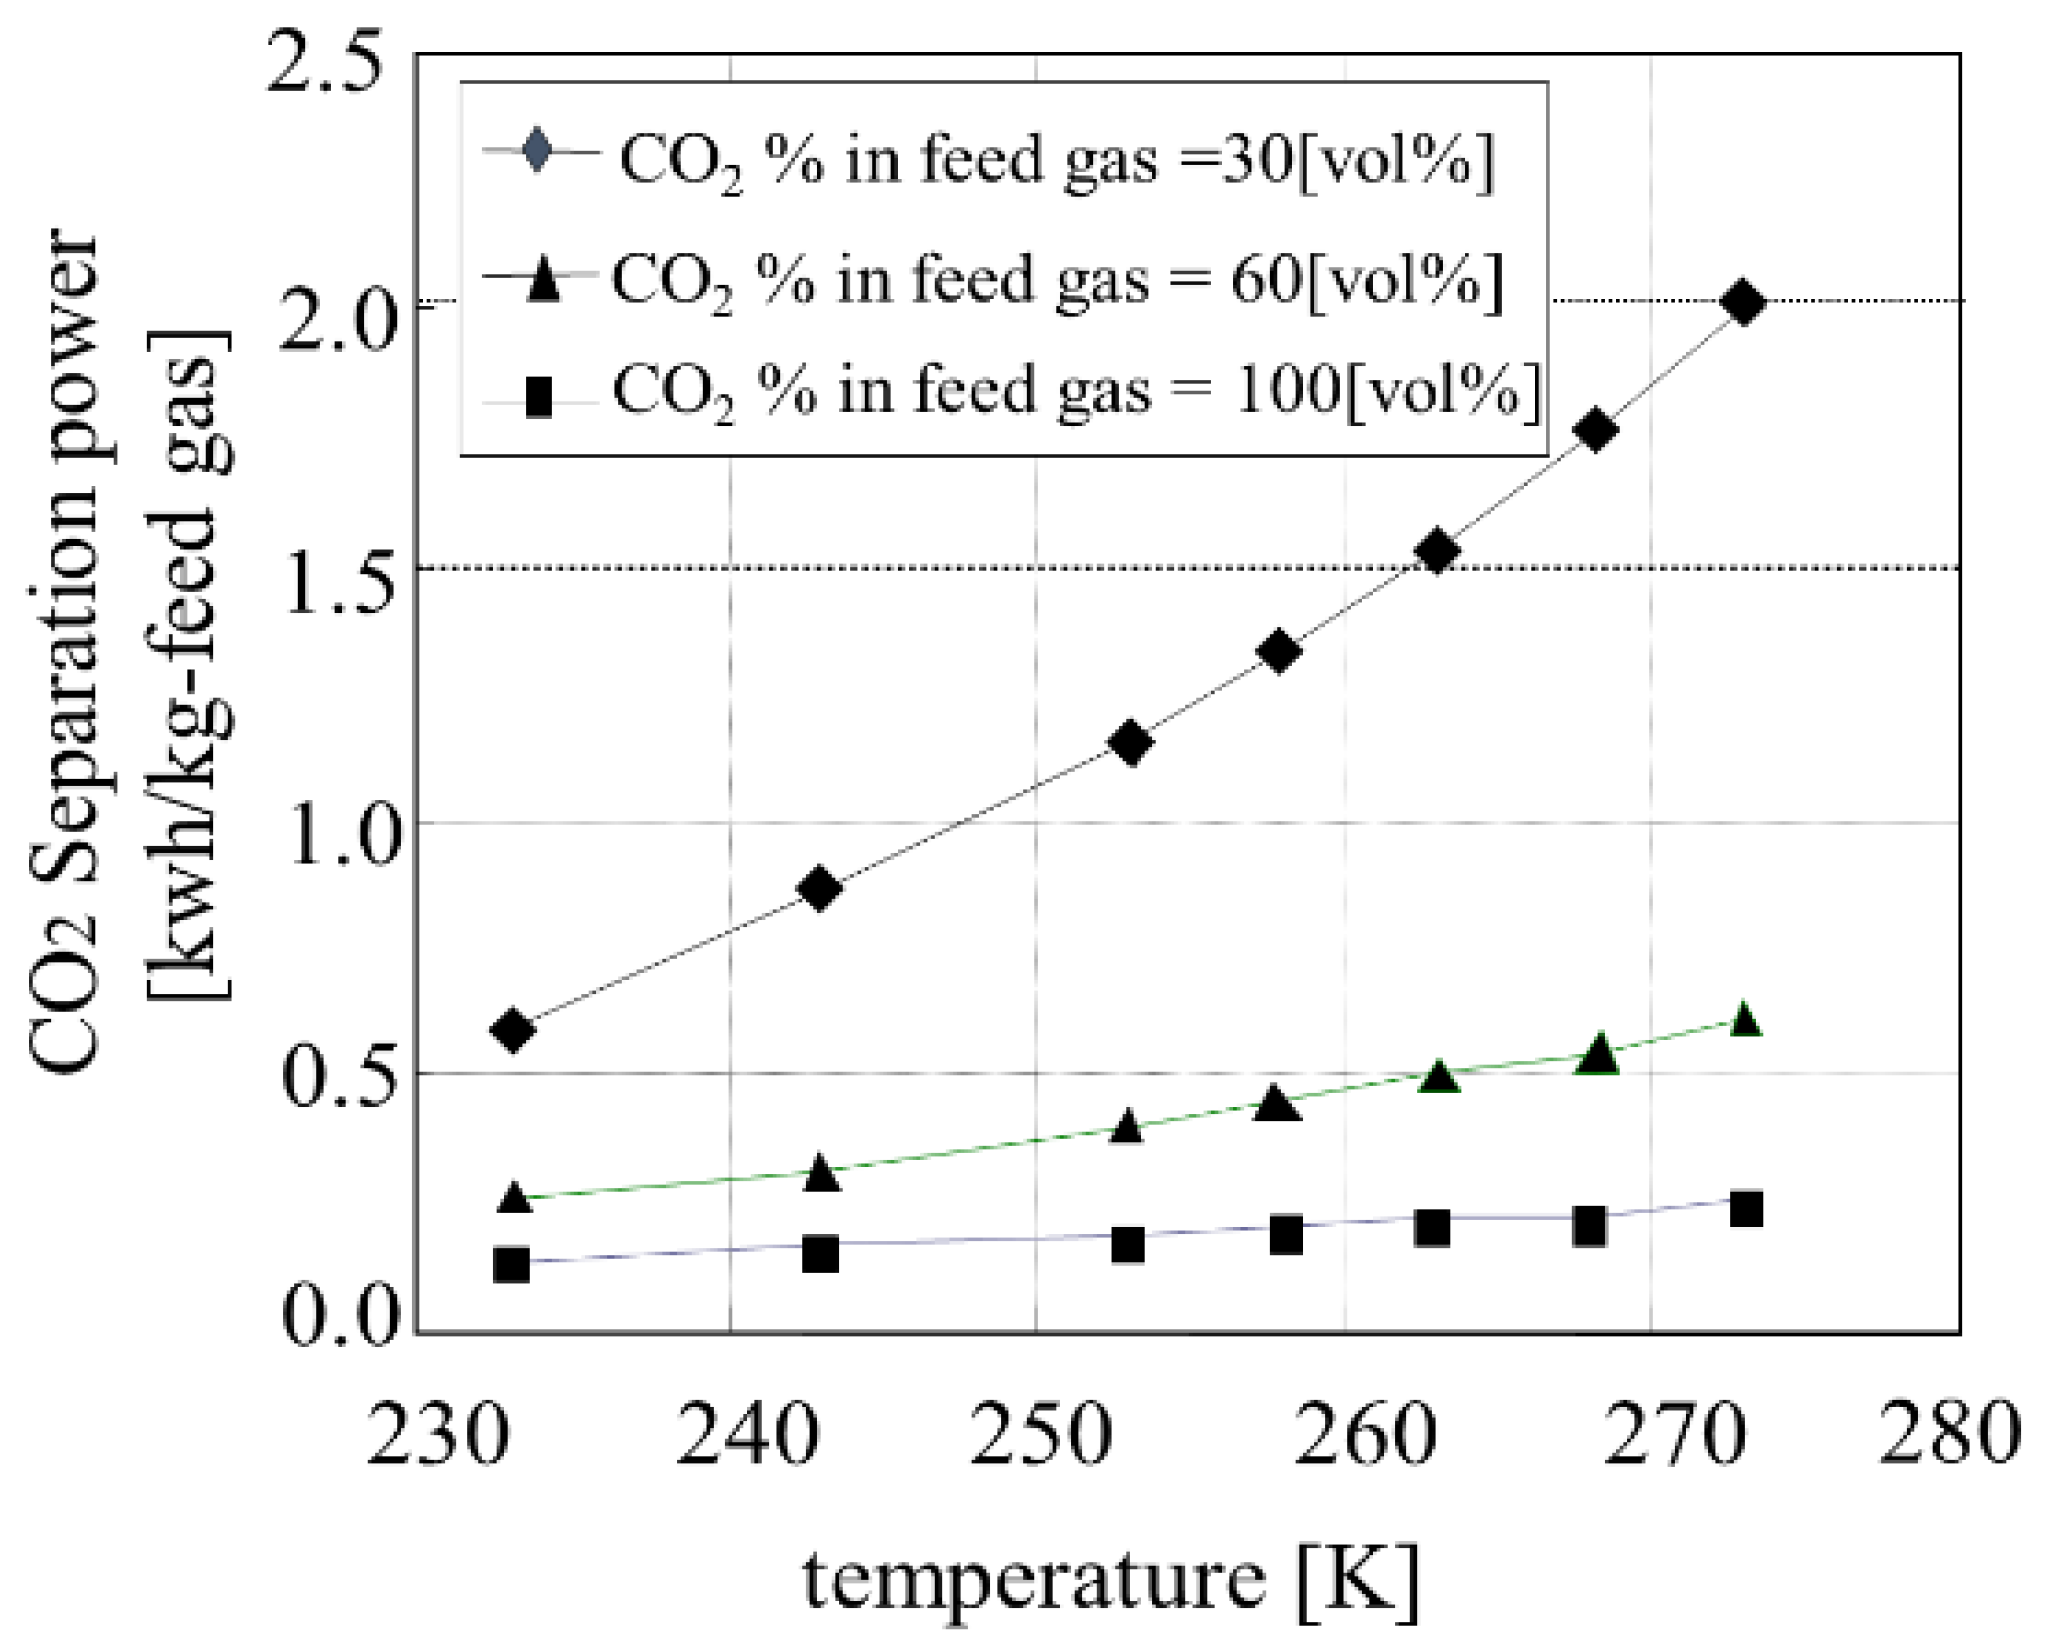
With regard to the energy consumed in the hydrate method, the hydrating energy was obtained from the relationship between the hydrate formation energy and the temperature at various concentrations of exhaust gas (Figure 8), as previously reported in the literature [10]. As shown in Figure 8, the energy required for generating the hydrate greatly depended on the concentration of the exhaust gas. When directly generating the hydrate from the exhaust gas, the energy required was significantly large (1.6 kWh/kg-CO2) owing to the low concentration of the exhaust gas (20%).
The formation of hydrates is a stochastic process and a subcooling is needed for hydrate formation in general. For this reason, a variety of studies on hydrate promoters has been performed to reduce the equilibrium pressure. In addition, CO2 hydrate formation using supercooled aqueous nanodroplets [13] and using others such as ice at temperatures just below 273 K [14] or ice melting water [15] may also be a potential candidate for rapid CO2 hydrate growth. Either way, it will be possible to reduce the energy consumed in the hydrate method.
With regard to the cost in the hydrate method, we considered the power consumptions of main devices, such as the reactor, agitator, cooling system, gas compressor, heat exchange, pomp, CO2 pomp, and hydrate tube. The costs of the main equipment were determined from a literature value based on the material and pressure condition of the equipment [3]. Labor costs were determined according to the calculation by the chemical absorption method in Table 3.
3.2. Calculating the Cost for Transporting CO2
3.2.1. Calculation of the Load Capacity
(1) Cylinder truck case
The CO2 loading capacity of the cylinder truck was calculated at the conditions summarized in Table 4. The capacity was calculated from Equation (3), where the cylinder capacity for CO2 was calculated according to Equation (4).
According to these equations, the CO2 loading capacity per tank truck was calculated to be 3846 kg.
(2) Transportation of CO2 hydrate case
The load capacity of the hydrate tank lorry was calculated with Equation (5). The container capacity was defined as the volume of the container multiplied by the density of the content. By using these equations, the loading capacity for transporting CO2 hydrates was calculated. In this calculation, the same conditions (i.e., capacity, weight, and volume of the container) as the cylinder transportation case were used. The density of CO2 hydrate was assumed to be 1.105 g/cm3 [16]. The CO2 loading capacity when a hydrate tank truck was used for transportation was calculated at the conditions summarized in Table 5. According to these conditions, the CO2 loading capacity of CO2 was calculated to be 2193 kg.
Furthermore, we calculated the cooling heat of CO2 hydrate. In this calculation, three types of heat were considered: latent heat generated upon CO2 hydrate collapse into CO2 gas and water, water generated when the CO2 hydrate collapsed, and sensible heat increasing the temperature of the CO2 hydrate increase from 5 (i.e., formulation temperature of CO2 hydrate) to 25 °C (normal temperature). Subsequently, the amount of cooling heat supplied by CO2 hydrate was calculated with Equation (7) at the conditions summarized in Table 6. According to Equation (7), the CO2 loading capacity per tank truck was calculated to be 2,288 (MJ).
3.2.2. Calculating the Transportation Cost
The transportation cost in the case of a cylinder truck or a CO2 hydrate tank lorry was calculated with Equation (8) assuming that the cost per unit of transport volume was proportional to the transport distance.
Here, it was assumed that the gas was filled in a container similar to a 47 L gas cylinder. The loading amount was defined as the maximum weight of CO2 that a vehicle can transport with a 10 t cylinder. Additionally, in the case of CO2 hydrate transportation, the amount of CO2 loaded was calculated by considering the weight fraction of CO2 in the CO2 hydrate based on the number of CO2 and H2O molecules of this compound. We considered a light oil price of 108 yen/L, a fuel consumption of 3 L/km, a labor expense of 64 yen/km, a maintenance cost (e.g., insurance and tax) of 305,800 yen/number of truck/year, a truck price of 10,000,000 yen, a recovery period of 10 years, an annual mileage of 10,000 km/year, a cylinder capacity of 47 L, and a cylinder weight of 52 kg.
Furthermore, the CO2 emissions associated with the transportation by vehicles were calculated as shown in Equation (9).
3.3. Calculating the Cost in the Case of a Pipeline System
When using a pipeline system, the annual transport cost was assumed to be proportional to the transport distance and constant with respect to the transportation volume (i.e., the cost per unit of transport volume was inversely proportional to the annual volume transported). Therefore, the cost was calculated with Equation (10) using a reference value for the transportation cost corresponding to an annual CO2 transport volume of 200,000 t [17].
4. Results and Discussion
4.1. Cost of the CO2 Collecting System (Separation and Boosting Costs)
Table 7 and Table 8 display the separation and boosting energies required for each method. The separation energy for the chemical absorption method was 0.39 kWh/kg-CO2. The thermal energy cost required to separate CO2 from the amine solution was high. With regard to the CO2 separation system, a chemical absorption method involving an exhaust gas stream was considered. When using this system, we suggest that it is indispensable to reduce this thermal energy by using the exhaust heat. On the other hand, the CO2 liquefying cost was considered to be 0.12 yen/kg-CO2, according to previous reports. In the calculation of the hydrate method, the hydrate was generated from a pure CO2 gas stream recovered by the chemical absorption method. The hydrate generation cost was relatively high value at this setting condition.
4.2. Cost of the CO2 Transportation System
Table 9 shows the transportation results (i.e., the relation between the CO2 loading capacity and the transportation cost). In particular, this table shows the amount of CO2 emissions associated with the transportation process. The liquefied CO2 loading capacity was large, and this method was therefore promising. Additionally, this CO2 liquefaction system showed the lowest transportation costs among the methods studied herein. On the other hand, the transportation costs for compressed air (i.e., pipeline transportation) were large, although these values depended on the amount of CO2 transported.
4.3. Total Cost of the CO2 Supply System
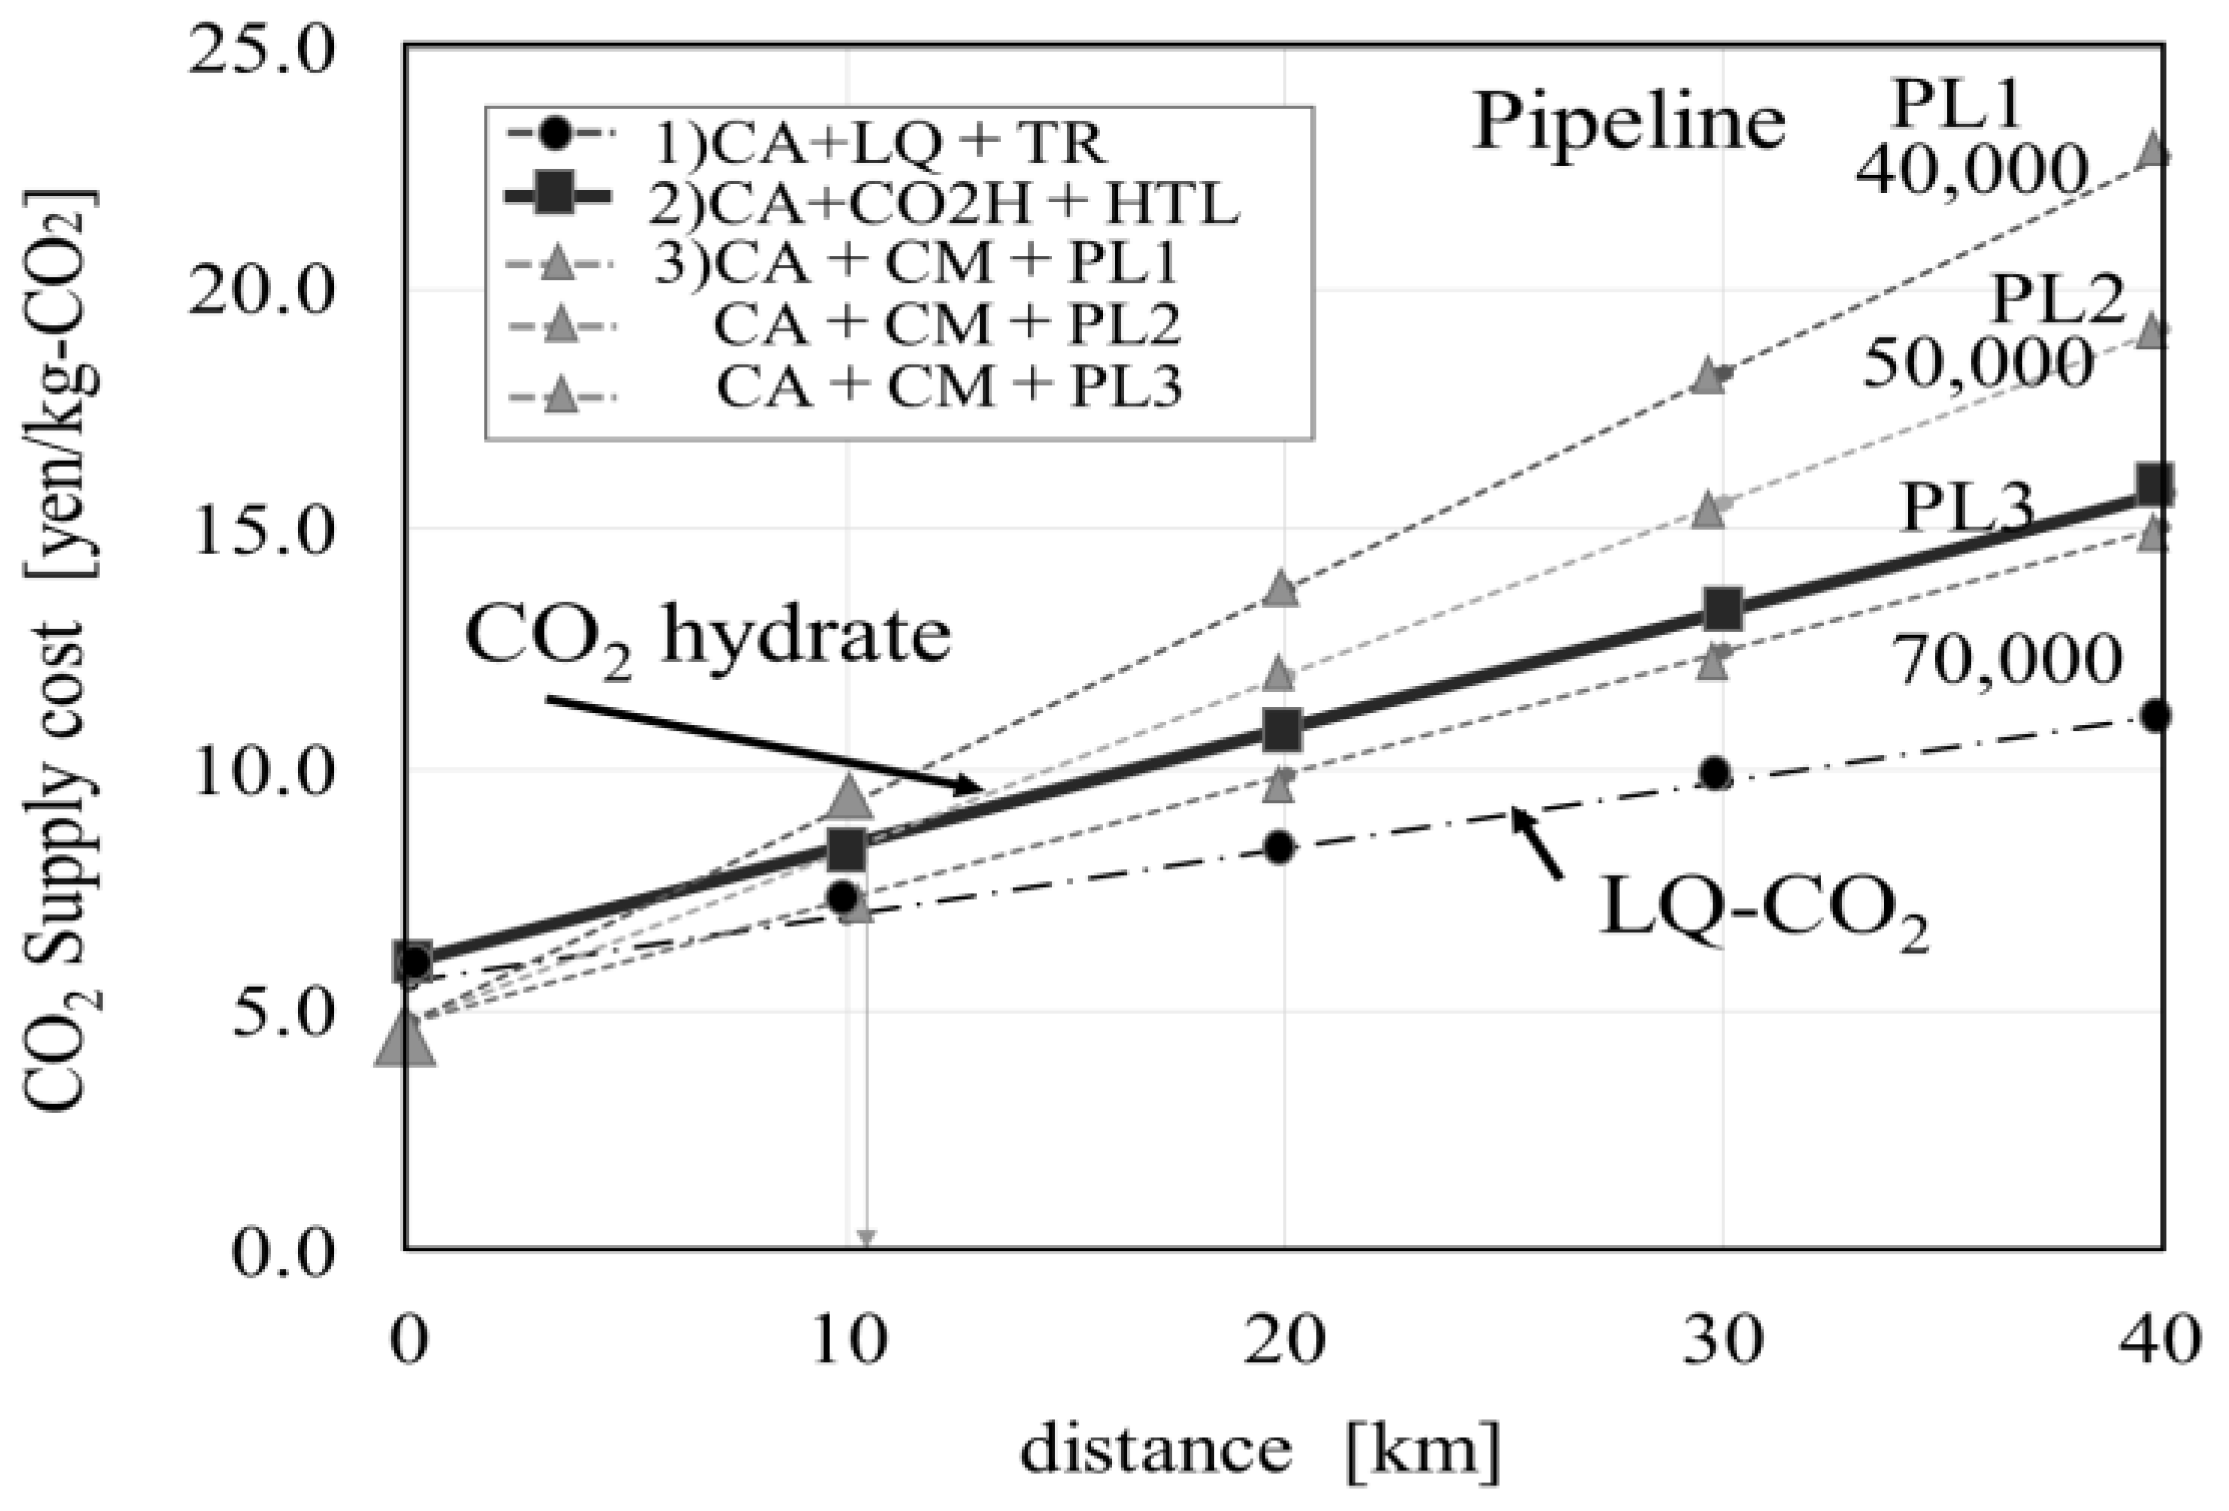
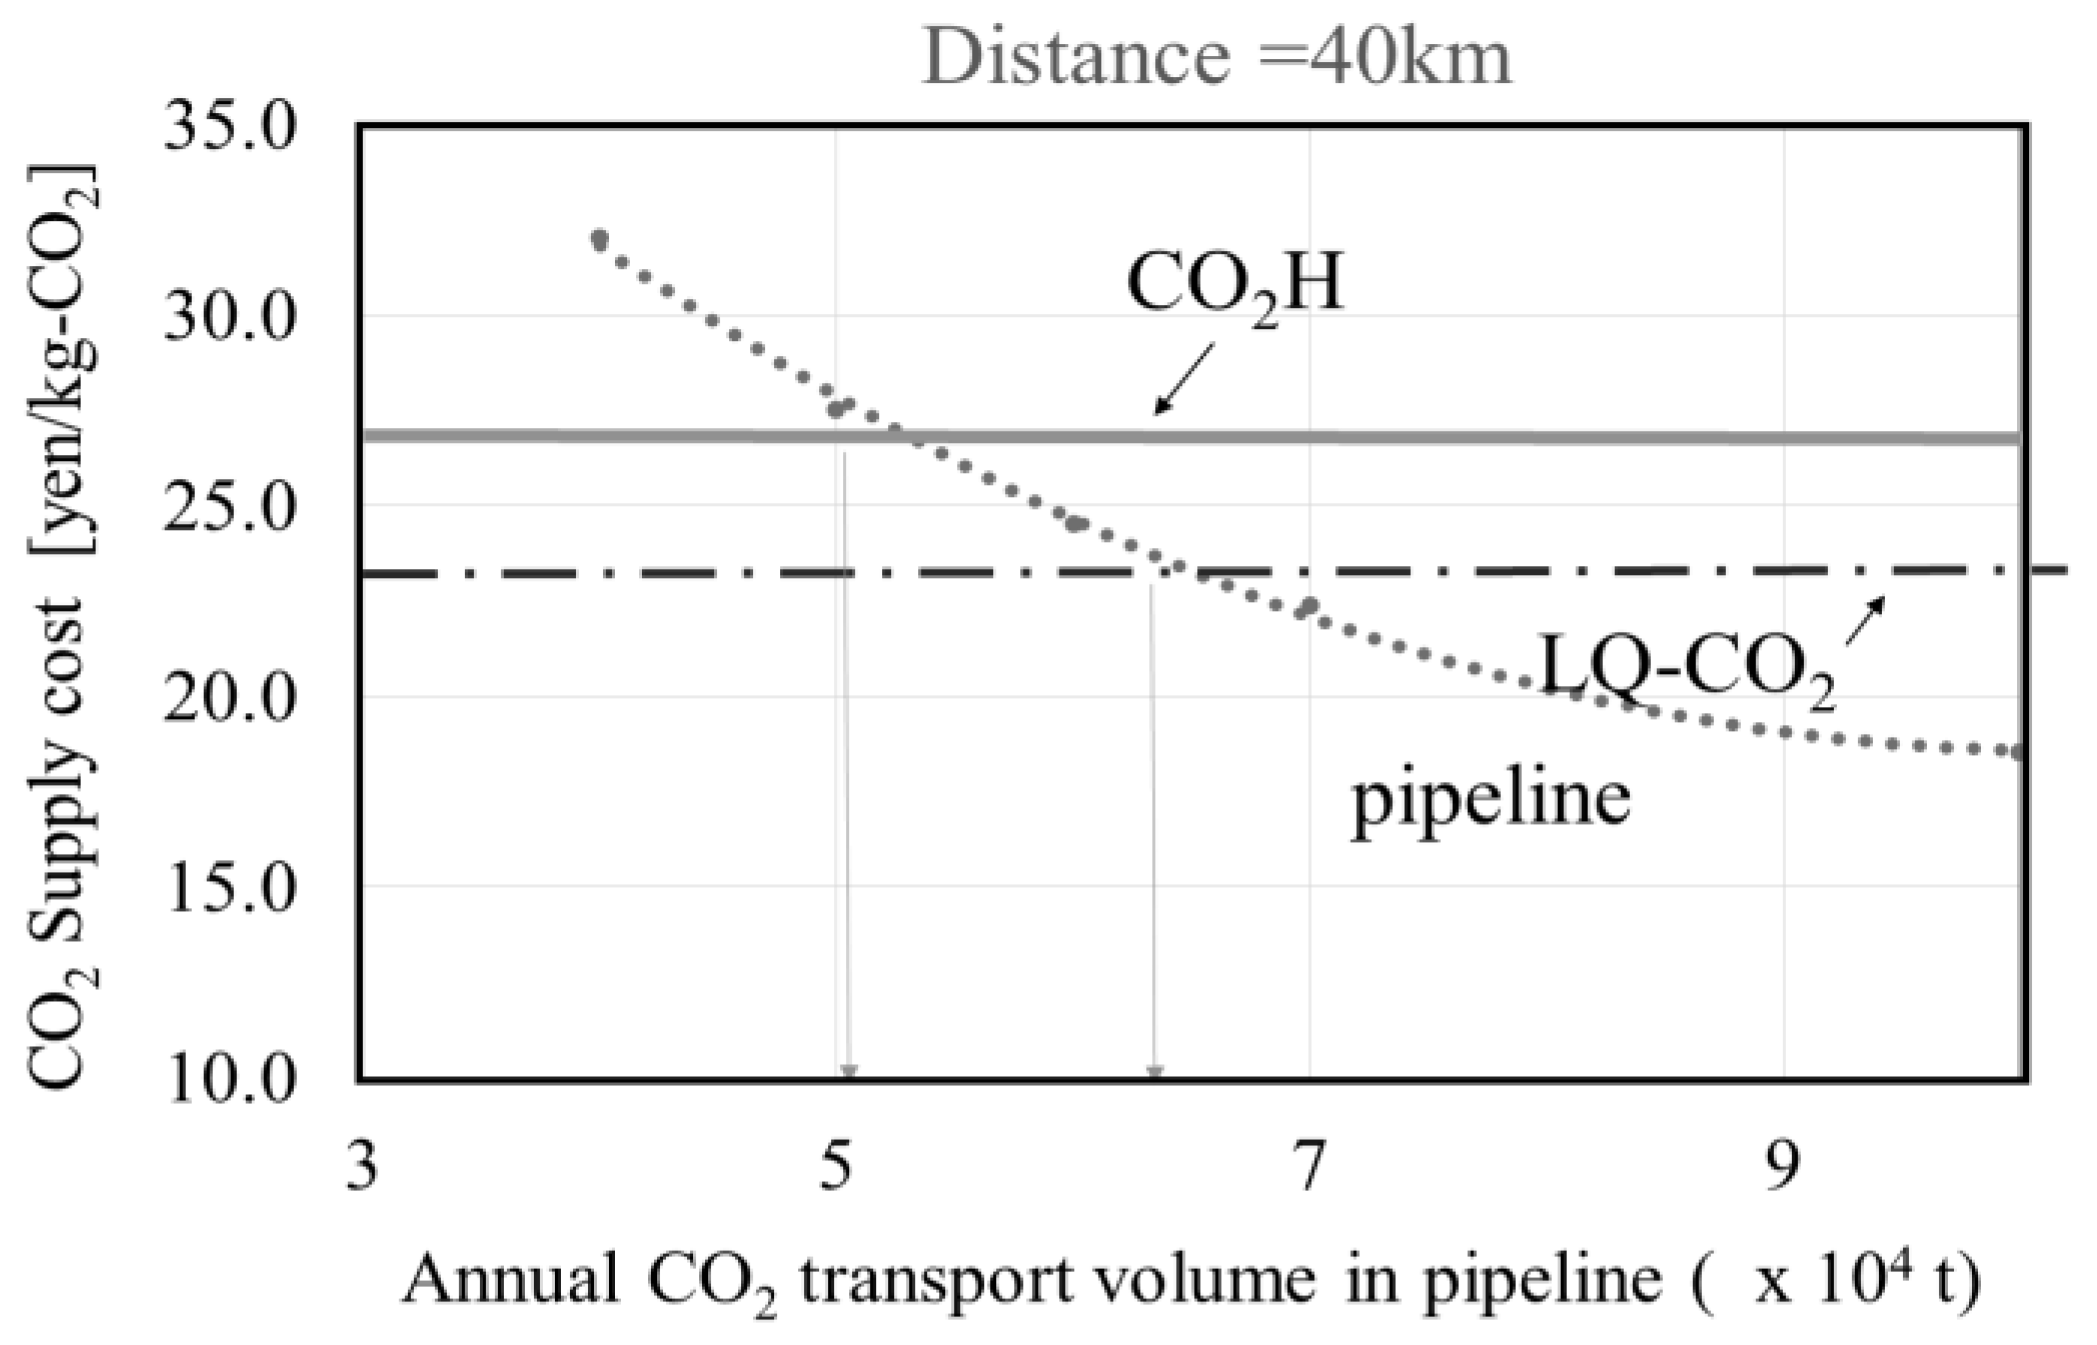
Figure 9 shows the relation between the total cost of the CO2 supply system and the transported distance of CO2 for each method. As can be seen, these costs, including transportation, ranged from 15 to 25 yen/kg-CO2 for a transportation distance of 40 km or less. The supply cost per unit of CO2 of the pipeline transportation mode increased while the annual transport volume decreased. Figure 10 shows the relation between the total cost of the CO2 supply system and the annual CO2 transport volume in pipeline in the case of the distance at 40 km. According to this figure, the pipeline transportation cost at an annual CO2 transport volume of 52,000 t was comparable to those obtained by the transportation of a cylinder truck or of a CO2 hydrate tank truck. Additionally, the pipeline transportation cost at an annual CO2 transport volume of about 70,000 t was significantly larger as compared to other transportation methods in this condition.
In this system, storage temperature of CO2 hydrate in the container was assumed to be −20 °C under atmospheric pressure. Taking into account results of earlier studies on dissociation rates of CO2 hydrate and CH4 hydrate [18,19], CO2 hydrate can be easily stored without its dissociation during the transportation process for several hours or up to a day. The potential of a natural gas hydrate pellet for long-term transportation of natural gas by means of gas hydrate has also been reported [20]. Further assessment will be required to compare the economic benefits of using pellet technology for CO2 transportation.
4.4. Examining the Usefulness of the Supply of Cold via CO2 Hydrate Transportation
In ordinary greenhouse cultivation, it is impossible to fertilize CO2 because the cultivation house has to be ventilated in the daytime to prevent temperature from increasing inside. Since cold heat and CO2 are simultaneously supplied, the utilization of CO2 hydrates is expected to maintain an optimum temperature while fertilizing in the summer and without ventilating the greenhouse. Therefore, the possibility of CO2 fertilization via CO2 hydrate supply was evaluated by analyzing the cooling capacity of the CO2 hydrates according to Equation (11). Generally, cold heat is also generated when CO2 is supplied in a liquefied CO2 cylinder. However, in view of the CO2 supply rate and difficulty in taking out, this cold heat is not normally used at present. On the other hand, CO2 hydrate can supply CO2 and cold heat at the same time when hydrate is decomposed.
With regard to the amount of CO2 fertilizer required, tomato cultivation was considered and the value was obtained from the literature [4]. The cold heat supplied by the CO2 hydrates was calculated as the sum of the latent heat produced by CO2 hydrate decomposition, the amount of water generated by decomposition, and the sensible heat equivalent to 20 °C. The temperature of the CO2 gas must increase from 5 to 25 °C for CO2 hydrate formation. At this time, the cooling capacity was 12 W/m2.
The solar radiation is strong during summer days. Since the solar heat flux was 1200 W/m2 or less, and the cooling capacity of the air conditioner was 200 W/m2 or less in this season, the cold heat supplied by the CO2 hydrates seemed to be insufficient for the cooling capacity of the greenhouse.
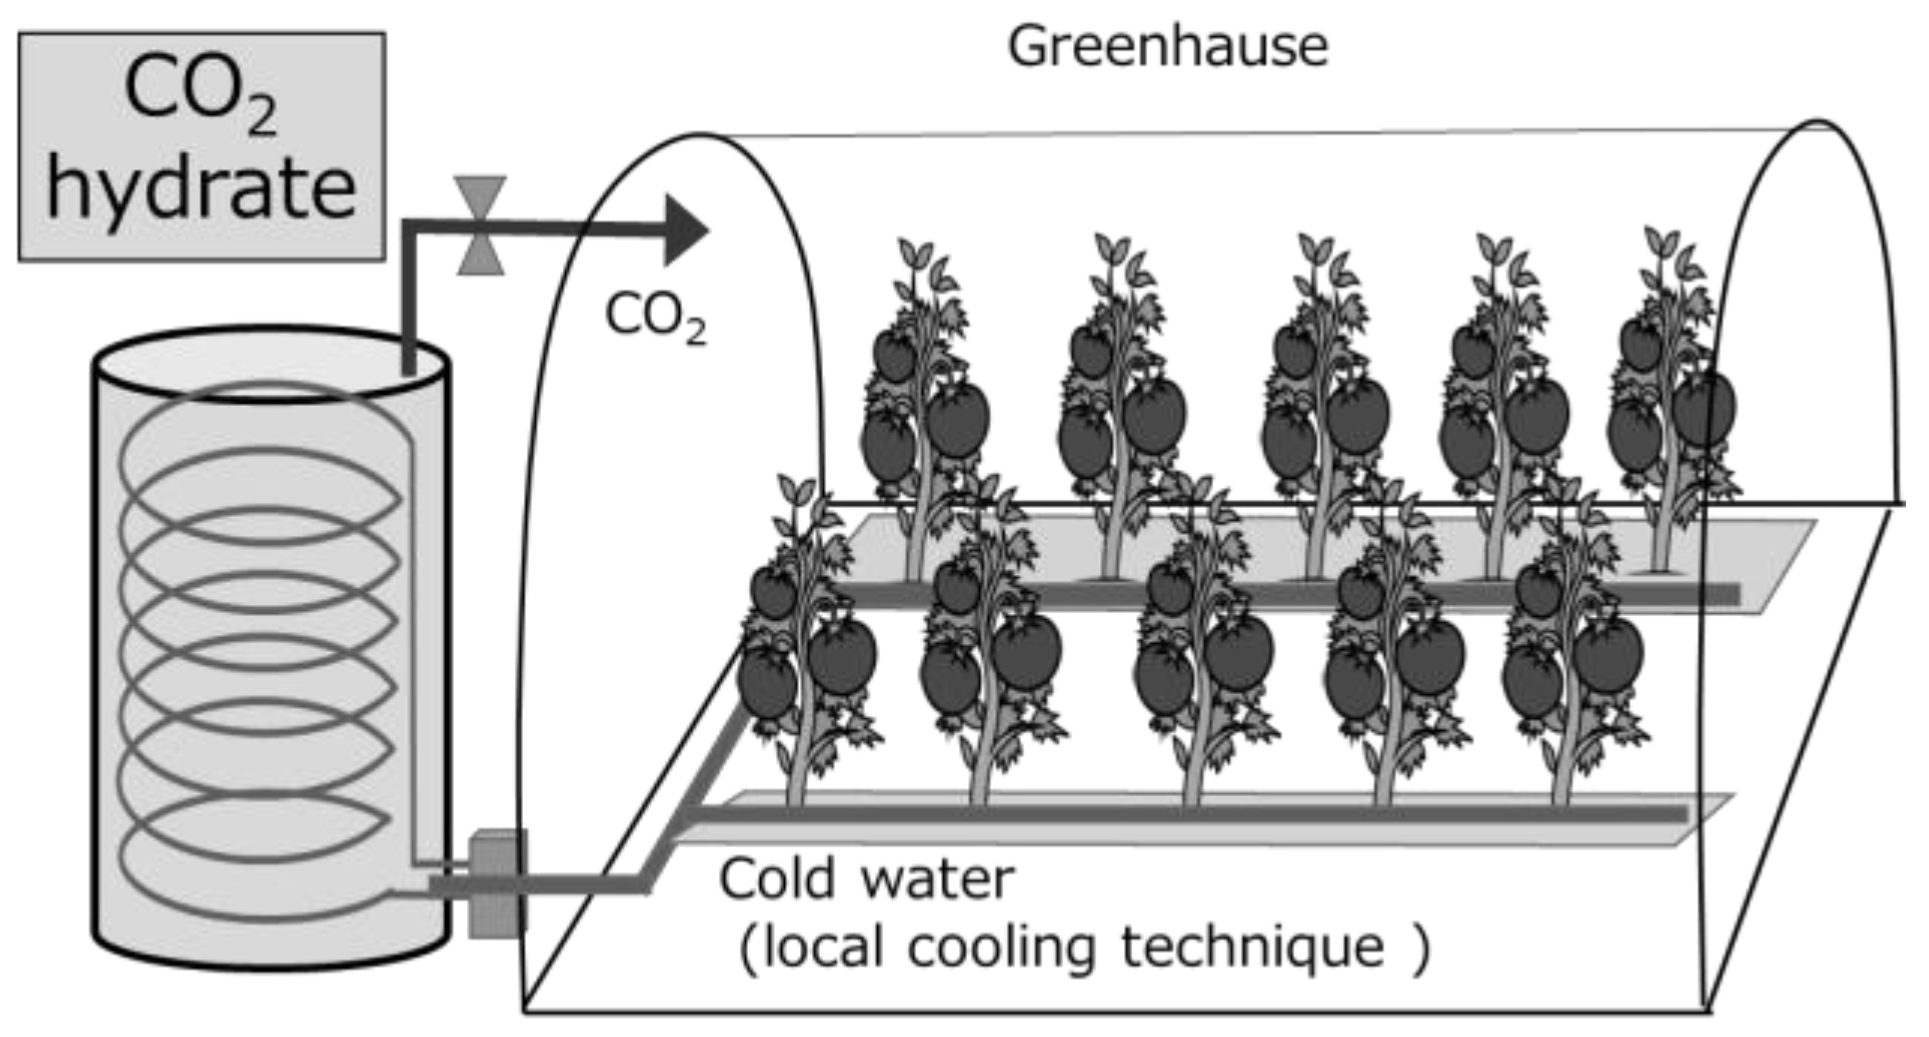
However, when the sun's solar radiation is weak, such as the spring and autumn season's morning and evening, there is merit for a simultaneous supply of CO2 and cold heat by CO2 hydrate. Local cooling technologies (Figure 11) that provide a cooling effect to agricultural crops by cooling only specific parts of crop plants have been studied in recent years [20], so the technology of supplying CO2 by hydrate has merits. In this case, photosynthesis is accelerated by fertilization of CO2 because it can maintain an appropriate temperature near plants by local cooling, and yield increase of about 20% can be expected. Although the transportation method by CO2 hydrate is inferior to the CO2 transport volume, we considered that this method has sufficient effectiveness in this field in combination with local cooling technology or for use in spring and autumn.
5. Conclusions
In this study, the feasibility of several systems using CO2 or CO2 hydrates supplied from industrial to agricultural areas was quantitatively evaluated from the viewpoint of profitability and CO2 emission reduction. According to this analysis, the total CO2 supply costs including transportation ranged from 15 to 25 yen/kg-CO2 when the transportation distance was 50 km or less. Pipeline transportation costs at an annual CO2 transport volume of about 70,000 t were comparable to those of a cylinder truck or a CO2 hydrate tank truck. Among them, the cost of the hydrate-based method increased with the transport distance in contrast to the liquefied CO2 approach. However, the technology of supplying CO2 hydrate has merit, for example, by using a local cooling technique for cooling specific parts of agricultural products. In this case, photosynthesis is accelerated by fertilization of CO2 because it can maintain an appropriate temperature near plants via local cooling, and a yield increase of about 20% can be expected. The CO2 supply system presented herein supplied CO2 at a low cost and with low CO2 emissions, and the feasibility of the proposed system was shown from the viewpoint of profitability and CO2 emission reduction.
Acknowledgments
This study was financially supported by a Consignment study for Agriculture, Forestry and Fisheries Research Council. The authors express their deep appreciation to all parties concerned.
Author Contributions
Seiji Matsuo, Satoshi Takeya, Hiroki Umeda, and Toyohisa Fujita conceived and designed the experiments; Seiji Matsuo and Satoshi Takeya analyzed the data; Seiji Matsuo, Hiroki Umeda, and Toyohisa Fujita wrote the paper.
Conflicts of Interest
The authors declare no conflict of interest.
Nomenclature
| Latin symbols | |
| T | Temperature (°C) |
| P | Pressure before compression (MPa) |
| γ | Ratio of specific heat of CO2 (-) |
| Y | Cost (yen) |
| E | Power consumption (J/s) |
| C | Constant value (-) |
| W | Weight (kg) |
| V | Capacity (m3) |
| H | Heat (J) |
| N | Times (-) |
| D | Distance (km) |
| F | Factor (-) |
| Subscripts | |
| bst | Boosting |
| liq | Liquefaction |
| tr | Truck |
| cyl | Cylinder |
| m | Molecules 2 |
| gas | Gas filling |
| CO2H | CO2 hydrate |
| lo | Light oil |
| fc | Fuel consumption |
| mnt | Maintenance |
| em | Emission of light oil |
| tank | Tank lorry |
| pl | Pipeline |
| ann | Annal transport volume |
| dem | Demand for CO2 |
| lab | Labor |
References
- Matsuo, S.; Suzuki, M.; Iwasaki, Y.; Fujita, T.; Umeda, H. The optimum air-conditioning system design of water-saving greenhouse and its effects on growth in plants. Agric. Eng. Int. CIGR J. 2015, 17, 133–140. [Google Scholar]
- Assen, N.; Müller, L.J.; Steingrube, A.; Voll, P.; Bardow, A. Selecting CO2 Sources for CO2 Utilization by Environmental-Merit-Order Curves. Environ. Sci. Technol. 2016, 50, 1093–1101. [Google Scholar] [CrossRef] [PubMed]
- Umeda, H.; Ahn, D.; Iwasaki, Y.; Matsuo, S.; Takeya, S. A cooling and CO2 enrichment system for greenhouse production using CO2 clathrate hydrate Original, Engineering in Agriculture. Environ. Food 2015, 8, 307–312. [Google Scholar]
- Iwasaki, Y. Increase in photosynthesis amount by CO2 application, increase in yield. Facil. Hort. 2015, 171, 4–9. (in Japanese). [Google Scholar]
- Sun, J.; Lu, N.; Xu, H.; Maruo, T.; Guo, S. Root zone cooling and exogenous spermidine root-pretreatment promoting Lactuca sativa L. Growth and photosynthesis in the high-temperature season. Frontiers Plant Sci. 2016, 7, 1–14. [Google Scholar] [CrossRef] [PubMed]
- Low carbon societies. Comparison of the Chemical Absorption Process with the Physical Absorption Process for CO2 Capture, Proposal Paper for Policy Making and Governmental Action in Japan. Available online: http://www.jst.go.jp/lcs/documents/publishes/item/fy2015-pp-08.pdf (accessed on 1 March 2016). (In Japanese)
- Matsumiya, N.; Teramoto, M.; Kitada, S.; Haraya, K.; Matsuyama, H. Cost Evaluation of CO2 Separation from Flue Gas by Membrane-Gas Absorption Hybrid System Using a Hollow Fiber Membrane Module. Soc. Chem. Eng. Jp. 2005, 31, 325–330. (In Japanese) [Google Scholar] [CrossRef]
- Dashti, H.; Yew, H.Z.; Lou, X. Recent advances in gas hydrate-based CO2 capture. J. Natural Gas Sci. Eng. 2015, 23, 195–207. [Google Scholar] [CrossRef]
- Babu, P.; Linga, P.; Kumar, R.; Englezos, P. A review of the hydrate based gas separation (HBGS) process for carbon dioxide pre-combustion capture. Energy 2015, 85, 261–279. [Google Scholar] [CrossRef]
- Ma, Z.W.; Zhang, P.; Bao, H.S.; Deng, S. Review of fundamental properties of CO2 hydrates and CO2 capture and separation using hydration method. Renewable and Sustainable Energy Reviews 2016, 53, 1273–1302. [Google Scholar] [CrossRef]
- Miyagawa, M.; Matsuo, K.; Sakurai, S. Application of gas hydrate technology to CO2 separation and capture. Mitsui zosen technical review 2011, 203, 31–36. (in Japanese). [Google Scholar]
- Matsuo, S.; Inatsu, K.; Fujita, T. Energy evaluation of the cement manufacturing process using natural gas-hydrate technology in consideration of CO2 separation. J. Jp. Inst. Energy 2011, 90, 152–163. (In Japanese) [Google Scholar] [CrossRef]
- Devlin, J.P.; Monreal, I.A. Clathrate–hydrate ultrafast nucleation and crystallization from supercooled aqueous nanodroplets. Chem. Phys. Lett. 2010, 492, 1–8. [Google Scholar] [CrossRef]
- Takeya, S.; Hondoh, T.; Uchida, T. In Situ Observation of COit Hydrate by X-ray Diffraction. Ann. N.Y. Acad. Sci. 2000, 912, 973–982. [Google Scholar] [CrossRef]
- Takeya, S.; Hori, A.; Hondoh, T.; Uchida, T. Freezing-memory effect of water on nucleation of CO2 hydrate crystals. J. Phys. Chem. B. 2000, 104, 4164–4168. [Google Scholar] [CrossRef]
- Takeya, S.; Muromachi, S.; Yamamoto, Y.; Umeda, H.; Matsuo, S. Preservation of CO2 hydrate under different atmospheric conditions. Fluid Phase Equili. 2016, 413, 137–141. [Google Scholar] [CrossRef]
- Nakao, S. Current status and approach of CO2 separation and recovery technology. Res. Inst. Innov. Technol. Earth Rep. 2012, 5–10. [Google Scholar]
- Falenty, A.; Kuhs, W.F.; Glockzin, M.; Rehder, G. “Self-Preservation” of CH4 hydrates for gas transport technology: Pressure−Temperature dependence and ice microstructures. Energy Fuels. 2014, 28, 6275–6283. [Google Scholar] [CrossRef]
- Stern, L.A.; Circone, S.; Kirby, S.H.; Durham, W.B. Anomalous preservation of pure methane hydrate at 1 atm. J. Phys. Chem. B. 2001, 105, 1756–1762. [Google Scholar] [CrossRef]
- Mimachi, H.; Takahashi, M.; Takeya, S.; Gotoh, Y.; Yoneyama, A.; Hyodo, K.; Takeda, T.; Murayama, T. Effect of long-term storage and thermal history on the gas content of natural gas hydrate pellets under ambient pressure. Energy Fuels. 2015, 29, 4827–4834. [Google Scholar] [CrossRef]
Figure 1.
The agro-industrial system.

Figure 2.
Transportation by truck type.

Figure 3.
Transportation by pipeline type.

Figure 4.
Transportation by pipeline type.

Figure 5.
CO2 absorption–desorption process.

Figure 6.
Liquefaction process of CO2.

Figure 7.
CO2 hydrate production.

Figure 8.
Relationship between hydrate formation energy and temperature at various concentrations of exhaust gas.
Figure 8.
Relationship between hydrate formation energy and temperature at various concentrations of exhaust gas.

Figure 9.
Relation between the total cost of the CO2 supply system and the transported distance of CO2 for each method.
Figure 9.
Relation between the total cost of the CO2 supply system and the transported distance of CO2 for each method.

Figure 10.
Relation between the total cost of the CO2 supply system and the annual CO2 transport volume in pipeline.
Figure 10.
Relation between the total cost of the CO2 supply system and the annual CO2 transport volume in pipeline.

Figure 11.
Utilization technology of CO2 hydrate by combining with a local cooling method.


Table 1.
Some CO2 supply methods.
| Type | Collecting | Transportation | |
|---|---|---|---|
| Separating | Boosting | ||
| (1) | Chemical absorption | Liquefaction | Truck |
| (2) | Chemical absorption | Hydration | Tank lorry |
| (3) | Chemical absorption | Compression | Pipe line |
Table 2.
Conditions for calculating energy and cost.
| Condition | Value | Unit |
|---|---|---|
| Coal-based power generation plant | 1000 | (kW) |
| CO2 collection efficiency | 90 | (%) |
| Collected rate of CO2 | 700 | (t/h) |
| Amount of collected CO2 per year | 5000 | (kt/y) |
| CO2 density in the exhaust gas | 20 | (%) |
| Temperature of the exhaust gas | 90 | (°C) |
| Absorption tower inlet gas | 3000 | (km3/h ) |
| Annual operating time | 8000 | (h) |
| Electricity cost | 12 | (yen/kWh) |
| Years of depreciation | 10 | (years) |
| The number of employees | 8 | (-) |
| Thermal price | 0.3 | (yen/MJ) |
Table 3.
Cost and energy consumption of the main devices in the chemical absorption method.
| • Main equipment | ||||
| wash-column, absorber, regenerator, packing, reflux drum, heat exchange, booster fan, pomp, CO2 pomp, CO2 compressor | ||||
| • Capital (fixed) cost | ||||
| Equipment cost | 1.2 | (yen/kg-CO2) | ||
| Labor cost | 0.01 | (yen/kg-CO2) | ||
| • Operating (variable ) cost | ||||
| Power | 0.14 | (kWh/kg-CO2 ) | 1.7 | (yen/kg-CO2) |
| Heat | 2.5 | (MJ/kg-CO2 ) | 0.8 | (yen/kg-CO2) |
| Etc. | 52 | (MJ/kg-CO2 ) | 0.4 | (yen/kg-CO2) |
Equipment cost = (construction cost / depreciation period) / annual CO2 collection amount; Construction cost = major equipment cost × 4.74 (Lang coefficient); Labor cost = (the number of employees × 4 Myen/ year) / annual CO2 collection amount.
Table 4.
Calculation condition of CO2 load capacity by gas bomb truck.
| Condition | Value | Unit |
|---|---|---|
| Truck load capacity | 10,000 | (kg) |
| Gas filling capacity | 7.00 | (Nm3) |
| Molar volume | 0.0224 | (Nm3/mol) |
| CO2molecular weight | 44.0 | (g/mol) |
| Cylinder capacity | 13.75 | (kg) |
| Weight of cylinder | 52.00 | (kg) |
Table 5.
Calculation condition of CO2 hydrate load capacity.
| Condition | Value | Unit |
|---|---|---|
| Tanker load capacity | 10,000 | (kg) |
| Container volume | 47.0 | (L) |
| Contents density | 1.105 | (kg/L) |
| Container weight | 52.0 | (kg) |
| Contents of container | 43.09 | (kg) |
Table 6.
Calculation condition of cold load capacity.
| Condition | Value | Unit |
|---|---|---|
| CO2 hydrate load capacity | 4,531 | (kg-CO2 ) |
| Heat of formation of hydrate | 65.0 | (kJ/mol-CO2 ) |
| Specific heat of water | 4.217 | (kJ/kg·K) |
| Specific heat at CO2 | 0.8518 | (kJ/kg·K) |
| Cold supply | 504.94 | (kJ/kg·K) |
Table 7.
Separation and boosting energies required for each method.
| Collecting Method | Separation Energy | Compression Energy | |||
|---|---|---|---|---|---|
| Liquefaction | Compression | Hydrate | |||
| (kWh/kg-CO2) | (kWh/kg-CO2) | (kWh/kg-CO2) | (kWh/kg-CO2) | ||
| (1) | CA + LQ | 0.13 | 0.12 | --- | --- |
| (2) | CA + CO2H | 0.13 | --- | --- | 0.17 |
| (3) | CA + CM | 0.13 | --- | 0.07 | --- |
CA: chemical absorption (waste heat use); LQ: liquefaction; CM: compression; CO2H: CO2 hydrate.
Table 8.
Collection cost for each method.
| Collecting Method | Separation Cost | Compressed Cost | Collection Cost | |
|---|---|---|---|---|
| (yen/kg-CO2) | (yen/kg-CO2) | (yen/kg-CO2) | ||
| (1) | CA+LQ | 3.58 | 0.12 | 5.61 |
| (2) | CA+CO2H | 0.17 | 6.02 | |
| (3) | CA+CM | 0.07 | 4.76 |
CA: chemical absorption (waste heat use); LQ: liquefaction; CM: compression; CO2H: CO2 hydrate.
Table 9.
Transportation results (CO2 loading capacity and the transportation cost).
| Transporting Method | CO2 Load Capacity | Transportation Cost | Amount of CO2 Emission |
|---|---|---|---|
| (kg/one truck) | (yen/kg-CO2/km) | (kg/kg-CO2) | |
| LQ (TR) | 3,846 | 0.139 | 0.00045 |
| CM (PL) | 489.4 | 1.089 | 0.00357 |
| CO2H (HTL) | 2,193 | 0.243 | 0.00080 |
LQ: liquid CO2; CM: compressed gas CO2; CO2H: CO2 hydrate; TR: truck; PL: pipe line; HTL: hydrate tank lorry.
© 2017 by the authors. Licensee MDPI, Basel, Switzerland. This article is an open access article distributed under the terms and conditions of the Creative Commons Attribution (CC BY) license (http://creativecommons.org/licenses/by/4.0/).
Share and Cite
MDPI and ACS Style
Matsuo, S.; Umeda, H.; Takeya, S.; Fujita, T. A Feasibility Study on Hydrate-Based Technology for Transporting CO2 from Industrial to Agricultural Areas. Energies 2017, 10, 728. https://doi.org/10.3390/en10050728
AMA Style
Matsuo S, Umeda H, Takeya S, Fujita T. A Feasibility Study on Hydrate-Based Technology for Transporting CO2 from Industrial to Agricultural Areas. Energies. 2017; 10(5):728. https://doi.org/10.3390/en10050728
Chicago/Turabian StyleMatsuo, Seiji, Hiroki Umeda, Satoshi Takeya, and Toyohisa Fujita. 2017. "A Feasibility Study on Hydrate-Based Technology for Transporting CO2 from Industrial to Agricultural Areas" Energies 10, no. 5: 728. https://doi.org/10.3390/en10050728
Note that from the first issue of 2016, this journal uses article numbers instead of page numbers. See further details here.