
The Performance of Polymer Flooding in Heterogeneous Type II Reservoirs—An Experimental and Field Investigation

1
Key Laboratory for Enhanced Oil & Gas Recovery of the Ministry of Education, Northeast Petroleum University, Daqing 163318, China
2
Department of Geological Sciences and Engineering, Missouri University of Science and Technology, Rolla, MO 65401, USA
3
McDougall School of Petroleum Engineering, University of Tulsa, Tulsa, OK 74104, USA
*
Authors to whom correspondence should be addressed.
Energies 2017, 10(4), 454; https://doi.org/10.3390/en10040454
Submission received: 12 January 2017
/
Revised: 22 February 2017
/
Accepted: 27 March 2017
/
Published: 1 April 2017
(This article belongs to the Special Issue Oil and Gas Engineering)
Abstract
:The polymer flooding process has already been applied to the medium permeability type II reservoirs of the Daqing Oilfield (China) to enhance oil recovery. However, this process faces a number of challenges, such as the flooding efficiency, high injection pressure, formation blockage and damage, unbalanced absorption ratio, and economical justification. In this study, single-phase and two-phase flow experiments are performed to investigate polymer injection adaptability with natural cores of type II reservoirs. The enhanced oil recovery (EOR) effects of the polymer are studied by physical simulation experiments, and the results of application in an actual field are also presented. The results indicate that the flow characteristics and injection capability are dominated by the reservoir permeability in polymer flooding. Moreover, the adsorption of polymer molecules and the injection pressure gradient, which reflect formation damage, are affected more significantly by the concentration than by the molecular weight in type II reservoirs. Using the matching relationship, the injection-production process is stable, and additional oil recoveries of 10%–15% can be obtained in heterogeneous type II reservoirs with a high water saturation. This work is significant in that it further accelerates the application of polymer flooding EOR in medium permeability heterogeneous oilfields with high water saturation.
1. Introduction
It is well known that crude oil plays an important role in providing energy supply to the world among the various sources of energy. After primary and secondary recovery processes, typically, an excess of 60% of the original oil in place (OOIP) remains within the formation [1,2,3,4]. Against this background, enhanced oil recovery (EOR) has been revitalized globally in the past three decades. At present, the fall in oil prices has contributed to the fact that many EOR projects are facing cancellation or delay, but the tertiary techniques including CO2-EOR for improving the production of partially depleted reservoirs is still an attractive option. A survey in 2014 showed that miscible CO2 floods yielded 292,735 bbls per day, which accounted for 38% of oil production for EOR processes in the USA [5,6,7,8,9,10]. The EOR potential evaluation, which assessed more than 200 onshore oilfields of 17 different worldwide oil reserved districts, indicates that China has great EOR potential [11]. The estimate of the incremental recoverable reserves that adopt chemical flooding (polymer flooding, alkali–polymer flooding, and alkali–surfactant–polymer flooding) accounts for 76% of the covered reserves out of all EOR methods used in China. The target of annual oil production of over 95 million barrels (bbls) before 2016 by chemical flooding EOR has been accomplished, and the gradual increase of crude oil production of China will be achieved [12,13].
As the most common chemical EOR process used to improve the oil recovery factor in oil fields, polymer flooding can increase the viscosity of injection water by adding a water-soluble high molecular weight polymer, which decreases the mobility ratio of the solution to oil and enhances the extent of injection profile reversal, and, hence, improves the volumetric sweep efficiency [14]. This means the viscosity increase can induce a viscous pressure gradient across layers with different permeabilities and partially divert the flow of the injected polymer solution from the high permeability to the low permeability layer and hence, can improve conformance. Moreover, because of the adsorption behavior during a polymer flooding process, the absolute permeability of the porous media declines in a certain range, and because of the viscoelastic properties of the solutions, the oil/water relative permeability can also decline.
Since 1996, polymer flooding in the Daqing Oilfield (China) has realized industrialization and has entered into the commercial application stage. More than 50 blocks of polymer flooding have been applied in the oilfield thus far; the average incremental oil recovery factor was approximately 13% (OOIP) greater than that when water flooding was performed, and the accumulated oil production by polymer flooding has achieved 792 million bbls, where one ton of polymer powder can increase oil by approximately 870 bbls [15,16,17]. As seen, considerable economic benefits have been obtained.
Generally, the polymer flooding efficiency has significantly increased with the development of polymer product properties and injection-production technologies, and the integrated techniques concerning reservoir engineering, oil production engineering, surface engineering, and dynamic monitoring in field tests of polymer flooding have been realized based on a series of successful field experiences [12]. At present, the target reservoir type by polymer flooding has extended from high permeability sandstone reservoirs to medium and low permeability sandstone reservoirs as well as from sandstone reservoirs to conglomerate reservoirs and complex fault block reservoirs [16,18]. The oil reservoir class standard of the Daqing Oilfield is established based on the sedimentary characteristics and development status. High permeability sandstone reservoirs whose effective thickness is greater than 4 m and has a permeability greater than 800 × 10−3 μm2; this reservoir is classified as a type I reservoir, which is the primary reservoir type in the field. Sandstone reservoirs whose effective thickness is within 1–4 m with a permeability greater than 100 × 10−3 μm2 are deemed as medium permeability reservoirs and are classified as type II reservoirs. Low permeability sandstone reservoirs whose effective thickness is less than 1 m with a permeability of less than 100 × 10−3 μm2 are classified as type III reservoirs. In the EOR practice of the Daqing Oilfield, a cost-effective process has been investigated to further produce residual oil from major reservoirs entering the later development period of polymer flooding; for medium permeability type II reservoirs, which have a relatively strong heterogeneity, poor connectivity, thin oil layers, and a small growing sand body, polymer flooding processes for EOR have already been applied and have become a necessity for stable production levels of a maturing field base.
The practice of industrialized polymer flooding in the type II reservoir typical blocks of the Daqing Oilfield has proven that an average EOR value of 12.3% (OOIP) can be obtained and has played a significant role in the process of sustainable development of energy [18]. However, the injection performance of viscous polymer solutions has been a concern for field application of polymer flooding, where the permeability is critical to polymer injection because low-permeability formations may prevent polymer molecules from flowing through pores or pore throats. Furthermore, polymer adsorption in reservoirs is essentially irreversible, and the adsorbed polymers will “permanently” damage the formation. Several experimental studies have investigated the resulting effect of polymer adsorption during polymer flooding [19,20,21,22]. The previous study carried out by Wang et al. [23] identified the polymer injection ability on type I reservoirs with different water-wash degree, and the feasibility of reducing residual oil after water flooding in strong water-wash degree reservoirs by polymer solutions with high molecular weight and high concentration was evaluated. However, the residual resistance measurements were merely operated in single-phase flow and whether the adsorption behavior could be alleviated with the existence of oil was not mentioned in their work, and the results were not validated by the field data as well. Residual oil after polymer flooding is more difficult to recover by other processes because the formation permeability has been reduced to different degrees. This is the reason why fewer polymer flooding projects have been performed in carbonate reservoirs.
To extend the laboratory results to field scale, a mathematical model that is capable of considering important mechanisms that influence injectivity has been proposed, and systematic simulations of injectivity, which declines during polymer flooding, were performed recently by Lotfollahi et al. [24]. Although the injectivity model can calculate the injection pressure in both the coreflood and field tests, from which, an understanding of the contribution of different phenomena to the pressure rise in polymer-injection wells can be obtained, the filtration model, which was coupled with a polymer–rheology model to simulate the permeability reduction, did not consider the impact of flushing of “polymer junk” removal; the successful case used a sandstone reservoir, which also has a high average porosity and high average permeability. Furthermore, the reduction of injectivity in polymer flooding process can significantly affect the economic results of oilfield development. It is crucial to evaluate the success of the EOR performance from both perspectives of technology and economics. In terms of economic issues in EOR, Van and Chon [25,26] have investigated the efficiency of chemical flooding in horizontal wells and heavy-oil reservoirs, they concluded that the chemical injection plans should be employed consistently when considering the considerable fluctuations in oil prices, and understanding the effects of well combination patterns to the EOR performance would be beneficial to the success of EOR projects on economic and technical issues.
Therefore, polymer flooding processes in type II reservoirs still face the challenges of flooding efficiency, high injection pressure, formation blockage and damage, unbalanced absorption ratio, and economical justification; several key techniques of polymer flooding that involve polymer screening and evaluation, viscosity loss control, separated layer injection, and eccentrically wearing prevention constantly still require innovation. Moreover, the matching relationship between polymer injection parameters and actual reservoirs is the most highlighted and specific problem.
In this work, we attempt to build a promising method to address the aforementioned challenges. Laboratory experiments of polymer injection adaptability with natural cores were performed based on coring interpretation data of type II reservoirs in the Daqing Oilfield. The adsorption behavior was characterized and compared in polymer solution single-phase flow and polymer–oil two-phase flow. Cores of different levels of permeabilities and different polymers were used to cover a range of conditions that might be encountered in a typical field application of type II reservoirs. The formation damage during polymer injection was evaluated, and a matching relation schema was established according to different polymer molecular weights and concentrations for the resistance coefficient, residual resistance coefficient, and injection capability factor in a flooding environment, which related to micro-pore structure characteristics. The EOR effects of the polymer in type II reservoirs were obtained with the help of physical simulation experimental data of “co-injection and separated-layer production” with three field-oriented parallel cores. Furthermore, the application of heterogeneous type II reservoirs in the Daqing Oilfield is also presented, and the role of a matching relationship between polymer injection parameters and reservoirs in EOR is discussed and explained.
2. Experimental Material and Setup
2.1. Experimental Materials
2.1.1. Cores
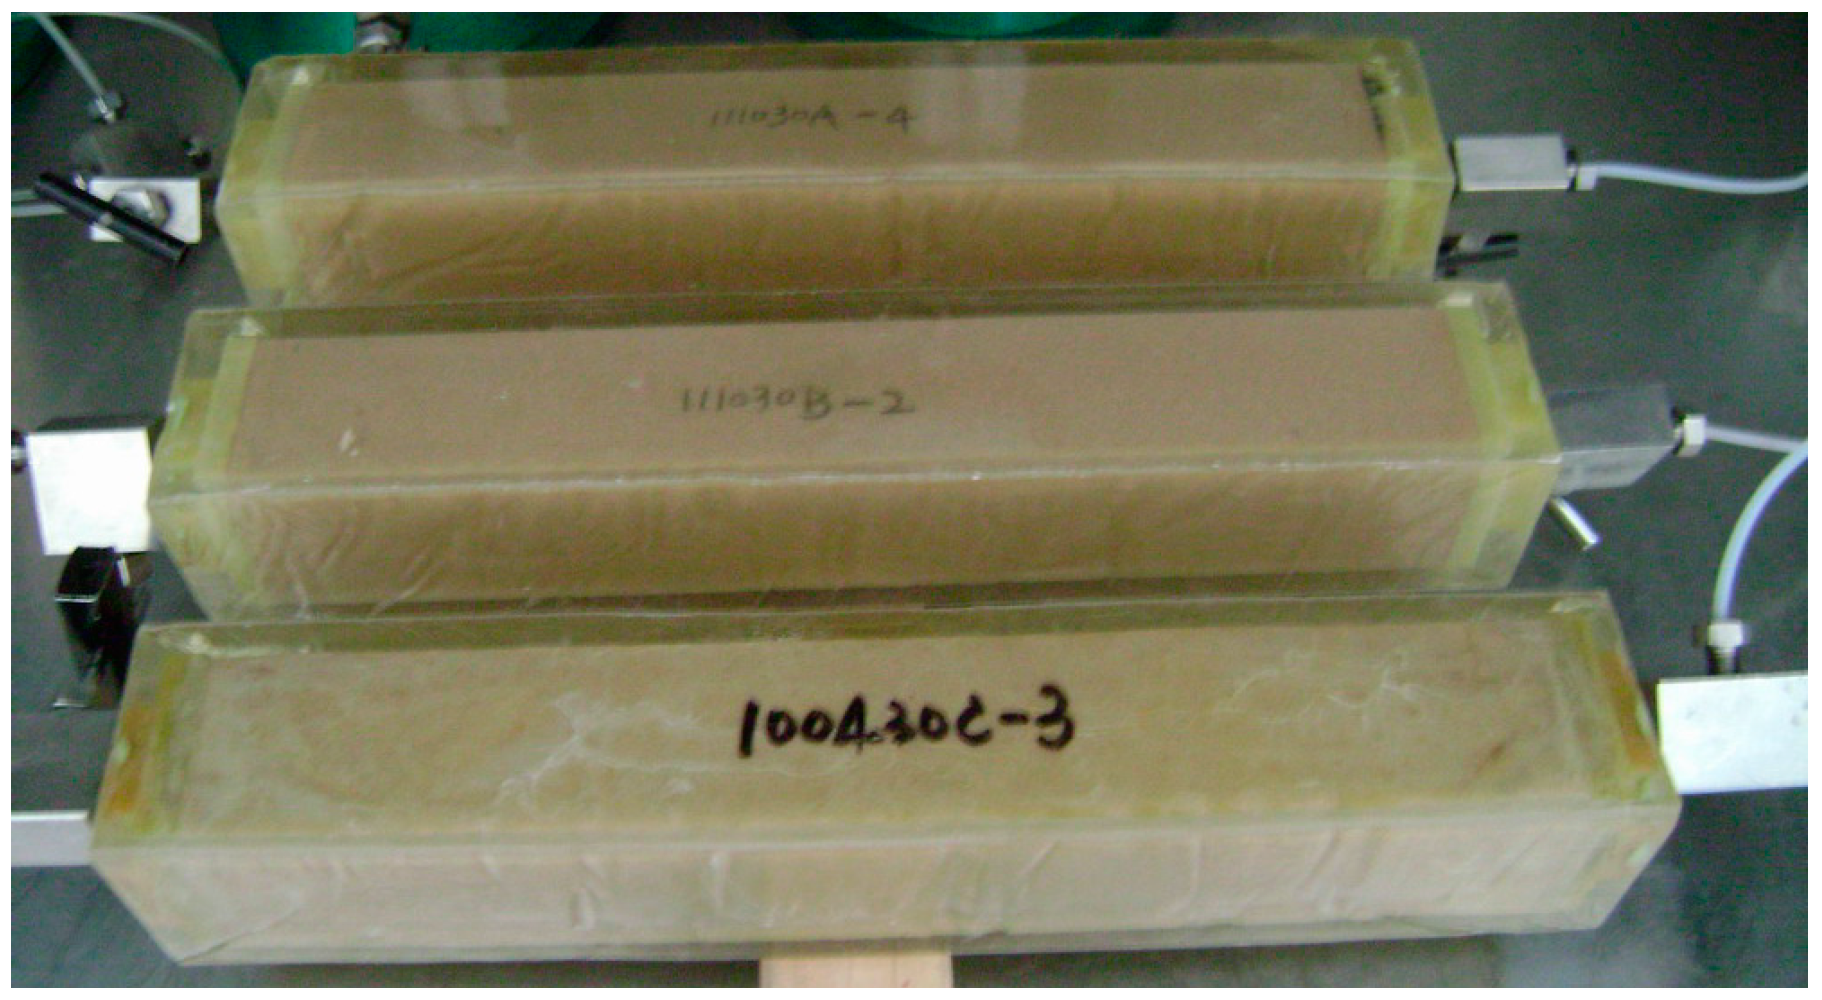
The natural cores used for single-phase and two-phase flow characteristic measurements and for polymer adsorption-induced permeability reduction evaluation were sampled from the type II reservoir of the Pu I horizon in the Daqing Oilfield. The cores were cut into cylindrical shapes with diameters of 25 mm and lengths of approximately 60 mm. The cores were extracted for approximately 72 h by a compound solvent (benzene/alcohol = 3:1) and were then dried at a temperature of 105 °C. Their measured effective permeabilities and porosities were approximately 100 × 10−3 μm2, 300 × 10−3 μm2, and 500 × 10−3 μm2 and 23%, 25%, and 28%, respectively. For the polymer flooding experiments, epoxy resin cemented artificial cores with dimensions of 30 cm × 4.5 cm × 4.5 cm were used, as shown in Figure 1, where “co-injection and separated-layer production” with three parallel cores was designed to simulate the heterogeneity of type II reservoirs, and the effective permeabilities were 100 × 10−3 μm2, 300 × 10−3 μm2, and 500 × 10−3 μm2 with porosities of 22.8%, 25.2%, and 27.6%, respectively.
2.1.2. Brine Solutions and Oil
A synthetic brine representative of a particular practical formation water was used in all of the experiments presented, where the formulation is listed in Table 1. Ion concentrations satisfied (Na+-Cl−)/SO42− > 1; hence, this type of formation water is of the NaHCO3 type. Clear water taken from subsurface and used as the displacing fluid and a solvent were applied in the experiments, as shown in Table 1, which contains 394.93 mg/L salinity and 35.86 mg/L total content of Ca2+ and Mg2+. The prepared brine solutions were all passed through a 0.22-μm filter and degassed, which eliminates the probable effects of certain undissolved solids on the transport characteristics of the prepared solution. Additionally, the oil used in this study was the simulated oil compounded by degassed crude oil of the Daqing Oilfield and aviation kerosene in a certain proportion (9.5 mPa·s at 45 °C).
2.1.3. Chemicals
All experiments in this study were performed with hydrolyzed polyacrylamide (HPAM). The polymers had relative molecular weights of 1.6 × 10⁷ Da and 1.9 × 10⁷ Da and a hydrolysis degree of approximately 25% and were supplied by the Petrochina Daqing Refining & Petrochemical Company (Daqing, China). The polymer solutions were prepared by dissolving the required amount of polymer powder in clear water, which were filtered by a sand core funnel of G1 type with apertures of 20–30 μm to remove any polymer agglomerates and particulates from the solutions. The power law index was obtained by conventional rheological measurements, and the viscosity was tested at a shearing rate of 7.34 s−1 at 45 °C, and the solutions were stored in a low-temperature environment to help prevent degradation of the polymer before use. A series of experiments that covered a wide range of polymer concentrations for different permeability cores are shown in Table 2. The chemicals also include conventional reagents (AR) used to prepare the brine solutions.
2.2. Experimental Setup
2.2.1. Resistance Coefficient and Residual Resistance Coefficient Measurements under Various Polymer Injection Parameters
The temperature of the injection systems in the experiments was set at 45 °C, which is the actual reservoir condition. After the natural cores were fully saturated with the brine solution to determine the pore volume, approximately 5 pore volume (PV) of clear water was injected to measure the initial effective permeability. Then, one of the HPAM solutions was injected at a speed of 1.0 m/day until the pressure was stable, where the injection volume was approximately 30 PV, and the resistance coefficient (RF) was measured. Afterwards, continuous injection of the clear water over 30 PV was once again done to flush and remove the polymer entrapment; then, the permeability reduction as a result of only polymer adsorption was obtained. Then, the residual resistance coefficient (RRF) was calculated, and the polymer injection-induced formation damage was evaluated.
2.2.2. Single-Phase Flow Characteristics Measurements under Various Polymer Injection Parameters
Regarding flow characteristics measurements, the temperature of the systems in the experiments was also set at 45 °C, and the pore volume and initial effective permeability of the natural cores were determined following the aforementioned methodology after cutting a core slice of 1.5 mm at the inlet end of the cores. Then, one of the HPAM solutions was injected at various flow rates, and the stable injection pressure of the polymer slug at each flow rate was successively recorded, where the total injection volume was approximately 30 PV. The curve with the flow characteristics was established, and the injection capability factor was obtained. Afterwards, continuous injection of clear water over 30 PV was once again done to flush and remove the polymer entrapment, and the other core slice of 1.5 mm was cut at the inlet end of the cores. Then, the pore features and mineral morphology of these core slices were observed by a scanning electron microscope (SEM, JEOL Ltd., Tokyo, Japan). The matching relation schema between polymer injection parameters and reservoirs could thus be established.
2.2.3. Two-Phase Flow Characteristics Measurements under Various Polymer Injection Parameters
The relative permeability was measured using the non-steady-state method to describe the polymer–oil two-phase flow characteristics [27,28]. The temperature of the experimental systems was also set at 45 °C. HPAM solutions of 1000 mg/L and 1500 mg/L with a molecular weight of 1.6 × 10⁷ Da and 1500 mg/L with a molecular weight of 1.9 × 10⁷ Da were used with power law indices of 0.620, 0.552, and 0.536, respectively. The natural cores with permeabilities of 100 × 10−3 μm2 and 500 × 10−3 μm2 were extracted and were firstly fully saturated with the brine solution to determine the pore volume and permeability; then, the oil was injected at a constant rate of 1.0 m/d to confirm the irreducible water saturation, and the oil phase permeability was determined under an irreducible water condition. Then, one of the HPAM solutions with a known power law index was injected at the same constant velocity as the oil driving water, and during the process, the polymer injection volume and pressure drop across the entire core were determined; the effluent fractions were collected, and the amounts of water phase and oil phase were recorded every 0.5 h. Furthermore, to simulate an actual porous flow process, the initial injection pressure differential of the HPAM solution can be estimated from:
where (∆P)pi is the initial injection pressure differential of the HPAM solution, MPa; (∆P)o is the pressure differential when oil drives water, Mpa; μp is the viscosity of the HPAM solution, Pa·s; and μo is the viscosity of the oil, Pa·s.
Furthermore, when the cumulative injection volume of the polymer solution was greater than 30 PV and reached residual oil saturation, the cores were flushed with clear water at a constant rate to further provide RRF data. Afterwards, the flow experiment was finished. Krp, Kro, and RRF could then be calculated using these data; then, the relative permeability curves could be developed, the polymer adsorption-induced permeability reduction and injection performance can be identified in two-phase flow, and the availability of the matching relation schema obtained from single-phase flow can further confirmed.
2.2.4. Oil Displacement Experiments under the Matching Relationship
The temperature of the systems was also set at 45 °C in the oil displacement experiments. Firstly, the air in cores was pumped out and fully saturated with the brine solution. Then, the oil was injected to confirm the irreducible water saturation to set an initial experimental condition, and the original oil saturation was obtained. Afterwards, the clear water was injected into the three parallel cores at 1.0 m/d, which is same as the speed of seepage flow in porous media, until the comprehensive water cut in the produced oil was >93%. Then, one of the HPAM solutions was injected at the same velocity as water flooding, where the injection volume was 0.60 PV, and the diversion ratios of the produced oil and water and the cumulative production were each recorded. After injection of the polymer slug was finished, clear water was injected again until there was no oil at the outlet, and the final recovery factor could then be determined.
3. Mechanism Description
Polymer retention in porous media, such as adsorption on a rock grain surface and mechanical entrapment, could cause a mobility reduction and pressure increase in the absence of solid particles in injection water [29]. Particularly in low-permeability layers of heterogeneous type II reservoirs, retention can be critical to the polymer adsorption-induced permeability reduction or formation blockage, which may further yield a negative effect on oil recovery. Previous studies have indicated a selective action of the polymer, where a significant reduction in water permeability with respect to oil permeability has been observed. Zitha et al. [30] investigated the influence of polymer concentration and permeability on the retention of high molecular weight non-ionic polyacrylamide (PAAm) during flow in granular porous media, and the results showed that the residual flow resistance increased with polymer concentration. Chauveteau et al. [31] revealed that when a polymer solution is injected at low shear rates, the adsorbed layer thickness is not dependent upon the injection rate. However, when the polymer is injected at shear rates greater than the critical shear rates, the adsorbed layer thickness will increase with injection rate and gradually increase to a maximum value. Although polymer adsorption plays a significant role in the adjustment of the injection profile in heterogeneous reservoirs, polymer adsorption will still result in a formation permeability reduction [32].
As mentioned above, type I reservoirs, as the main sandstone reservoirs in Daqing Oilfield, have an effective thickness which is greater than 4 m and have a permeability which is greater than 800 × 10−3 μm2. However, the medium permeability reservoirs, which have an effective thickness within 1~4 m and have a permeability which is greater than 100 × 10−3 μm2, are classified and called as type II reservoirs in the field. In this sense, a relatively high residual flow resistance is expected in polymer flooding of high permeability type I reservoirs, whereas for medium permeability type II reservoirs, the injection capability should be given preferential consideration. The mobility changes caused by a partially HPAM solution flowing in porous media can be described by a RF [33]. After the HPAM solution flows through the porous media, a permanent permeability reduction has occurred and can be described by the RRF [34].
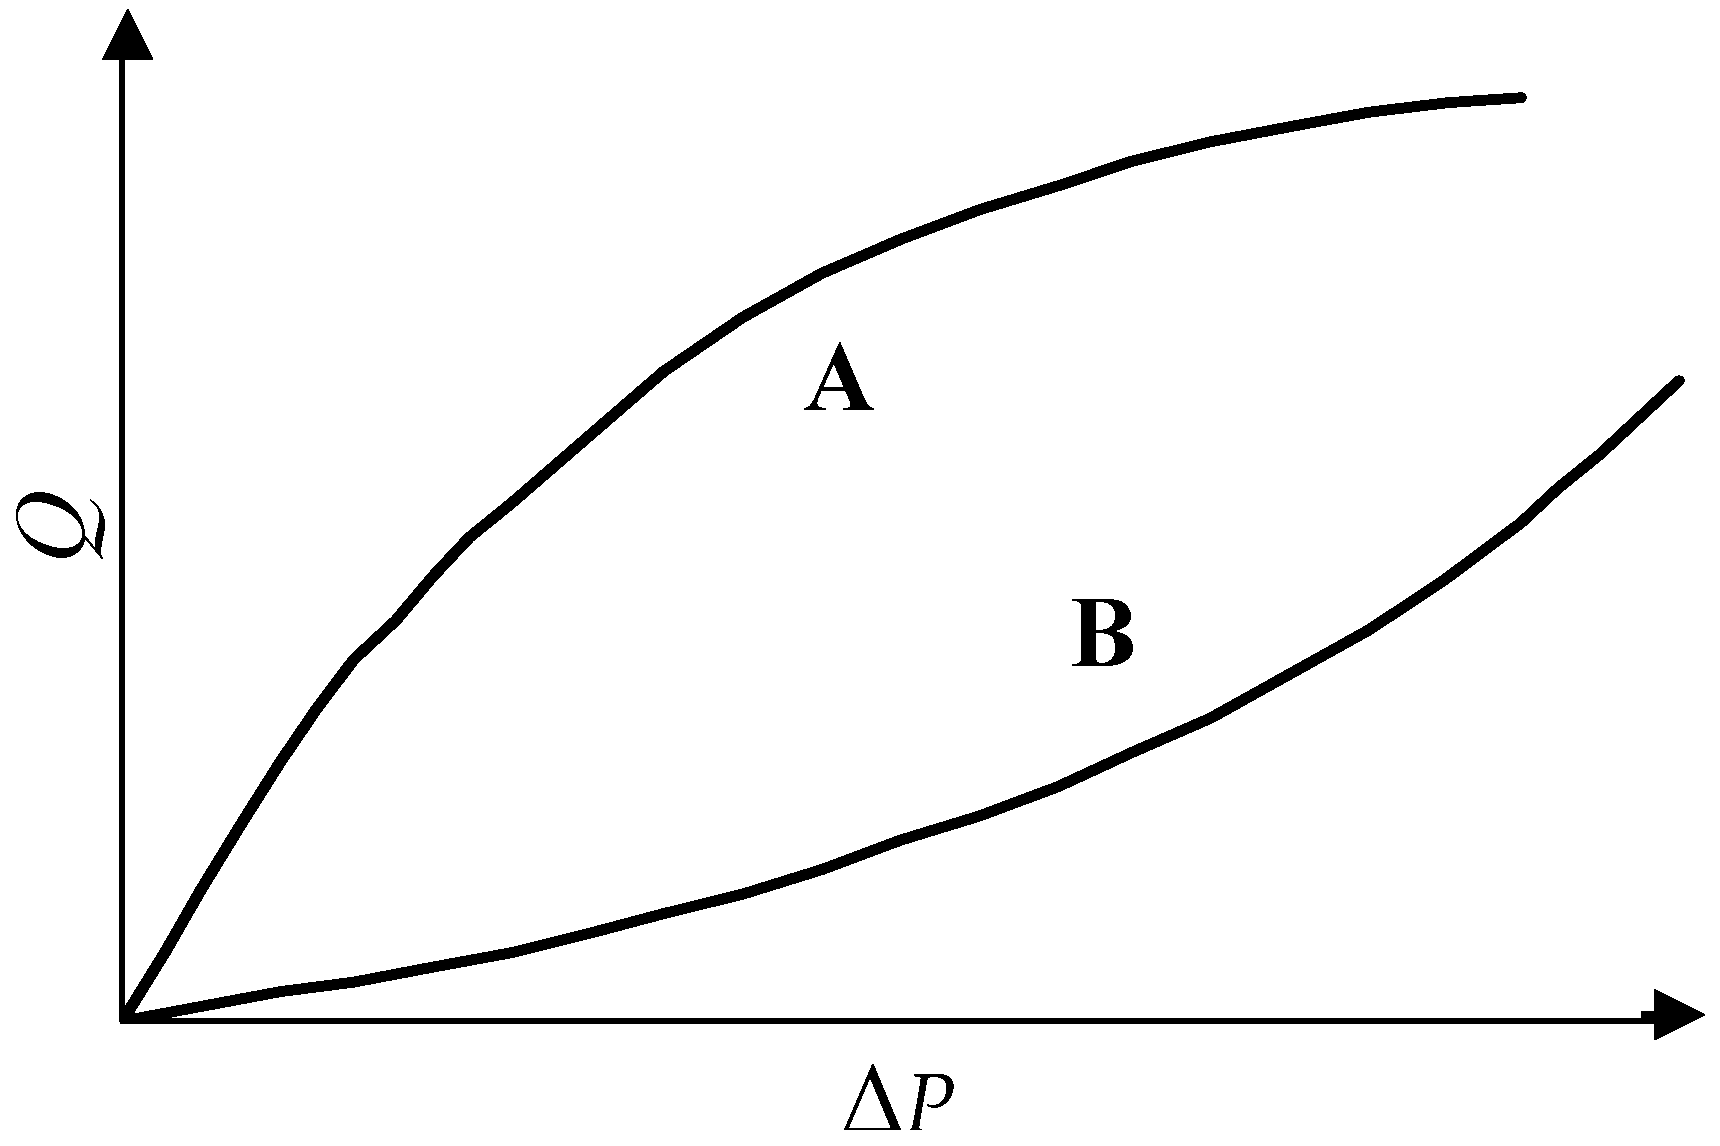
The HPAM polymer solution has priority to enter the high permeability layers with high water saturation in the reservoirs and is adsorbed on the sandstone formation with a negative electrostatic charge, which relies on the functions of hydrogen bonds and electrostatic attraction [35,36]. Meanwhile, the mechanical degradation in the flow dominates the macromolecular chains rupture of HPAM, but because of the specific characteristics of the polymer molecular structure, an apparent flow thickening behavior will be exhibited, and a viscoelastic effect will be present when the flow velocity distribution is above a critical rate. As shown in Figure 2, for single-phase flow of polymer solutions in porous media, we plot the change in flow rate (Q) as a function of pressure differential (ΔP), where the flow can exhibit two unusual characteristics. (1) The change in flow rate becomes slower as the pressure differential increases (Figure 2A), which means the flow rate increases with a gradual slope at higher pressures and indicates that the viscoelastic behaviors are generated by the stretching and relaxation of HPAM molecules in the pores. The increased pressure caused by the viscoelastic effect is greater than the decreased pressure caused by mechanical degradation; thus, the injection capability declines. (2) The change in flow rate becomes faster as the pressure differential increases (Figure 2B), which means that the flow rate increased with a steeper slope at higher pressures. The decreased pressure caused by mechanical degradation is greater than the increased pressure caused by the viscoelastic effect; thus, the injection capability enhances. The slope of the curve with the flow characteristic can be defined as the injection capability factor:
where I is the injection capability factor, 10−3 m3/d·Mpa; Q is the flow rate for a polymer slug, 10−3 m3/d; and (∆P)p is the injection pressure differential of a polymer slug, Mpa.
For polymer–oil two-phase flow in porous media, the polymer injection capability, which is affected by the adsorption behavior and adsorption-induced permeability reduction, can be further identified by relative permeabilities:
where:
and Krp is the relative permeability of the polymer solution in two-phase flow; Kro is the relative permeability of the oil phase in two-phase flow; μo is the viscosity of oil, Pa·s; μp is the viscosity of the polymer solution, Pa·s; μapp is the apparent viscosity of the polymer–oil phase and a function of the water saturation, Pa·s; fo and fp are the fractional flows of the oil phase and polymer solution phase, respectively, and are referred to as the diversion ratio of the displaced phase and displacing phase, respectively; v is the flow velocity, m/s; and n is the power law index of the polymer solution.
Considering Equations (3)–(6) and combining the theory of Buckley–Leverett [37], the expanded formula Krp and Kro can be established. Then, the relative permeabilities can be readily determined by processing experimental data obtained from the non-steady-state method.
4. Results and Discussion
4.1. Adsorption Behavior under Various Polymer Injection Parameters
The RF and RRF of polymer solution injections with different molecular weights and concentrations through the natural cores are shown in Table 3. It can be found that the flow is restricted to different degrees when the polymer retention reached its maximum level. This is because of the mechanical trapping and the adsorption behavior of polymer on the rock particles, which encompass hydrogen bonds, dispersion forces, and electrostatic attraction. The surfaces of the rock particles are constantly saturated with the polymer, and the polymer coats on the rock surface act as a hydrophilic film. As water passes over the polymer, the film swells, which reduces the effective permeability. In the experiments, the irreversible blockage due to polymer retention definitely occurs in the 100 × 10−3 μm2 cores with the polymer at a concentration of 1500 mg/L with a molecular weight of 1.6 × 10⁷ Da, where “polymer junk” accumulated at the core inlet. The accumulated “polymer junk” can be observed intuitively by the unaided eye at the cores inlet after flow measurements were finished.
The result also indicates that an RRF of less than 30 accounts for 52.5% of all of the experimental injection schemes, and the RRF increases as the molecular weights and concentrations of the polymer increase. This suggests that a certain amount of polymer is retained, and hence, the benefits of the permeability reduction can be achieved for a long period even after a period of subsequent water flush after the polymer slug is injected. The RRF is believed to be a result of the effect of adsorbed polymer molecules on the rock surface, which reduces the rock permeability. The RRF, by contrast, is affected more significantly by concentration than by molecular weight in different permeability cores of type II reservoirs. That is, the residual permeability is lower as the concentrations of polymer increases, and the formation damage degree is subsequently more enhanced. This result reflects the necessity of building a matching relationship between polymer injection parameters and type II reservoirs.
Furthermore, high polymer retention can reduce the amount of polymer in the flooding fluid, and a higher concentration is required to obtain a favorable mobility ratio, which may not be feasible economically when considering the variation of oil prices. The evaluation of the adsorption and retention behavior, which are related to a successful polymer flooding project from both perspectives of technical and economic feasibility, is essential. These results are in agreement with previous studies regarding the effect of polymer adsorption on permeability reduction in EOR [23,38,39,40].
4.2. Injection Performance Evaluation of Various Polymer Solutions
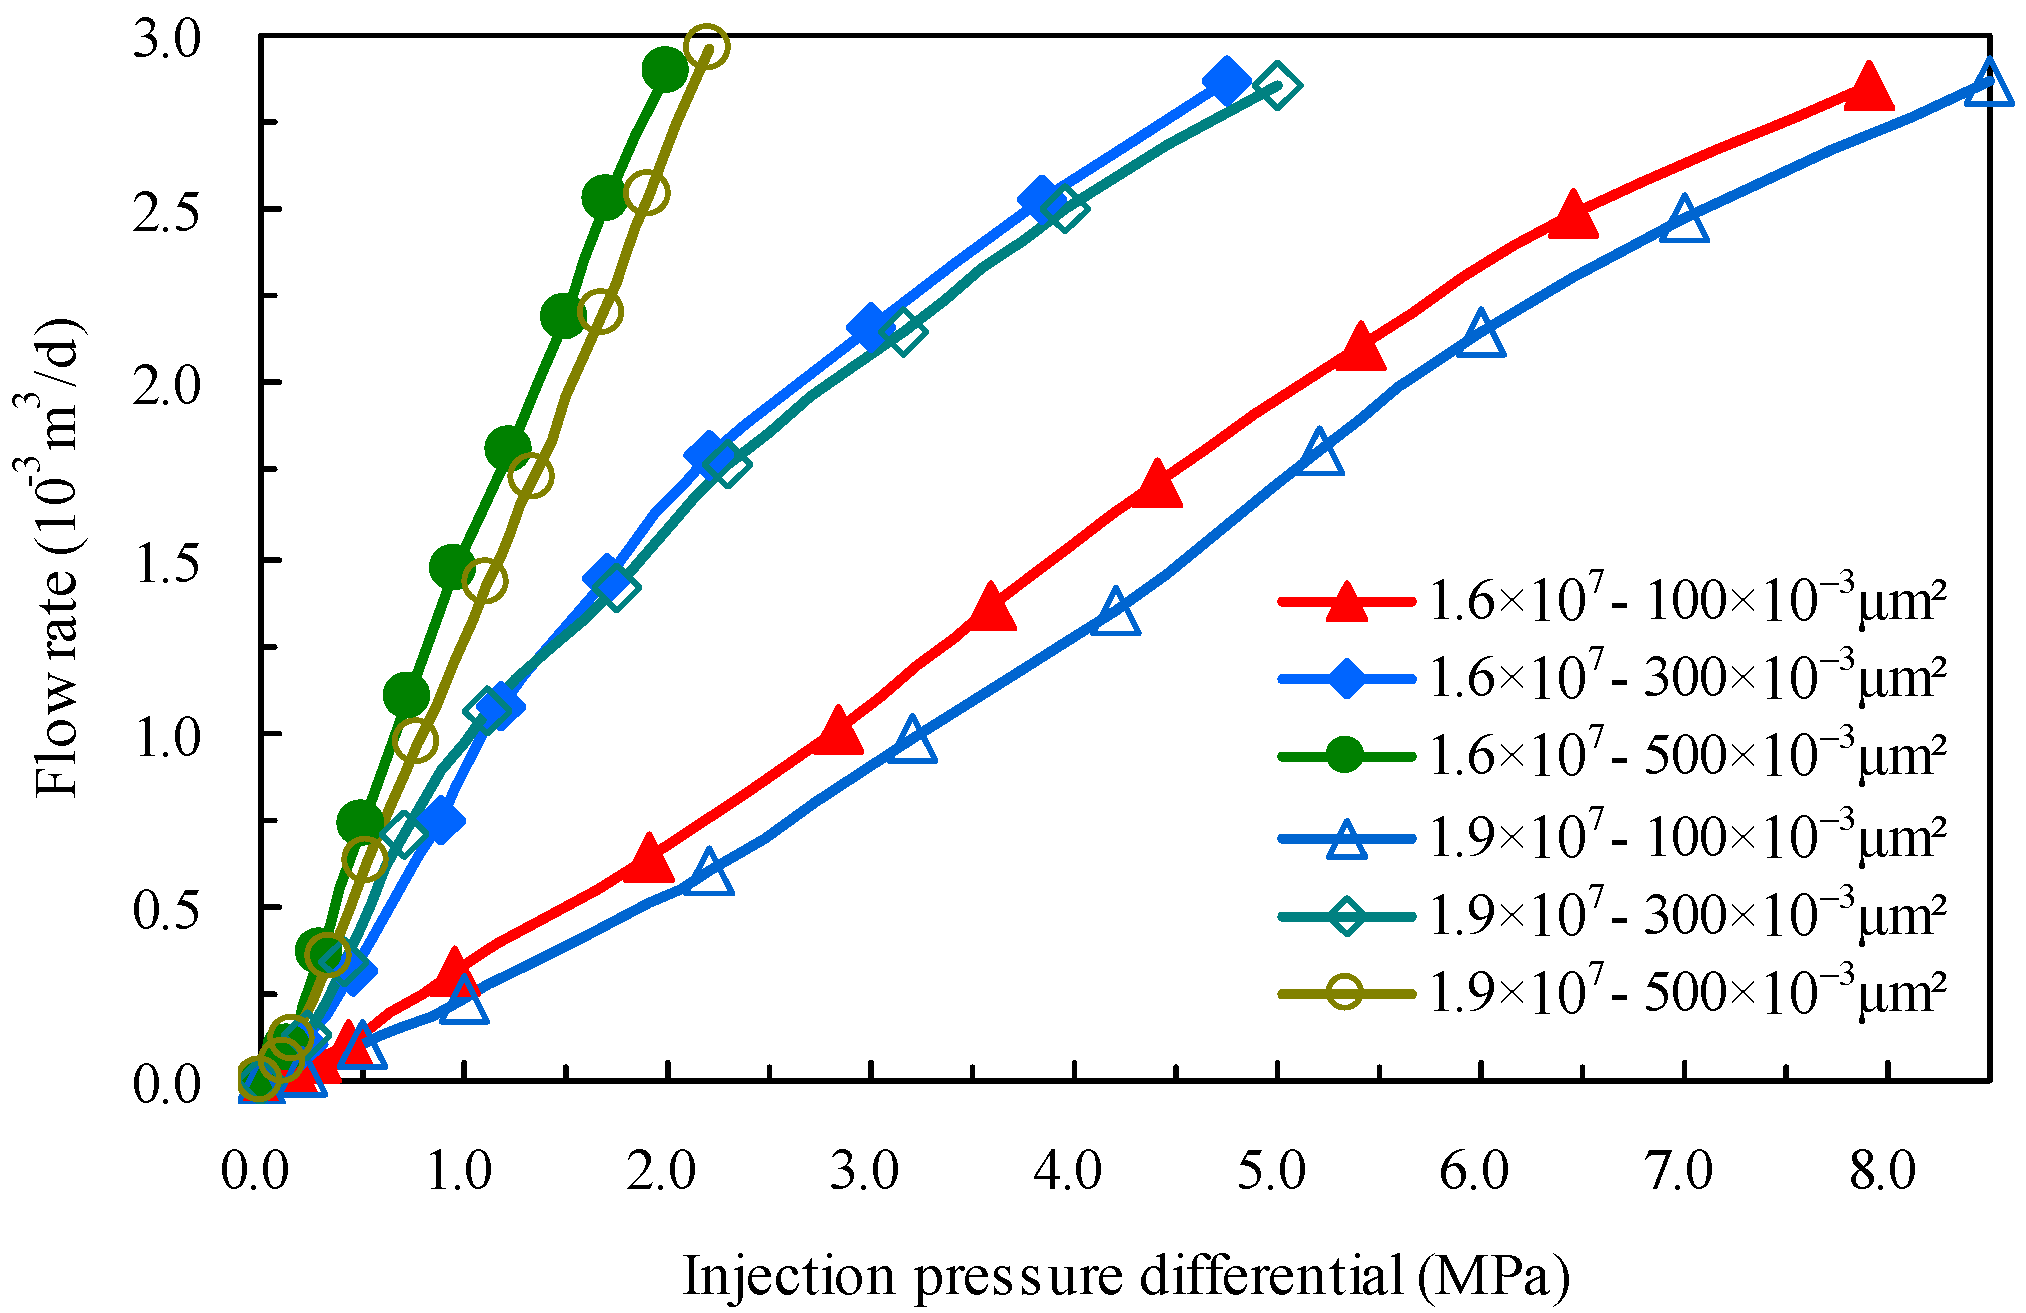
The single-phase flow behaviors of polymer solutions injection through natural cores are shown in Figure 3, Figure 4 and Figure 5. The experimental data show a gradual or steeper increase of pressure during injection, which implies that polymer retention in type II reservoirs is a kinetically controlled process. However, it may be found that the flow behaviors in most injection schemes are all between characteristic curve A and characteristic curve B in Figure 2, which indicates that performing polymer injection is feasible in the development of type II reservoirs. Furthermore, the flow characteristics used for identifying the polymer injection performance is affected by permeability, concentration, and molecular weight of the polymer. As the permeability decreases, there is a significant decrease in the flow rate under the same injection pressure, and the slope reduction of the curves can indicate polymer blockage inside the cores. The injection performance is fairly well in the 500 × 10−3 μm2 cores with a polymer concentration of 1500 mg/L with a molecular weight of 1.6 × 10⁷ Da or 1.9 × 10⁷ Da. However, the irreversible blockage and formation damage definitely occurs in the 100 × 10−3 μm2 cores (Figure 3), the considerable “polymer junk” was observed by the unaided eye at the cores inlet at the end of the flow measurements.
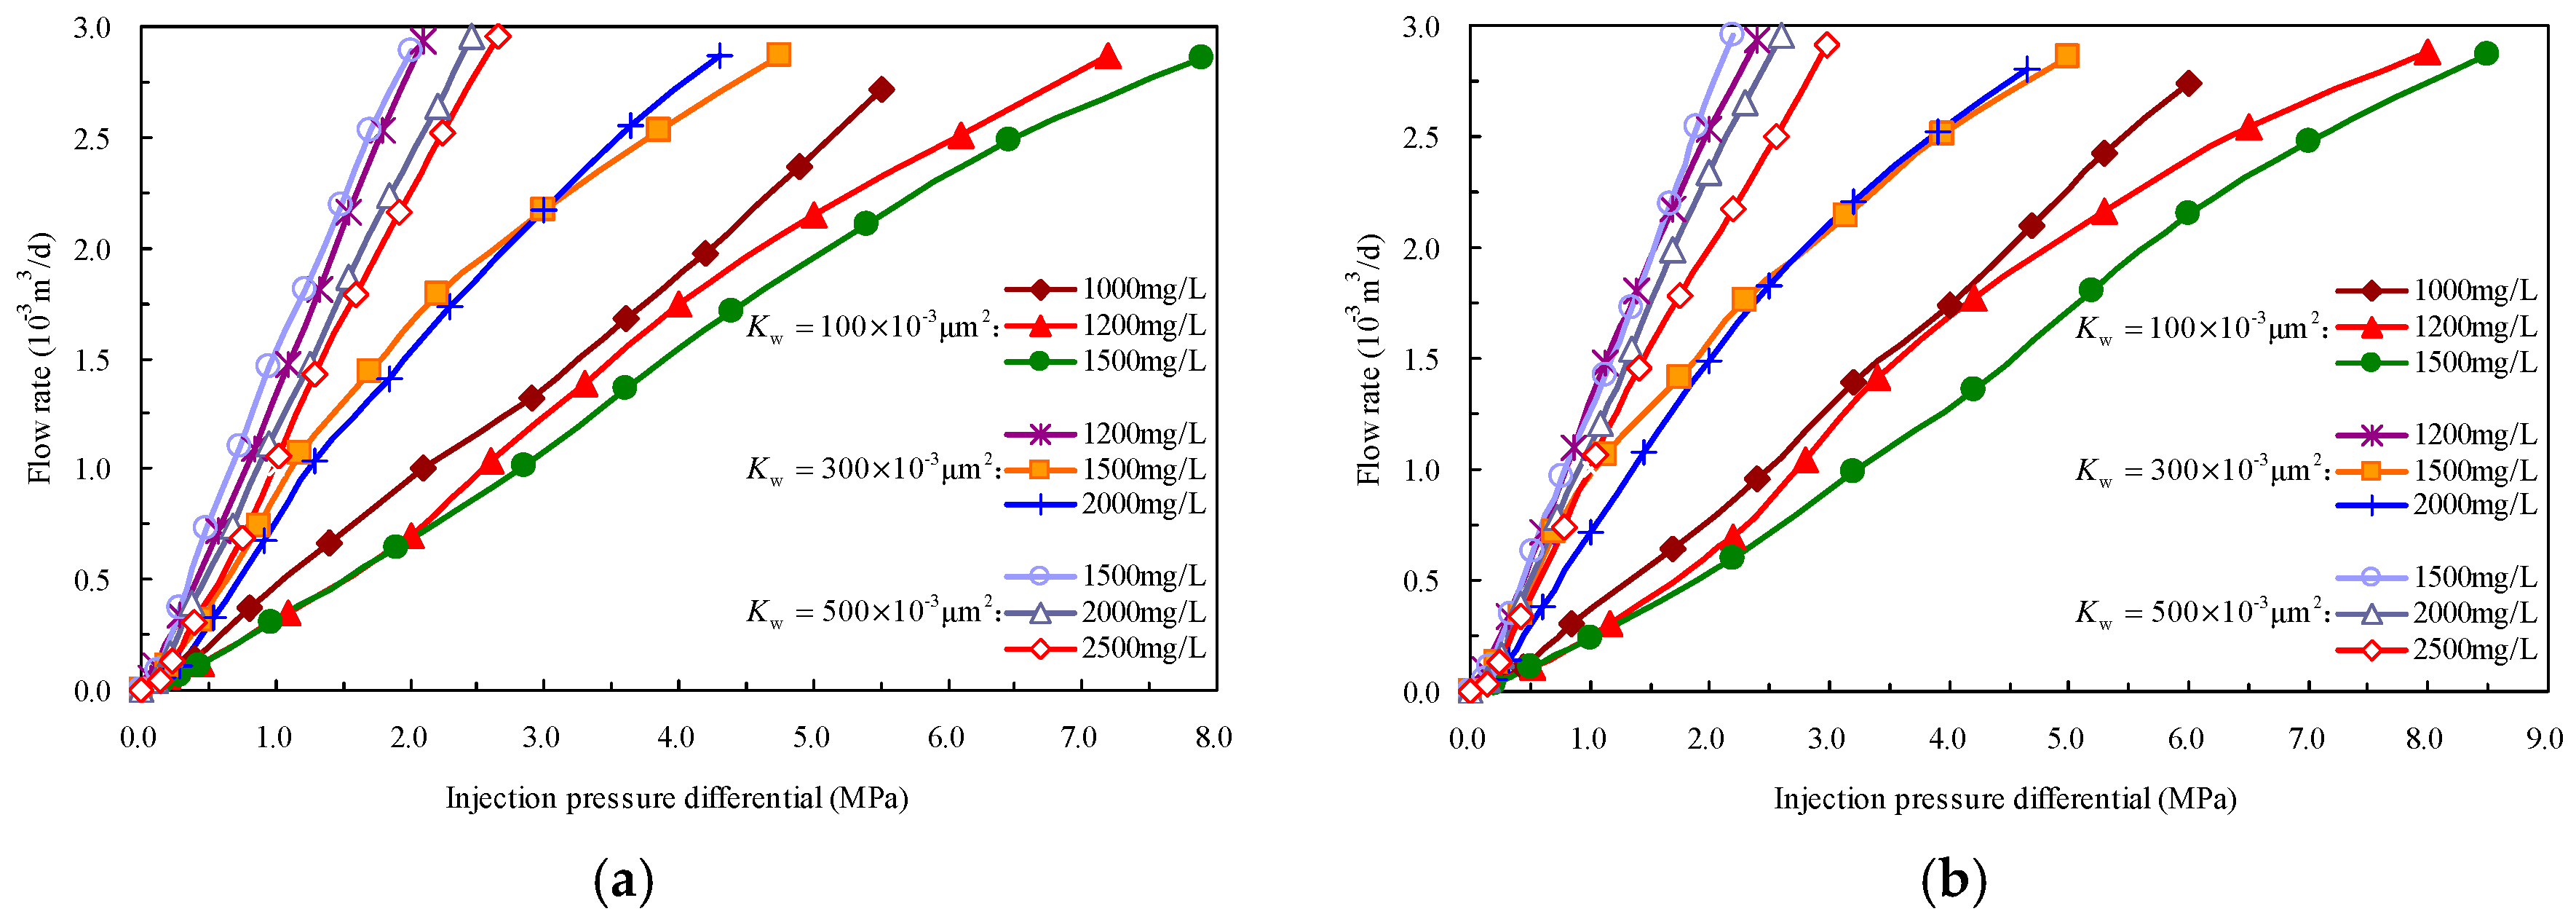
When the polymer molecular weight decreased, the injection performance still improved to a certain extent even though the flow characteristic curves at the same concentration were essentially coincident (Figure 4). This is primarily attributed to the fact that a higher molecular weight will promote mechanical trapping behavior of polymer molecules on the rock surface, which increases the polymer retention in porous media. When the concentration of the polymer solution is reduced, the increased pressure caused by the viscoelasticity is significantly less than the decreased pressure caused by mechanical degradation such that mechanical degradation gains the dominant position, and polymer injection shifts towards the smooth direction, which exhibits better flow characteristics and injection capability, where a slope increase of the curves occurs (Figure 5a,b). As for the cores with a permeability of 300 × 10−3 μm2, the injection performance remains good when the molecular weight increases from 1.6 × 10⁷ Da to 1.9 × 10⁷ Da under the same concentration of 1200 mg/L (Figure 5a,b). However, when it is under the same molecular weight of 1.9 × 10⁷ Da, the polymer injection pressure increases remarkably as the concentration increases from 1200 mg/L to 1500 mg/L (Figure 5b), and the mismatches with the formation are naturally highlighted.
Combining the experimental design matrix, the polymer rheology behaviors in injection schemes are comparable, which reveals that the adsorption behavior of a polymer on the rock particles intensifies as the concentration increases. This is agreement with the existing knowledge that the increase in the bottomhole pressure during the early stage of polymer injection can be attributed to the shear-thickening rheology at high velocities experienced by viscoelastic HPAM around the wellbore and the permeability reduction caused by polymer adsorption [24]. Regarding type I reservoirs with a high permeability, we can conclude from these single-phase flow behaviors that the injection performance of polymers in type II reservoirs are all associated with permeability, the molecular weight of the polymer, and the designed polymer concentration, where the injection capability is remarkably affected by permeability, followed by polymer concentration and polymer molecular weight. The result is also in agreement with the aforementioned RRF measured results and indicates that formation damage, primarily from polymer adsorption, cannot be ignored in polymer EOR of type II reservoirs. The identification and partition of the blockage risk will help to select the best plan to obtain the highest oil recovery in a type II reservoir system, and this was not involved in the similar work which targeted type I reservoirs reported by Wang et al. [23].
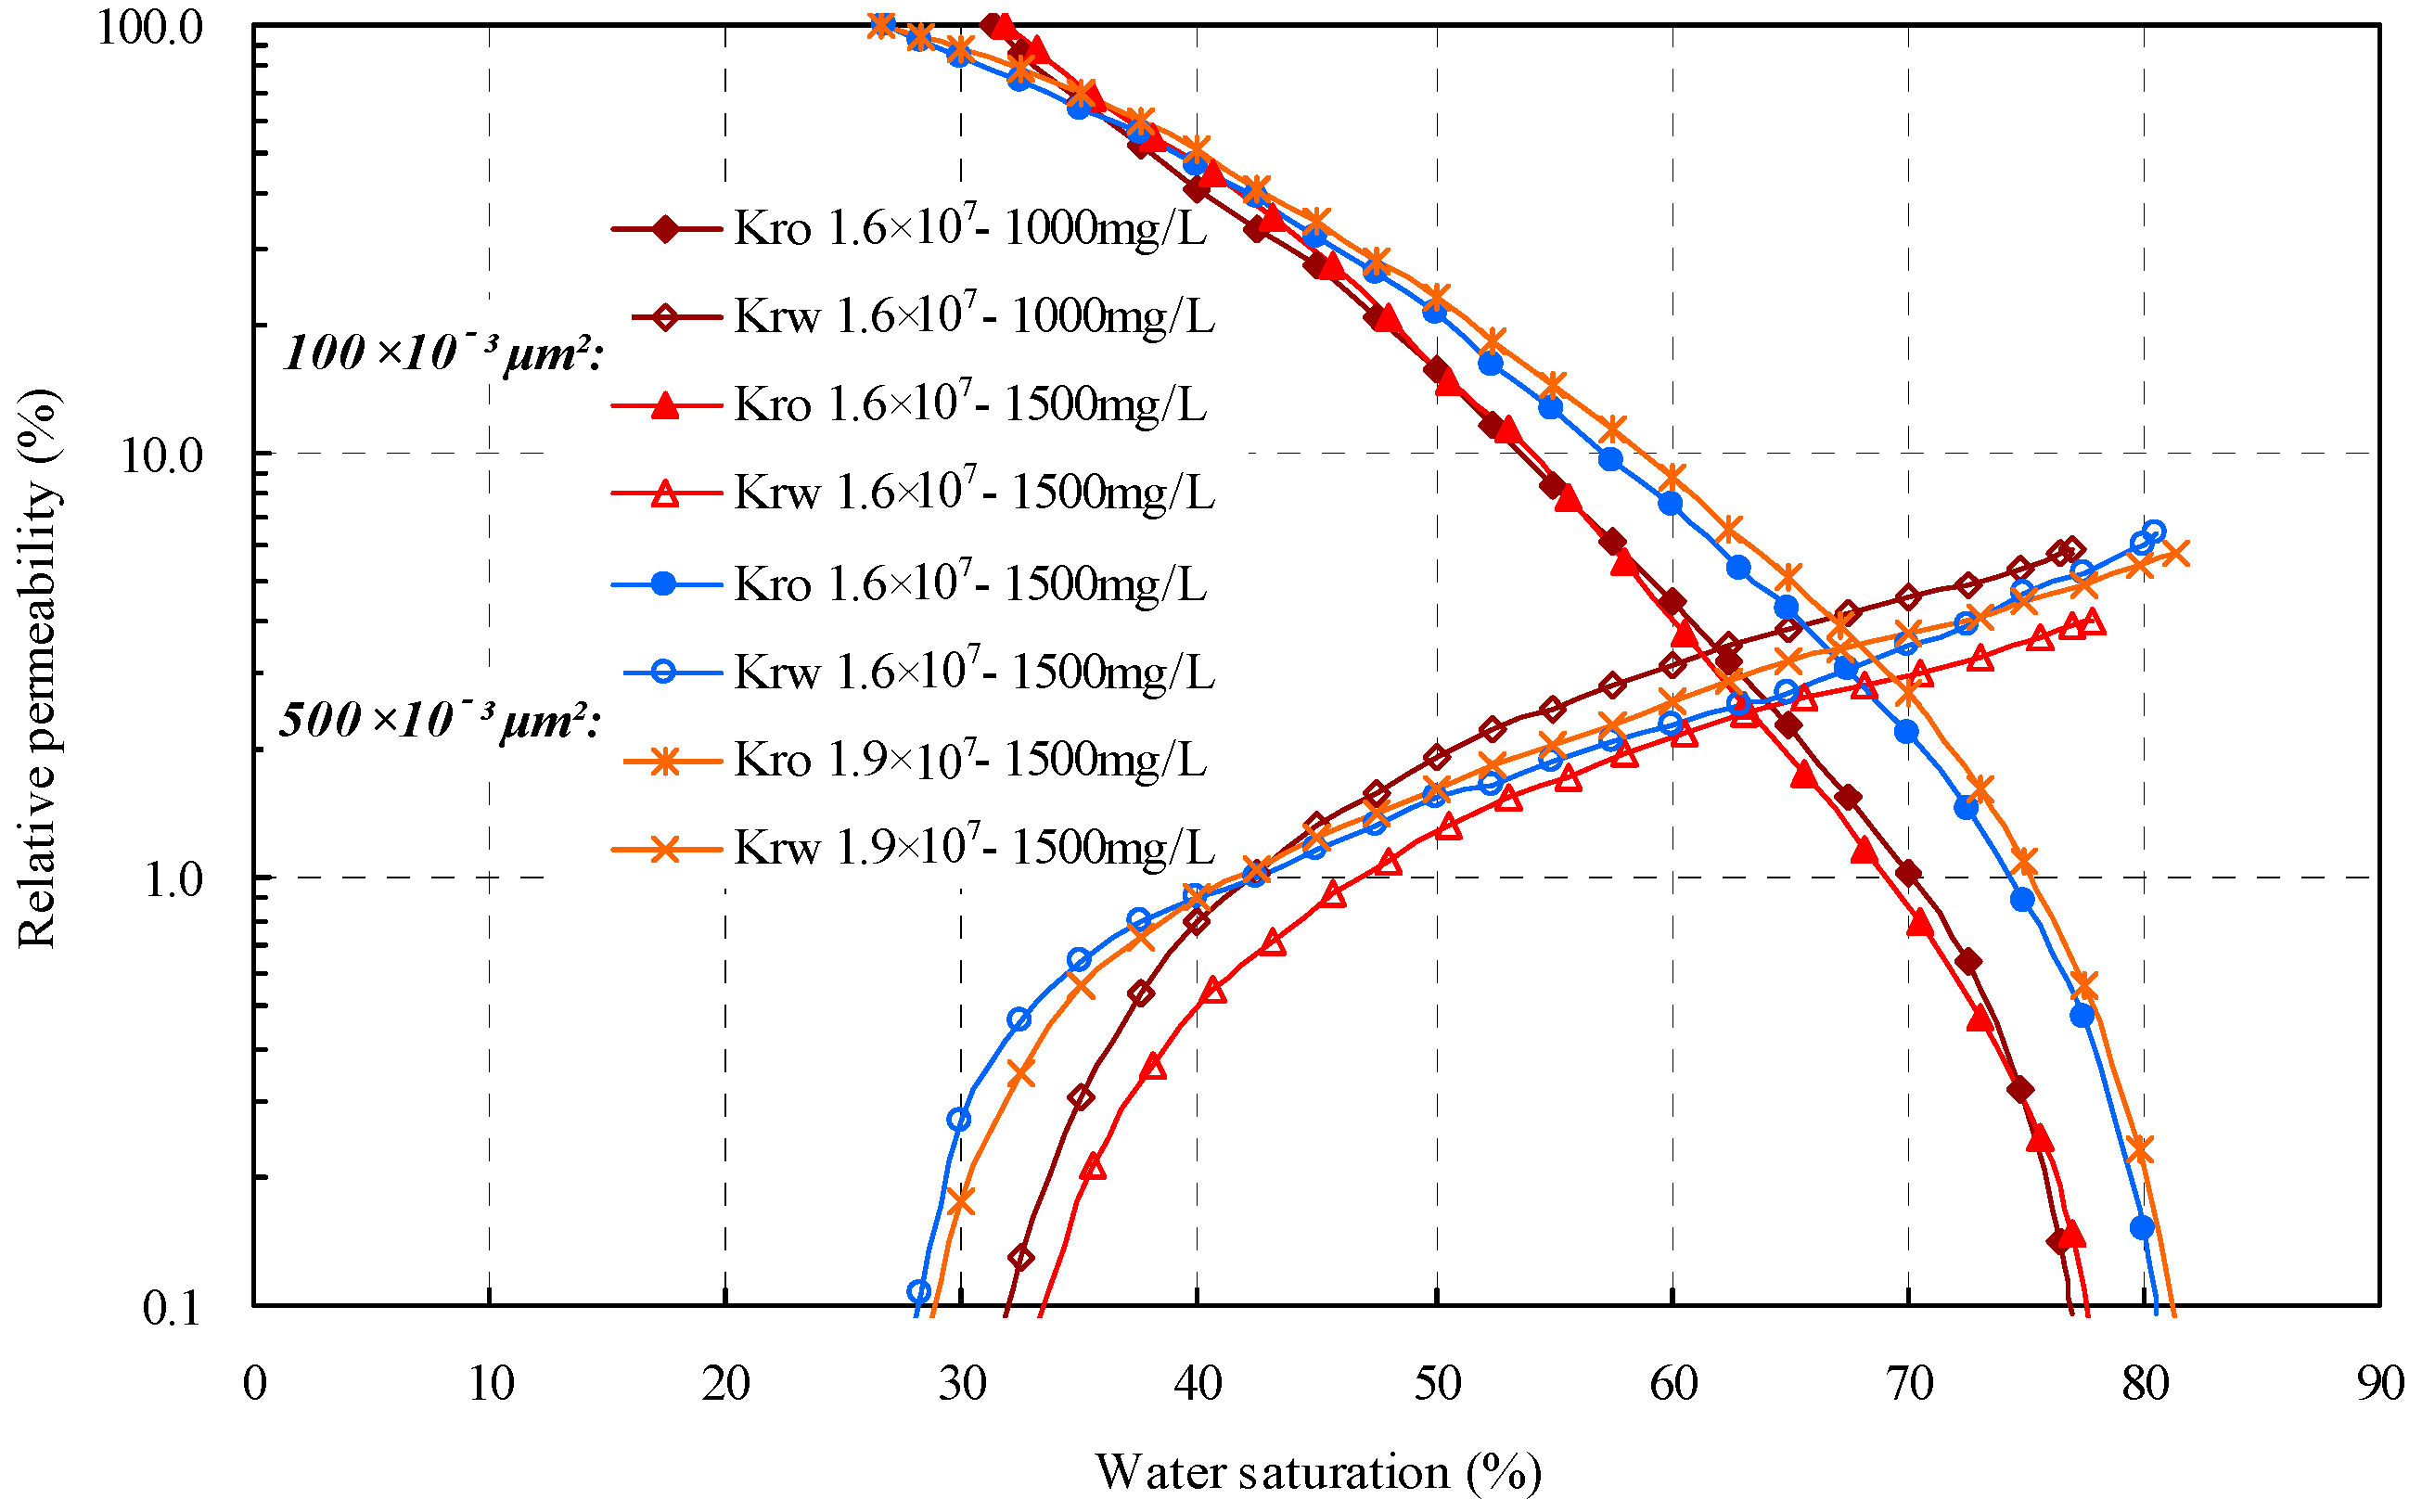
Relative permeability data are essential petrophysical data required for characterization of multiphase flow and polymer adsorption in type II reservoirs. Figure 6 shows the oil and polymer relative permeabilities plotted as functions of water saturation, where the curves all begin with the lowest water saturation and proceed to the right; the curve monotonically increases or decreases, which occurs in parallel with the reduction of the saturation of the displaced phase. The injection of the polymer appeared to have an effect on both the water and oil relative permeability measured subsequently. Although a parallelism in the Krp curves was observed in the relative permeability comparisons, it is evident that the presence of the polymer in the water phase can lower the water relative permeability to different degrees over the entire measured water saturation range; the measured polymer solution endpoint relative permeabilities were all lower than 0.1.
In contrast to the oil-phase flow behavior, it can be concluded that the entire effect of contact and adsorption of higher polymer concentration was to reduce water mobility significantly, which resulted in a much lower water relative permeability curve than that obtained from the lower concentration polymer contact. Additionally, these two-phase flow characteristics are more obvious in the cores with permeabilities of 100 × 10−3 μm2 than in cores with permeabilities of 500 × 10−3 μm2. This indicates that the injection performance of the polymer solution is still strongly related to the matching relationship between the polymer concentration and permeability in two-phase flow of type II reservoirs and reveals the permeability level and polymer properties would produce evident differences in two-phase flow behavior.
As can be seen in Table 3, typical RRF results obtained from the cores, which underwent a procedure where the polymer consistently decreased the residual oil saturations, are similar to the adsorption test data of single-phase flow, where the relative deviations are not greater than 15%. Additionally, the results are in good agreement with a previous suggestion that wetting preference and the correspondingly different microscopic distribution of the residual oil has only a slight effect on the residual resistance coefficient [41,42]. The matching relationship, which is obtained from the adsorption behaviors and flow experiments in single-phase flow, can be used address actual two-phase flow problems in type II reservoirs with polymer EOR. Furthermore, it can be seen that flushing the cores with a polymer consistently decreases the residual oil saturations; furthermore, with the enhanced core permeability and increased molecular weight and concentration, there is a relatively low initial point and a relatively high termination point of the relative permeability curves; this effect shifts the equal points of Krp and Kro toward higher water saturations. Because the injection performance was affected, the final residual oil saturation is also related to the permeability, polymer molecular weight, and concentration, where the correlation is more strongly affected by permeability, concentration, and molecular weight according to this order.
4.3. Observation of Core Pore Structures
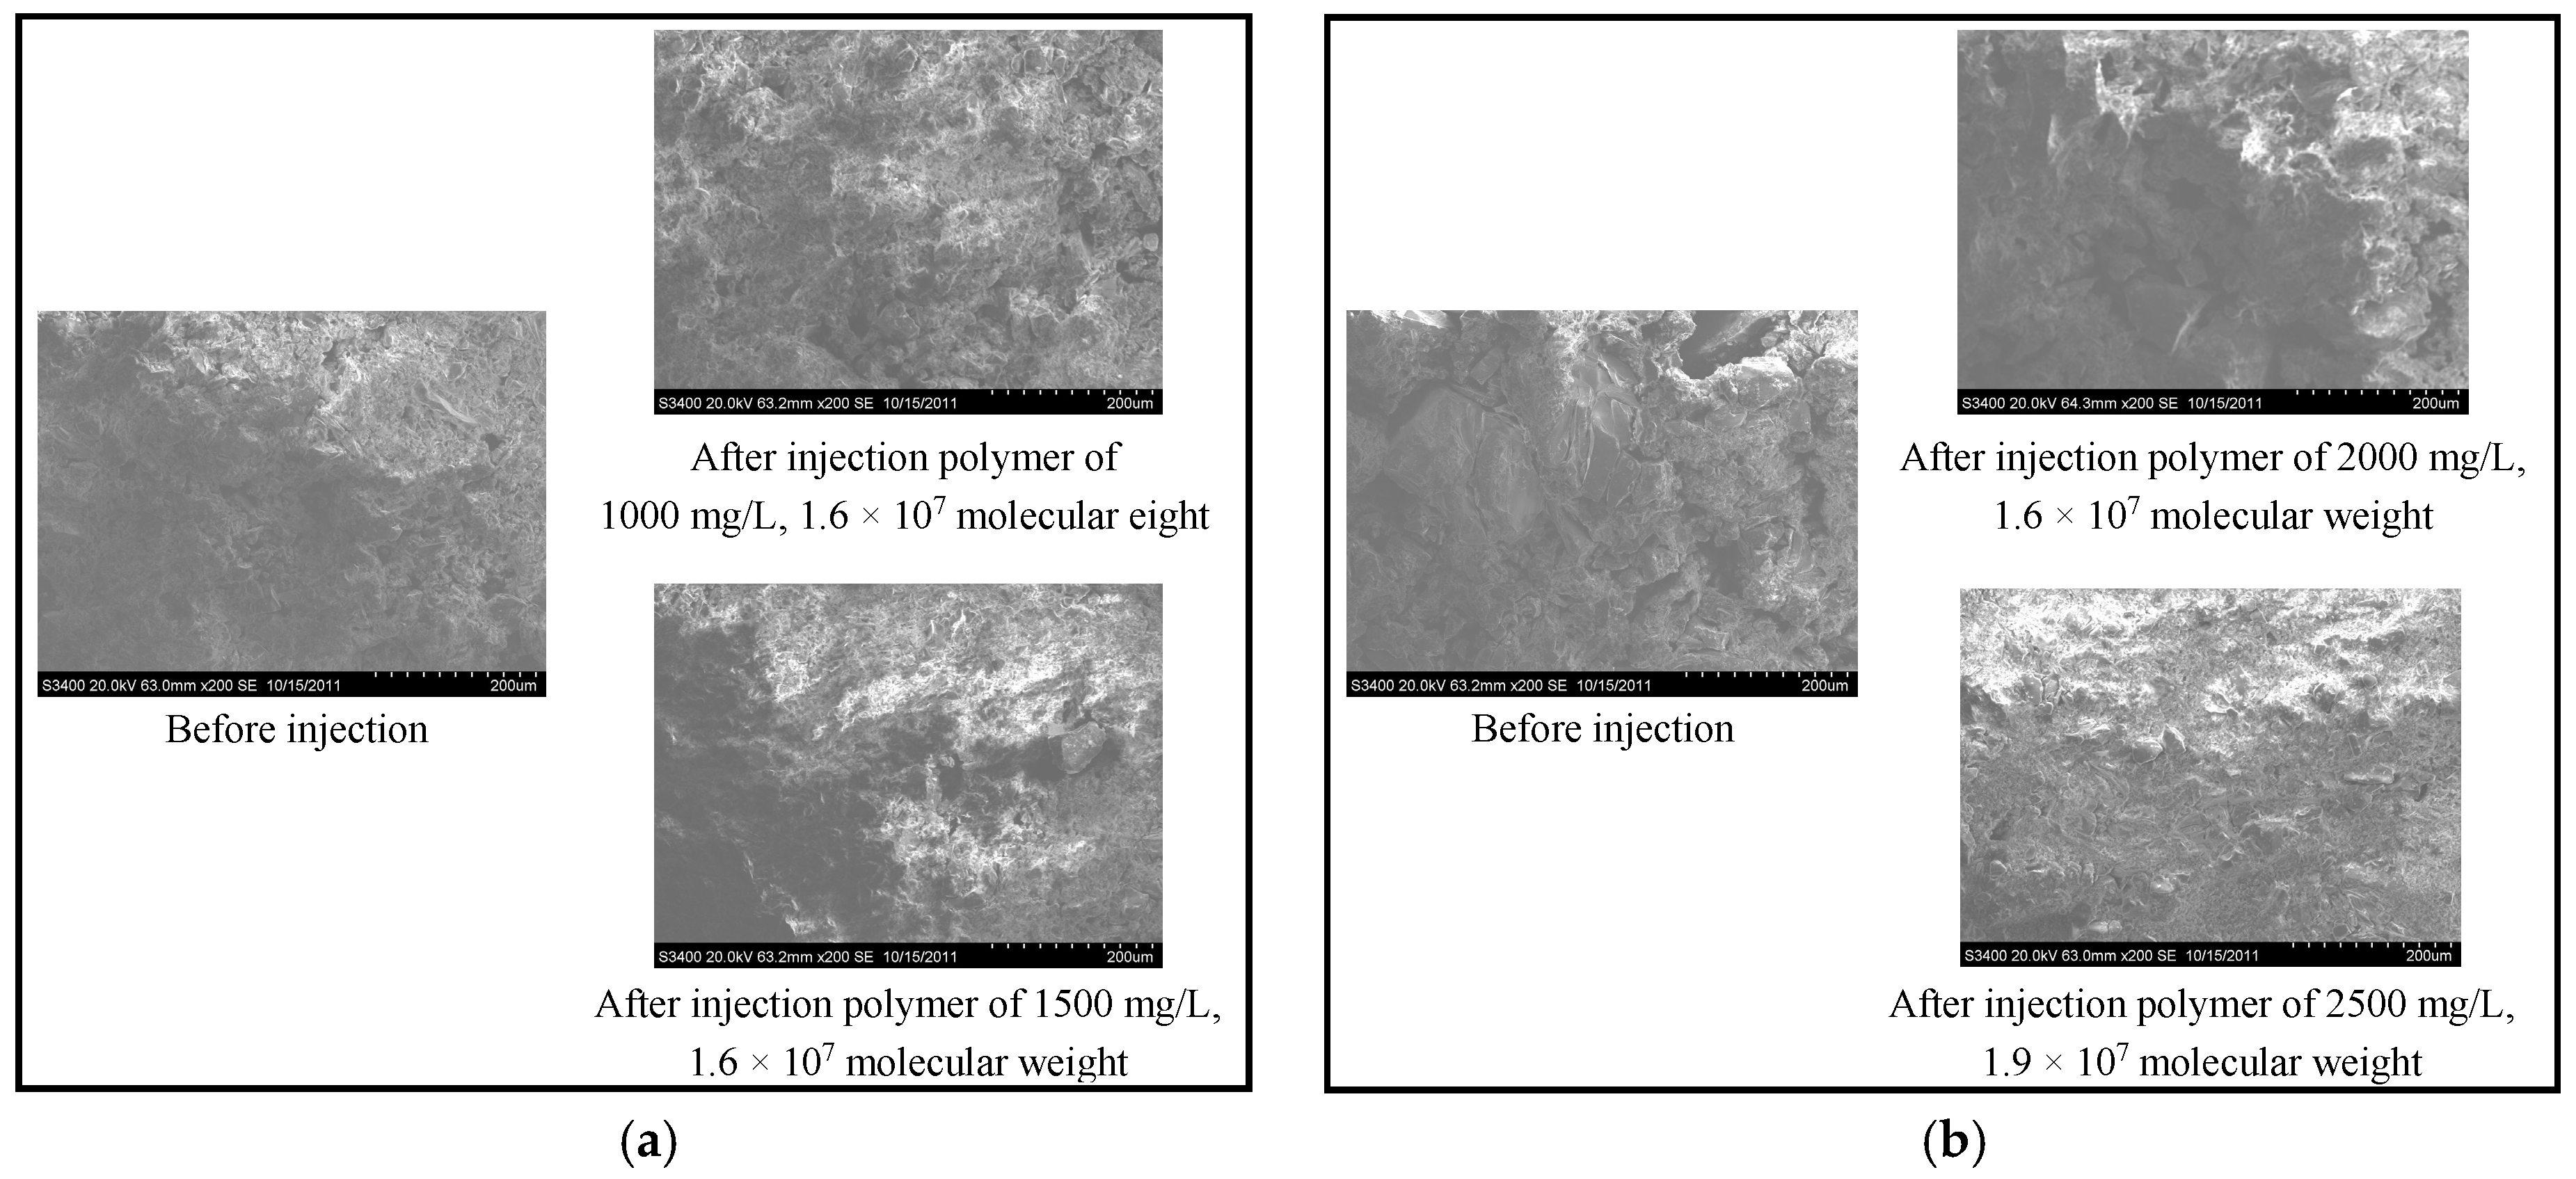
To further validate the distinction among smooth injection, difficult injection, and irreversible blockage emergence, core pore structures under typical injection schemes were observed, and the pore features and mineral morphology are compared before and after polymer retention after the flow characteristics were measured. There is a significant interaction between polymer molecules and sandstone grains, which intercepts the flow path to inject displacing fluid at a constant pressure. Due to mechanical trapping and adsorption after polymer injection, the sharpness of the mineral grains decreases, the mineral morphology becomes blurred, and the pore-throat connection becomes poor compared with the pore surface before polymer injection. This will naturally increase the flow resistance of the polymer and subsequent water injection and, hence, reduce the permeability.
As shown in Figure 7, for the core permeability of 100 × 10−3 μm2 (Figure 7a) and 500 × 10−3 μm2 (Figure 7b), polymer molecules can be captured at the pore-throat, such that the adsorption range expands and the thickness enlarges, which increases retention, remarkably decreases the effective pore radius, and irreversible blockage emerges in the medium permeability type II reservoirs after injecting a polymer slug with a molecular weight of 1.6 × 10⁷ Da at a concentration of 1500 mg/L and a molecular weight of 1.9 × 10⁷ Da at a concentration of 2500 mg/L, respectively. The observations reveal that a polymer with a high molecular weight and high concentration are attractive; however, the polymer either can damage the pore space or might not be able to flow through small pores. This is also in agreement with a high RRF and poor injection performance obtained from the above flow experiments.
4.4. Establishment of Matching Relation Schema
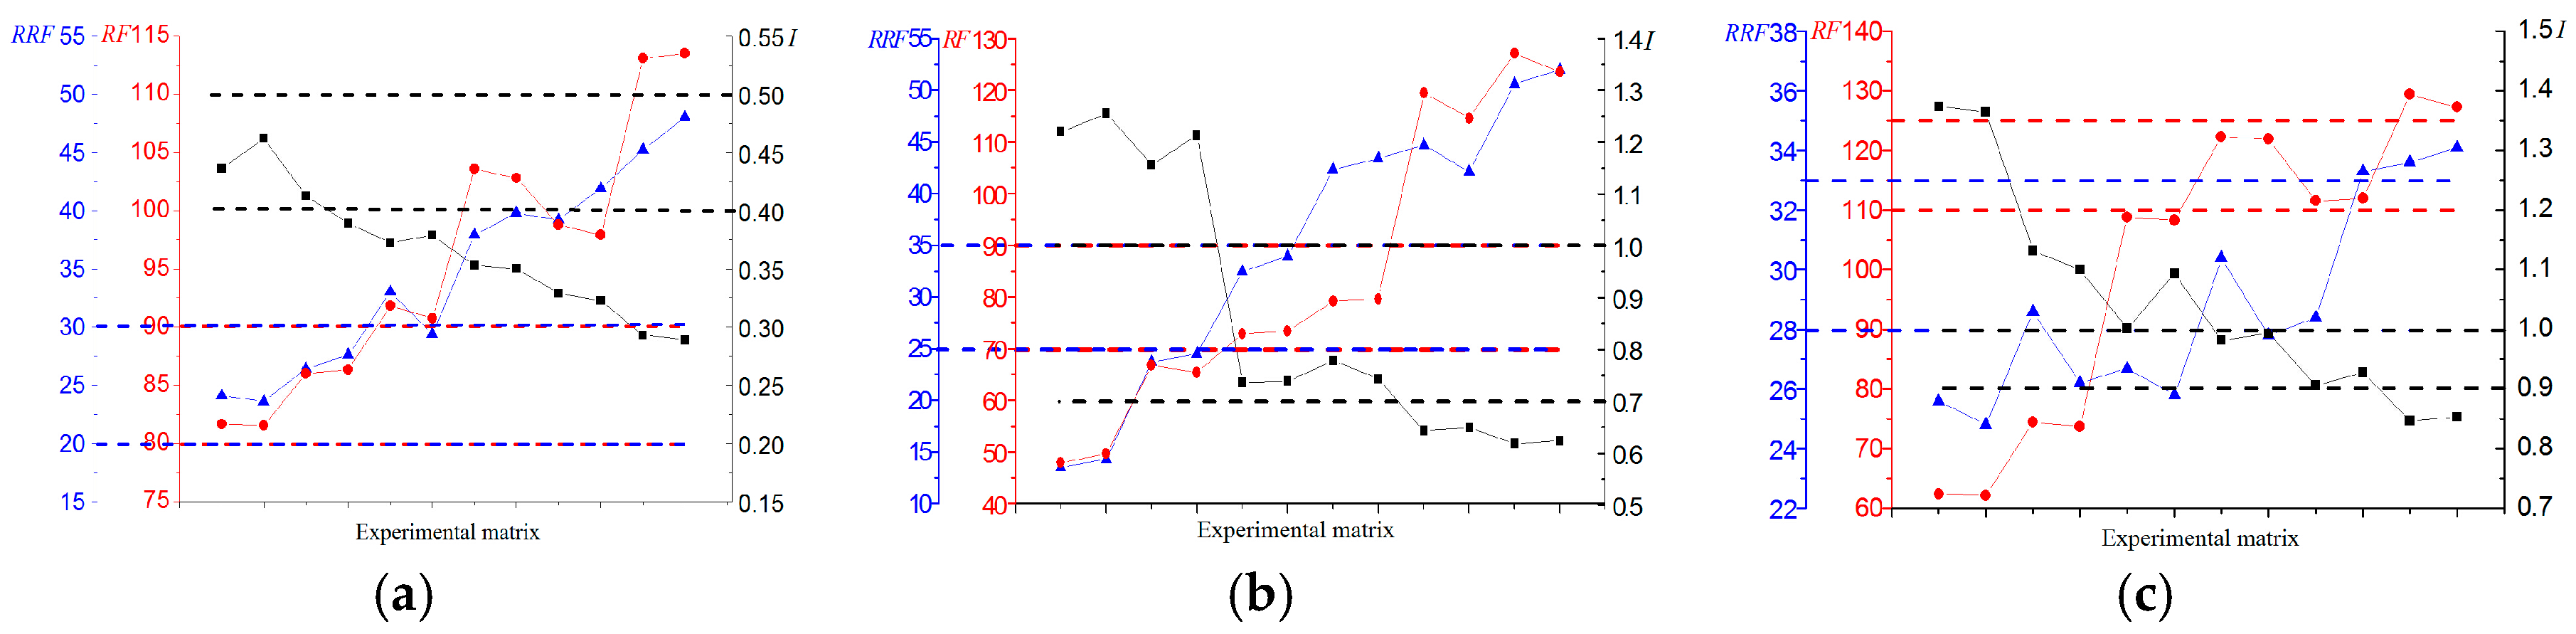
As the single-phase and two-phase flow experiments have performed, the polymer solutions of 30 PV were injected into the cores which ensured the reliable assessment to polymer performance in heterogeneous type II reservoirs. Collected RF, RRF, I obtained from the polymer adsorption-induced permeability reduction evaluation and flow characteristics measurements, as shown in Figure 8, there appears to be a positive correlation between the resistance coefficient and residual resistance coefficient and a negative correlation between the injection capability factor and residual resistance coefficient with the adjustment of the polymer injection parameters for cores of type II reservoirs. Then, RF, RRF and I obtained from all of the experimental injection schemes would be used as the statistical analysis parameters.
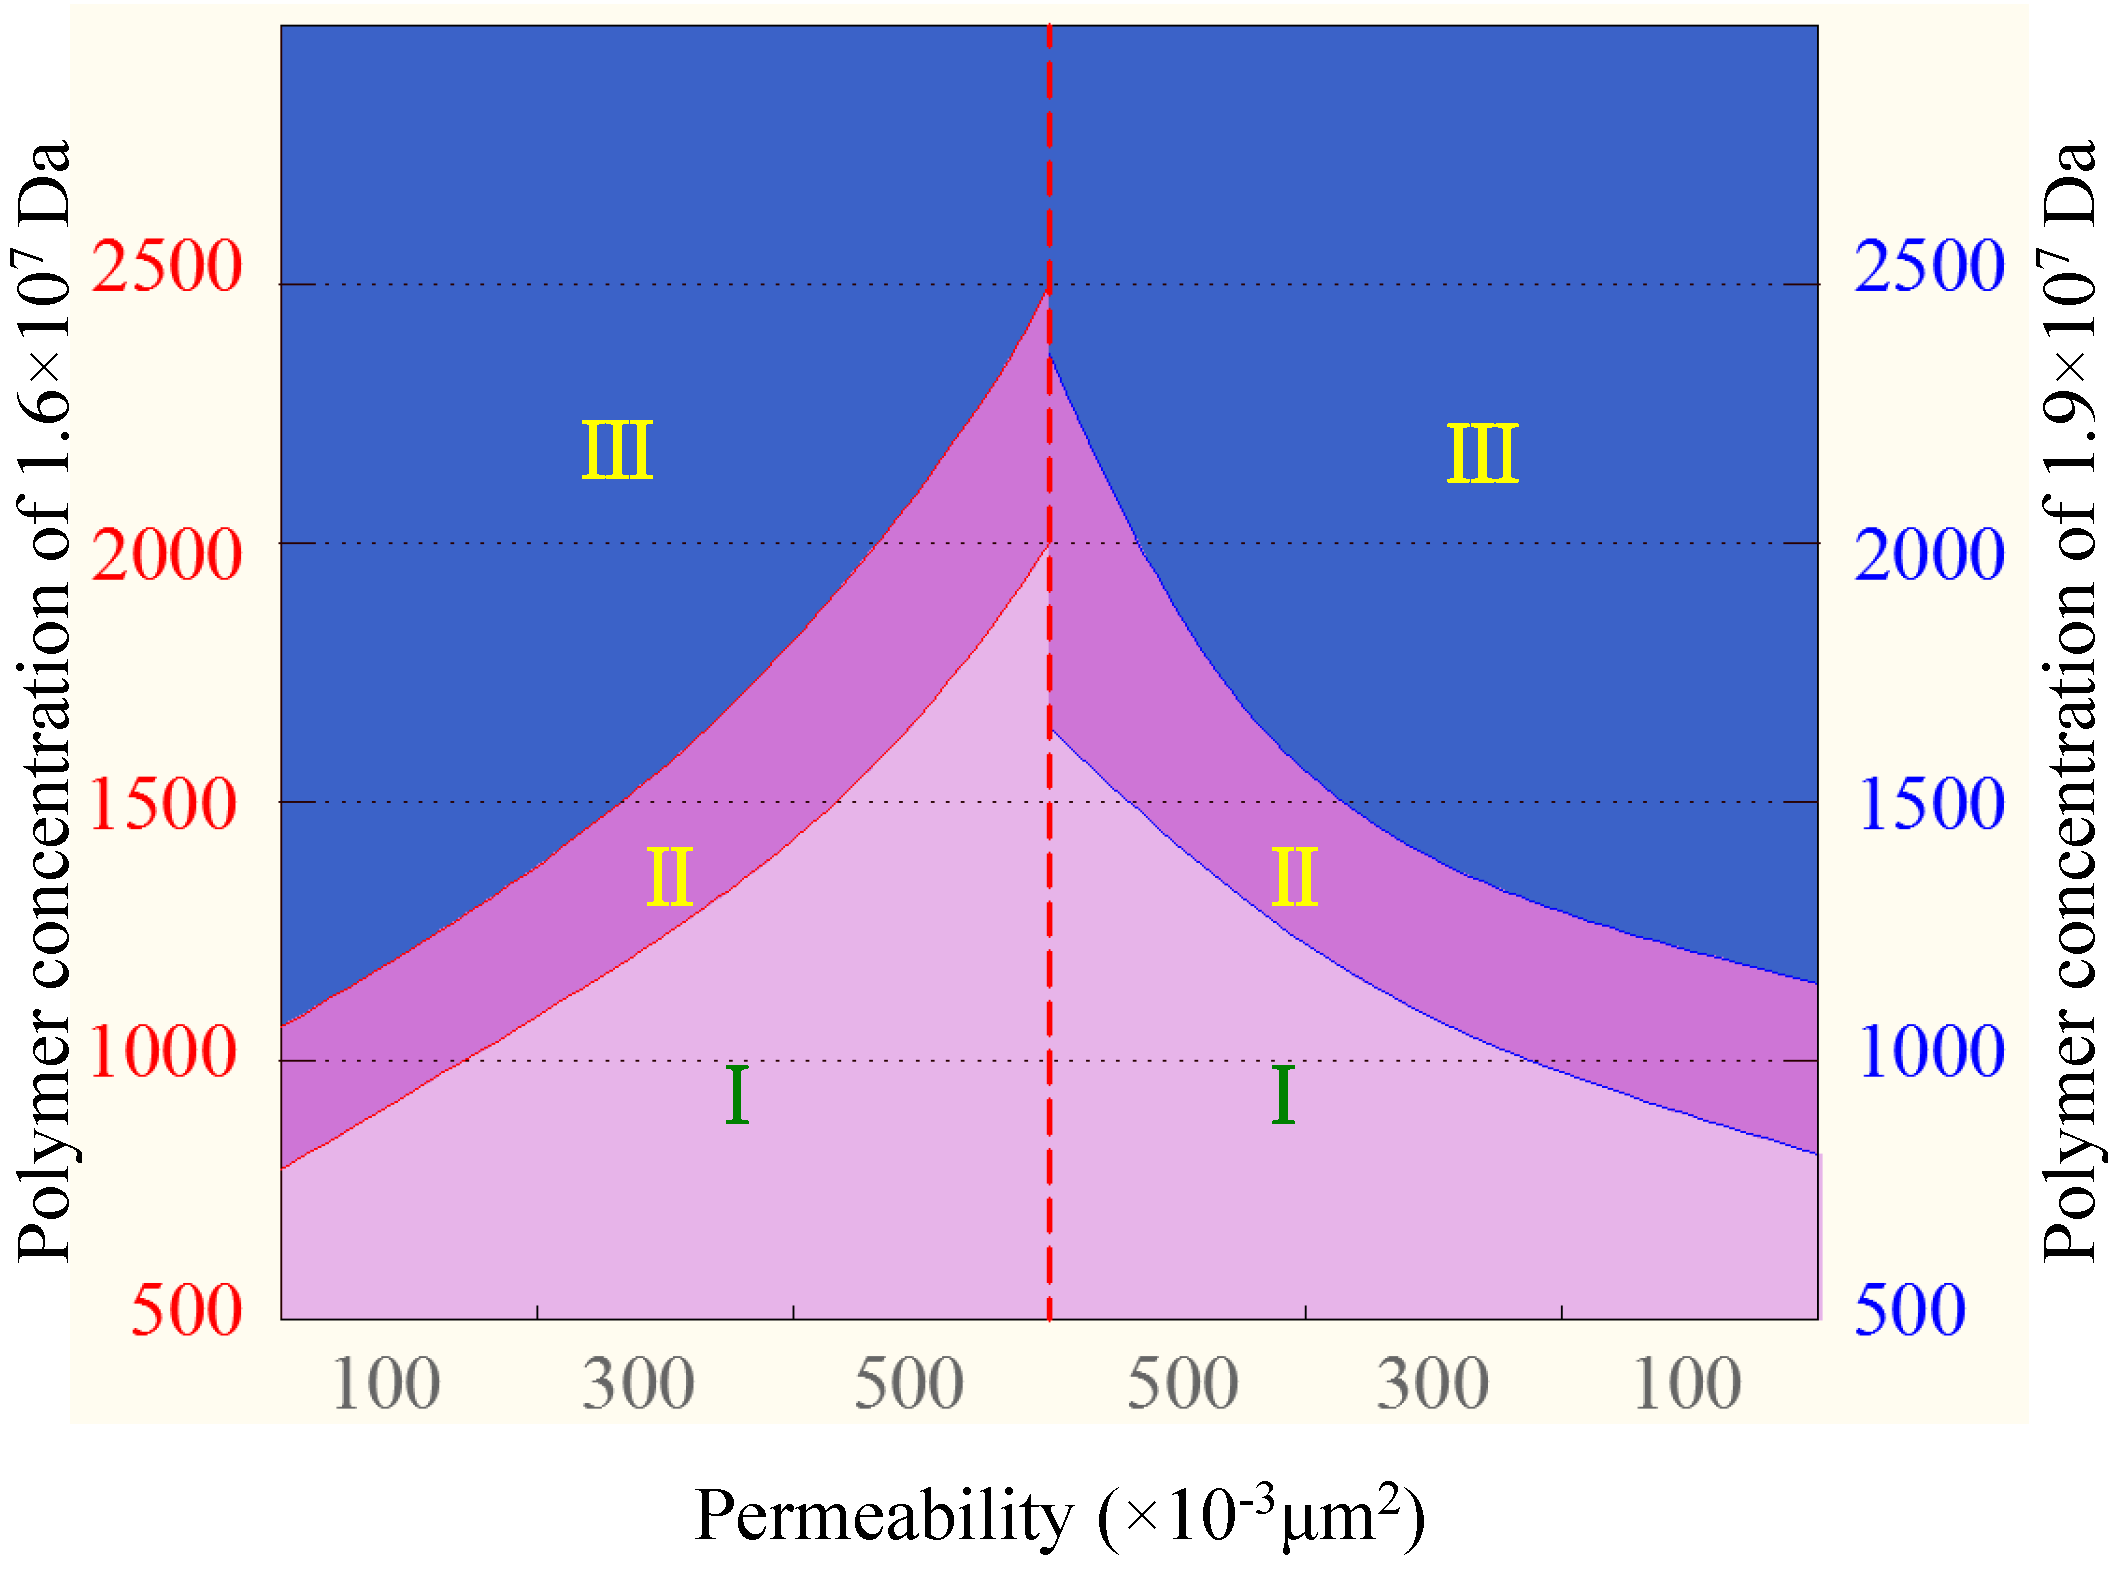
The identification limits of polymer smooth injection, difficult injection, and irreversible blockage emergence in different permeability reservoirs are partitioned based on the correlation statistics of injection performance evaluation parameters. In the 100 × 10−3 μm2 permeability reservoir, the identification limits of the formation blockage are RF ≥ 90, RRF ≥ 30 and I ≤ 0.4, and the identification limits of difficult injection are 80 < RF < 90, 20 < RRF < 30, and 0.4 < I < 0.5. Regarding the 300 × 10−3 μm2 permeability reservoir, the identification limits of the formation blockage are RF ≥ 90, RRF ≥ 35, and I ≤ 0.7; the identification limits of difficult injection are 70 < RF < 90, 25 < RRF < 35, and 0.7 < I < 1.0; and the identification limits of smooth injection are RF ≤ 70, RRF ≤ 25, and I ≥ 1.0. In the 500 × 10−3 μm2 permeability reservoir, the identification limits are RF ≥ 125, RRF ≥ 33, I < 0.9, 110 < RF < 125, 28 < RRF < 33, 0.9 < I < 1.0, and RF ≤ 110, RRF ≤ 28, I ≥ 1.0, respectively. Then, a matching relation schema is established that considers the permeability, polymer molecular weight, polymer concentration, and dilution water for polymer system preparation, as shown in Figure 9; a scientific design of a polymer flooding project for type II reservoirs can be realized with the help of the relation schema, and formation damage in polymer injection can be avoided.
4.5. Oil Displacement Effect under the Matching Relationship
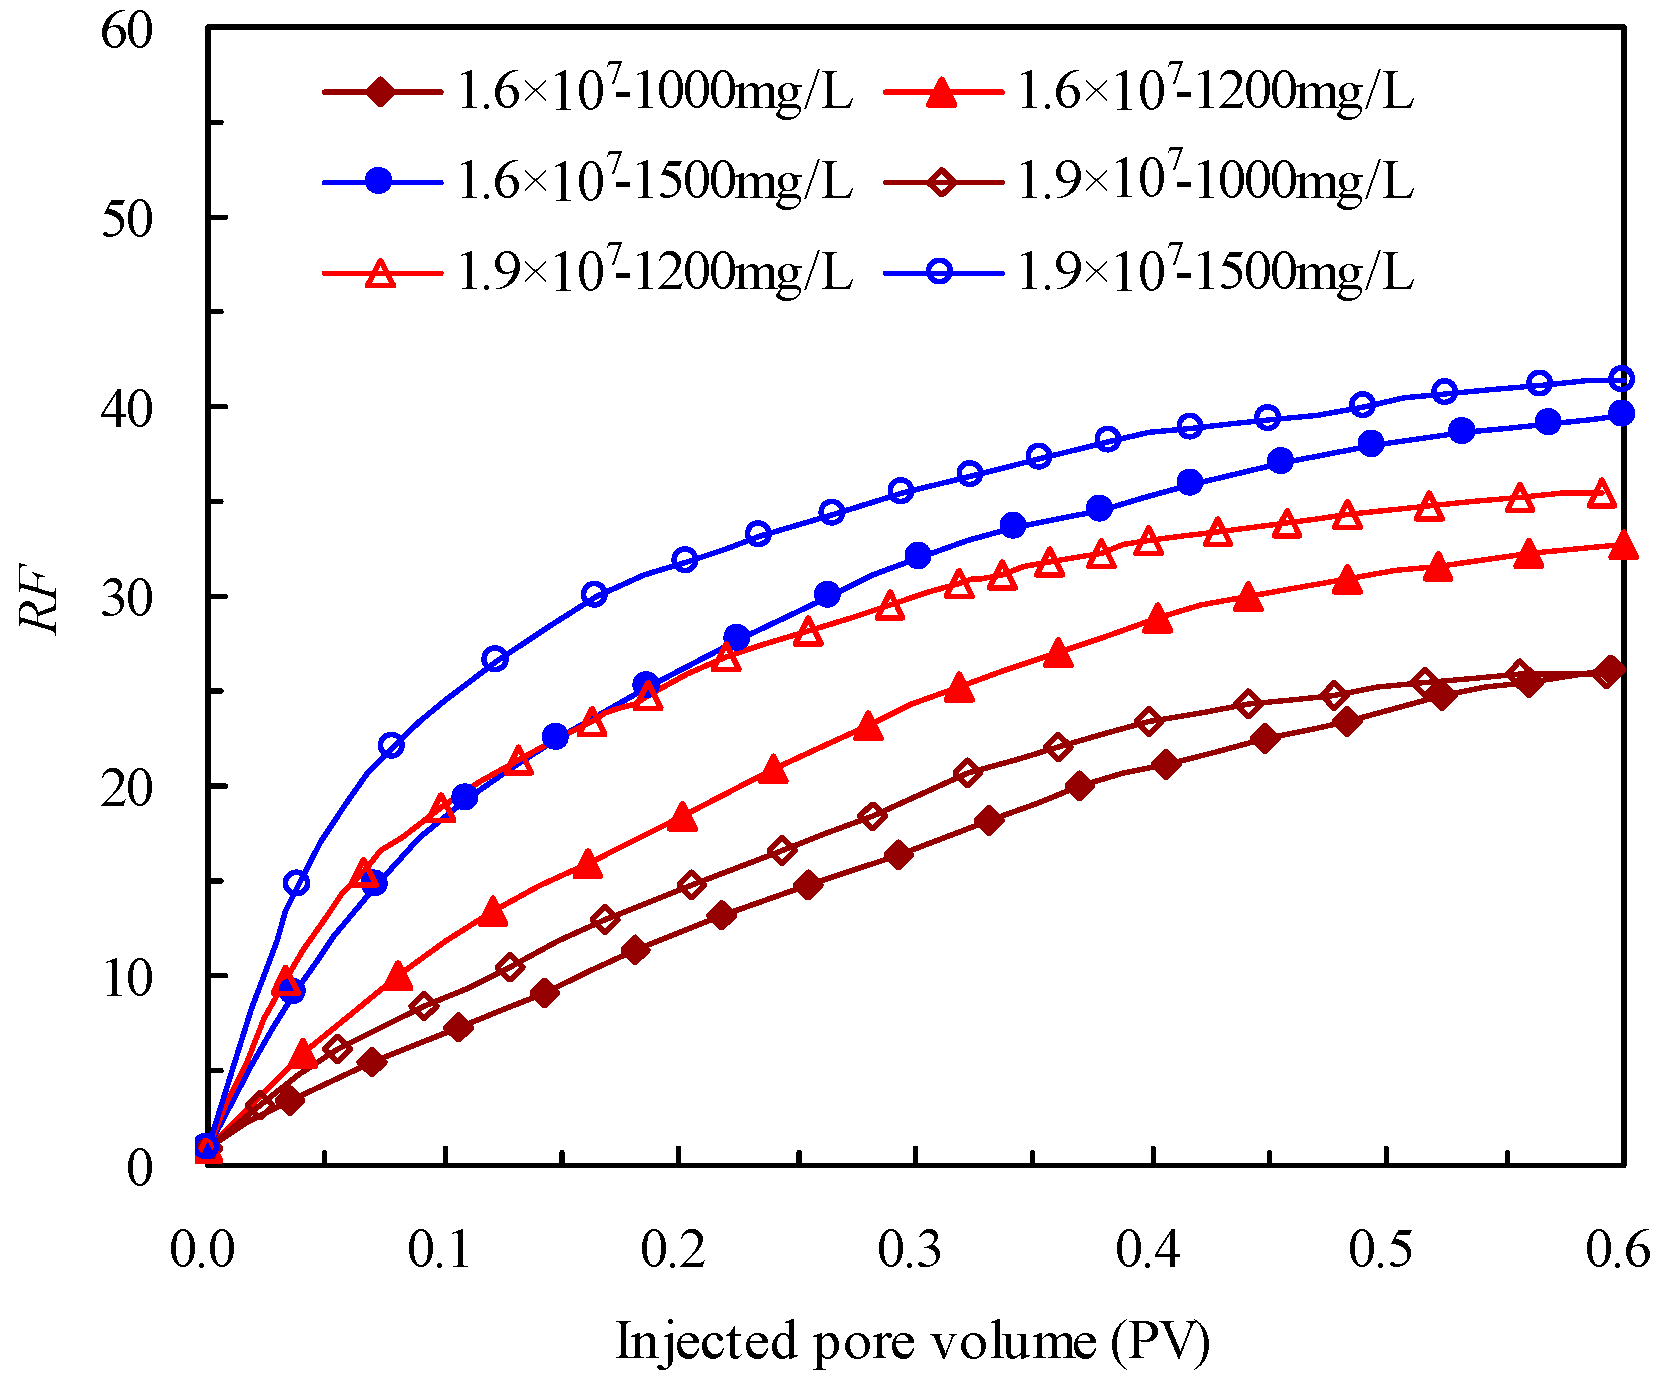
Under the aforementioned matching relationship, two different molecular weights and three different concentrations of polymer solutions are used to measure oil recovery by experiments of “co-injection and separated-layer production” with three parallel cores. The results of these flood tests are presented in Table 4 and Figure 10 and indicate that polymer injection increases the oil recovery of type II reservoirs after water flooding by improving the mobility ratio and adjusting the injection profile; the change in RF is relatively stable, which also means that the increase of injection pressure is acceptable. The RF data are also in agreement with the distribution of polymer injection performance evaluation parameters obtained from the single-phase flow characteristics measurements, and it can be further inferred that the polymer adsorption behavior and polymer injection performance are affected more significantly by the concentration than by molecular weight in type II reservoirs.
Under equivalent original oil saturation for oil recovery by water flooding and polymer slug, the EORs of polymer flooding are 9.96%, 11.84%, and 13.17% OOIP, respectively, for polymer concentrations of 1000 mg/L, 1200 mg/L, and 1500 mg/L with a molecular weight of 1.6 × 10⁷ Da, and 11.35%, 12.15%, 15.08% OOIP for polymer concentrations of 1000 mg/L, 1200 mg/L, and 1500 mg/L with a molecular weight of 1.9 × 10⁷ Da. The oil displacement effect reveals that the physical adsorption may only affect the polymer front velocity and has only a slight impact on the flow concentration, which dominates the polymer viscoelasticity under the matching relationship.
Furthermore, the control and adjustment of the injection profile by polymer injection is noticeable; a significant profile reversal behavior appeared in the cores with a low permeability of 100 × 10−3 μm2. The diversion ratio increases from less than 10% in the water flooding stage to 15–20%, and the average rate of the diversion ratio is adjusted to 5.0:3.0:2.0 from 6.0:3.0:1.0 in polymer flooding with a molecular weight of 1.9 × 10⁷ Da at a 1500 mg/L concentration, which will definitely improve the sweep efficiency, the formation of a favorable water content drop, and additional oil recovery. The result reveals that polymer flooding for EOR under the matching relationship in heterogeneous type II reservoirs is worth pursuing. These results are in agreement with the effect of polymer adsorption and mobility control on additional oil recovery that was investigated by Mishra et al. [43]. Additionally, the result is also supported by a previous study published by Maitin [44], where the laboratory investigations, simulation studies, and a pilot test in the oilfields of a North German sediment basin produced an incremental recovery of 8–22% OOIP. According to the oil displacement effect, without consideration for the one-time investment and the consumption of electricity and heat in the production and operation, the cost of oil produced by the appropriate polymer shows a normal distribution with the average value of 5.2941 $/bbl.
4.6. Injection-Production Status of Heterogeneous Type II Reservoirs in the Field
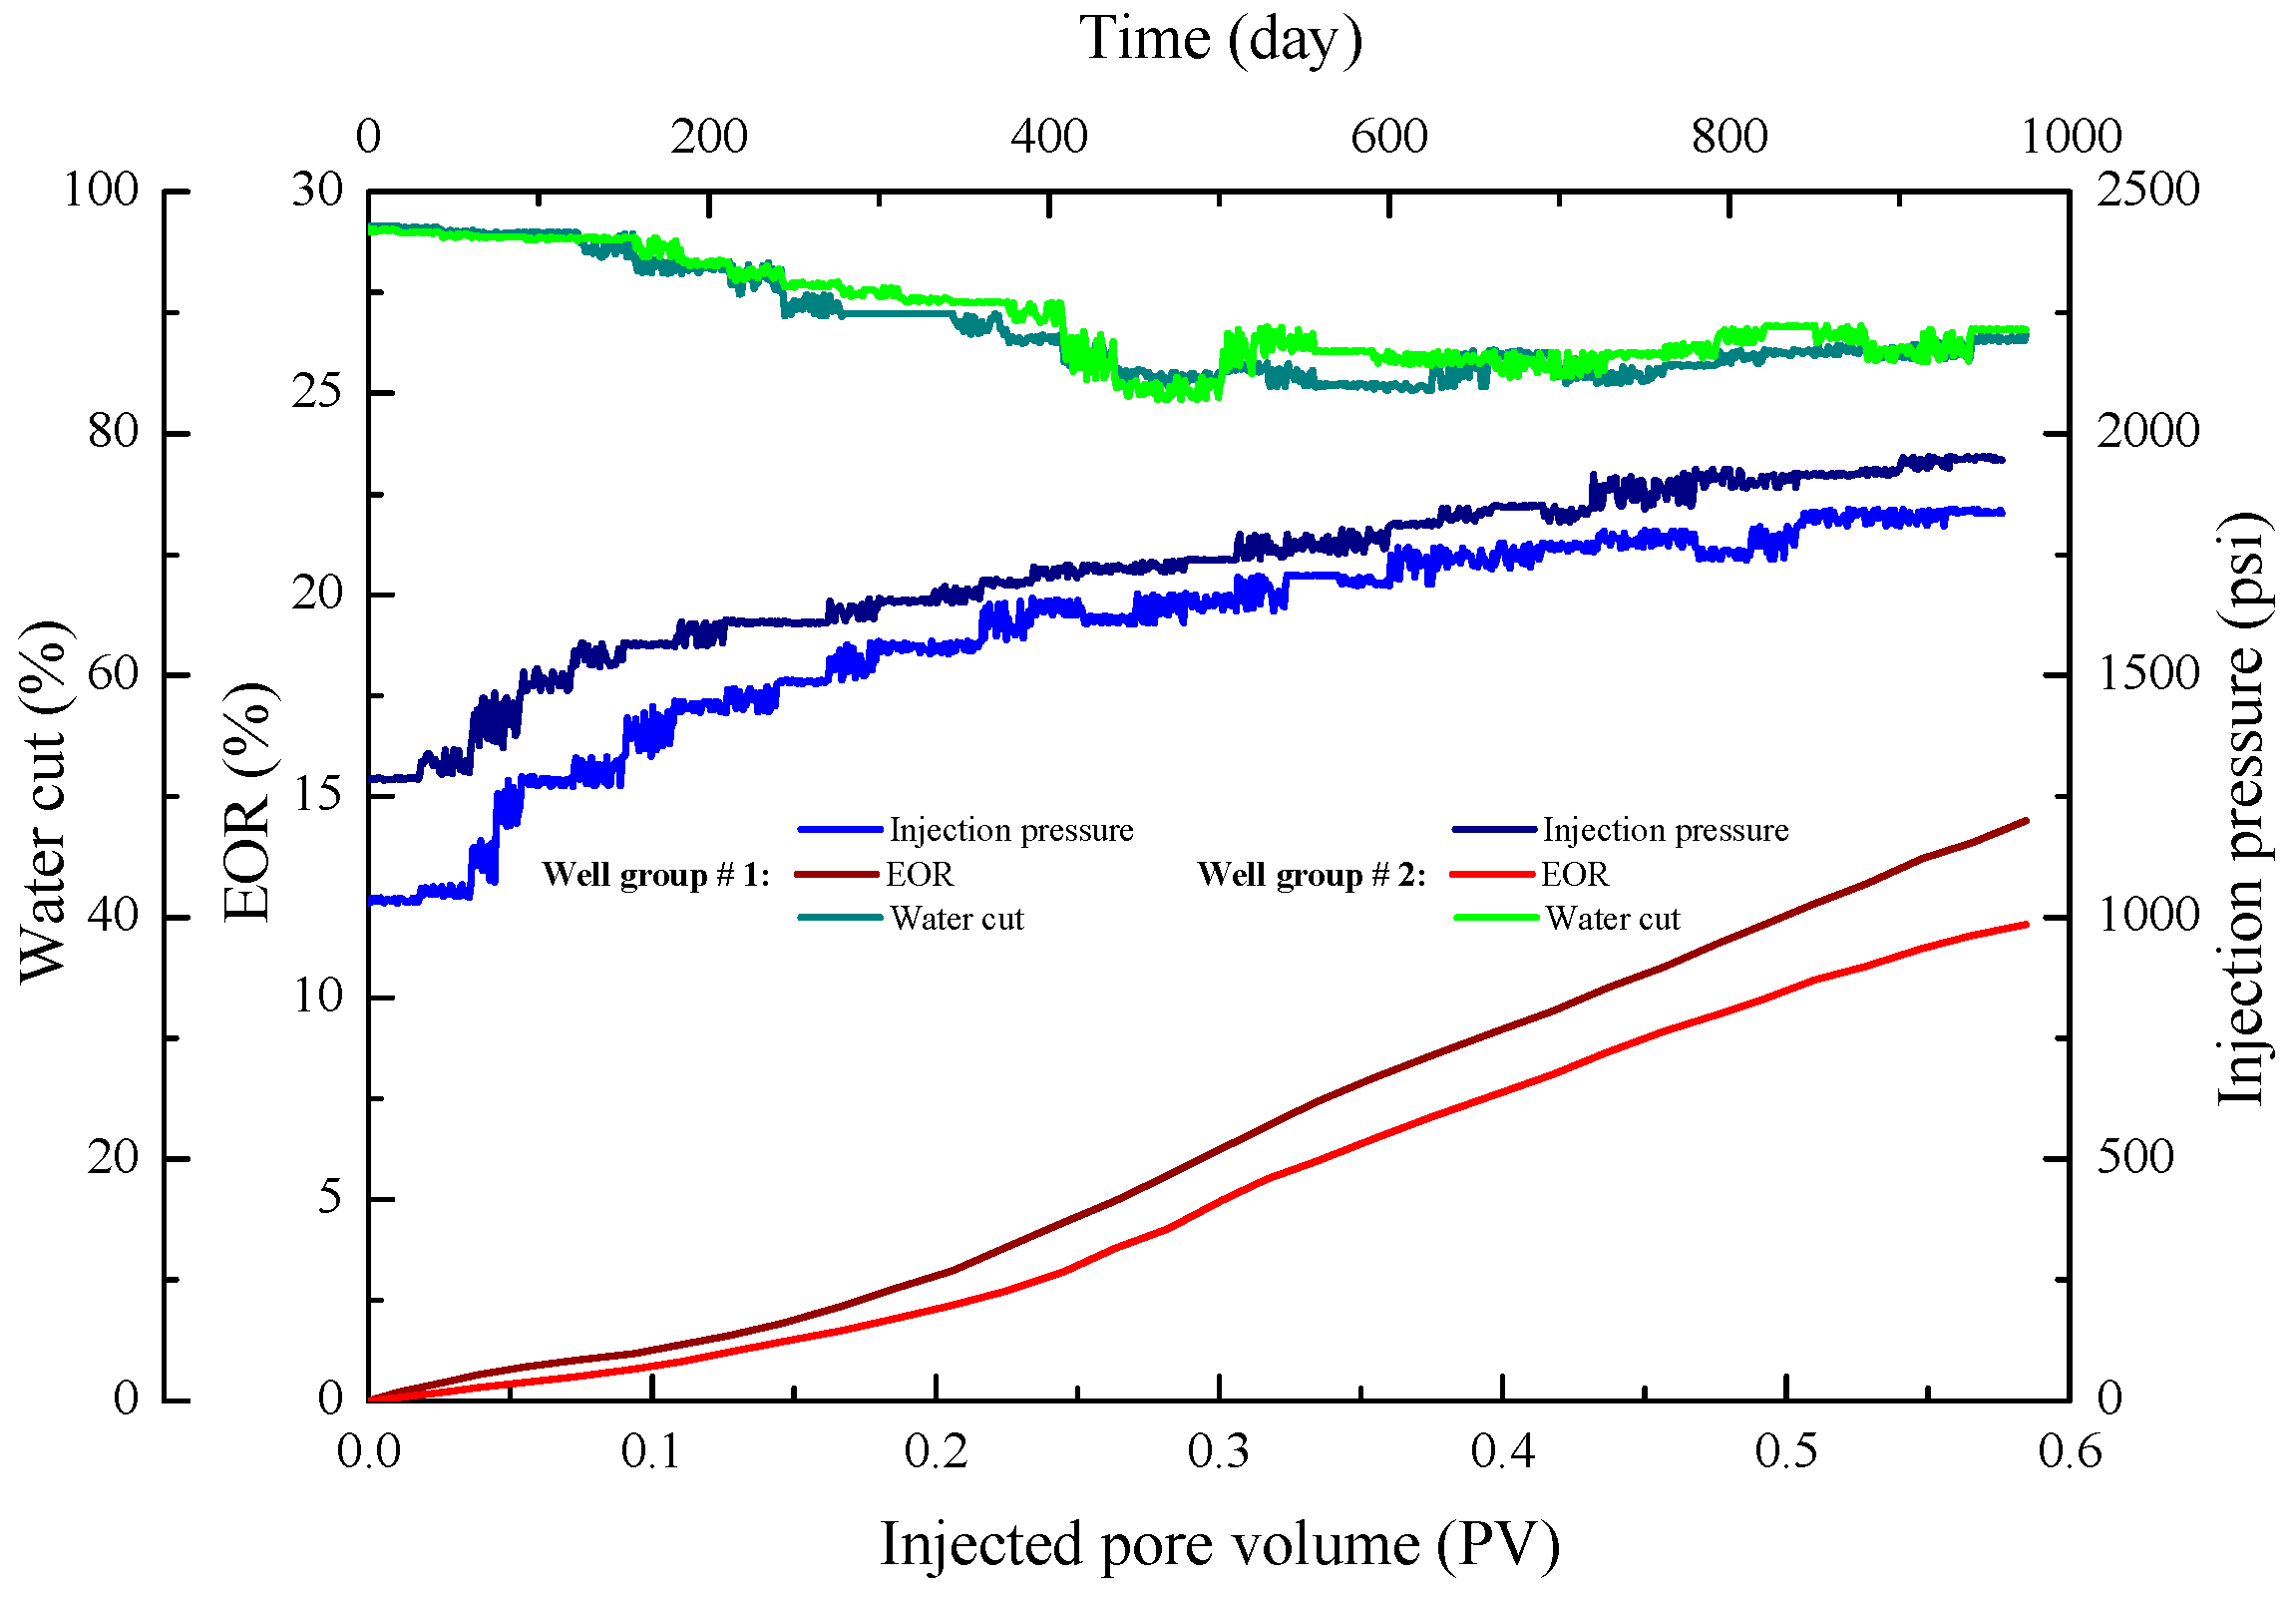
Polymer injection was performed in the BeiSanxi type II reservoir of the Daqing Oilfield. The reservoir is sandstone with an average permeability of 408 × 10−3 μm2 and an average porosity of 23.5%. The reservoir thickness is 10.8 m, and the oil area is approximately 4.59 km2. There are 143 injection wells and 147 production wells, and the injector-producer distance is 125 m. The initial pressure is 1524 psi with an initial in-situ oil viscosity of 9.5 mPa·s at a reservoir temperature of 45 °C. Prior to industrial application of polymer flooding, a pilot area, which contains 18 production wells in the field, was injected with the polymer concentration of 2000 mg/L with a molecular weight of 1.6 × 10⁷ Da after water flooding. However, all of the wells experienced an injection pressure rise after a short period of polymer injection, where the average injection pressure increased with a steeper slope at the end of polymer injection; this increase reached 45% when the cumulative injected pore volume was less than 0.1 PV. This pressure characteristic could be an indication of the difficultly of injection at a high polymer concentration. Then, based on the established matching relationship, the polymer injection parameters were adjusted in time in the heterogeneous type II reservoir. The production wells were divided into two groups based on the baseline of the injection pressure in the water flooding stage. Well group 1, which makes up 41.8% of the wells, was designed for a polymer concentration of 1500 mg/L with a molecular weight of 1.9 × 10⁷ Da and an injection volume of 0.6 PV, and well group 2, which makes up 58.2% of the wells, was designed for a polymer concentration of 1500 mg/L with a molecular weight of 1.6 × 10⁷ Da and an injection volume of 0.6 PV. Moreover, the production parameters of these two well groups were each tracked, and the injection-production status and polymer flooding effect were evaluated in the field.
As shown in Figure 11, although the typical wells suffered from an injectivity decline during the early high-concentration polymer flooding, a stable injection-production status was obtained in the industrial application, which employed the matching parameters, where the injection pressure increased gradually with time and injected pore volume. The pressure slope of the two well groups are essentially equal, and compared with the baseline, the maximum pressure increases of well group 1 and well group 2 were 78.24% and 51.57%, respectively. This result indicates that the pressure rise by permeability reduction resulting from retention is stabilized with the injection of a polymer slug [24]. Furthermore, the average incremental recovery of well group 1 was 14.4% (OOIP) better than that of water flooding, which exceeded the expected effect, and the comprehensive water cut still remained within 88% after the polymer slug was injected. The staged incremental recovery of well group 2 was 11.9% (OOIP), and the water cut rise rate was also controlled effectively. This result demonstrates that the reservoir sweep condition is relatively stable in an injection-production process with the matching relationship, and the EOR effects of a polymer in heterogeneous type II reservoirs are favorable.
Better economic results could be achieved if the residual polymer in formation realizes the reutilization by the effective technology. Considering the polymer remains in the formation exist in the forms of solution, adsorption and entrapment, fixation or flocculation might have potential to reutilize the residual polymer. The residual polymer will form weak gel or flocculate in the formation when some available fixing agents or flocculating agents are injected with proper patterns and parameters. The high permeability formation of heterogeneous reservoirs would be plugged, the injection profile would be adjusted again, and the sweep efficiency would be improved spontaneously. Future work should focus on developing new polymer product which can overcome the obstacles encountered by polymer flooding EOR at high salinity and high temperatures, modeling polymer flow through intricate porous media which considers adsorption and entrapment, developing residual polymer reutilization technologies, and addressing the unstable running of surface facilities and the fluctuation of treated oil and water quality in polymer flooding EOR.
5. Conclusions
Based on the experimental measurement and production analysis of the polymer flooding in type II reservoir, we can get conclusions from the study as follows. (1) The injection performance of single-phase and two-phase flooding environments has a strong relationship with the polymer injection parameters and permeability. The adsorption also increases as the polymer molecular weights and concentrations increase. The polymer adsorption-induced permeability reduction and the measured oil/water relative permeability relationships are affected more significantly by concentration than by molecular weight; (2) Different distributions of the residual oil only have a slight effect on the polymer flow and residual resistance. The identification limits of the polymer injection performance in type II reservoirs with certain heterogeneity are partitioned, and a matching relation schema is established. The method can be used to address actual two-phase flow problems in type II reservoirs with polymer EOR; (3) Under this matching relationship, the injection profile can be effectively adjusted by polymer flooding, and additional oil recoveries of 10–15% can be obtained in heterogeneous type II reservoirs with a high water saturation; (4) A stable injection-production status and noticeable EOR effect were achieved in a typical field application, which used the matching parameters; the practice proves that it is promising to stabilize production levels from a maturing field base by performing polymer flooding for EOR in heterogeneous type II reservoirs.
Acknowledgments
This work was financially supported by the National Natural Science Funds for Young Scholars of China (Grant No. 51604079) and the University Nursing Program for Young Scholars with Creative Talents in Heilongjiang Province.
Author Contributions
Huiying Zhong performed all the experiments and prepared the manuscript. Weidong Zhang and Jing Fu discussed the results. Jun Lu revised the manuscript. Hongjun Yin assisted for experimental design. The whole work was supervised by both Huiying Zhong and Hongjun Yin.
Conflicts of Interest
The authors declare no conflict of interest.
References
- Bahadori, A.; Nouri, A. Prediction of critical oil rate for bottom water coning in anisotropic and homogeneous formations. J. Pet. Sci. Eng. 2012, 82–83, 125–129. [Google Scholar] [CrossRef]
- Wang, D.M.; Cheng, J.C.; Yang, Q.Y.; Gong, W.C.; Li, Q.; Chen, F.M. Viscous-elastic polymer can increase microscale displacement efficiency in cores. In Proceedings of the Society of Petroleum Engineers (SPE) Annual Technical Conference and Exhibition, Dallas, TX, USA, 1–4 October 2000. [Google Scholar]
- Shiran, B.S.; Skauge, A. Enhanced oil recovery (EOR) by combined low salinity water/polymer flooding. Energy Fuels 2013, 27, 1223–1235. [Google Scholar] [CrossRef]
- Wu, Y.S.; Fakcharoenphol, P.; Zhang, R. Non-darcy displacement in linear composite and radial flow porous media. In Proceedings of the SPE EUROPEC/EAGE Annual Conference and Exhibition, Barcelona, Spain, 14–17 June 2010. [Google Scholar]
- Dai, Z.; Middleton, R.; Viswanathan, H.; Fessenden-Rahn, J.; Bauman, J.; Pawar, R.; Lee, S.Y.; McPherson, B. An integrated framework for optimizing CO2 sequestration and enhanced oil recovery. Environ. Sci. Technol. Lett. 2014, 1, 49–54. [Google Scholar] [CrossRef]
- Dai, Z.; Stauffer, P.H.; Carey, J.W.; Middleton, R.S.; Lu, Z.; Jacobs, J.F.; Hnottavange-Telleen, K.; Spangler, L.H. Pre-site characterization risk analysis for commercial-scale carbon sequestration. Environ. Sci. Technol. 2014, 48, 3908–3915. [Google Scholar] [CrossRef] [PubMed]
- Dai, Z.; Viswanathan, H.; Middleton, R.; Pan, F.; Ampomah, W.; Yang, C.; Jia, W.; Xiao, T.; Lee, S.Y.; McPherson, B.; et al. CO2 accounting and risk analysis for CO2 sequestration at enhanced oil recovery sites. Environ. Sci. Technol. 2016, 50, 7546–7554. [Google Scholar] [CrossRef] [PubMed]
- Ampomah, W.; Balch, R.; Grigg, R.B.; McPherson, B.; Will, R.A.; Lee, S.Y.; Dai, Z.; Pan, F. Co-optimization of CO2-EOR and storage processes in mature oil reservoirs. Greenh. Gases Sci. Technol. 2017, 7, 128–142. [Google Scholar] [CrossRef]
- Ampomah, W.; Balch, R.; Cather, M.; Rose-Coss, D.; Dai, Z.; Heath, J.; Dewers, T.; Mozley, P. Evaluation of CO2 Storage Mechanisms in CO2 enhanced oil recovery sites: Application to morrow sandstone reservoir. Energy Fuels 2016, 30, 8545–8555. [Google Scholar] [CrossRef]
- Pan, F.; McPherson, B.J.; Dai, Z.; Jia, W.; Lee, S.Y.; Ampomah, W.; Viswanathan, H.; Esser, R. Uncertainty analysis of carbon sequestration in an active CO2-EOR field. Int. J. Greenh. Gas Control 2016, 51, 18–28. [Google Scholar] [CrossRef]
- Wang, D.M.; Cheng, J.C.; Wu, J.Z.; Wang, G. Application of polymer flooding technology in Daqing Oilfield. Acta Pet. Sin. 2005, 26, 74–78. (In Chinese) [Google Scholar]
- James, J.S.; Bernd, L.; Nasser, A. Status of Polymer-Flooding Technology. J. Can. Pet. Technol. 2015, 54, 116–126. [Google Scholar]
- Zhang, R.; Yin, X.; Winterfeld, P.H.; Wu, Y.S. A fully coupled thermal-hydrological-mechanical-chemical model for CO2 geological sequestration. J. Nat. Gas Sci. Eng. 2016, 28, 280–304. [Google Scholar] [CrossRef]
- Wu, Y.F.; Mahmoudkhani, A.; Watson, P.; Fenderson, T.; Nair, M. Development of new polymers with better performance under conditions of high temperature and high salinity. In Proceedings of the SPE EOR Conference at Oil and Gas West Asia, Muscat, Oman, 16–18 April 2012. [Google Scholar]
- Manrique, E.J.; Thomas, C.P.; Ravikiran, R.; Kamouei, M.I.; Lantz, M.; Romero, J.L.; Alvarado, V. EOR: Current status and opportunities. In Proceedings of the SPE Improved Oil Recovery Symposium, Tulsa, OK, USA, 24–28 April 2010. [Google Scholar]
- Wang, Z.H.; Liu, Y.; Le, X.P.; Yu, H.Y. The effects and control of viscosity loss of polymer solution compounded by produced water in oilfield development. Int. J. Oil Gas Coal Technol. 2014, 7, 298–307. [Google Scholar] [CrossRef]
- Zhao, X.; Rui, Z.; Liao, X. Case studies on the CO2 storage and EOR in heterogeneous, highly water-saturated, and extra-low permeability Chinese reservoirs. J. Nat. Gas Sci. Eng. 2015, 29, 275–283. [Google Scholar] [CrossRef]
- Zhu, Y. Current developments and remaining challenges of chemical flooding EOR techniques in China. In Proceedings of the SPE Asia Pacific Enhanced Oil Recovery Conference, Kuala Lumpur, Malaysia, 11–13 August 2015. [Google Scholar]
- Ogunberu, A.L.; Asghari, K. Water permeability reduction under flow-induced polymer adsorption. J. Can. Pet. Technol. 2005, 44, 56–61. [Google Scholar] [CrossRef]
- Lee, K.S. Simulation of polymer flood processes in heterogeneous layered systems with crossflow and adsorption. J. Jpn. Pet. Inst. 2009, 52, 190–197. [Google Scholar] [CrossRef]
- Zhong, J.; Wang, P.; Zhang, Y.; Yan, Y.; Hu, S.; Zhang, J. Adsorption mechanism of oil components on water-wet mineral surface: A molecular dynamics simulation study. Energy 2013, 59, 295–300. [Google Scholar] [CrossRef]
- Park, H.; Han, J.J.; Sung, W. Effect of polymer concentration on the polymer adsorption-induced permeability reduction in low permeability reservoirs. Energy 2015, 84, 666–671. [Google Scholar] [CrossRef]
- Wang, Z.H.; Le, X.P.; Feng, Y.G.; Zhang, C.X. The role of matching relationship between polymer injection parameters and reservoirs in enhanced oil recovery. J. Pet. Sci. Eng. 2013, 111, 139–143. [Google Scholar] [CrossRef]
- Lotfollahi, M.; Farajzadeh, R.; Delshad, M.; Al-Abri, A.K.; Wassing, B.M.; Al-Mjeni, R.; Awan, K.; Bedrikovetsky, P. Mechanistic simulation of polymer injectivity in field tests. SPE J. 2016, 21. [Google Scholar] [CrossRef]
- Van, S.L.; Chon, B.H. The performance of surfactant-polymer flooding in horizontal wells consisting of multilayers in a reservoir system. Energies 2016, 9, 244. [Google Scholar] [CrossRef]
- Van, S.L.; Chon, B.H. Chemical flooding in heavy-oil reservoirs: From technical investigation to optimization using response surface methodology. Energies 2016, 9, 711. [Google Scholar] [CrossRef]
- Johnson, E.F.; Bossler, D.P.; Naumann, V.O. Calculation of relative permeability from displacement experiments. Trans. Am. Inst. Min. Metall. Eng. 1959, 216, 370–372. [Google Scholar]
- Cai, J.; Perfect, E.; Cheng, C.L.; Hu, X. Generalized modeling of spontaneous imbibition based on Hagen-Poiseuille flow in tortuous capillaries with variably shaped apertures. Langmuir 2014, 30, 5142–5151. [Google Scholar] [CrossRef] [PubMed]
- Olajire, A.A. Review of ASP EOR (alkaline surfactant polymer enhanced oil recovery) technology in the petroleum industry: Prospects and challenges. Energy 2014, 77, 963–982. [Google Scholar] [CrossRef]
- Zitha, P.L.J.; van Os, K.G.S.; Denys, K.F.J. Adsorption of linear flexible polymers during laminar flow through porous media: Effect of the concentration. In Proceedings of the SPE/DOE Improved Oil Recovery Symposium, Tulsa, OK, USA, 19–22 April 1998. [Google Scholar]
- Chauveteau, G.; Denys, K.; Zaitoun, A. New insight on polymer adsorption under high flow rates. In Proceedings of the SPE/DOE Improved Oil Recovery Symposium, Tulsa, OK, USA, 13–17 April 2002. [Google Scholar]
- Zhang, R. Numerical Simulation of Thermal Hydrological Mechanical Chemical Processes during CO2 Geological Sequestration. Ph.D. Thesis, Colorado School of Mines, Golden, CO, USA, 2013. [Google Scholar]
- Andrzej, Ś.; Sławomir, G.; Kornelia, M.B. Resistance coefficients of polymer membrane with concentration polarization. Transp. Porous Med. 2012, 95, 151–170. [Google Scholar]
- Lake, L.W.; Johns, R.T.; Rossen, W.R.; Pope, G.A. Fundamentals of Enhanced Oil Recovery; Society of Petroleum Engineers: Richardson, TX, USA, 2014. [Google Scholar]
- Zhao, J.; Dai, C.L.; Yang, G.; Zhang, J.; Yang, H.; Xue, X.S.; Kang, X.D.; Li, L.X. Application of polymers in low permeability formations. J. Mater. Sci. Chem. Eng. 2015, 3, 37–45. [Google Scholar] [CrossRef]
- Zhang, R.; Yin, X.; Wu, Y.S.; Winterfeld, P.H. A fully coupled model of nonisothermal multiphase flow, solute transport and reactive chemistry in porous media. In Proceedings of the SPE Annual Technical Conference and Exhibition, San Antonio, TX, USA, 8–10 October 2012. [Google Scholar]
- Buckley, S.E.; Leverett, M.C. Mechanism of fluid displacement in sands. Trans. Am. Inst. Min. Metall. Eng. 1942, 146, 107–116. [Google Scholar] [CrossRef]
- Grattoni, C.A.; Jing, X.D.; Zimmerman, R.W.; Luckham, P.P.; Norman, L. Polymers as relative permeability modifiers: Adsorption and the dynamic formation of thick polyacrylamide layers. J. Pet. Sci. Eng. 2005, 45, 233–246. [Google Scholar] [CrossRef]
- Lai, N.J.; Qin, X.P.; Ye, Z.B.; Li, C.X.; Chen, K.; Zhang, Y. The study on permeability reduction performance of a hyperbranched polymer in high permeability porous medium. J. Pet. Sci. Eng. 2013, 112, 198–205. [Google Scholar] [CrossRef]
- Kamal, M.S.; Sultan, A.S.; Al-Mubaiyedh, U.A.; Hussein, I.A. Review on polymer flooding: Rheology, adsorption, stability, and field applications of various polymer systems. Polym. Rev. 2015, 55, 491–530. [Google Scholar] [CrossRef]
- Schneider, F.N.; Owens, W.W. Steady-state measurements of relative permeability for polymer/oil systems. Soc. Pet. Eng. J. 1982, 22, 79–86. [Google Scholar] [CrossRef]
- Cai, J.; Yu, B.; Zou, M.; Mei, M. Fractal analysis of invasion depth of extraneous fluids in porous media. Chem. Eng. Sci. 2010, 65, 5178–5186. [Google Scholar] [CrossRef]
- Mishra, S.; Bera, A.; Mandal, A. Effect of polymer adsorption on permeability reduction in enhanced oil recovery. J. Pet. Eng. 2014, 2014, 395857. [Google Scholar] [CrossRef]
- Maitin, B.K. Performance analysis of several polyacrylamide floods in North German Oil Fields. In Proceedings of the SPE/DOE Enhanced Oil Recovery Symposium, Tulsa, OK, USA, 22–24 April 1992. [Google Scholar]
Figure 1.
Schematic of three parallel cores flooding pattern.

Figure 2.
Illustration of flow characteristics (Q~ΔP) of HPAM solution in porous media.

Figure 3.
Influence of permeability on flow behavior (polymer of 1500 mg/L).

Figure 4.
Influence of polymer molecular weight on flow behavior.

Figure 5.
Influence of polymer concentration on flow behavior: (a) polymer of 1.6 × 10⁷ molecular weight; and (b) polymer of 1.9 × 10⁷ molecular weight.
Figure 5.
Influence of polymer concentration on flow behavior: (a) polymer of 1.6 × 10⁷ molecular weight; and (b) polymer of 1.9 × 10⁷ molecular weight.

Figure 6.
Polymer–oil relative permeability curves.

Figure 7.
The scanning pictures of core slices before and after polymer injection: (a) Kw = 100 × 10−3 μm2; and (b) Kw = 500 × 10−3 μm2.
Figure 7.
The scanning pictures of core slices before and after polymer injection: (a) Kw = 100 × 10−3 μm2; and (b) Kw = 500 × 10−3 μm2.

Figure 8.
The correlation statistics of polymer injection performance evaluation parameters: (a) Kw = 100 × 10−3 μm2; (b) Kw = 300 × 10−3 μm2; and (c) Kw = 500 × 10−3 μm2. Blue line: RRF; red line: RF; and black line: I.
Figure 8.
The correlation statistics of polymer injection performance evaluation parameters: (a) Kw = 100 × 10−3 μm2; (b) Kw = 300 × 10−3 μm2; and (c) Kw = 500 × 10−3 μm2. Blue line: RRF; red line: RF; and black line: I.

Figure 9.
The matching relation schema (area I in pink represents “Smooth injection”; area II in purple represents “Difficult injection”; area III in blue represents “Risk of blockage”).
Figure 9.
The matching relation schema (area I in pink represents “Smooth injection”; area II in purple represents “Difficult injection”; area III in blue represents “Risk of blockage”).

Figure 10.
The RF of polymer slugs as function of injected pore volume in displacement experiments.

Figure 11.
Injection-production status for different well groups of type II reservoir in the field.


Table 1.
Composition of brines.
| Ion | Concentration (mg/L) | |
|---|---|---|
| Synthetic Brine | Flooding Fluid | |
| Na+ | 2295.7 | 80.36 |
| K+ | 10.5 | 13.28 |
| Ca2+ | 14.7 | 22.59 |
| Mg2+ | 7.2 | 13.27 |
| SO42− | 46.8 | 56.86 |
| Cl− | 2231.1 | 52.11 |
| CO32− | 117.6 | 32.41 |
| HCO3− | 2054.4 | 124.05 |
| Total | 6778.0 | 394.93 |
Table 2.
Experimental matrix. HPAM: hydrolyzed polyacrylamide; and EOR: enhanced oil recovery.
| Experiments | HPAM Polymer | Core Permeability (×10−3 μm2) | ||
|---|---|---|---|---|
| Relative Molecular Weight (Da) | Concentration (mg/L) | Viscosity (mPa·s) | ||
| Polymer injecting adaptability | 1.6 × 10⁷ | 1000 | 43.2 | 100 |
| 1200 | 59.6 | |||
| 1500 | 87.9 | |||
| 1.9 × 10⁷ | 1000 | 49.0 | ||
| 1200 | 68.3 | |||
| 1500 | 102.7 | |||
| 1.6 × 10⁷ | 1200 | 59.6 | 300 | |
| 1500 | 87.9 | |||
| 2000 | 144.5 | |||
| 1.9 × 10⁷ | 1200 | 68.3 | ||
| 1500 | 102.7 | |||
| 2000 | 170.4 | |||
| 1.6 × 10⁷ | 1500 | 87.9 | 500 | |
| 2000 | 144.5 | |||
| 2500 | 208.1 | |||
| 1.9 × 10⁷ | 1500 | 102.7 | ||
| 2000 | 170.4 | |||
| 2500 | 246.3 | |||
| EOR simulation | 1.6 × 10⁷ | 1000 | 43.2 | 100/300/500 (parallel) |
| 1200 | 59.6 | |||
| 1500 | 87.9 | |||
| 1.9 × 10⁷ | 1000 | 49.0 | ||
| 1200 | 68.3 | |||
| 1500 | 102.7 | |||
Table 3.
Resistance coefficient (RF) and residual resistance coefficient (RRF) of polymer solutions in type II reservoirs.
Table 3.
Resistance coefficient (RF) and residual resistance coefficient (RRF) of polymer solutions in type II reservoirs.
| Permeability (×10−3 μm2) | HPAM Polymer | Single-Phase Flow | Two-Phase Flow | ||
|---|---|---|---|---|---|
| Relative Molecular Weight (Da) | Concentration (mg/L) | RF | RRF | RRF | |
| 100 | 1.6 × 10⁷ | 1000 | 81.67 | 23.9 | 20.5 |
| 1200 | 91.84 | 31.2 | - | ||
| 1500 | 98.77 | 40.6 | 35.1 | ||
| 1.9 × 10⁷ | 1000 | 86.00 | 27.0 | - | |
| 1200 | 103.6 | 38.9 | - | ||
| 1500 | 113.5 | 46.7 | - | ||
| 300 | 1.6 × 10⁷ | 1200 | 48.00 | 13.9 | - |
| 1500 | 72.92 | 33.2 | - | ||
| 2000 | 119.5 | 43.4 | - | ||
| 1.9 × 10⁷ | 1200 | 66.77 | 24.1 | - | |
| 1500 | 79.17 | 42.8 | - | ||
| 2000 | 127.1 | 51.3 | - | ||
| 500 | 1.6 × 10⁷ | 1500 | 62.35 | 25.2 | 21.6 |
| 2000 | 108.8 | 26.3 | - | ||
| 2500 | 111.6 | 30.8 | - | ||
| 1.9 × 10⁷ | 1500 | 74.44 | 27.4 | 23.3 | |
| 2000 | 122.2 | 29.1 | - | ||
| 2500 | 129.4 | 33.9 | - | ||
Table 4.
Experiment results regarding polymer flooding EOR in type II reservoirs under the matching relationship.
Table 4.
Experiment results regarding polymer flooding EOR in type II reservoirs under the matching relationship.
| HPAM Polymer | Water Flooding | Polymer Flooding | Final Oil Recovery (%) | |||
|---|---|---|---|---|---|---|
| Relative Molecular Weight | Concentration (mg/L) | Oil Recovery (%) | Average Rate of Diversion Ratio | EOR (%) | Average Rate of Diversion Ratio | |
| 1.6 × 10⁷ | 1000 | 43.05 | 5.5:3.5:1.0 | 9.96 | 5.0:3.5:1.5 | 53.01 |
| 1200 | 43.32 | 6.0:3.0:1.0 | 11.84 | 5.5:3.0:1.5 | 55.16 | |
| 1500 | 43.27 | 6.0:3.0:1.0 | 13.17 | 5.0:3.5:1.5 | 56.44 | |
| 1.9 × 10⁷ | 1000 | 42.83 | 6.0:3.0:1.0 | 11.35 | 5.5:3.0:1.5 | 54.18 |
| 1200 | 42.86 | 6.5:3.0:0.5 | 12.15 | 5.5:3.0:1.5 | 55.01 | |
| 1500 | 43.02 | 6.0:3.0:1.0 | 15.08 | 5.0:3.0:2.0 | 58.10 | |
Note: Average rate of diversion ratio is the ratio defined by the diversion ratio value of 500 × 10−3 μm2:300 × 10−3 μm2:100 × 10−3 μm2.
© 2017 by the authors. Licensee MDPI, Basel, Switzerland. This article is an open access article distributed under the terms and conditions of the Creative Commons Attribution (CC BY) license (http://creativecommons.org/licenses/by/4.0/).
Share and Cite
MDPI and ACS Style
Zhong, H.; Zhang, W.; Fu, J.; Lu, J.; Yin, H. The Performance of Polymer Flooding in Heterogeneous Type II Reservoirs—An Experimental and Field Investigation. Energies 2017, 10, 454. https://doi.org/10.3390/en10040454
AMA Style
Zhong H, Zhang W, Fu J, Lu J, Yin H. The Performance of Polymer Flooding in Heterogeneous Type II Reservoirs—An Experimental and Field Investigation. Energies. 2017; 10(4):454. https://doi.org/10.3390/en10040454
Chicago/Turabian StyleZhong, Huiying, Weidong Zhang, Jing Fu, Jun Lu, and Hongjun Yin. 2017. "The Performance of Polymer Flooding in Heterogeneous Type II Reservoirs—An Experimental and Field Investigation" Energies 10, no. 4: 454. https://doi.org/10.3390/en10040454
Note that from the first issue of 2016, this journal uses article numbers instead of page numbers. See further details here.