
A Galvanic Coupling Method for Assessing Hydration Rates


Abstract
:1. Introduction
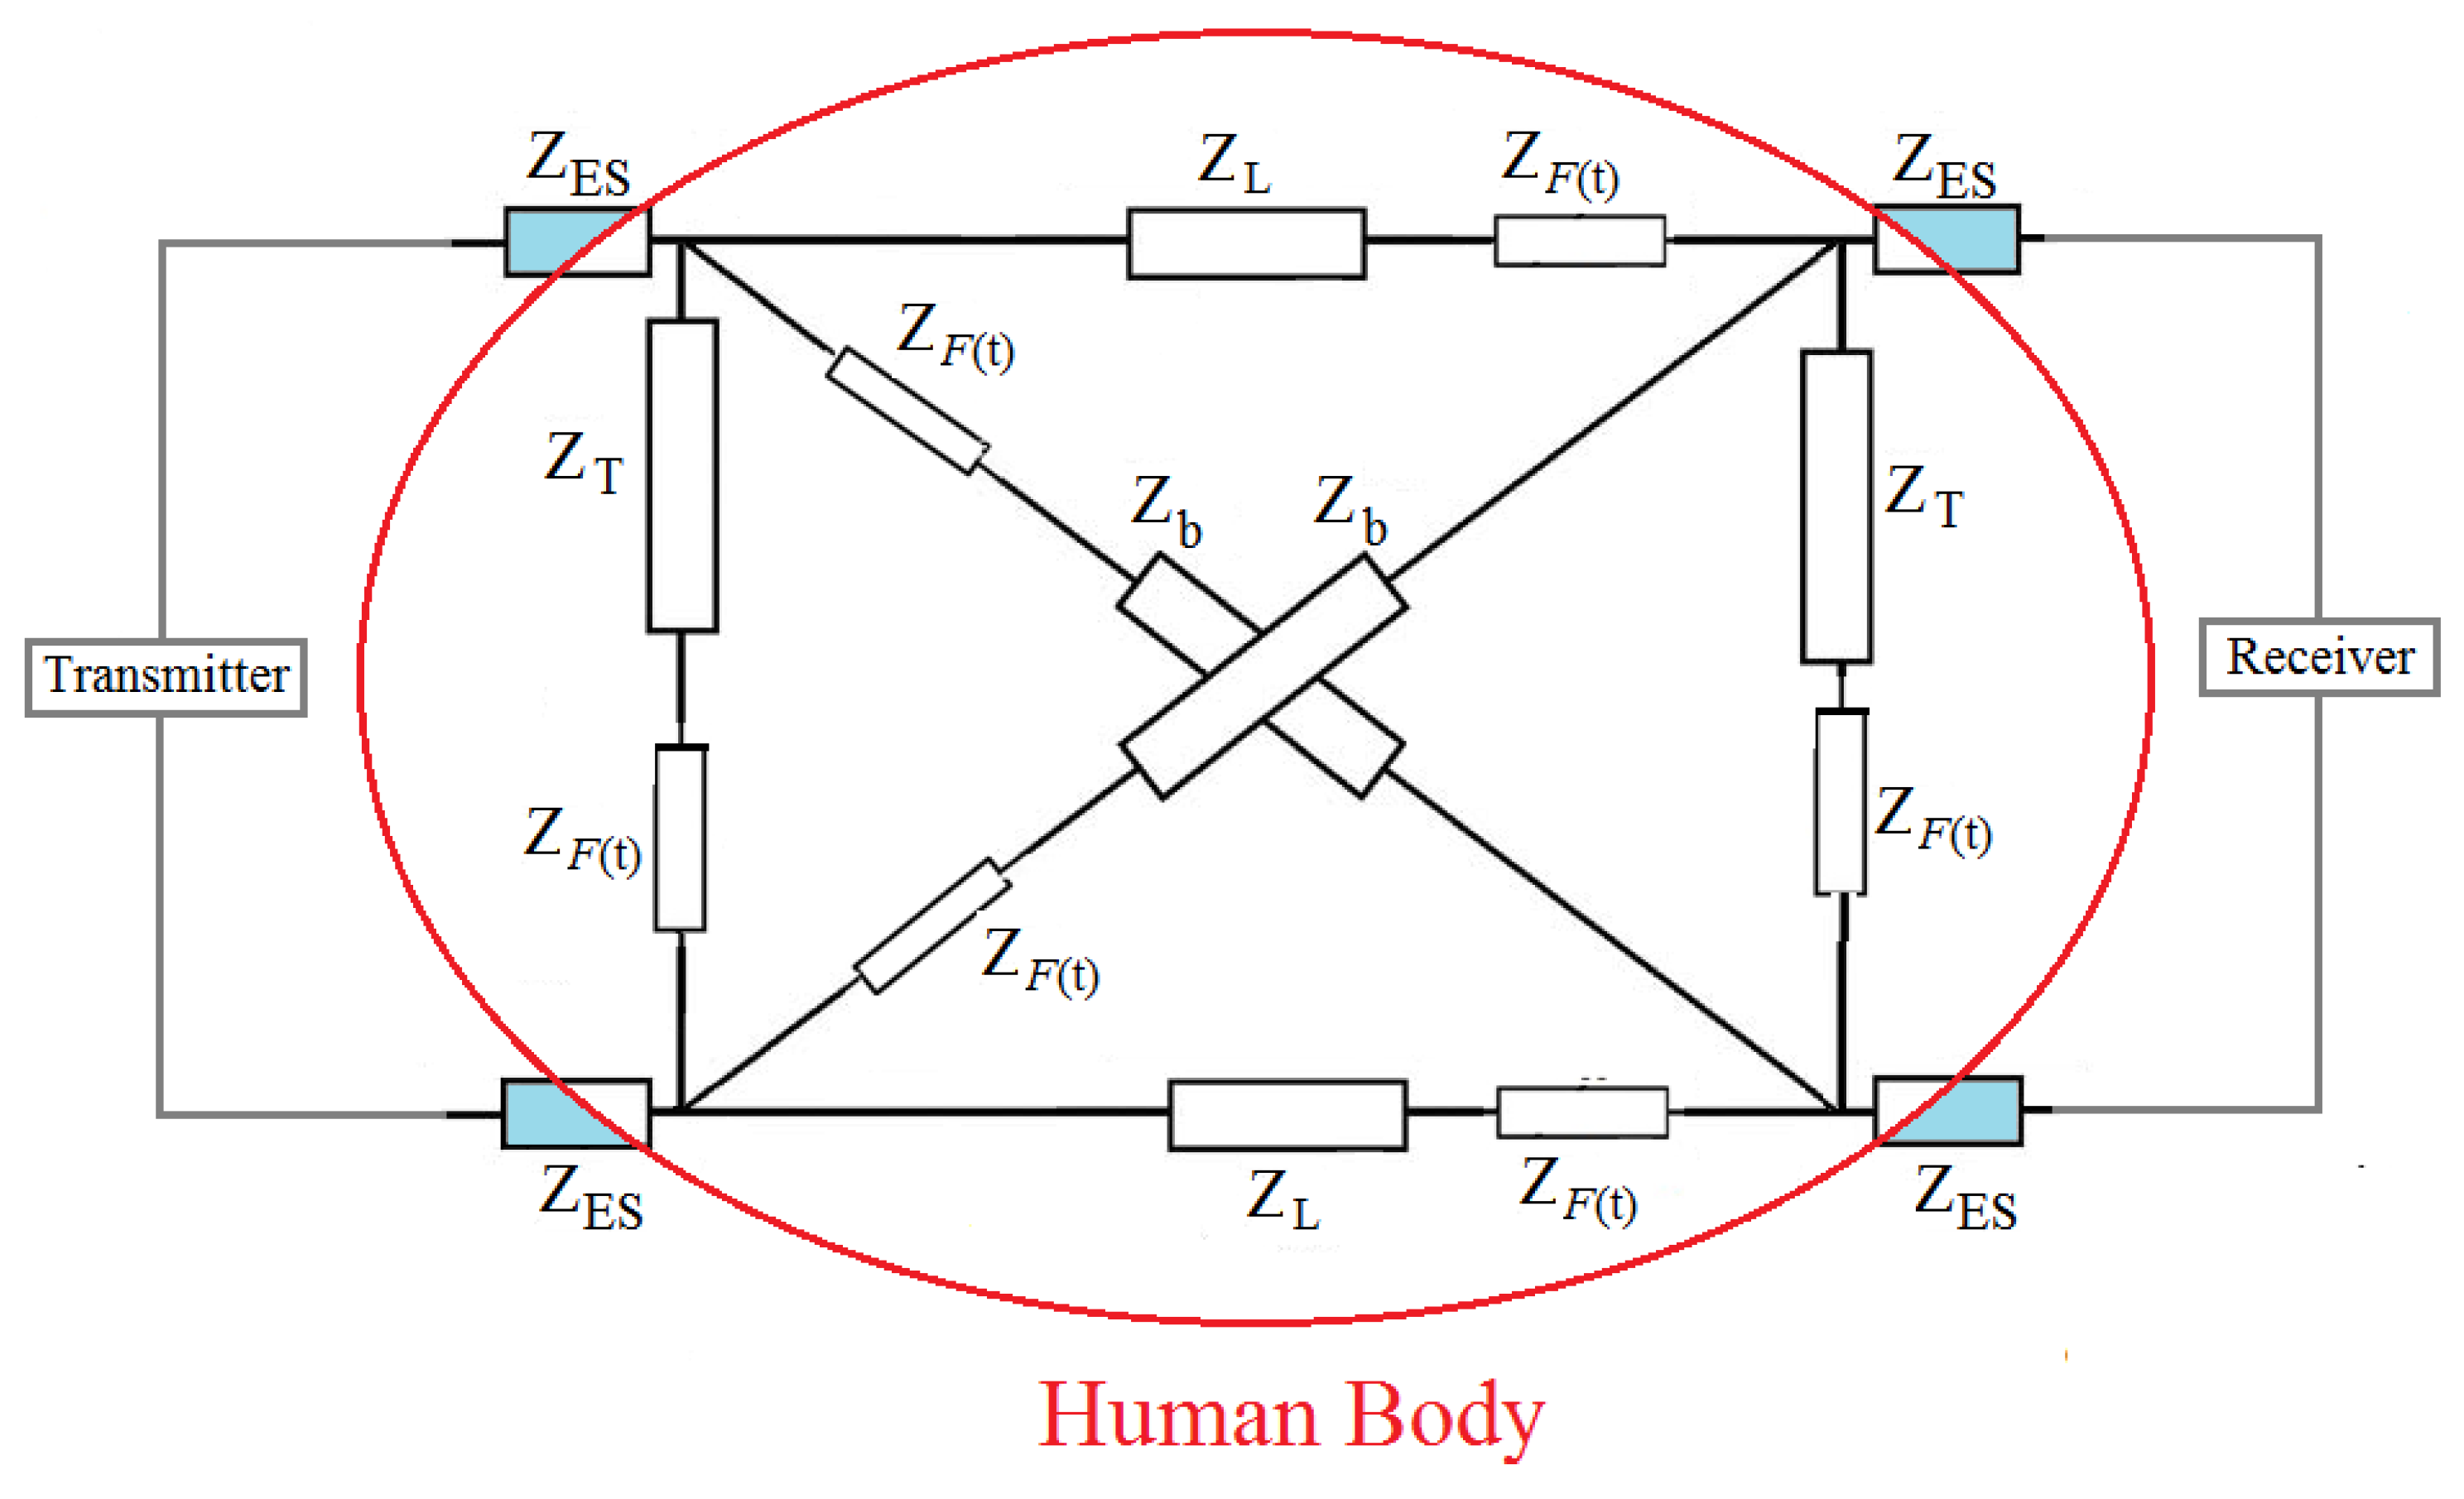
2. Modification on Previous Circuit Model
3. Methodology
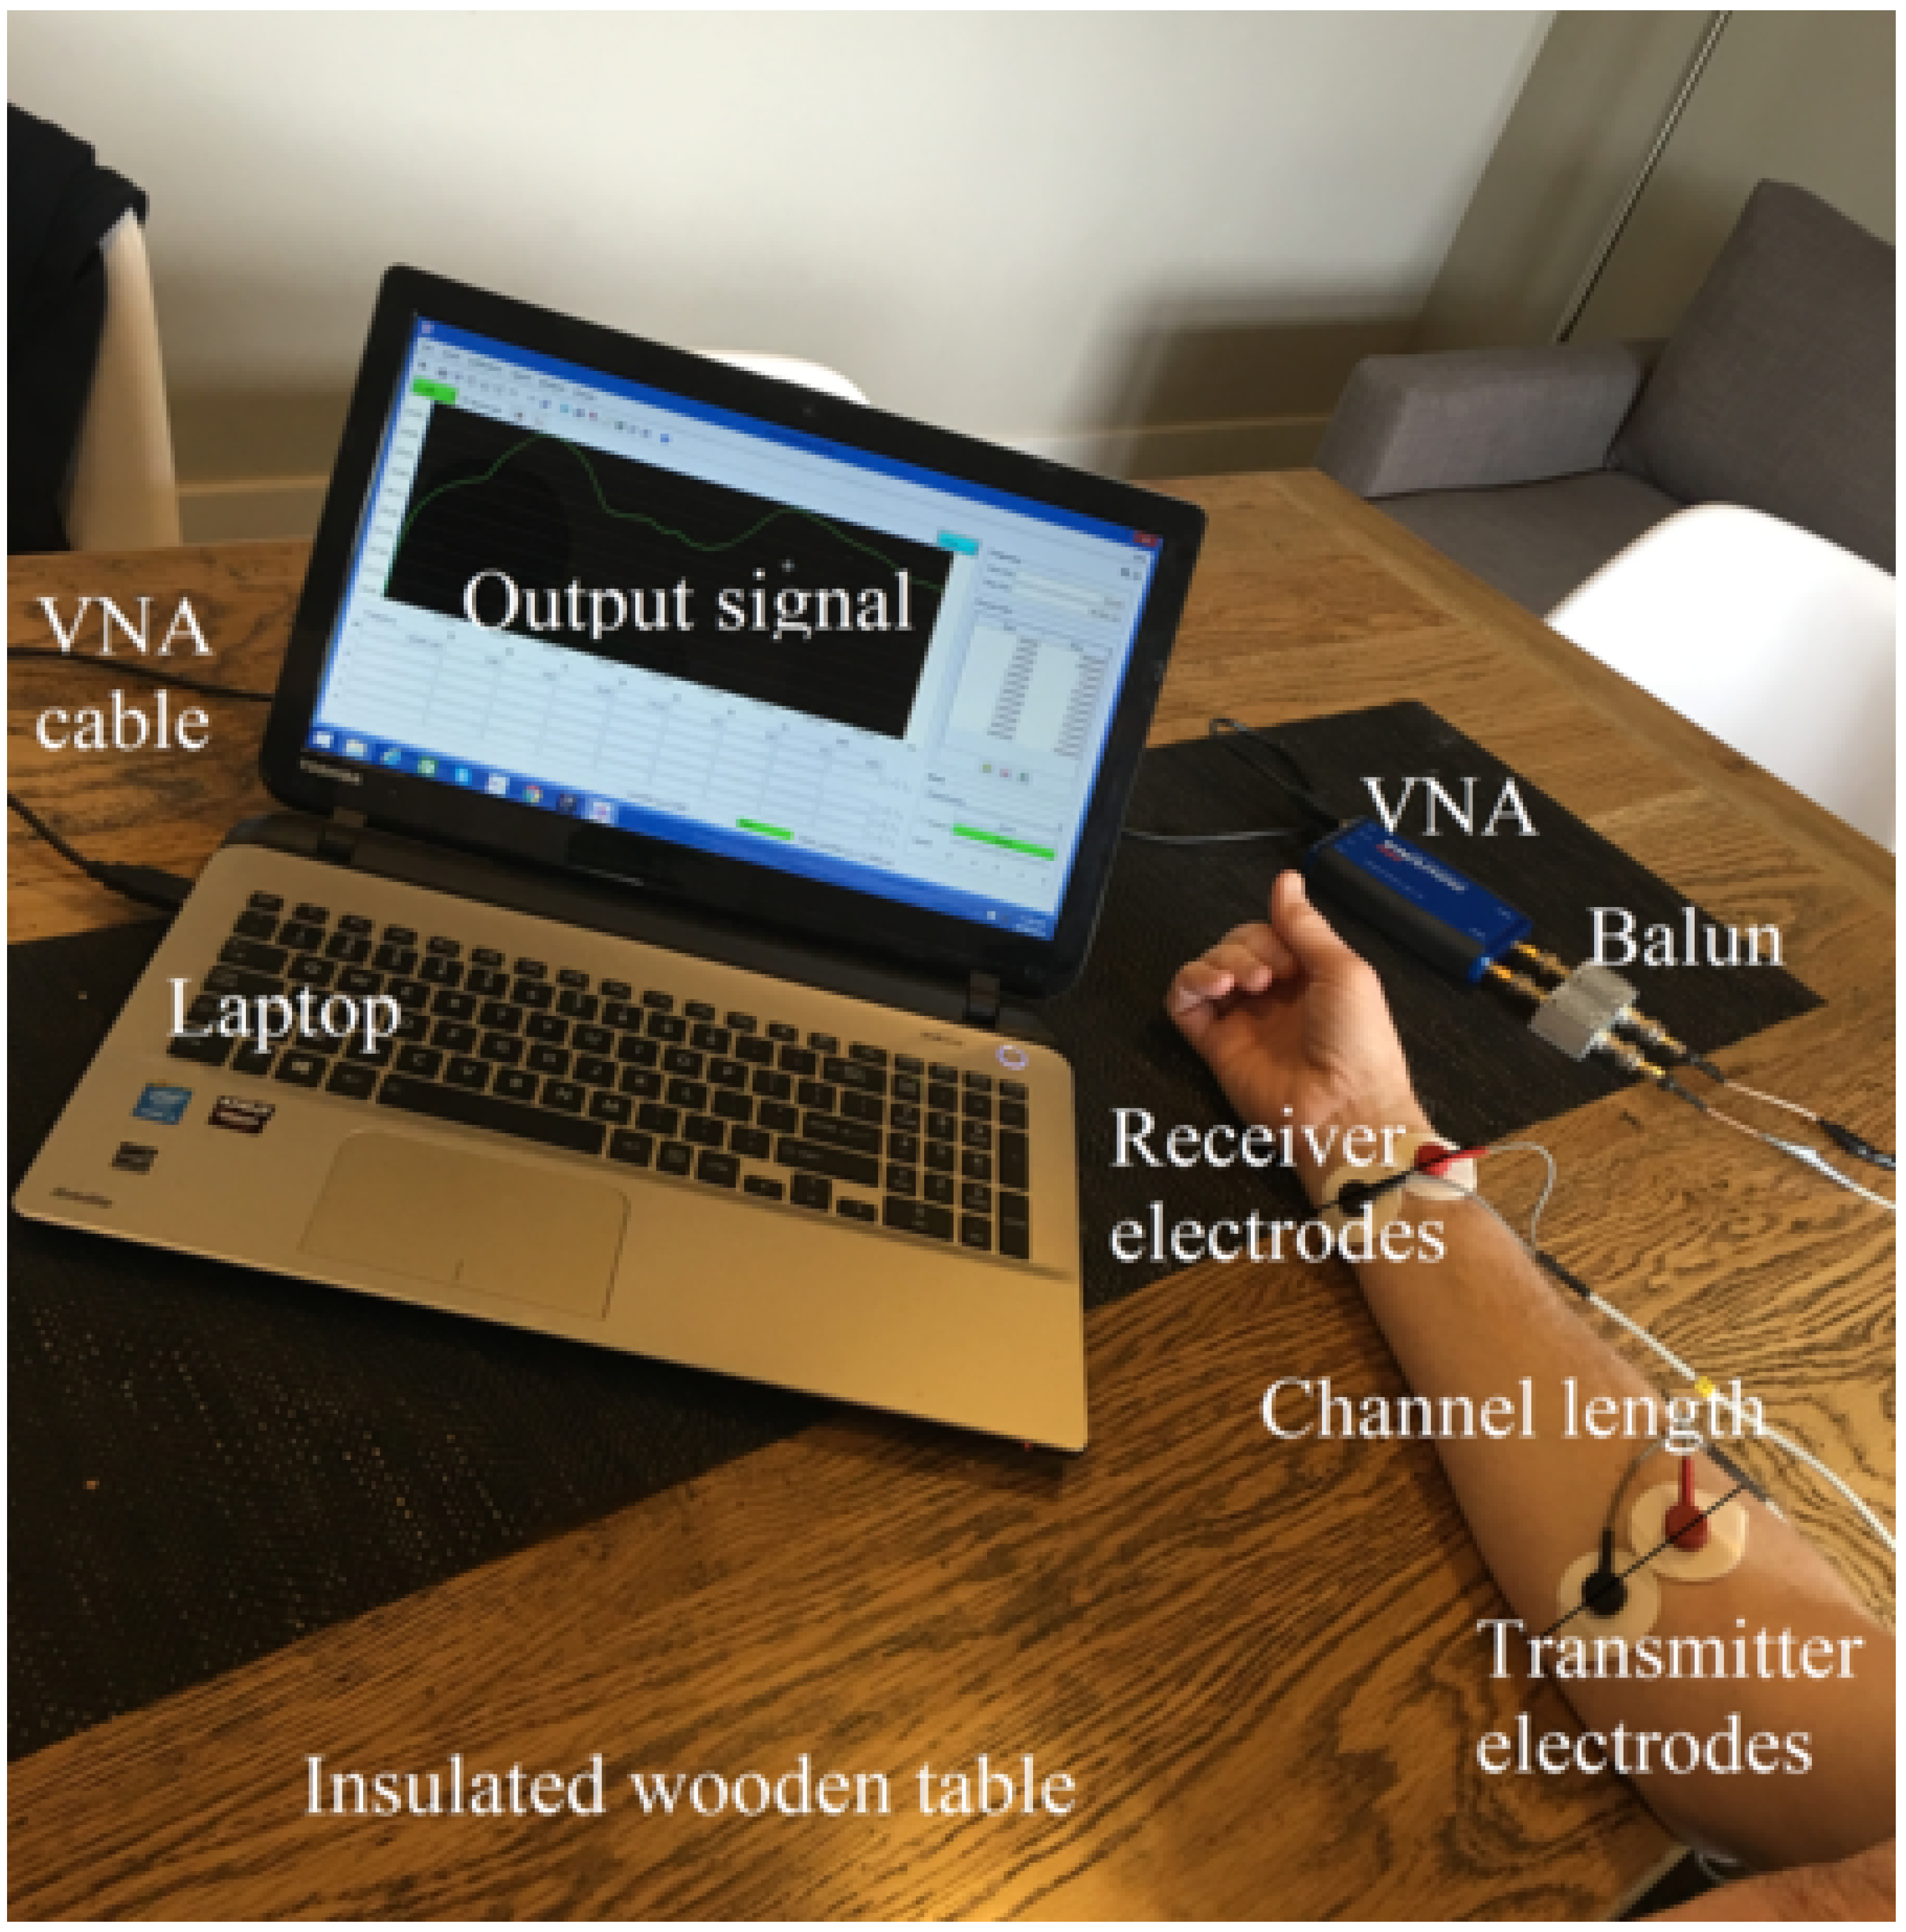
3.1. Equipment
3.2. Experiment I: Hydration Testing
3.3. Experiment II: Sensitivity Test By Empirical Measurement
3.4. Experiment III: Sensitivity Test By Simulation
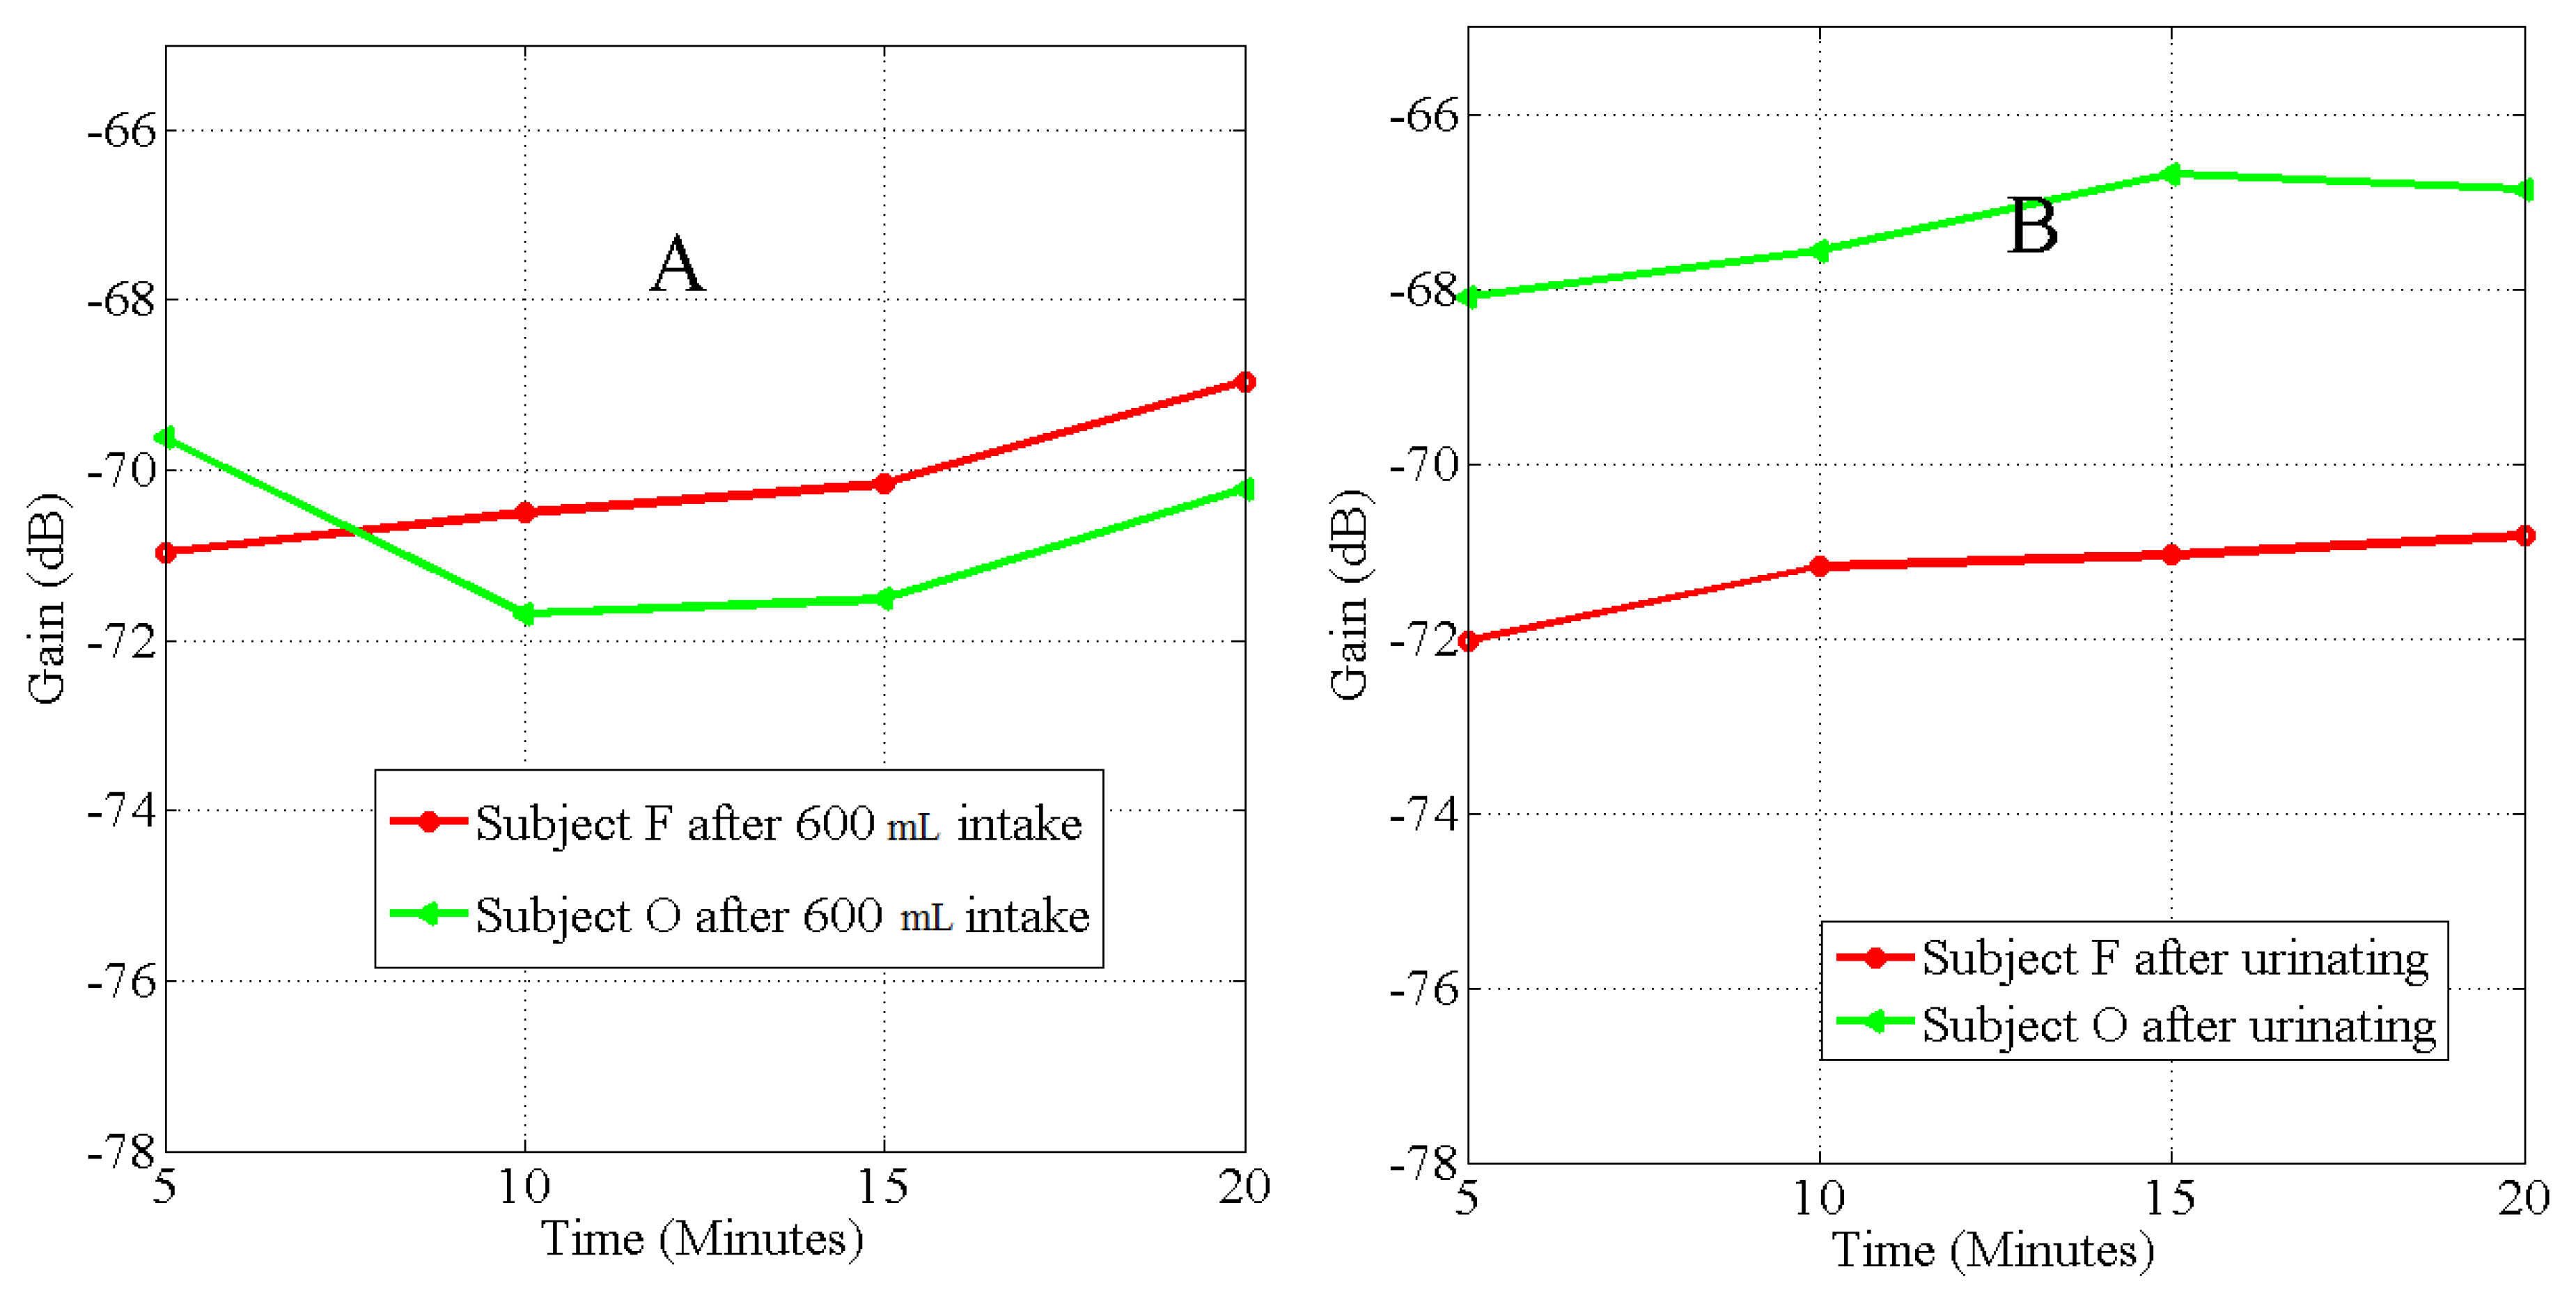
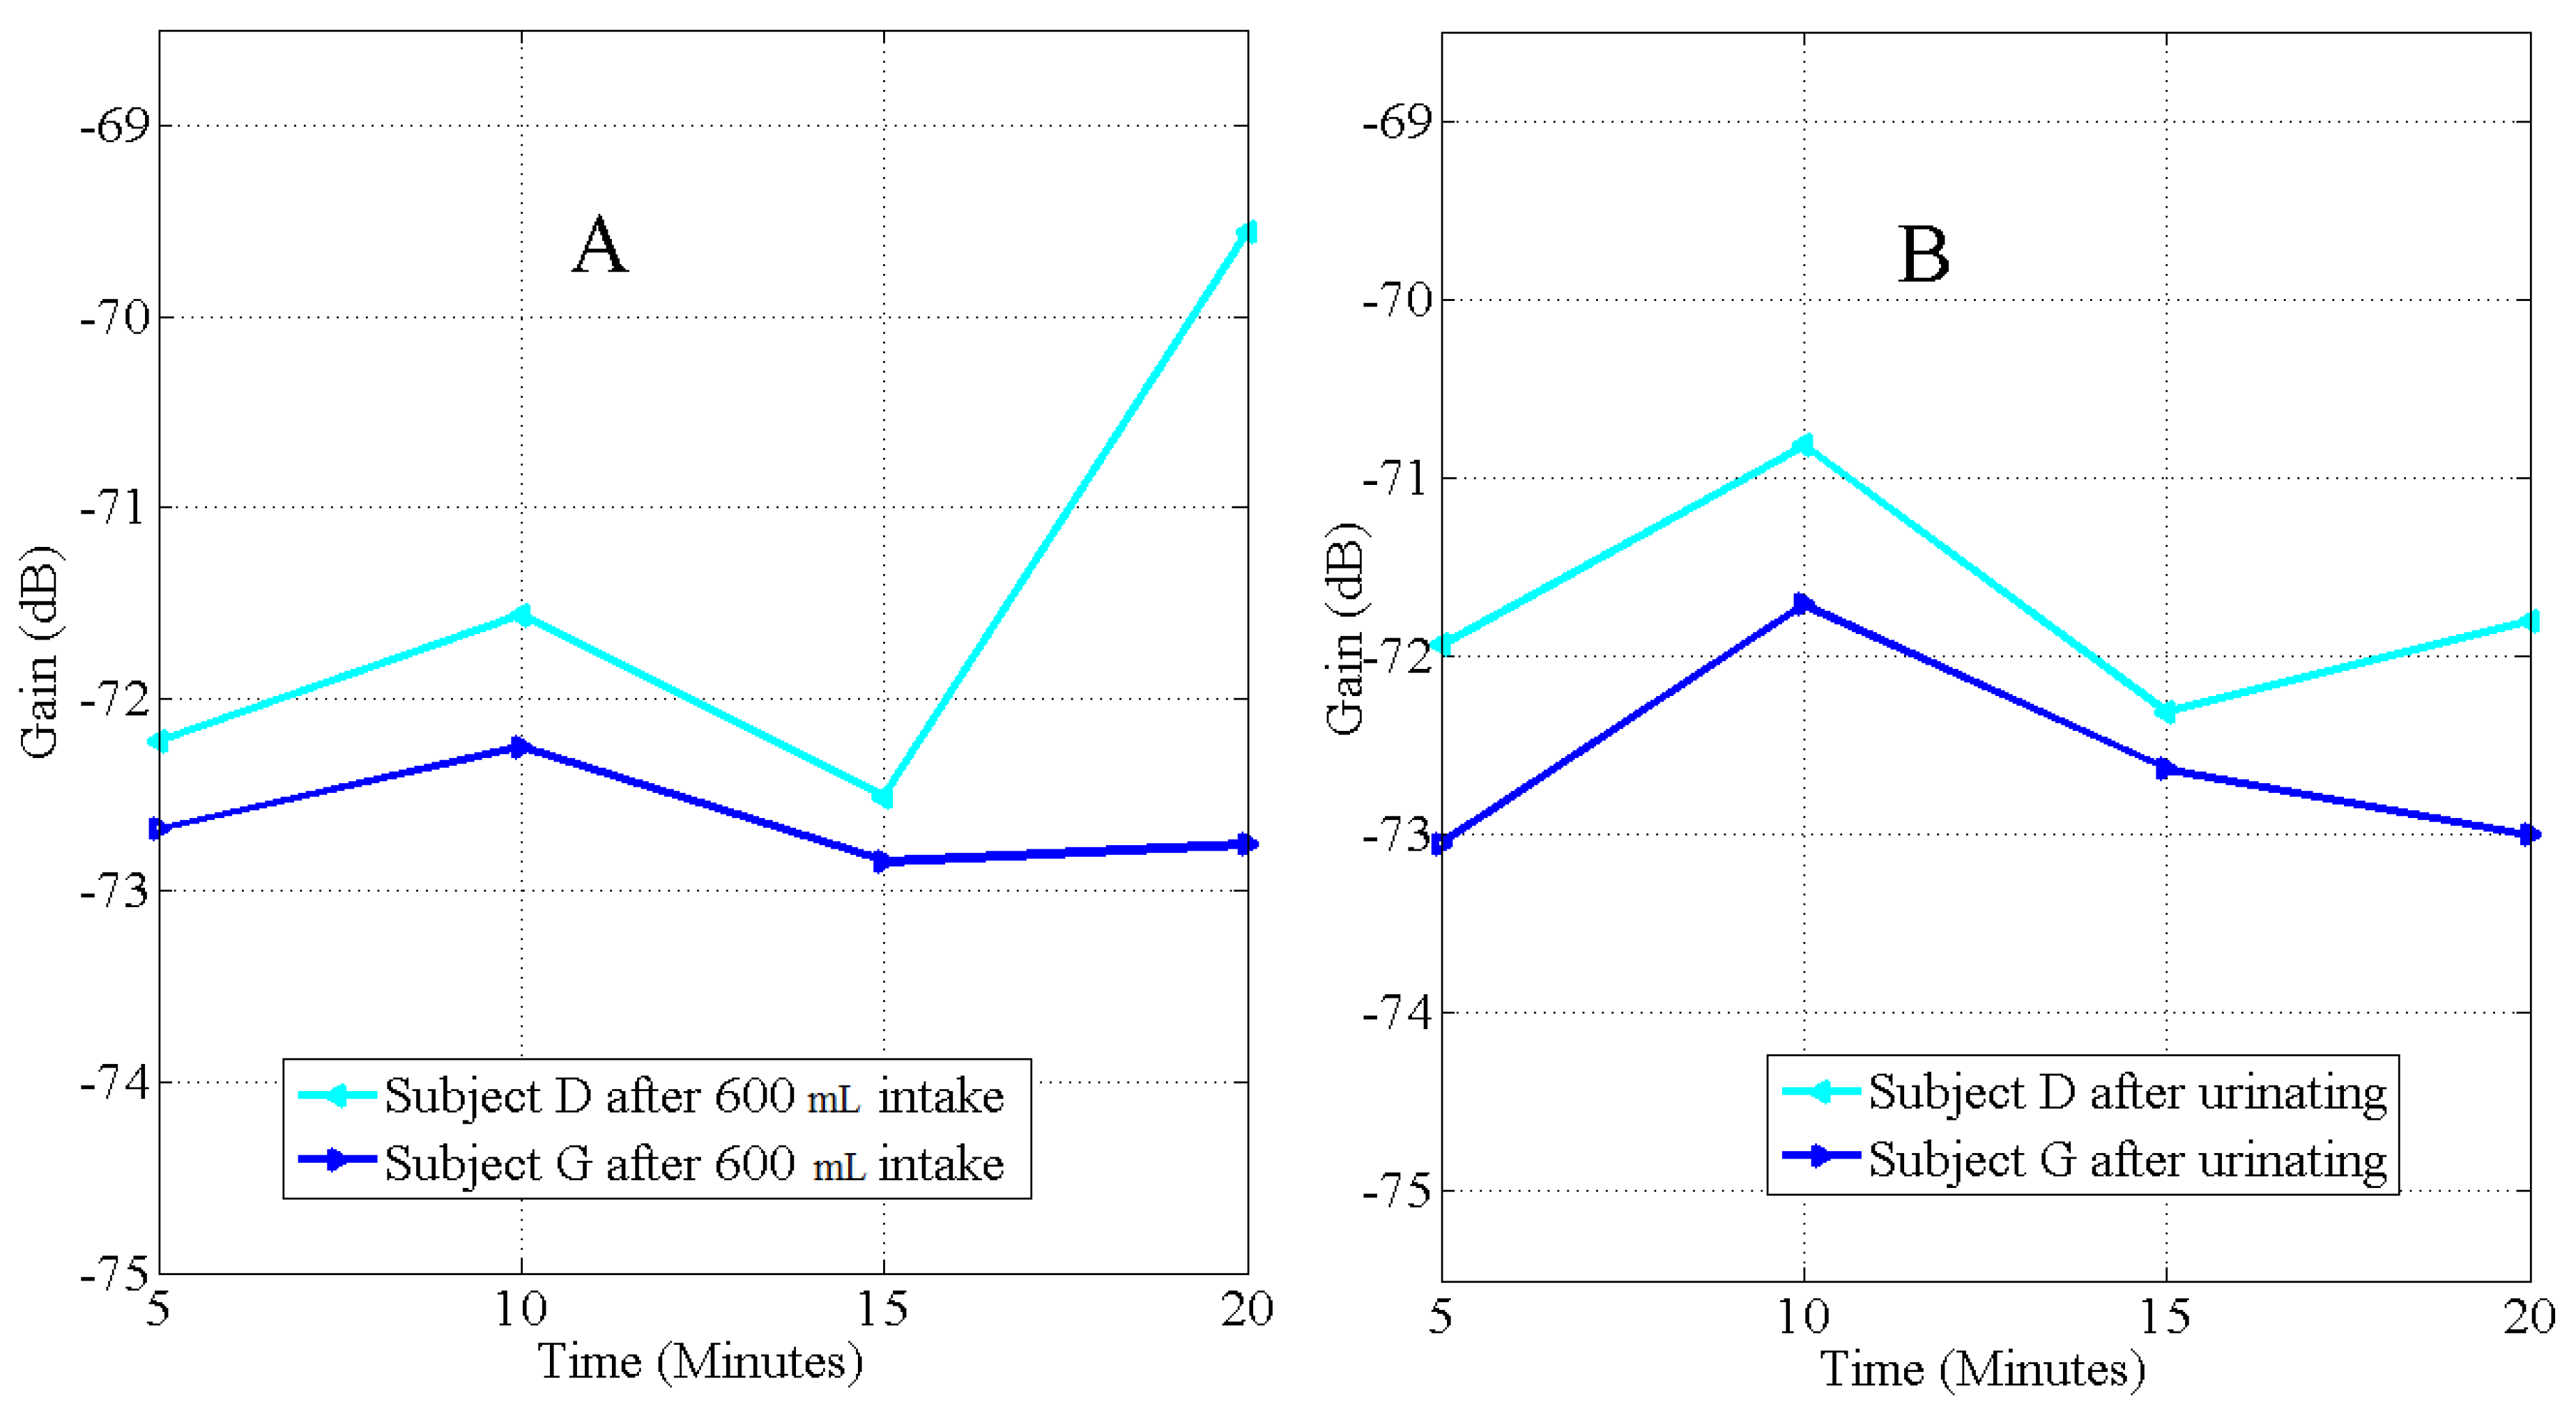
4. Results
5. Discussion
5.1. Hydration Measurement Techniques
5.1.1. Urine Colour Indices
5.1.2. Change in Body Weight
5.1.3. Refractometry
5.2. Intrabody Signal Propagation Method
6. Conclusions
Acknowledgments
Author Contributions
Conflicts of Interest
References
- Armstrong, L.E.; Pumerantz, A.C.; Fiala, K.A.; Roti, M.W.; Kavouras, S.A.; Casa, D.J.; Maresh, C.M. Human hydration indices: Acute and longitudinal reference values. Int. J. Sport Nutr. 2010, 20, 145–153. [Google Scholar]
- Gandy, J. Water intake: Validity of population assessment and recommendations. Eur. J. Nutri. 2015, 54, 11–16. [Google Scholar] [CrossRef] [PubMed]
- Ibrahim, F.; Thio, T.H.G.; Faisal, T.; Neuman, M. The application of biomedical engineering techniques to the diagnosis and management of tropical diseases: A review. Sensors 2015, 15, 6947–6995. [Google Scholar] [CrossRef] [PubMed]
- Agostoni, C.V.; Bresson, J.L.; Fairweather-Tait, S. Scientific opinion on dietary reference values for water. EFSA J. 2010, 8, 1–47. [Google Scholar]
- El-Sharkawy, A.M.; Watson, P.; Neal, K.R.; Ljungqvist, O.; Maughan, R.J.; Sahota, O.; Lobo, D.N. Hydration and outcome in older patients admitted to hospital (The HOOP prospective cohort study). Age Ageing 2015, 44, 943–947. [Google Scholar] [CrossRef] [PubMed]
- Schwan, H.P. Electrical properties of tissue and cell suspensions. Adv. Biol. Med. Phys. 1957, 5, 147–209. [Google Scholar] [PubMed]
- Wabel, P.; Chamney, P.; Moissl, U.; Jirka, T. Importance of whole-body bioimpedance spectroscopy for the management of fluid balance. Blood Purif. 2009, 27, 75–80. [Google Scholar] [CrossRef] [PubMed]
- Rothlingshofer, L.; Ulbrich, M.; Hahne, S.; Leonhardt, S. Monitoring change of body fluid during physical exercise using bioimpedance spectroscopy and finite element simulations. J. Electr. Bioimped. 2011, 2, 79–85. [Google Scholar] [CrossRef]
- MirHojjat, S.; Kibret, B.; Lai, D.T.H.; Faulkner, M. A survey on intrabody communications for body area network applications. IEEE Trans. Biomed. Eng. 2013, 60, 2067–2079. [Google Scholar]
- Mentes, J.C.; Wakefield, B.; Culp, K. Use of a Urine Color Chart to Monitor Hydration Status in Nursing Home Residents. Biol. Res. Nurs. 2006, 7, 173–203. [Google Scholar] [CrossRef]
- Francesconi, R.P.; Hubbard, R.W.; Szlyk, P.C.; Schnakenberg, D.; Carlson, D.; Leva, N.; Sils, I.; Hubbard, L.; Pease, V.; Young, J. Urinary and hematologic indexes of hypohydration. J. Appl. Physiol. 1987, 62, 1271–1276. [Google Scholar]
- Fortes, M.B.; Owen, J.A.; Raymond-Barker, P.; Bishop, C.; Elghenzai, S.; Oliver, S.J.; Walsh, N.P. Is this elderly patient dehydrated? Diagnostic accuracy of hydration assessment using physical signs, urine, and saliva markers. J. Am. Med. Dir. Assoc. 2015, 16, 221–228. [Google Scholar] [CrossRef] [PubMed]
- Gao, W.; Emaminejad, S.; Nyein, H.Y.Y.; Challa, S.; Chen, K.; Peck, A.; Fahad, H.M.; Ota, H.; Shiraki, H.; Kiriya, D.; et al. Fully integrated wearable sensor arrays for multiplexed in situ perspiration analysis. Nature 2016, 529, 509–514. [Google Scholar] [CrossRef] [PubMed]
- Kibret, B.; Seyedi, M.; Lai, D.T.H.; Faulkner, M. Investigation of Galvanic Coupled Intrabody Communication using Human Body Circuit Model. IEEE J. Biomed. Health Inform. 2014, 62, 1196–1206. [Google Scholar] [CrossRef] [PubMed]
- Asogwa, C.O.; Teshome, A.K.; Lai, D.T.H.; Collins, S.F. A Circuit Model of Real Time Human Body Hydration. IEEE Trans. Biomed. Eng. 2016, 63, 1239–1247. [Google Scholar] [CrossRef] [PubMed]
- Lentner, C. Geigy scientific tables: Units of measurement, body fluids, composition of the body, nutrition. Basle Ciba-Geigy 1981, 1. [Google Scholar]
- Kavouras, S. Assessing hydration status. Curr. Opin. Clin. Nutr. Metab. Care 2002, 5, 519–524. [Google Scholar] [CrossRef] [PubMed]
- Shirreffs, S.M. Markers of hydration status. Eur. J. Clin. Nutr. 2003, 57, S6–S9. [Google Scholar] [CrossRef] [PubMed]
- Mifflin, M.D.; St Jeor, S.T.; Hill, L.A.; Scott, B.J.; Daugherty, S.A.; Koh, Y.O. A new predictive equation for resting energy expenditure in healthy individuals. Am. J. Clin. Nutr. 1990, 51, 241–247. [Google Scholar] [PubMed]
- Armstrong, L.E. Hydration assessment techniques. Nutr. Res. 2005, 63 (Suppl. 1), S40–S54. [Google Scholar]
- Armstrong, L.E.; Soto, J.A.H.; Hacker, F.T., Jr.; Douglas, J.C.; Kavouras, S.A.; Maresh, C.M. Urinary indices during dehydration, exercise, and rehydration. Int. J. Sport Nutr. 1998, 8, 345–355. [Google Scholar] [PubMed]
- Armstrong, L.E.; Maresh, C.M.; Castellani, J.W.; Bergeron, M.F.; Kenefick, R.W.; LaGasse, K.E.; Riebe, D. Urinary indices of hydration status. Int. J. Sport Nutr. 1994, 4, 265–279. [Google Scholar] [PubMed]
- Asogwa, C.O.; Seyedi, M.; Lai, D.T. A preliminary investigation of human body composition using galvanically coupled signals. In Proceedings of the 9th International Conference on Body Area Networks, ICST (Institute for Computer Sciences, Social-Informatics and Telecommunications Engineering), London, UK, 29 September 2014; pp. 346–351.
- Peronnet, F.; Mignault, D.; Du Souich, P.; Vergne, S.; Le Bellego, L.; Jimenez, L.; Rabasa-Lhoret, R. Pharmacokinetic analysis of absorption, distribution and disappearance of ingested water labelled with D2O in humans. Eur. J. Appl. Physiol. 2012, 112, 2213–2222. [Google Scholar] [CrossRef] [PubMed]
- Wegmueller, M.S. Intra-body communication for biomedical seensor networks. Ph.D. Dissertation, ETH Zurich, Zurich, Switzerland, 2007. [Google Scholar]
- Skelton, H. The storage of water by various tissues of the body. Arch. Intern. Med. 1927, 40, 140–152. [Google Scholar] [CrossRef]
- Jequier, E.; Constant, F. Water as an essential nutirent: the physiological basis of hydration. Eur. J. Clin. Nutr. 2009, 64, 115–123. [Google Scholar] [CrossRef] [PubMed]
- Bankir, L.; Bouby, N.; Trinh-Trang-Tan, M.M. The role of the kidney in the maintenance of water balance. Baillière Clin. Endoc. 1989, 3, 249–311. [Google Scholar] [CrossRef]
- Sands, J.M.; Layton, H.E. The physiology of urinary concentration: An update. Semin. Nephrol. 2009, 29, 178–195. [Google Scholar] [CrossRef] [PubMed]
- Oppliger, R.A.; Magnes, S.A.; Popowskim, L.A.; Gisolfi, C.V. Accuracy of urine specific gravity and osmolality as indicators of hydration status. Int. J. Sport Nutr. Exerc. Metab. 2005, 15, 236–251. [Google Scholar] [PubMed]
- Armstrong, L.E. Assessing hydration status: the elusive gold standard. J. Am. Coll. Nutr. 2007, 26, 575S–584S. [Google Scholar] [CrossRef] [PubMed]
- Lukaski, H.C. Applications of Bioelectrical Impedance Analysis: A Critical Review. In In Vivo Body Composition Studies; Springer US: NY, USA, 1990; pp. 365–374. [Google Scholar]
- Van Loan, M.D.; Withers, P.; Matthie, J.; Mayclin, P.L. Use of bioimpedance spectroscopy to determine extracellular fluid, intracellular fluid, total body water, and fat-free mass. In Human Body Composition; Springer US: NY, USA, 1993; pp. 67–70. [Google Scholar]


| Subject | BMI | Volume of | Elapsed Time | SPG1 | SPG2 | |||
|---|---|---|---|---|---|---|---|---|
| (kg/m) | (kg) | (kg) | (kg) | Urine (mL) | (Minutes) | before Drink | after Drink | |
| A | 29.3 | 87.60 | 88.15 | 88.10 | 75 | 118 | 1.021 | 1.018 |
| B *** | 20.8 | 56.70 | 57.30 | 57.10 | 190 | 61 | 1.030 | 1.007 |
| C | 24.2 | 72.55 | 73.10 | 72.60 | 250 | 56 | 1.025 | 1.010 |
| D ** | 31.4 | 83.15 | 83.55 | 83.15 | 340 | 76 | 1.016 | 1.010 |
| E | 33.1 | 93.40 | 93.90 | 93.50 | 305 | 111 | 1.017 | 1.008 |
| F * | 28.5 | 75.65 | 76.15 | 75.30 | 360 | 95 | 1.020 | 1.005 |
| G ** | 23.5 | 62.80 | 63.20 | 62.80 | 330 | 60 | 1.016 | 1.010 |
| H | 31.4 | 101.00 | 101.60 | 101.40 | 150 | 70 | 1.020 | 1.015 |
| I | 26.4 | 81.65 | 82.10 | 81.85 | 220 | 99 | 1.023 | 1.014 |
| J | 36.5 | 104.25 | 104.75 | 104.35 | 325 | 125 | 1.021 | 1.016 |
| K | 22.9 | 76.00 | 76.55 | 76.30 | 100 | 70 | 1.019 | 1.016 |
| L | 23.7 | 73.50 | 74.20 | 73.80 | 300 | 51 | 1.020 | 1.007 |
| M *** | 25.6 | 95.30 | 95.70 | 95.50 | 200 | 60 | 1.031 | 1.007 |
| N | 25.9 | 78.60 | 79.10 | 78.80 | 175 | 86 | 1.024 | 1.010 |
| O * | 42.5 | 122.8 | 123.30 | 122.25 | 400 | 155 | 1.011 | 1.010 |
| P | 24.4 | 64.00 | 64.50 | 63.90 | 250 | 77 | 1.021 | 1.005 |
| Q | 21.9 | 60.30 | 60.75 | 60.50 | 125 | 78 | 1.017 | 1.014 |
| R | 23.7 | 66.20 | 66.80 | 66.40 | 350 | 93 | 1.017 | 1.004 |
| S | 24.0 | 67.70 | 68.30 | 68.00 | 250 | 62 | 1.023 | 1.006 |
| T | 26.1 | 92.35 | 92.60 | 92.50 | 175 | 47 | 1.020 | 1.008 |
| Fluid Intake = 100 mL | ||||||
|---|---|---|---|---|---|---|
| Subject | BMI | SPG1 | SPG2 | |||
| (kg/m) | (kg) | (kg) | (kg) | before Drink | after Drink | |
| D | 29.83 | 82.20 | 82.30 | 82.20 | 1.014 | 1.014 |
| K | 23.58 | 78.10 | 78.20 | 78.20 | 1.022 | 1.021 |
| L | 23.44 | 72.60 | 72.70 | 72.60 | 1.023 | 1.021 |
| Fluid Intake = 250 mL | ||||||
|---|---|---|---|---|---|---|
| Subject | BMI | SPG1 | SPG2 | |||
| (kg/m) | (kg) | (kg) | (kg) | before Drink | after Drink | |
| D | 29.65 | 81.70 | 81.90 | 81.80 | 1.016 | 1.012 |
| K | 23.81 | 77.95 | 78.20 | 78.10 | 1.025 | 1.018 |
| L | 23.27 | 72.10 | 72.40 | 72.20 | 1.021 | 1.010 |
| Fluid Intake = 300 mL | ||||||
|---|---|---|---|---|---|---|
| Subject | BMI | SPG1 | SPG2 | |||
| (kg/m) | (kg) | (kg) | (kg) | before Drink | after Drink | |
| D | 29.90 | 82.40 | 82.70 | 82.55 | 1.014 | 1.014 |
| K | 23.81 | 78.00 | 78.20 | 78.10 | 1.023 | 1.021 |
| L | 23.34 | 72.30 | 72.60 | 72.35 | 1.018 | 1.007 |
© 2016 by the authors; licensee MDPI, Basel, Switzerland. This article is an open access article distributed under the terms and conditions of the Creative Commons Attribution (CC-BY) license (http://creativecommons.org/licenses/by/4.0/).
Share and Cite
Asogwa, C.O.; Collins, S.F.; Mclaughlin, P.; Lai, D.T.H. A Galvanic Coupling Method for Assessing Hydration Rates. Electronics 2016, 5, 39. https://doi.org/10.3390/electronics5030039
Asogwa CO, Collins SF, Mclaughlin P, Lai DTH. A Galvanic Coupling Method for Assessing Hydration Rates. Electronics. 2016; 5(3):39. https://doi.org/10.3390/electronics5030039
Chicago/Turabian StyleAsogwa, Clement Ogugua, Stephen F. Collins, Patrick Mclaughlin, and Daniel T.H. Lai. 2016. "A Galvanic Coupling Method for Assessing Hydration Rates" Electronics 5, no. 3: 39. https://doi.org/10.3390/electronics5030039