
Sentiment Analysis of Users’ Reactions on Social Media during the Pandemic
by
 , and
, and
Eldor Abdukhamidov
1, 
Firuz Juraev
1,
Mohammed Abuhamad
2,
Shaker El-Sappagh
1,3,4 and
Tamer AbuHmed
1,*
1
Department of Computer Science and Engineering, Sungkyunkwan University, Suwon 16419, Korea
2
Department of Computer Science, Loyola University Chicago, Chicago, IL 60626, USA
3
Faculty of Computer Science and Engineering, Galala University, Suez 435611, Egypt
4
Information Systems Department, Faculty of Computers and Artificial Intelligence, Benha University, Banha 13518, Egypt
*
Author to whom correspondence should be addressed.
Electronics 2022, 11(10), 1648; https://doi.org/10.3390/electronics11101648
Submission received: 3 April 2022
/
Revised: 6 May 2022
/
Accepted: 17 May 2022
/
Published: 22 May 2022
(This article belongs to the Section Electronic Materials)
Abstract
:During the outbreak of the COVID-19 pandemic, social networks became the preeminent medium for communication, social discussion, and entertainment. Social network users are regularly expressing their opinions about the impacts of the coronavirus pandemic. Therefore, social networks serve as a reliable source for studying the topics, emotions, and attitudes of users that have been discussed during the pandemic. In this paper, we investigate the reactions and attitudes of people towards topics raised on social media platforms. We collected data of two large-scale COVID-19 datasets from Twitter and Instagram for six and three months, respectively. This paper analyzes the reaction of social network users in terms of different aspects including sentiment analysis, topic detection, emotions, and the geo-temporal characteristics of our dataset. We show that the dominant sentiment reactions on social media are neutral, while the most discussed topics by social network users are about health issues. This paper examines the countries that attracted a higher number of posts and reactions from people, as well as the distribution of health-related topics discussed in the most mentioned countries. We shed light on the temporal shift of topics over countries. Our results show that posts from the top-mentioned countries influence and attract more reactions worldwide than posts from other parts of the world.
1. Introduction
COVID-19 has spread rapidly around the world since December 2019. The disease is considered a pandemic, and has impacted many countries across all living continents. Due to its consequences (infection, increasing death rate), governments developed policies to decrease the virus’ spread. Quarantine and social distancing are among the measures taken by governments as emerging actions. Such measures have led to the cessation of social events, the start of online lectures for students at all levels, the reduction of working hours at workplaces, and the switch to telecommuting. As a result, social networks have become the main platform for people to express opinions and share information. Social media platforms, such as Instagram and Twitter, have grown due to measures such as social distancing.
Recently, various research studies have been conducted on COVID-19-related issues [1,2], including spread modeling [3], case prediction [4,5], social network reactions [6], diagnosis [7,8,9,10], etc. This paper presents analyses of how users react on Twitter and Instagram in posts and on topics discussed during the pandemic. Our analyses include a sentiment study on topics and posts from the two social media platforms, an in-depth analysis of the geographical distribution and influence traits, and an investigation of the geo-temporal characteristics of people’s reactions. To this end, we collect and analyze two large-scale datasets from Twitter and Instagram. In recent years, machine learning has become increasingly popular in research and has been implemented in a variety of fields, such as medical applications [11,12], computer security [13], etc. We utilize state-of-the-art deep learning-based natural language processing (NLP) methods to derive linguistic annotations for the sentiments of COVID-19-related tweets and posts. This step includes topic modeling using latent Dirichlet allocation (LDA) on the datasets with different sentiment types (i.e., very negative, negative, neutral, positive, very positive). The adopted topic modeling approach enables discovering topics discussed by people on the social platforms and the per-topic sentiment analysis. We also employed named entity recognition (NER) methods to identify named entities from tweets and posts related to geographical locations, such as countries. For our analysis, the top-five positively mentioned countries are selected for further investigation regarding the discovery of the geo-temporal characteristics of people’s reactions. Moreover, we explore the spikes in sentiments in posts from the top-mentioned countries and study the topics during these spike periods. In addition, we analyze the geo-temporal characteristics using state-of-the-art NLP-based methods to observe the temporal shift in the frequency of posts and topics and the reactions towards posts from the top-mentioned countries over time.
Our study aims to answer the following main research questions: (1) What are the major topics that people discuss during the pandemic and their reactions to these topics? (2) What are the geographical characteristics of posts on social networks, and are there localities that are more influenced by the pandemic than others? (3) Focusing on the top-mentioned and most-influential geographical localities, what are the major discussed topics? (4) What geo-temporal characteristics do the topics discussed during the pandemic exhibit? During the period of observation, do these topics evolve, diminish, or persist? To sum up, an outline of our contributions is listed below.
- We collected a large-scale dataset of users’ posts and tweets from Twitter and Instagram.
- A sentiment analysis was conducted for social networks based on five sentiment categories: very negative, negative, neutral, positive, and very positive.
- Topic modeling analysis on the sentiment categories was carried out to identify overall public reactions to COVID-19-related tweets and posts.
- An exploration of geo-temporal characteristics based on countries was performed to recognize countries that are mentioned in COVID-19-related tweets and posts (we refer to them as top countries).
- We also performed a sentiment analysis of the top countries to determine people’s emotional responses regarding the most-mentioned countries.
- Exploiting the applied topic modeling technique, we extracted the major discussed topics concerning the top-mentioned countries in our dataset.
- An analysis based on word2vec embedding was conducted to discover the shift in the words and topics used with the top countries over time.
- The study provided a locality analysis of the top countries to find countries where tweets and Instagram posts about the top countries are published.
The rest of the paper is organized as follows. Section 2 explores the related works studying people’s reactions on social networks during the COVID-19 pandemic. Section 3 presents the methods used for the data collection and a description of the collected data. Section 4 shows our sentiment analysis on the collected dataset. The per-sentiment topic modeling is described in Section 5. We provide the geo-temporal analysis on the collected dataset in Section 6 and conclude in Section 7.
2. Related Works
Since January 2020, several studies have explored the impact of COVID-19 on people’s daily lives. In this section, we review the main works related to the social networks analysis of COVID-19. The work of Schild et al. [14] was among the first studies to analyze people’s Sinophobic behavior on social media. Their work included studying two datasets of posts from Twitter and 4chan (/pol/) that were published between 1 November 2019 and 22 March 2020. Both datasets were used to explore whether there was an important change regarding the spread of Sinophobic content among social network users. The authors trained three word2vec models over the social network data to study the use of words and the major differences in using the most similar words, and to observe the development of new terms. The authors observed that COVID-19 caused the emergence of new Sinophobic slurs and a trend of blaming China for the COVID-19 pandemic.
Ordun et al. [15] proposed a paper to answer prevalent COVID-19-related questions about trends, news-making events, topics, retweets, and COVID-19 networks, by analyzing 23,830,322 tweets posted during the time period between 24 March 2020 and 9 April 2020. The authors revealed the top trends in tweets using keyword trend analysis. They adopted a topic modeling stage using latent Dirichlet allocation (LDA) to spot the events that cause sparks in COVID-19 tweets. Moreover, they used uniform manifold approximation and projection (UMAP) to find unique topics. The authors also applied network modeling to derive how social media users react to the spread of COVID-19. Their findings pointed out the huge attention/reaction given to the live White House coronavirus briefings and topics related to healthcare and government reactions. We note that the authors used a pre-filtered dataset with 13 healthcare-related terms from the Twitter Streaming API and reduced the dataset’s size by nearly 77% from 23,830,322 tweets to 5,506,223 tweets when they removed the retweets.
Li et al. [16] conducted a comprehensive analysis of datasets collected from Twitter and Weibo posted between 20 January 2020 and 11 May 2020. Six emotions including anger, disgust, fear, happiness, sadness, and surprise were identified based on the user-generated content. The authors compared people’s emotions in the United States and China to understand the different reactions towards COVID-19. Using NLP, the authors found the causes of public emotions, e.g., the reason for anger, surprise, and worry. The study indicated a strong contrast in people’s opinions about COVID-19 in different countries. However, the study was limited to two countries, i.e., the USA and China. The authors concluded with a suggestion to use real-time emotion analysis for methods and procedures for the fight against the global crisis.
Sharma et al. [17] proposed a dashboard for tracking misinformation on Twitter. Their work follows coronavirus-related discussions over time based on Twitter data between 1 March 2020 and 3 May 2020 to determine incorrect and deceptive content. The authors conducted an analysis of public sentiments on specific data that are filtered by keywords such as “#workfromhome” and “#socialdistance”. Additionally, they analyzed Twitter conversation topics, extracted hashtags that were emerging in different countries, and used tweets about countries to estimate public opinion. However, the dataset only contains tweets from a two-month period, limiting the insights that can be gained from the behavior of long-term social media users.
Lamsal [6] collected a large-scale Twitter dataset of English tweets related to COVID-19 from the period between 20 March 2020 and 17 July 2020. In their work, the authors used the dataset and its filtered version that included only geo-tagged tweets for sentiment analysis and network analysis. Tweets collected between 24 April 2020 and 17 July 2020 were utilized to study significant drops in the average sentiment over the period by generating a sentiment trend graph. The dataset that consisted of only geo-tagged tweets was used to conduct the network analysis; furthermore, it was used to generate the sentiment-based world and regional maps. The study identified 12 different communities based on the usage of similar hashtags within the dataset. The author also presented a set of popular hashtags and their associated communities.
Table 1 provides a summary of the most closely related studies in comparison to the features studied in this research based on the Twitter dataset.
3. Datasets
We collected two large-scale COVID-19-related datasets from Twitter and Instagram to study the topics discussed and people’s emotions on social networks during the pandemic. Because of the social networks’ privacy policies, the datasets that we collected cannot be shared. However, interested researchers can contact the authors to receive the posts’ IDs. This section describes the collected datasets.
- Twitter
For our Twitter data collection, we collected 131,083,839 tweets posted between 21 January 2020 and 19 June 2020. We leveraged many tools, such as Hydrator [29] and twarc [30], to rehydrate the tweet IDs that were made publicly available by Chen et al. [26]. Moreover, we utilized TWINT [31], an advanced Twitter scraping and OSINT tool in Python, to enrich our data collection. To concentrate on pandemic-related tweets, we targeted tweets with hashtags such as “#covid19”, “#corona”, “#staysafe”, “#covid_19”, “#covid2019”, “#lockdown”, “#stayhome”, “#quarantinelife”, “#coronacrisis”, “#coronavirus”, “#quarantine”, etc. After filtering out retweets, i.e., focusing on unique tweets, the dataset was reduced by around 63% (i.e., from 131,083,839 to 48,387,435 unique tweets). Table 2 shows some details about the collected tweets in terms of length and count.
- Instagram
The Instagram posts were gathered using the open-source project called Instaloader [32] and the publicly available Instagram post IDs provided by Zarei et al. [33]. Our collection of Instagram posts includes a total of 3843 posts from 5 January 2020 to 30 March 2020. Concentrating on pandemic-related posts, we collected posts with hashtags such as “#coronavirus”, “#covid19”, “#covid_19”, and “#corona”. We filtered out non-English posts and focused on analyzing posts written in English. The Instagram dataset contains 2052 English posts in total. Table 3 shows some details about the collected Instagram dataset.
4. Sentiment Analysis
Although several studies have conducted sentiment analyses on social network data [17,20,28], the main purpose of this research is to conduct a comprehensive analysis to understand people’s worldwide reaction to the pandemic. Therefore, this study aims to incorporate sentiment analysis to gain insights into people’s reactions to topics and trends in different time periods so it becomes feasible to discover geo-temporal patterns of users’ behavior. This section describes the methods and results of the sentiment analysis on our datasets.
- Methods
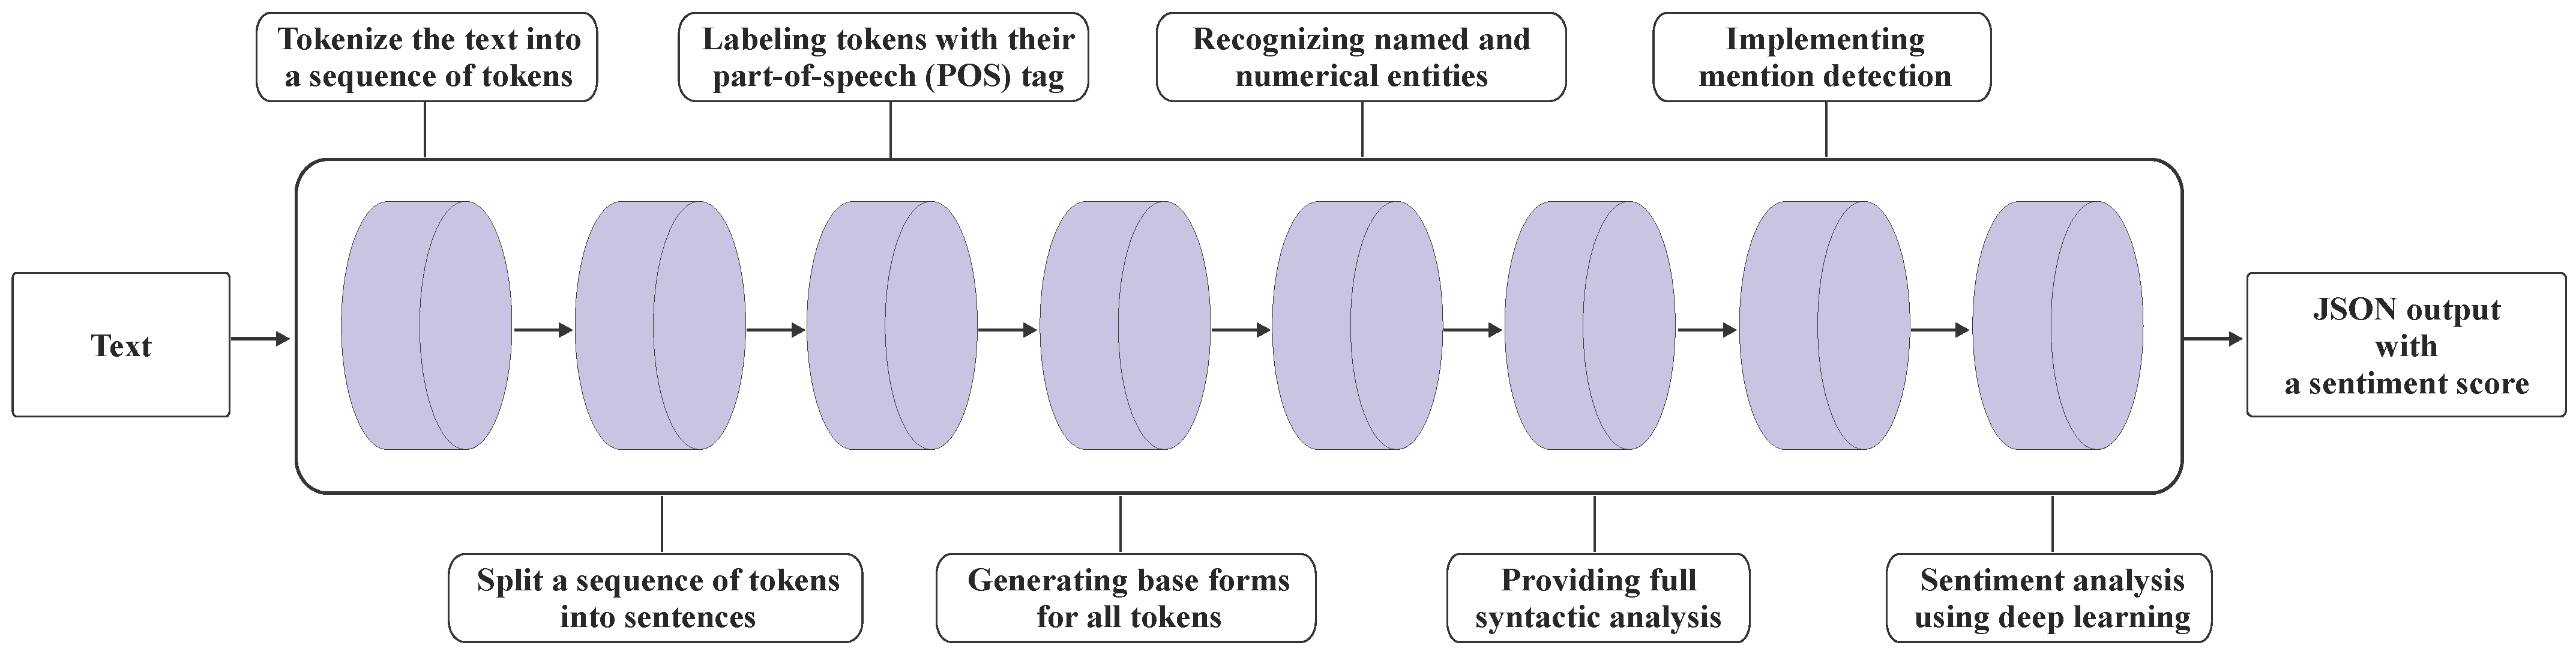
Before conducting our analysis on the collected datasets, we adopted a pre-processing stage which includes cleaning the data, removing URL links, emails, user mentions, punctuation, stopwords, and converting emojis and emoticons into words. As deep learning techniques have shown powerful performance in the intelligent processing of data in several domains [34,35,36,37,38], we leverage the NLP-based toolkit called Stanford CoreNLP [39] that provides an extensible pipeline supporting core NLP tasks. CoreNLP [39] is based on a compositional model over binarized trees of sentences using deep learning [40], and it contains a collection of pre-trained models. Figure 1 illustrates the CoreNLP architecture, starting from providing input content and ending with an output of all the analysis information as a JSON file. The output includes the sentiment score represented with a value ranging from zero to four, where four means that the input is very positive and zero means the input is very negative.
- Twitter
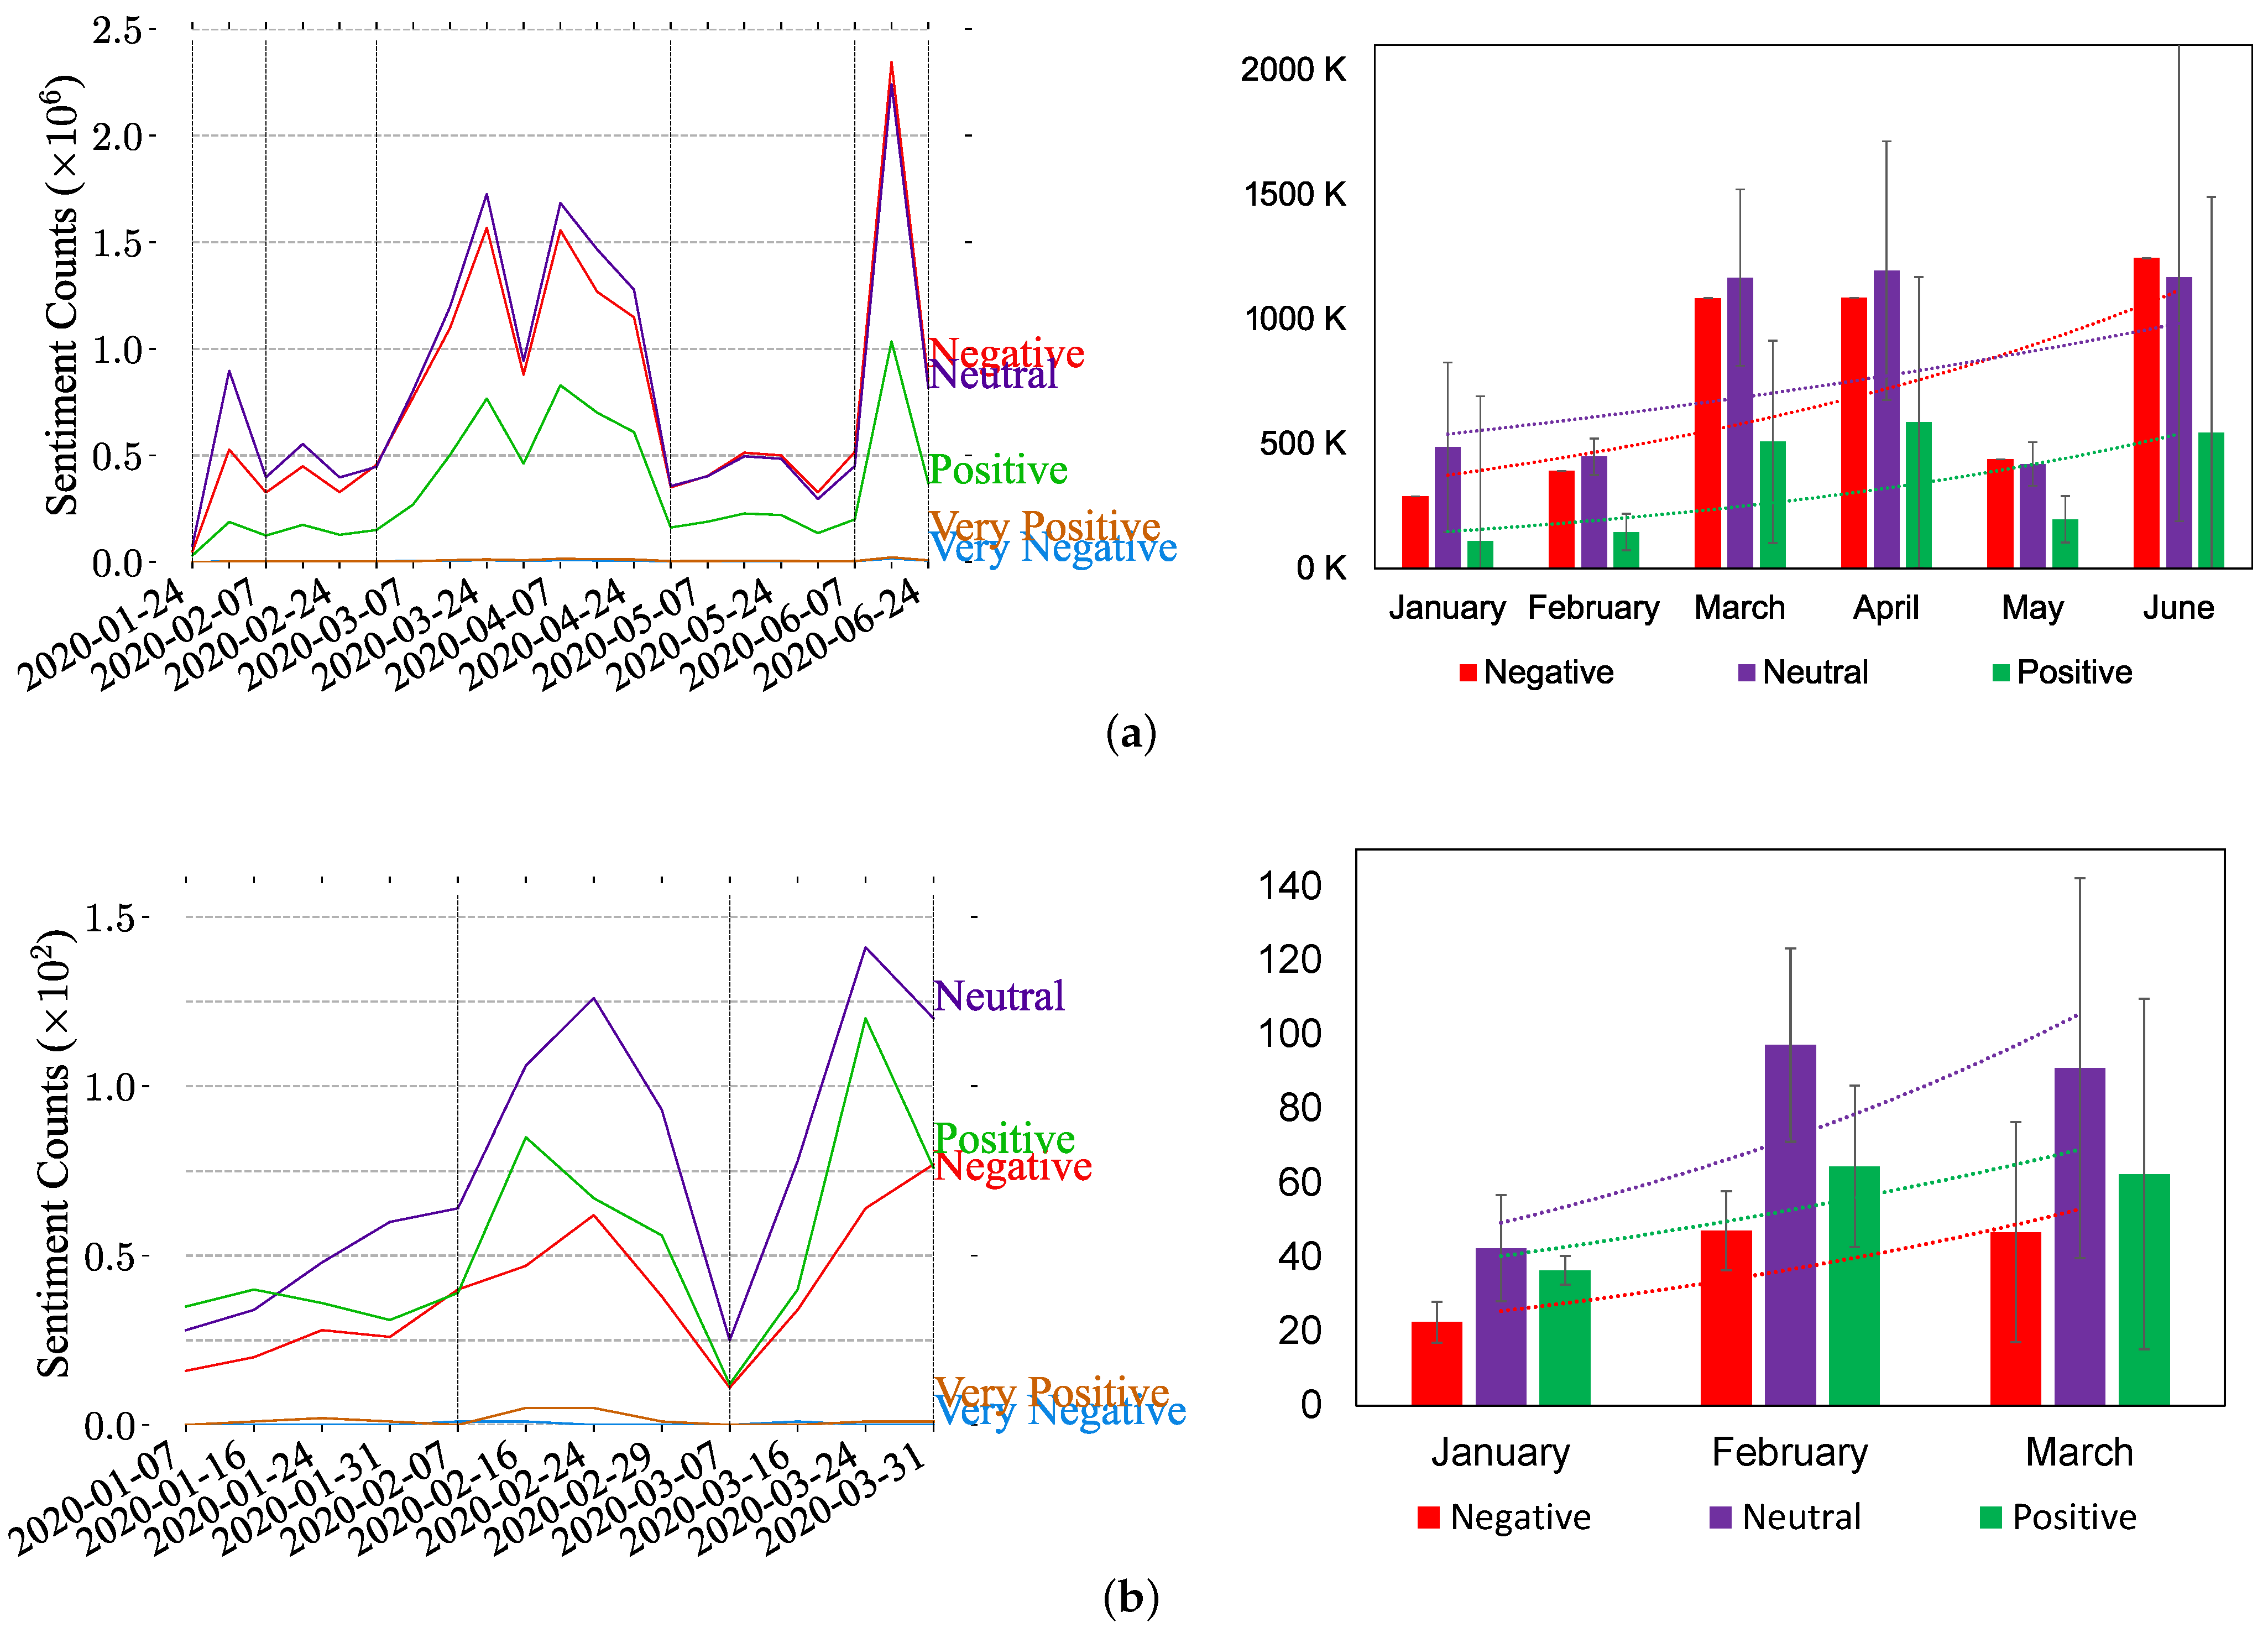
We performed the analysis on all tweets based on the five sentiment categories (very negative, negative, neutral, positive, and very positive). Figure 2a represents the distribution of sentiments in all the collected tweets from between 24 January 2020 and 24 June 2020. Observing the sentiment during the data collection timeline, Figure 2 shows that most of the tweets are neutral in general. However, most tweets in June are negative. In March, April, and June, there are significant spikes that occurred, and we can also consider the rise in January as a spike because of a small but marked increase. These spikes are highlighted in the figure with vertical yellow dashed lines to indicate which part of the dataset is used to identify topics discussed on each sentiment type in the next section.
- Instagram
The same sentiment categories (very negative, negative, neutral, positive, and very positive) are applied to the Instagram dataset. Figure 2b shows the sentiment analysis of collected posts from between the period of 7 January 2020 and 31 March 2020. In the figure, it is shown that the neutral category is dominant over others. In contrast with the results of Twitter, the second dominant category is positiveness while it is the negative type in Figure 2a. The result has two spikes in posts from February and March (highlighted with vertical black dashed lines).
5. Topic Modeling on Sentiment Types
In this section, we conduct the topic modeling task on the data collected during spikes of users’ reactions, i.e., covering different sentiment types (negative, positive, neutral). As observed by our sentiment analysis, we re-categorized sentiments into three types instead of five, to discover topics discussed on the social media platforms that attracted these sentiments. This per-sentiment topic modeling enables the understanding of people’s reactions to certain topics.
- Methods
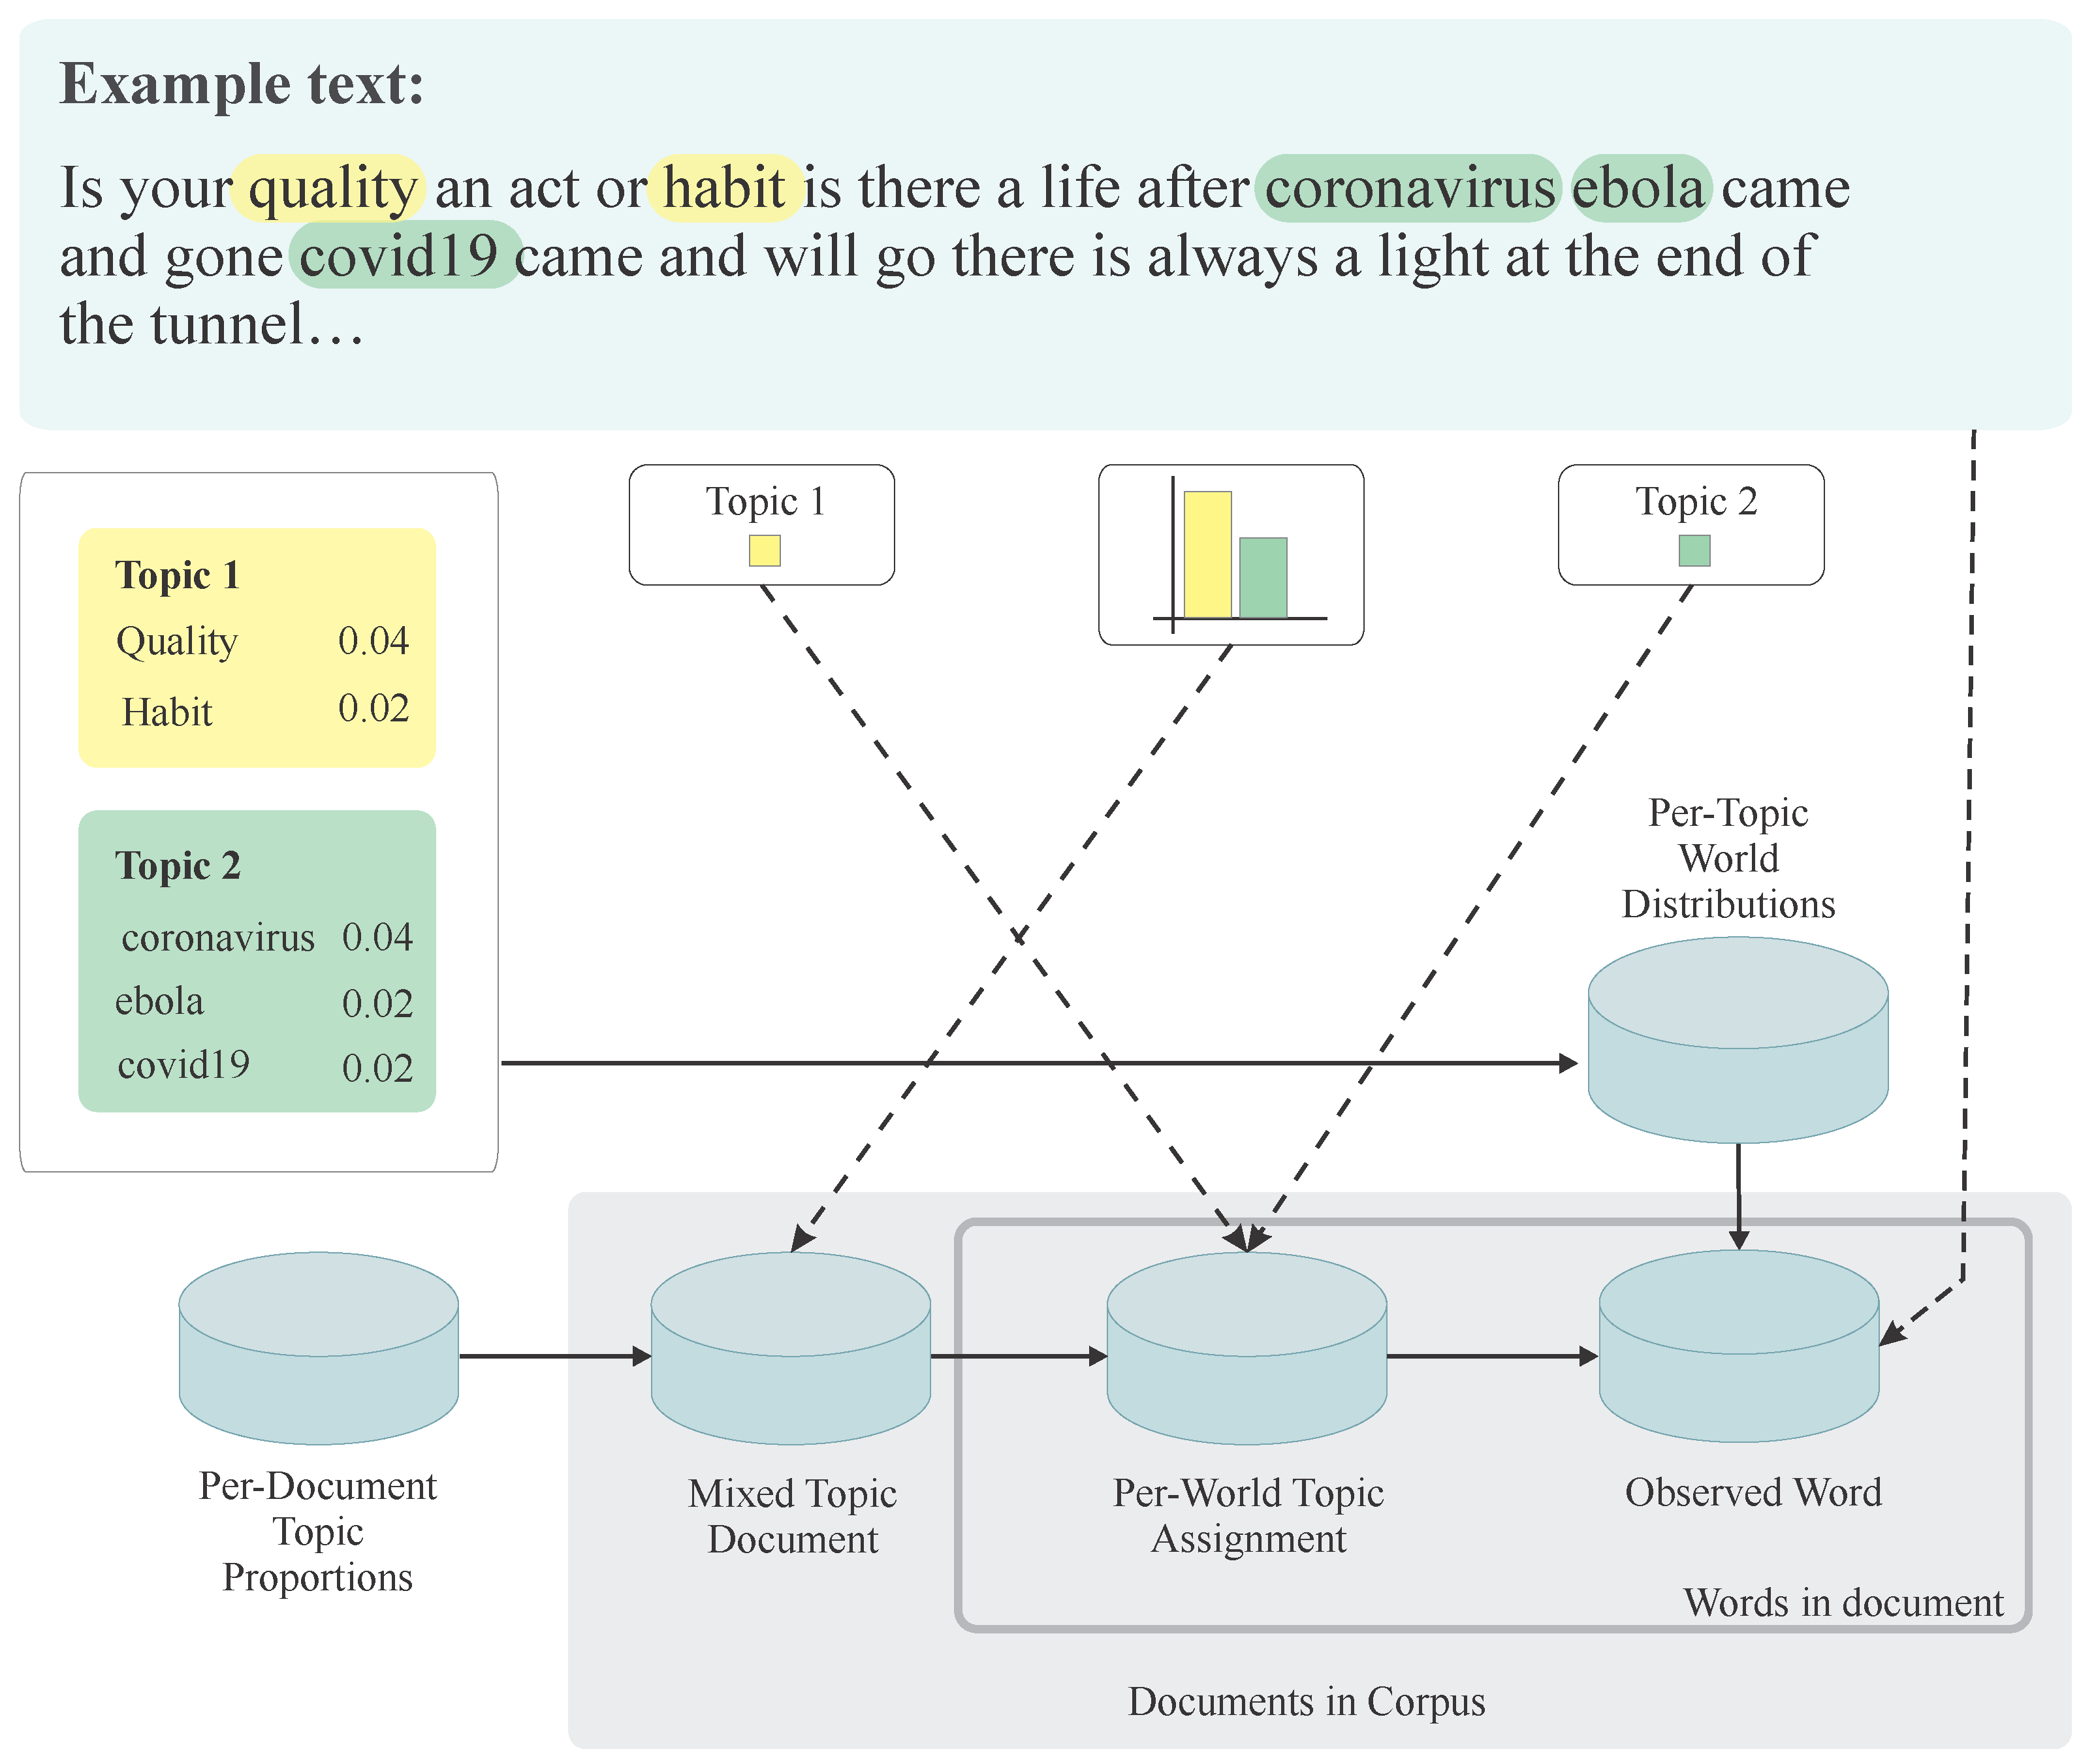
For topic modeling, we utilized the popular latent Dirichlet allocation (LDA) [41] method. We leverage the implementation of LDA in the Gensim package along with the Mallet [42] implementation to extract the topics discussed during the spike periods of various sentiment types. LDA with Mallet is an efficient technique to extract topics with sufficient topic segregation. Figure 3 shows a brief description of the LDA model. As shown in Figure 3, the two corpus-level parameters (documents in corpus and the words in the document) represent a Bayesian method for randomly sampling a mixture of topics for each document. Firstly, the LDA process goes through each document and assigns each word in each document (tweet or post) to one of the N topics (N is set by us) randomly. Then LDA checks each word in all documents again and calculates the proportion of words in each document and the proportion of assigning words to each topic. By performing this process repeatedly, LDA shifts words around topics to find the most suitable one. At the end of the process, good quality topics that are clear, meaningful, and segregated are extracted.
To improve the generation of topics, we have taken into consideration some key factors, such as the quality of the presented text, the number of topics per tweet or post, the total number of topics, and the various parameters of the algorithm. For the quality of the presented text, we adopt a preprocessing stage to make the input content ready for the analysis. This preprocessing stage includes the removal of stopwords, emails, user mentions, extra spaces, URL links, and punctuation. It also includes tokenization, lemmatization, and the extraction of unigrams, bigrams, and trigrams.
- LDA Model Selection
We used the topic coherence score to estimate how well a model provides different topics. To this end, we experimented with a different number of topics, from 2 to 30 topics, to evaluate the LDA model’s performance in generating topics with a high coherence value. For example, Ordun et al. [15] selected the LDA model that generated 20 topics with a 0.344 coherence score. Similarly, Sharma et al. [17] identified 20 different topics using topic modeling based on compressed text classification.
Remark 1.
We only apply topic modeling on Twitter and Instagram data during the spike periods shown in Figure 2. Since the size of the data in those periods is different, we have different numbers of topics per spike period. The generated topics are then assigned into a set of predefined general categories, namely, economy, health, social, politics, and tourism. Table 4 shows the results of our topic modeling technique. In the table, total topics with corresponding coherent scores, as well as the number of topics that belong to general categories, are given. It should be noted that a new category called “fashion” is added to the table, as our analysis on the Instagram dataset generated this topic.
- Twitter
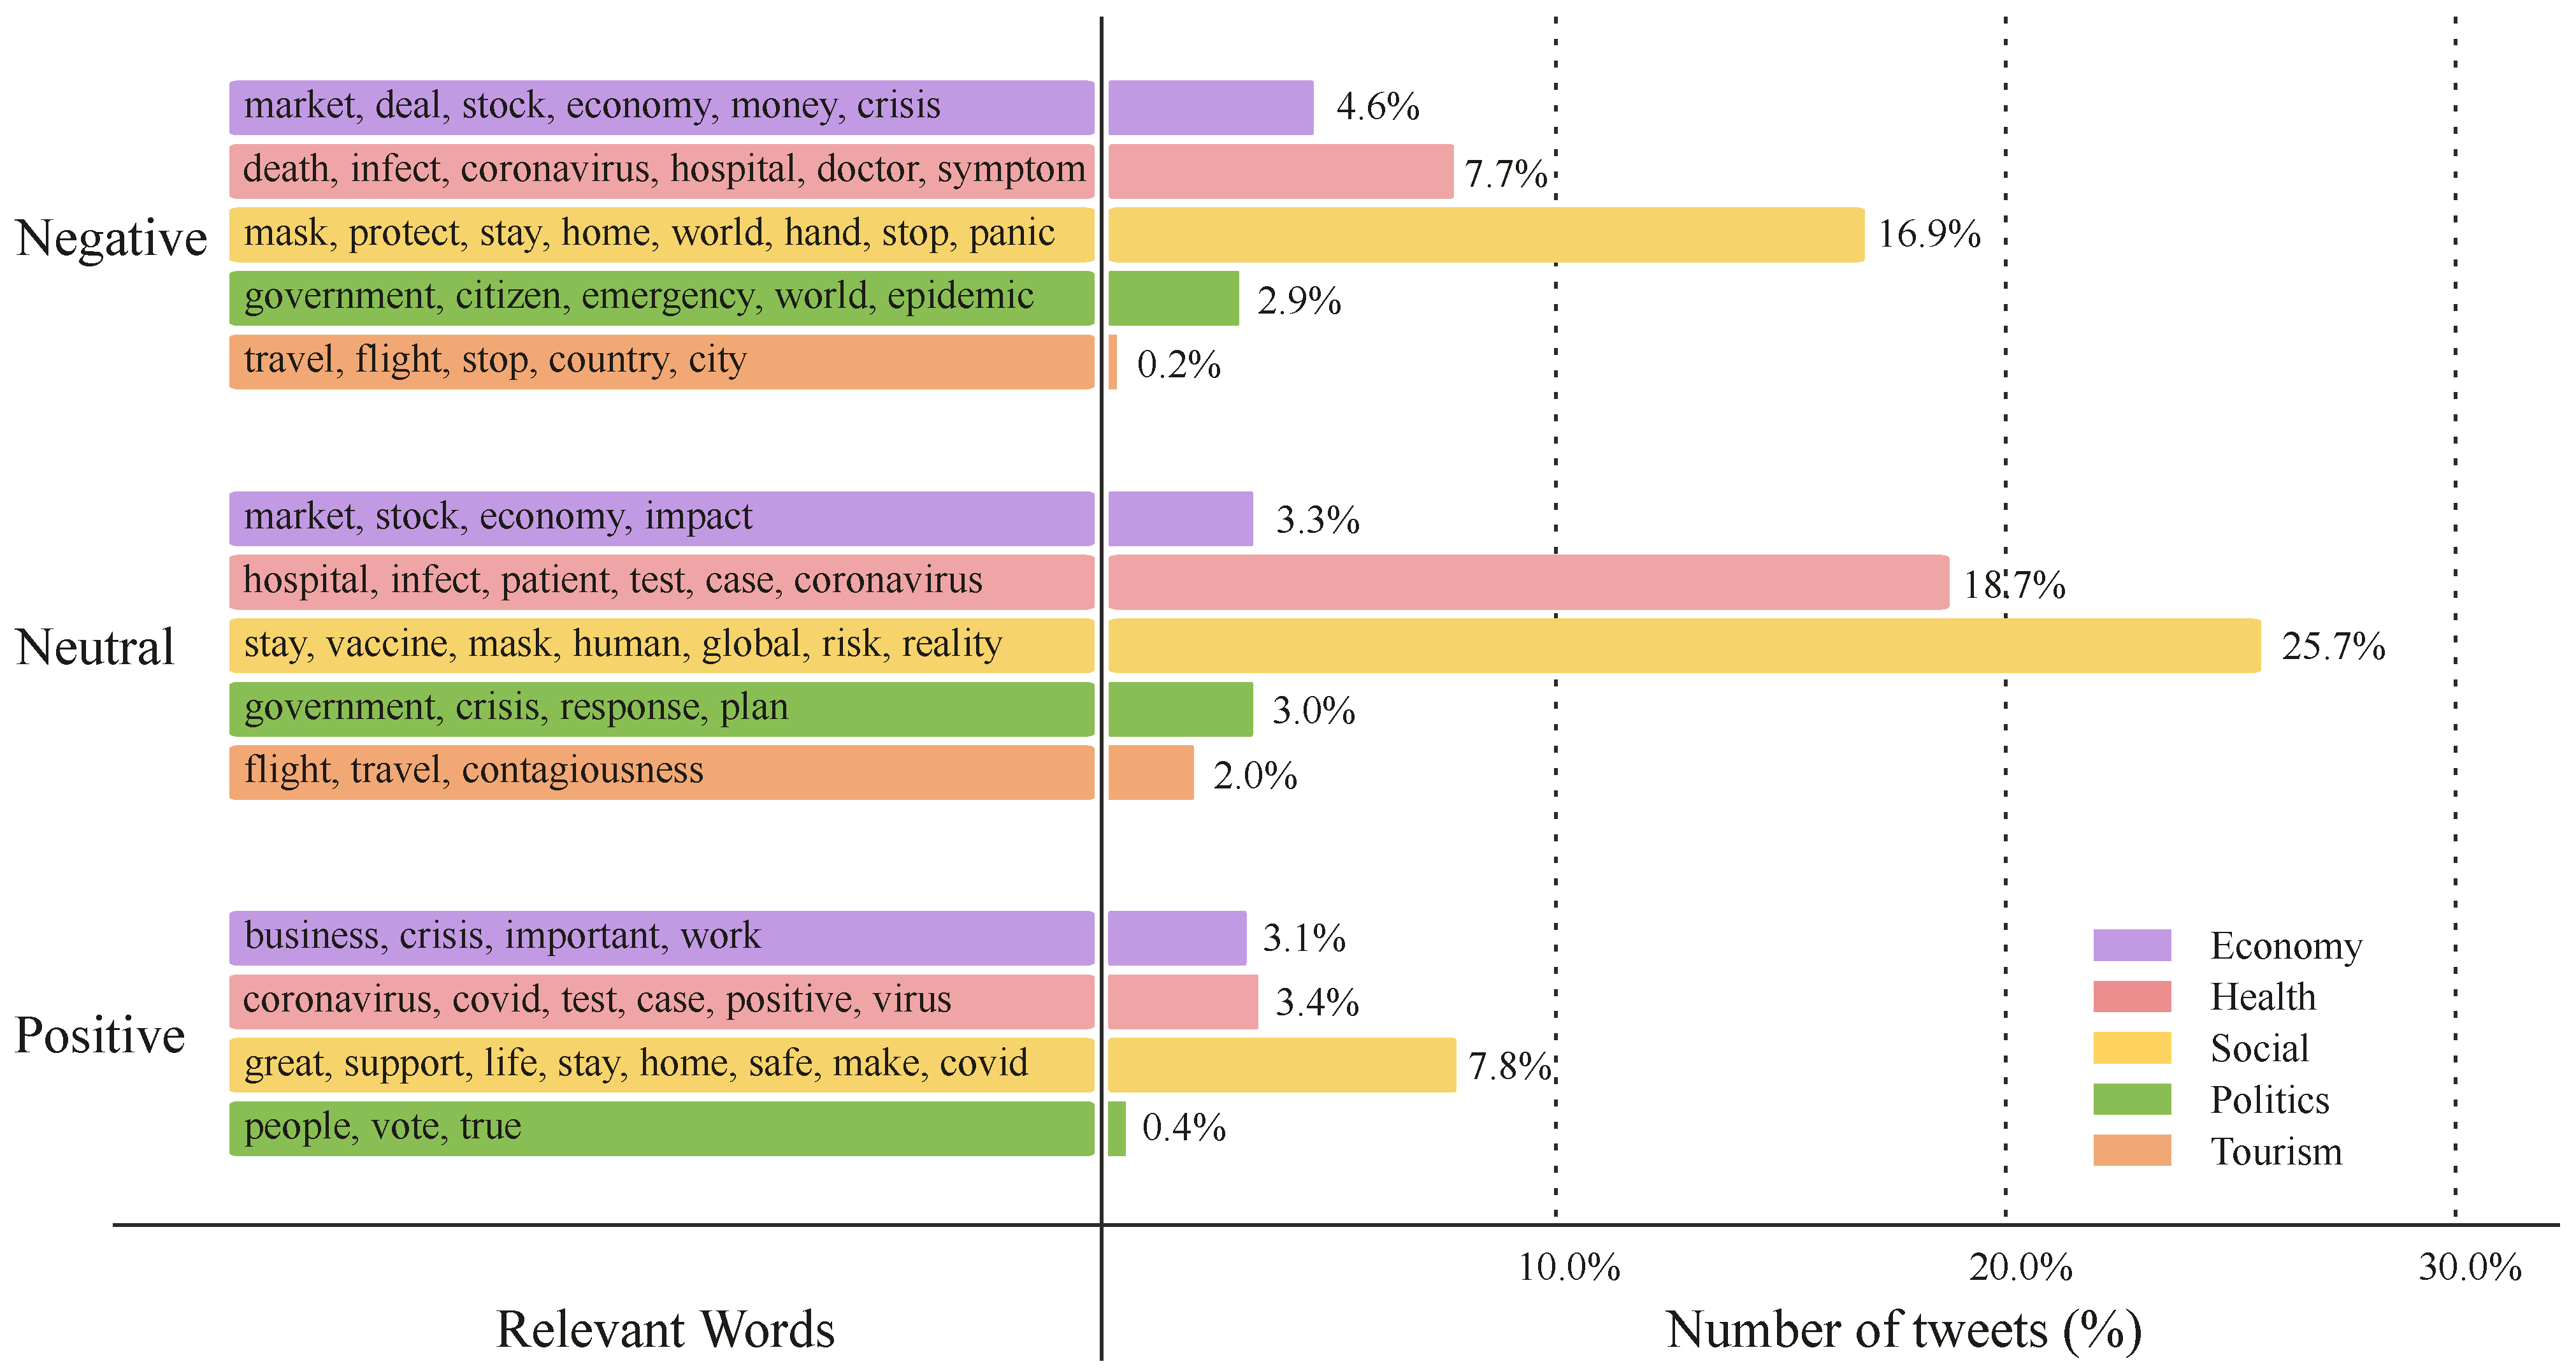
Figure 4 shows the result of topic modeling on the Twitter dataset. The figure is divided into two parts by the vertical line: the left part shows the corresponding keywords that the topics express, and the right part shows the distribution of each topic on the analyzed dataset (in percentage). The topics are also grouped into three sentiment classes: negative, positive, and neutral. It is interesting to note that the rank distribution of the topics is the same for all sentiment types. The figure shows that tweets about social-related topics are the most common compared to other categories, accounting for about 50.4% of the total tweets. The most observed keywords of various topics describe the people’s intent to notify and advise others about quarantine rules and ways to stay safe. On the other hand, the least discussed topic in tweets is travel, accounting for 0.2% and 2% for the negative and neutral groups, respectively. For the positive category, the least discussed topic is the politics category, accounting for 0.4% of the total tweets. Our analysis shows that most tweets belong to the neutral type, proportionally populating the topics observed by the topic modeling task. Tweets assigned to the economy-related topic attract more negative sentiments with 4.6% of the total tweets compared to 3.3% and 3.1% expressing neutral and positive sentiments, respectively. This trend of people’s reaction towards economy-related topics reflects their concerns about the impact of COVID-19 on the economy.
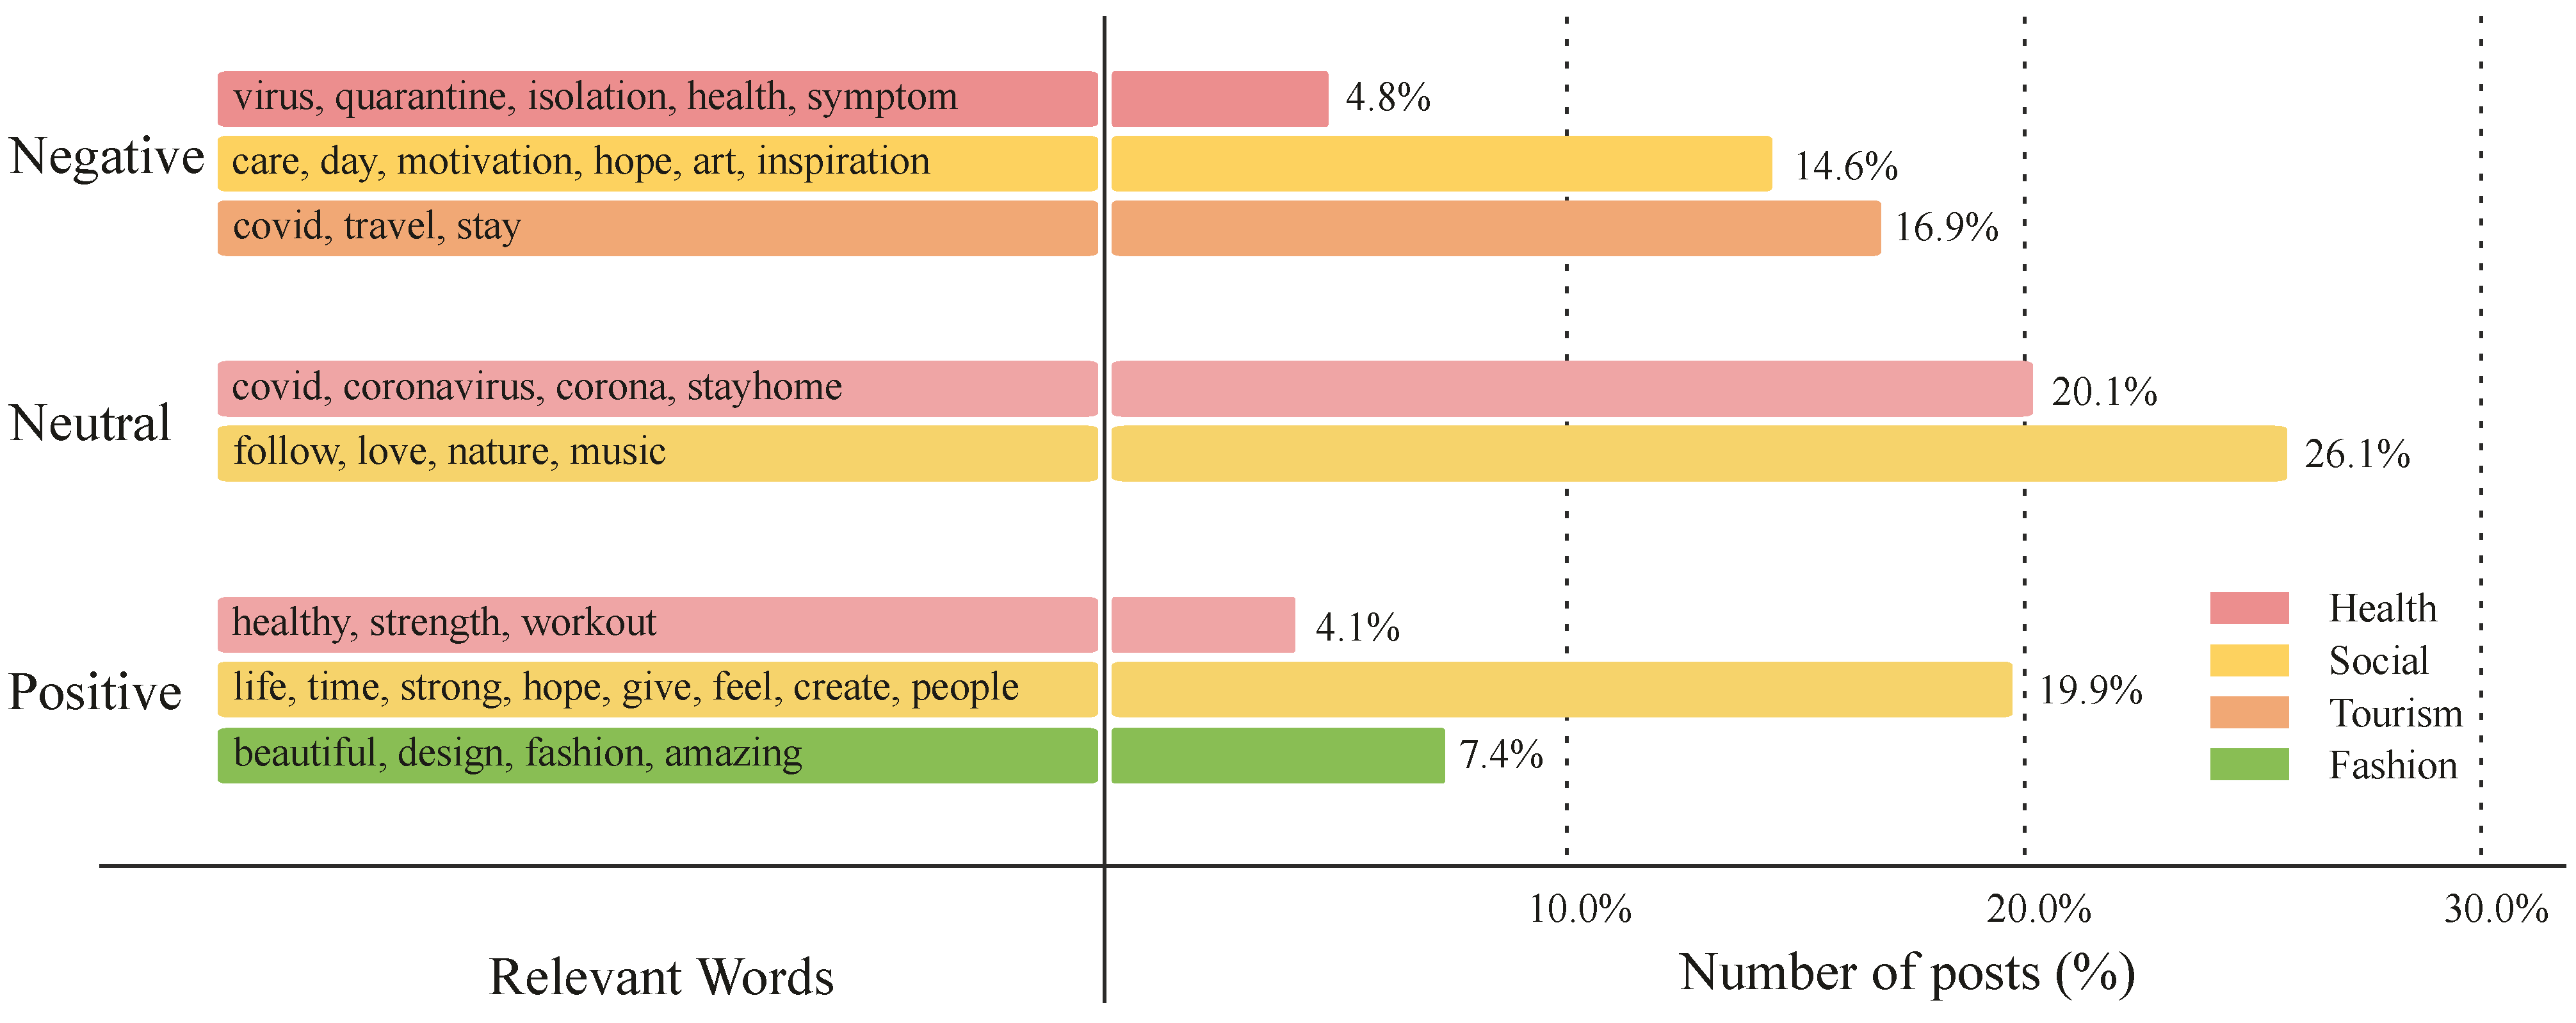
- Instagram
Figure 5 shows the distributions of topics from the Instagram dataset, categorized by the various sentiments. Compared to those observed from the Twitter dataset, there are fewer topics debated, since users of Instagram publish positive fashion-related posts that account for a total of 7.4% of the entire dataset. Social-related topics are the most common topics on this platform, making up 14.6% of the negative posts, 26.1% of the neutral posts, and 19.9% of the positive posts. The relevant words of the social-related topic highlight users’ inspirational thoughts to stay strong in the fight against COVID-19. For example, one post states the following: “is your quality an act or habit is there a life after coronavirus ebola came and gone covid19 came and will go there is always a light at the end of the tunnel…”. Observing the topics on Instagram, the health-related topic is the second most prevalent topic in all sentiments.
6. Geo-Temporal Analysis
We started our geo-temporal analysis by identifying countries’ mentions on posts from Instagram and Twitter to explore the geo-temporal patterns in our data collection. Afterward, we investigated people’s reactions to topics discussed in those countries. Our study provides answers to the following questions: (1) What countries are mainly attached to the pandemic posts on social networks? (2) What are the top topics connected to the top-mentioned countries during the pandemic? (3) What are the geo-temporal trends and patterns observed across topics and localities during the pandemic on social networks?
6.1. Country-Based Analysis
This section provides an analysis and methods of tracking countries in posts on social media platforms. This process aims to define the top-mentioned countries in our data collection for further geo-temporal analysis.
- Methods
To analyze and track countries mentioned on Twitter and Instagram, we utilize the NER technique implemented by Stanford CoreNLP [39]. The Stanford NER tagger assigns named entities in texts to recognize people, values, dates, places, and organizations. Using the Stanford NER tagger, we determine country mentions on all tweets and posts in our datasets. Afterward, we sort countries in descending order based on the number of mentions to select the top-five most mentioned countries in our data collection.
- Twitter
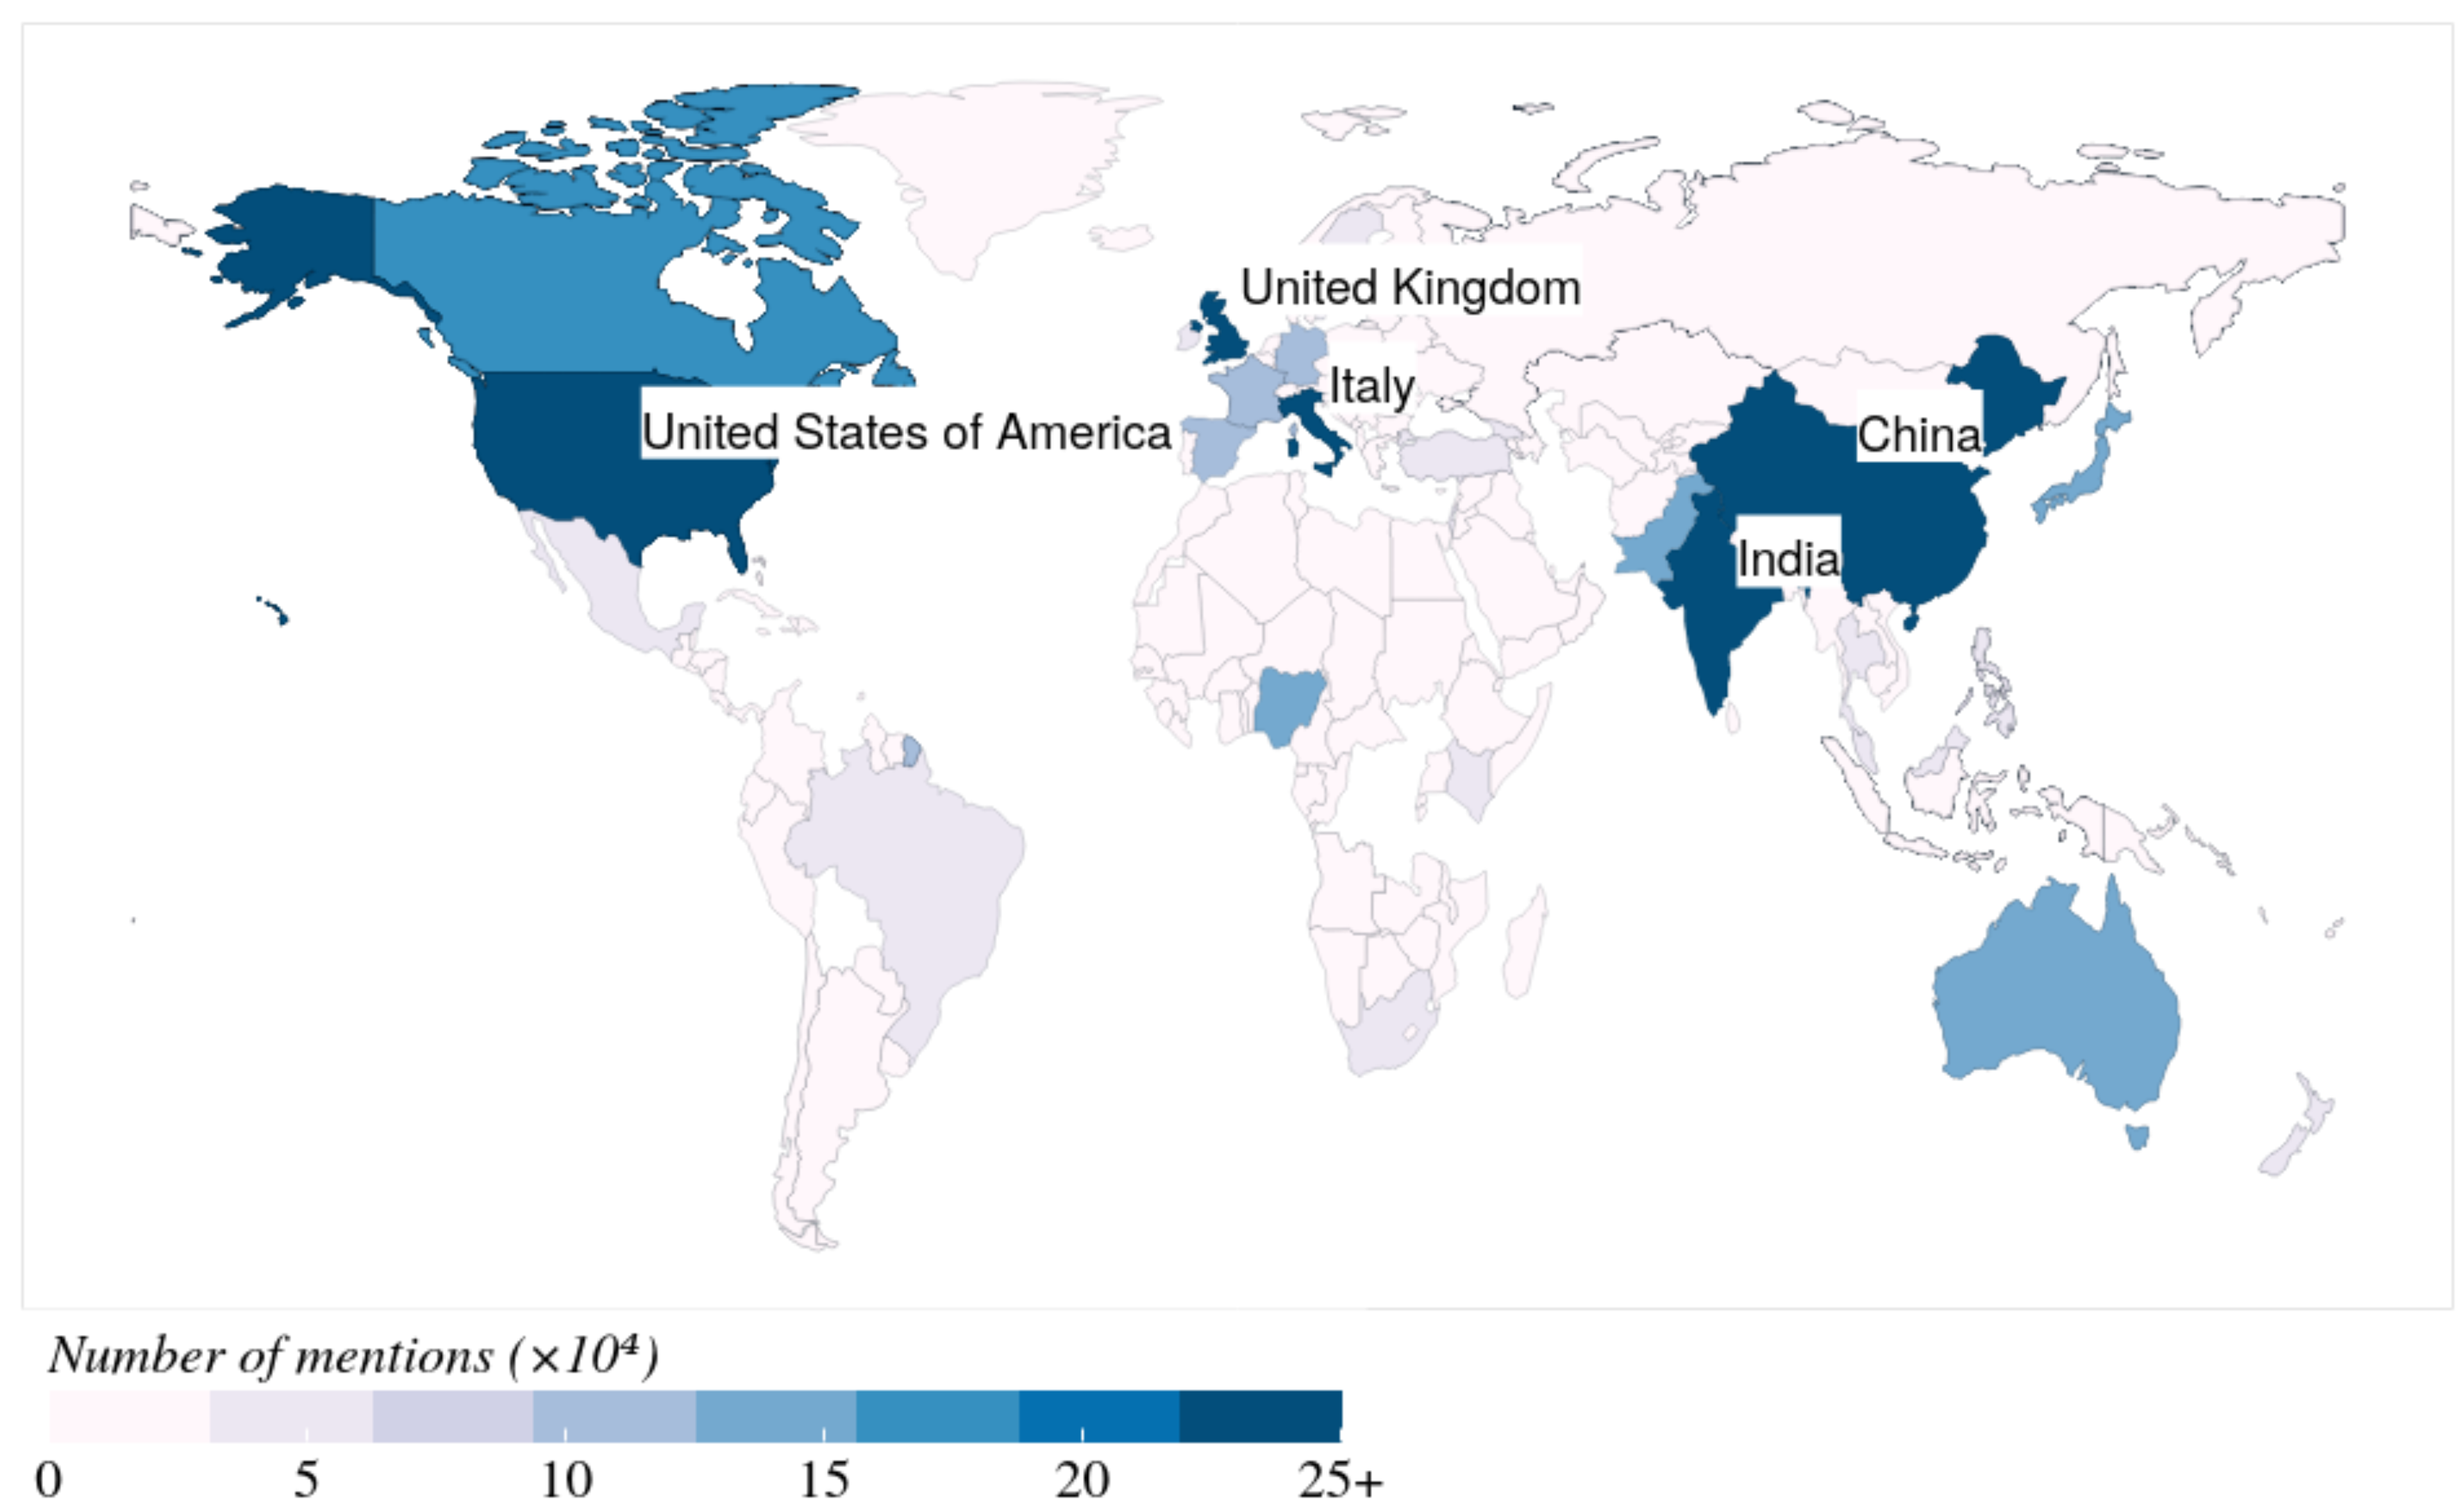
We note that the adopted NER technique identifies not only country names but also cities and other places in a given input. However, we focus only on the mentions of countries to select the top-mentioned countries. Based on our analysis, our dataset includes mentions of 180 countries, and China is the most mentioned country with 3,035,389 mentions. The next four top-mentioned countries are the USA (695,131), India (541,851), the UK (521,290), and Italy (283,096). Figure 6 depicts the results of the number of mentions of countries in our dataset.
- Instagram
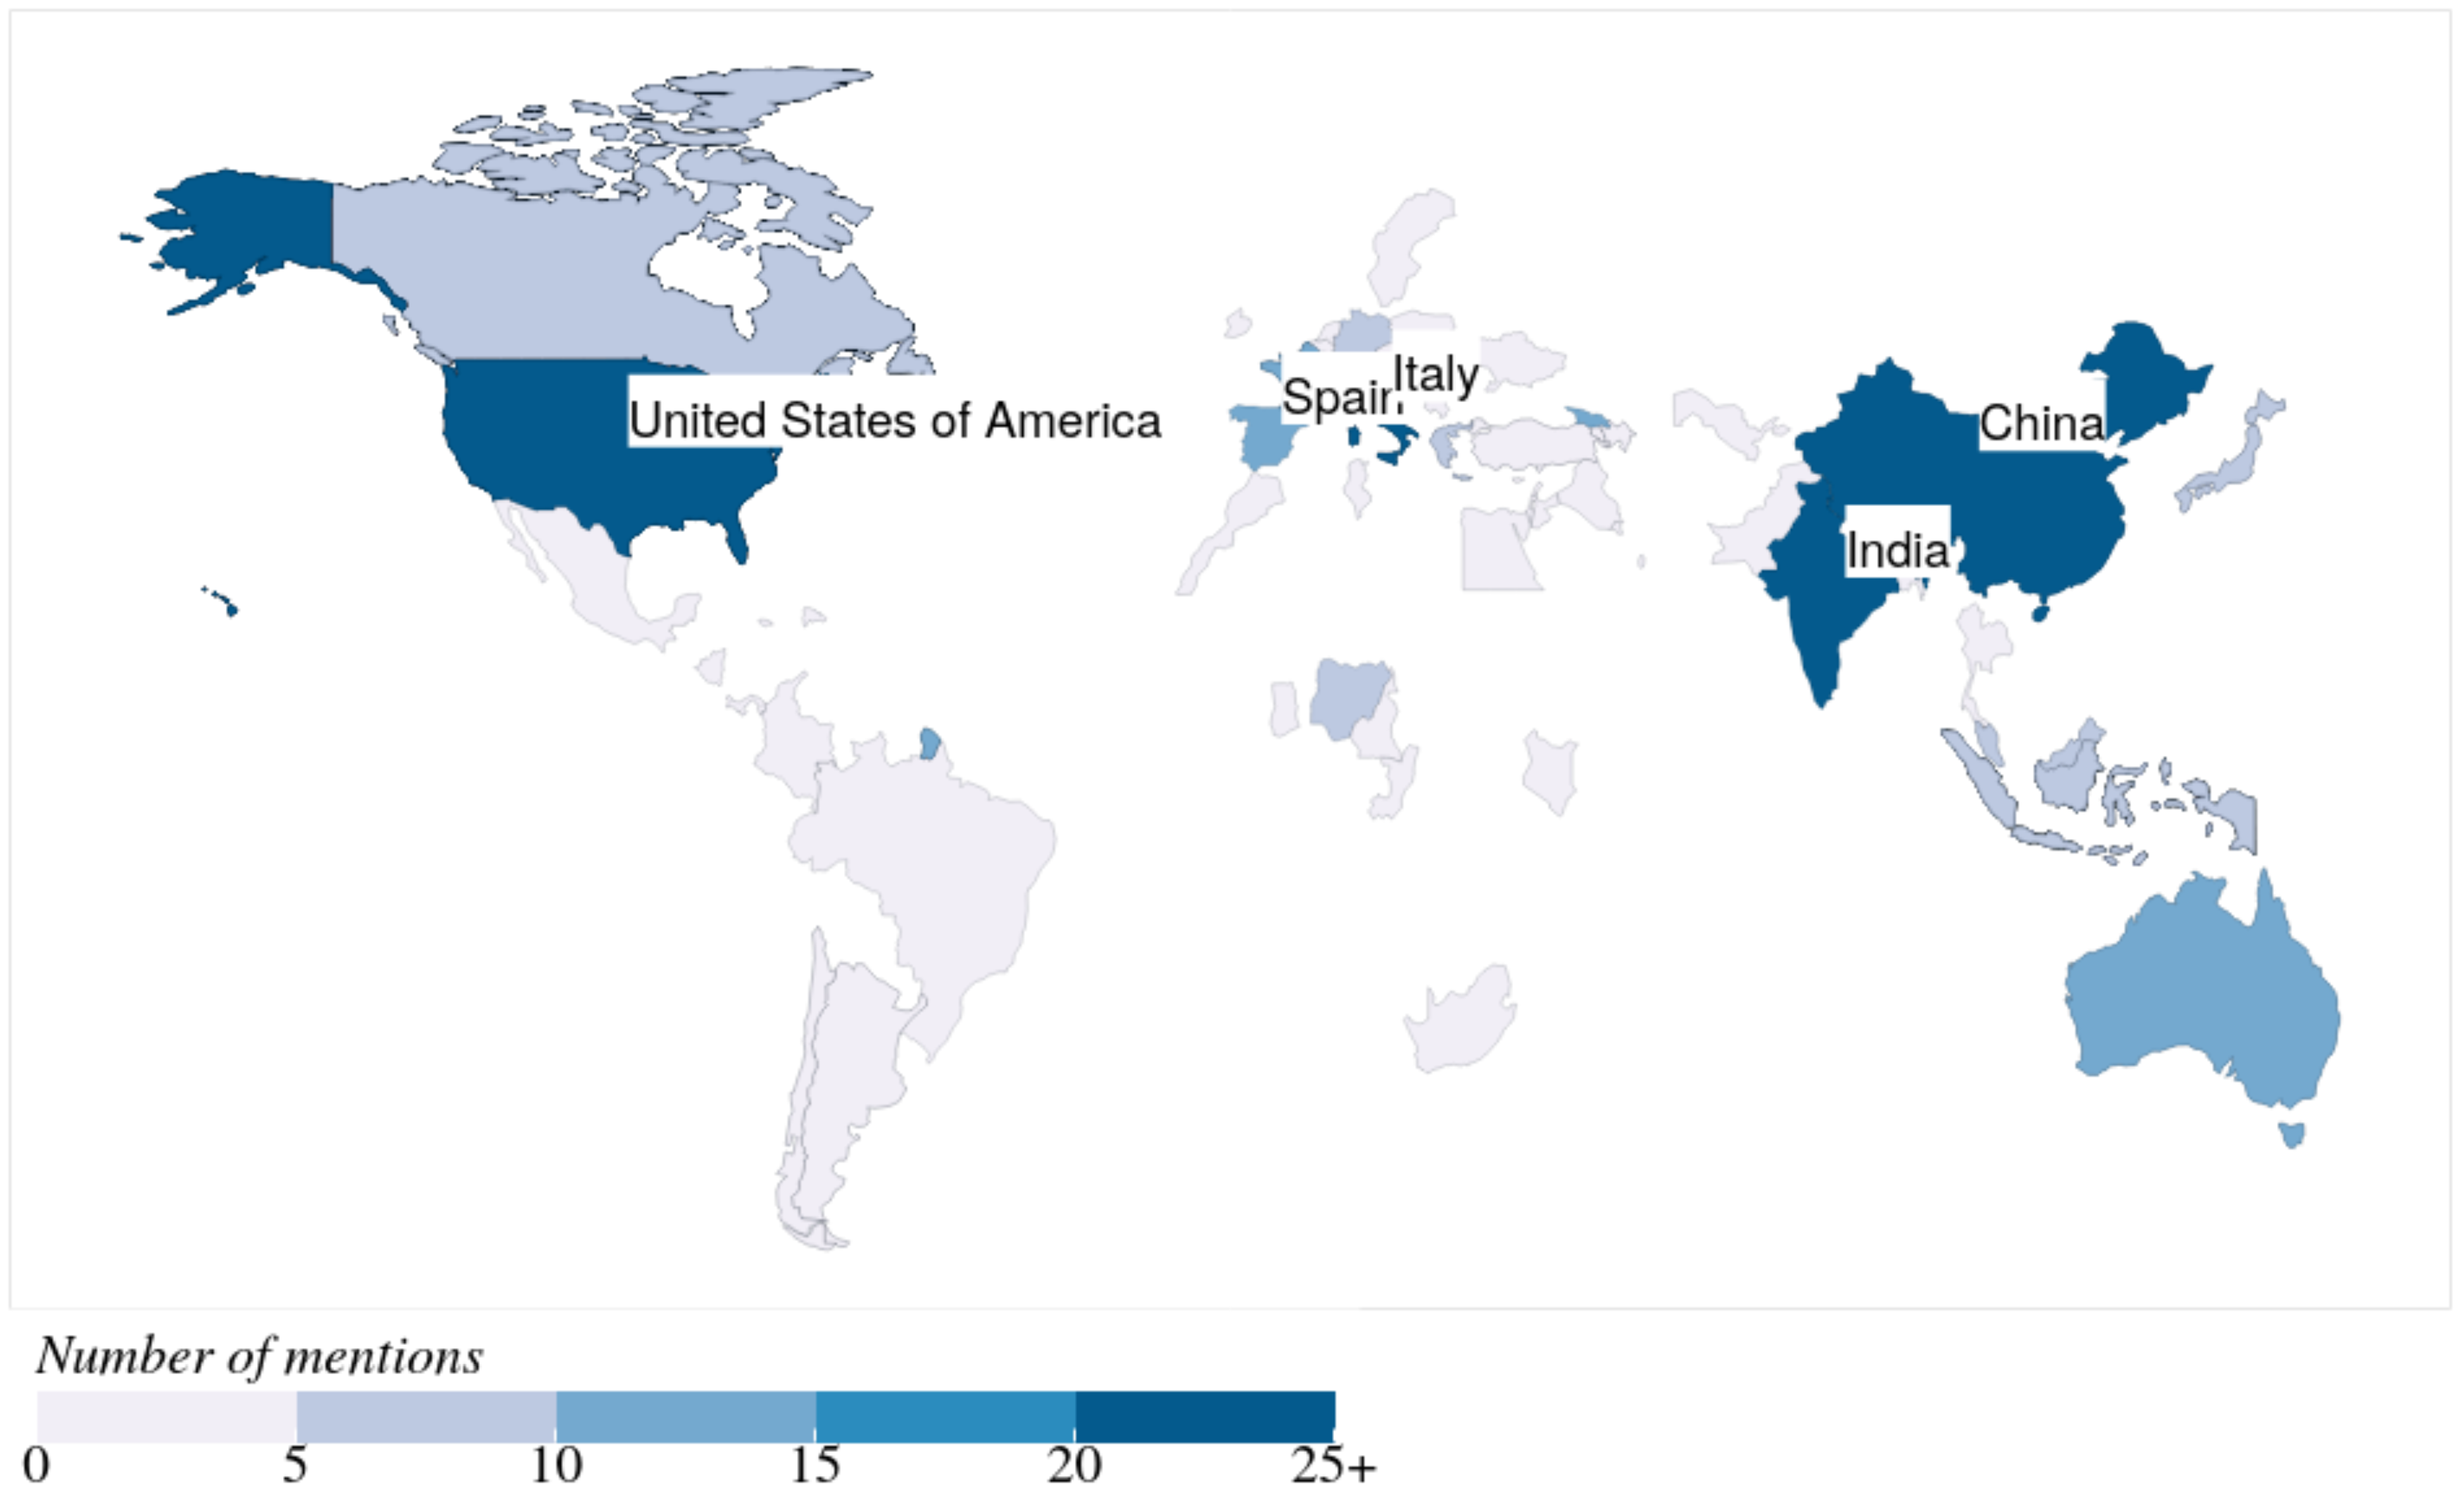
Using the NER technique on Instagram posts, we extracted 61 countries, where the top-mentioned countries are China, India, the USA, Italy, and Spain, as demonstrated in Figure 7. Figure 6 and Figure 7 show that the top-mentioned countries on both social networks are almost the same, except for Spain and the UK. This supports the fact that these are the key countries in which a high number of coronavirus infections were reported within the corresponding periods [43]. To gain insights into people’s reactions and attitudes towards topics discussed in these countries, we conducted a detailed analysis of the top-mentioned countries using the following methods: sentiment analysis, topic modeling, word2vec-based analysis, and locality analysis.
6.2. Sentiment Analysis of the Top Countries
This section provides a sentiment analysis of the data records observed with the top-five mentioned countries in our data collection. This analysis enables an understanding of the attitudes and reactions towards topics related to these countries during the pandemic.
- Twitter
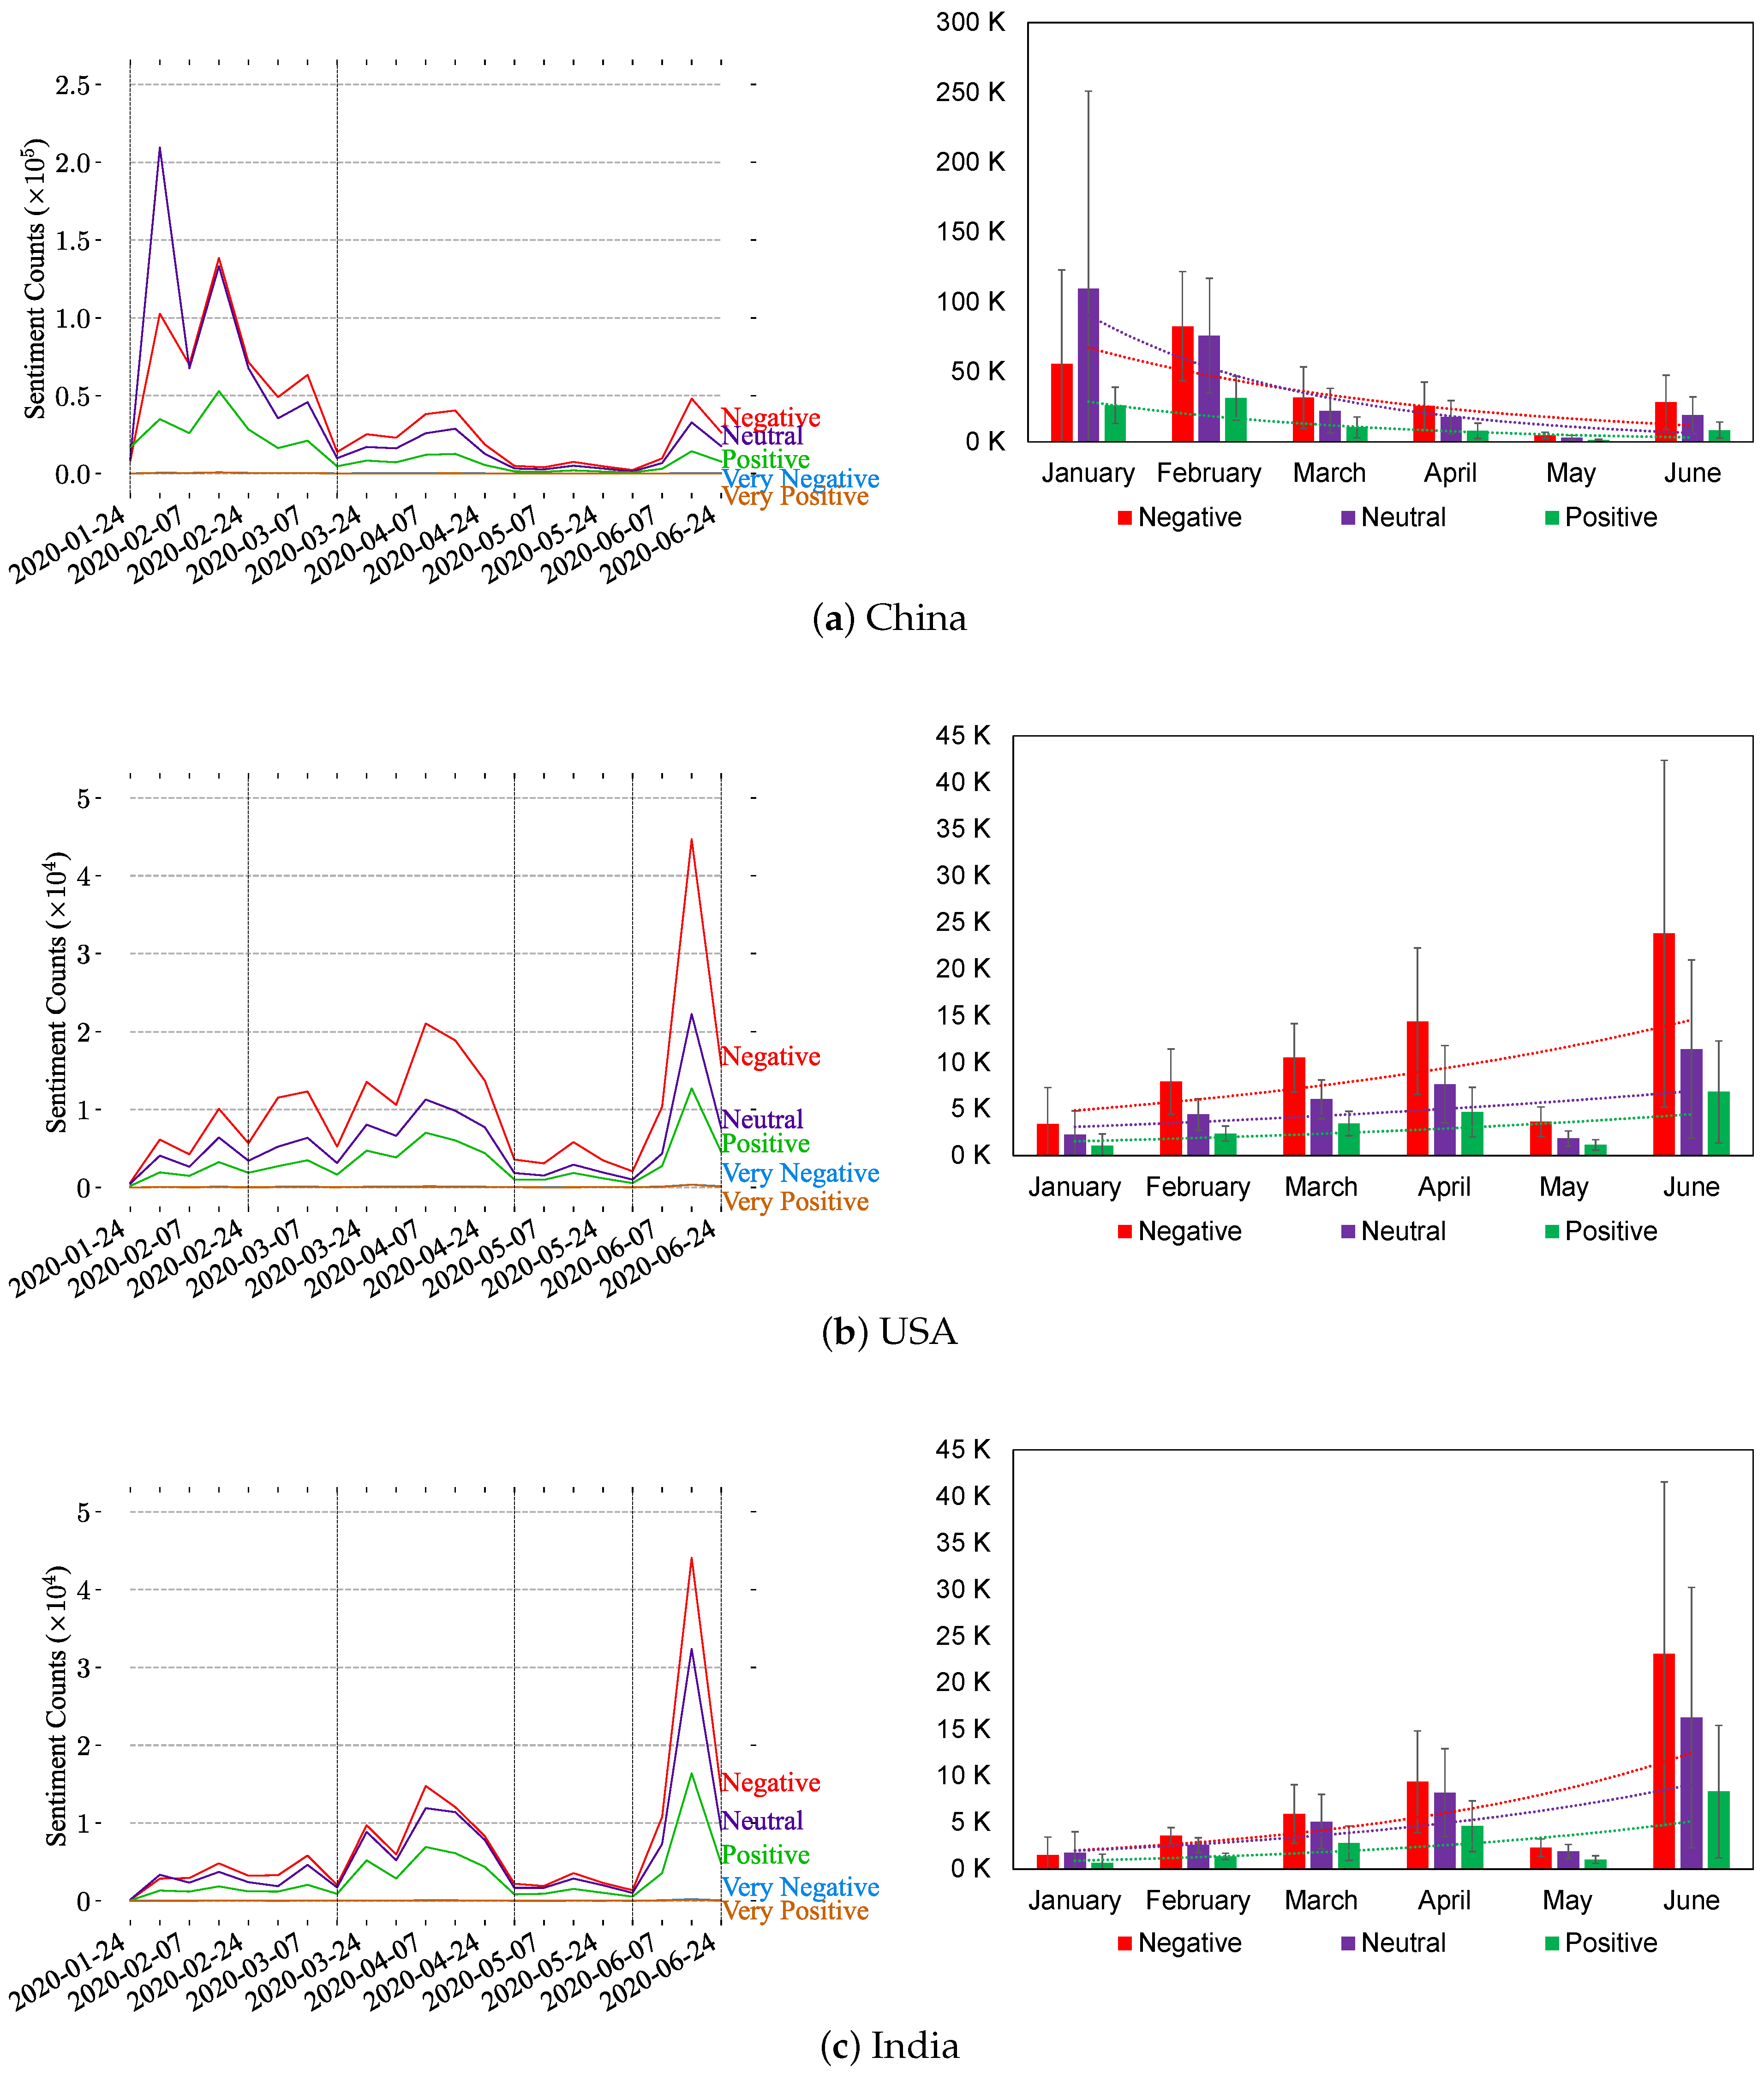
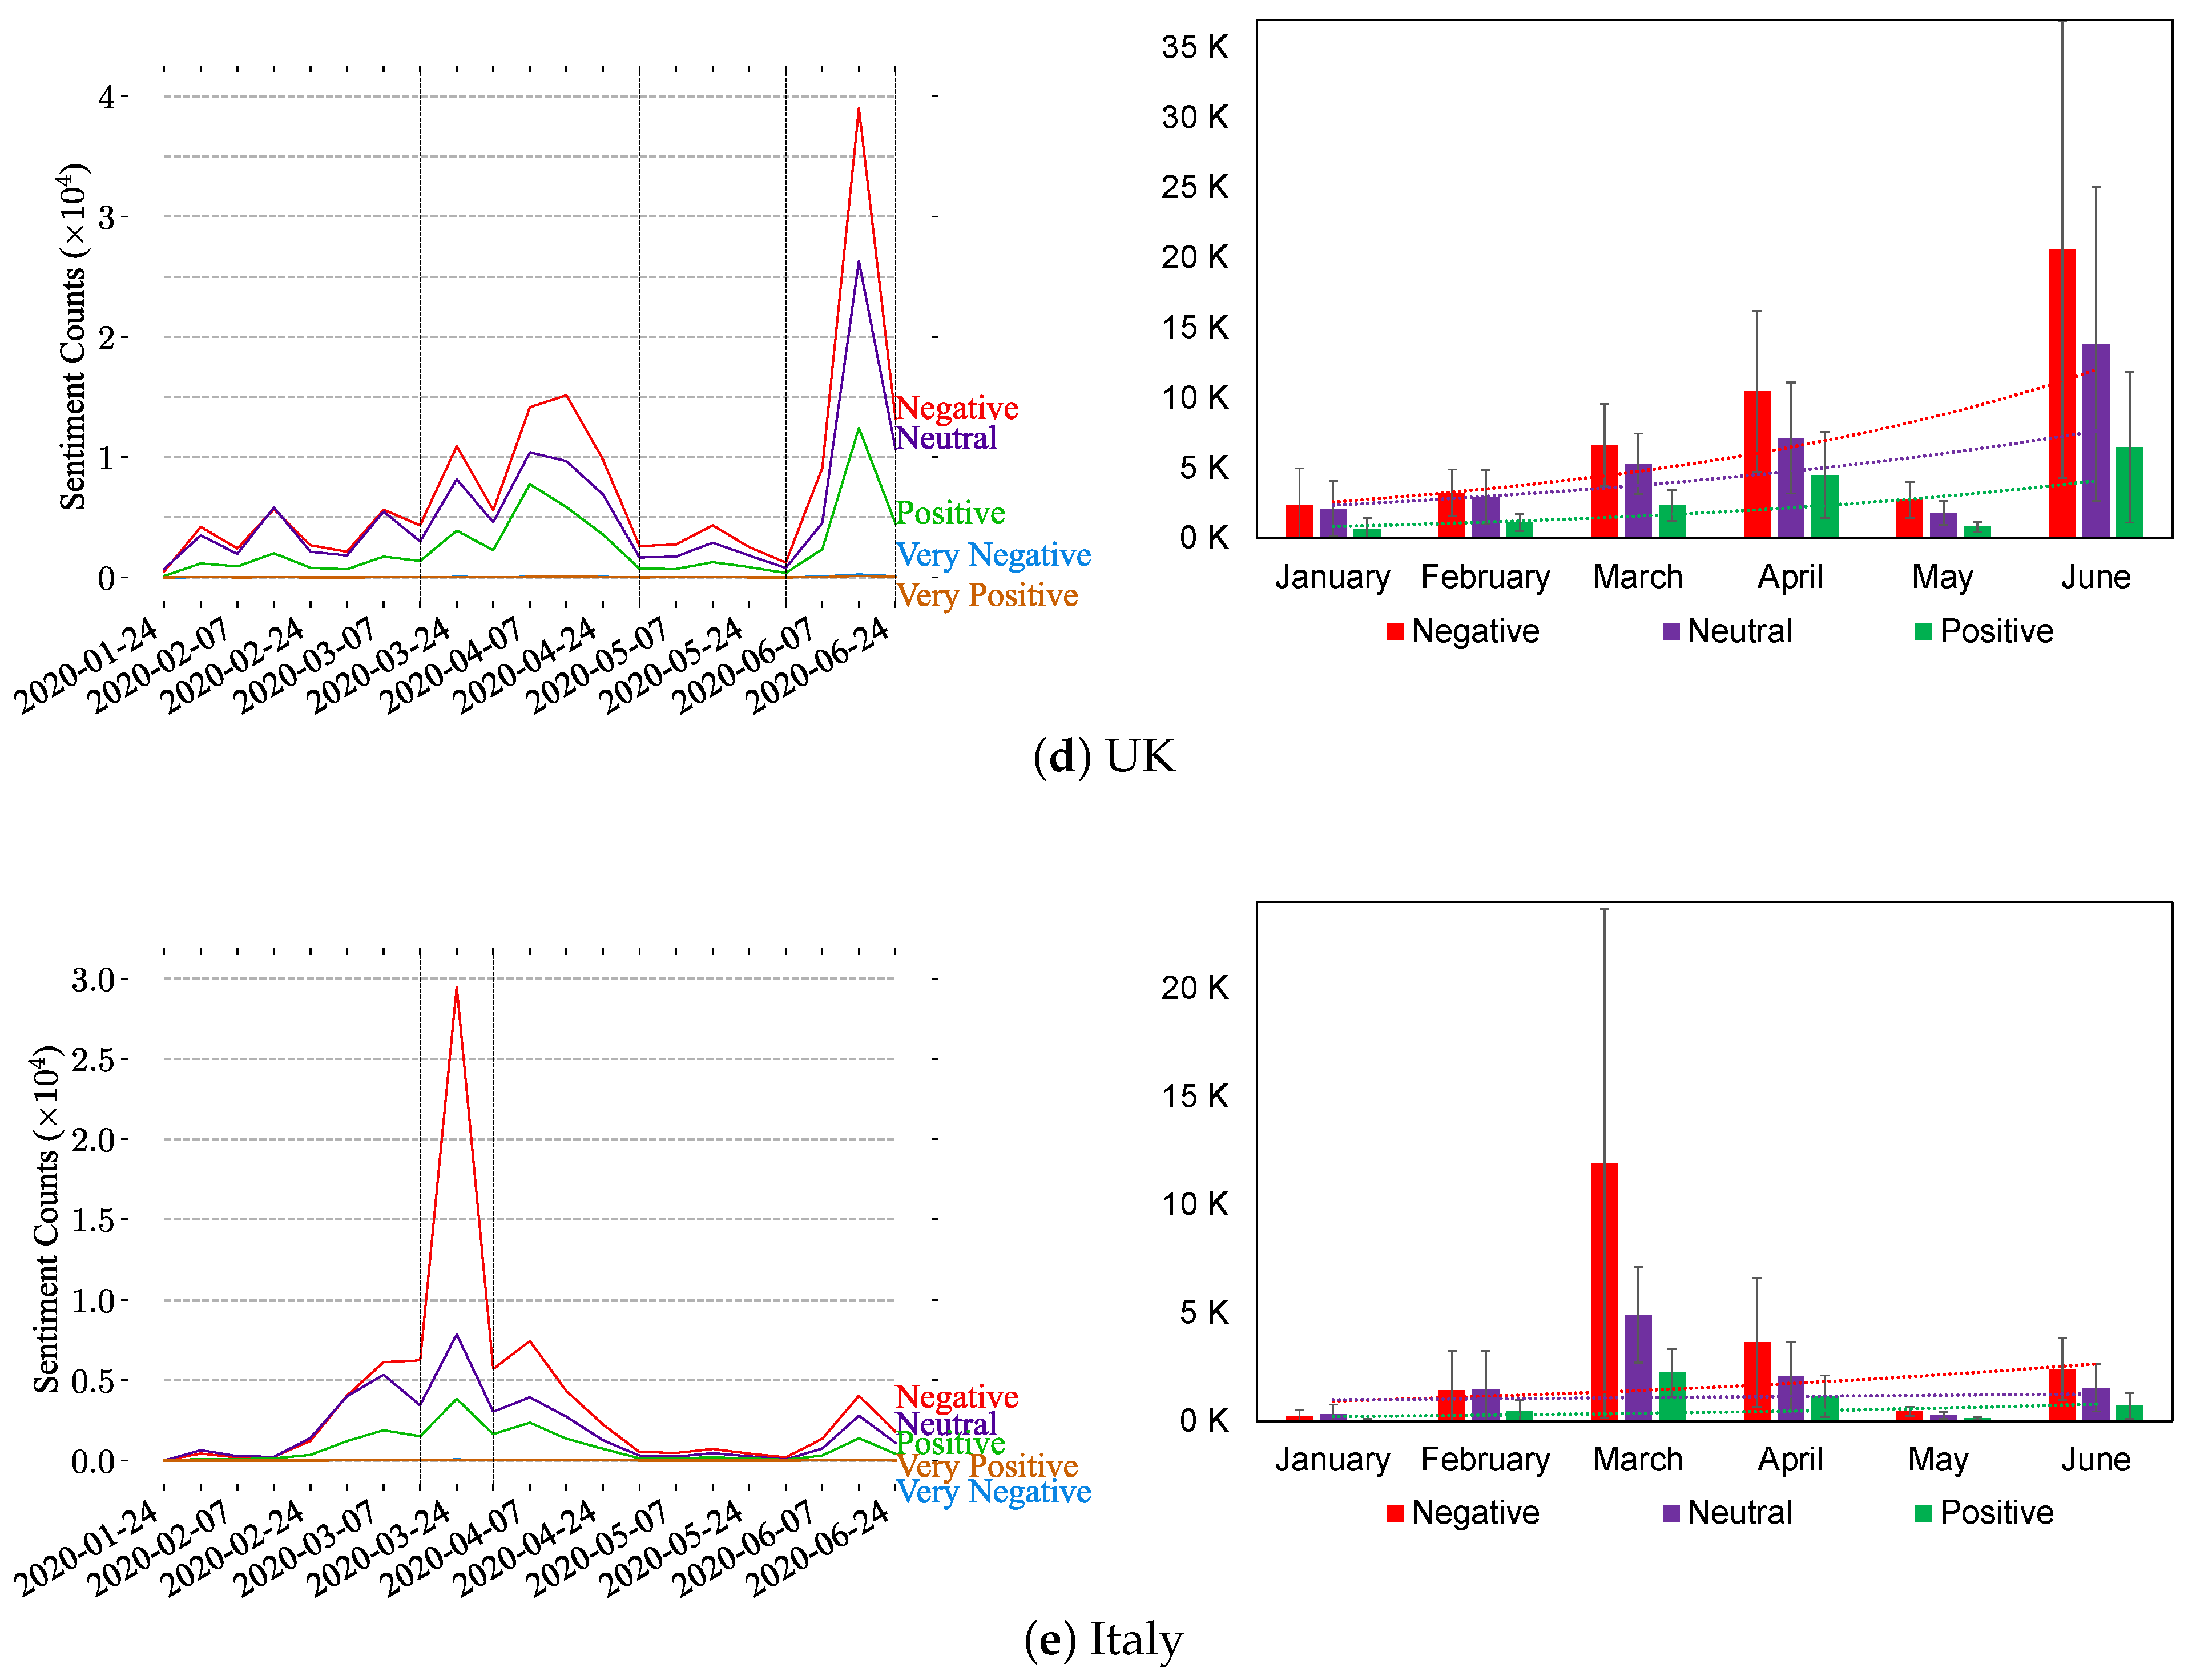
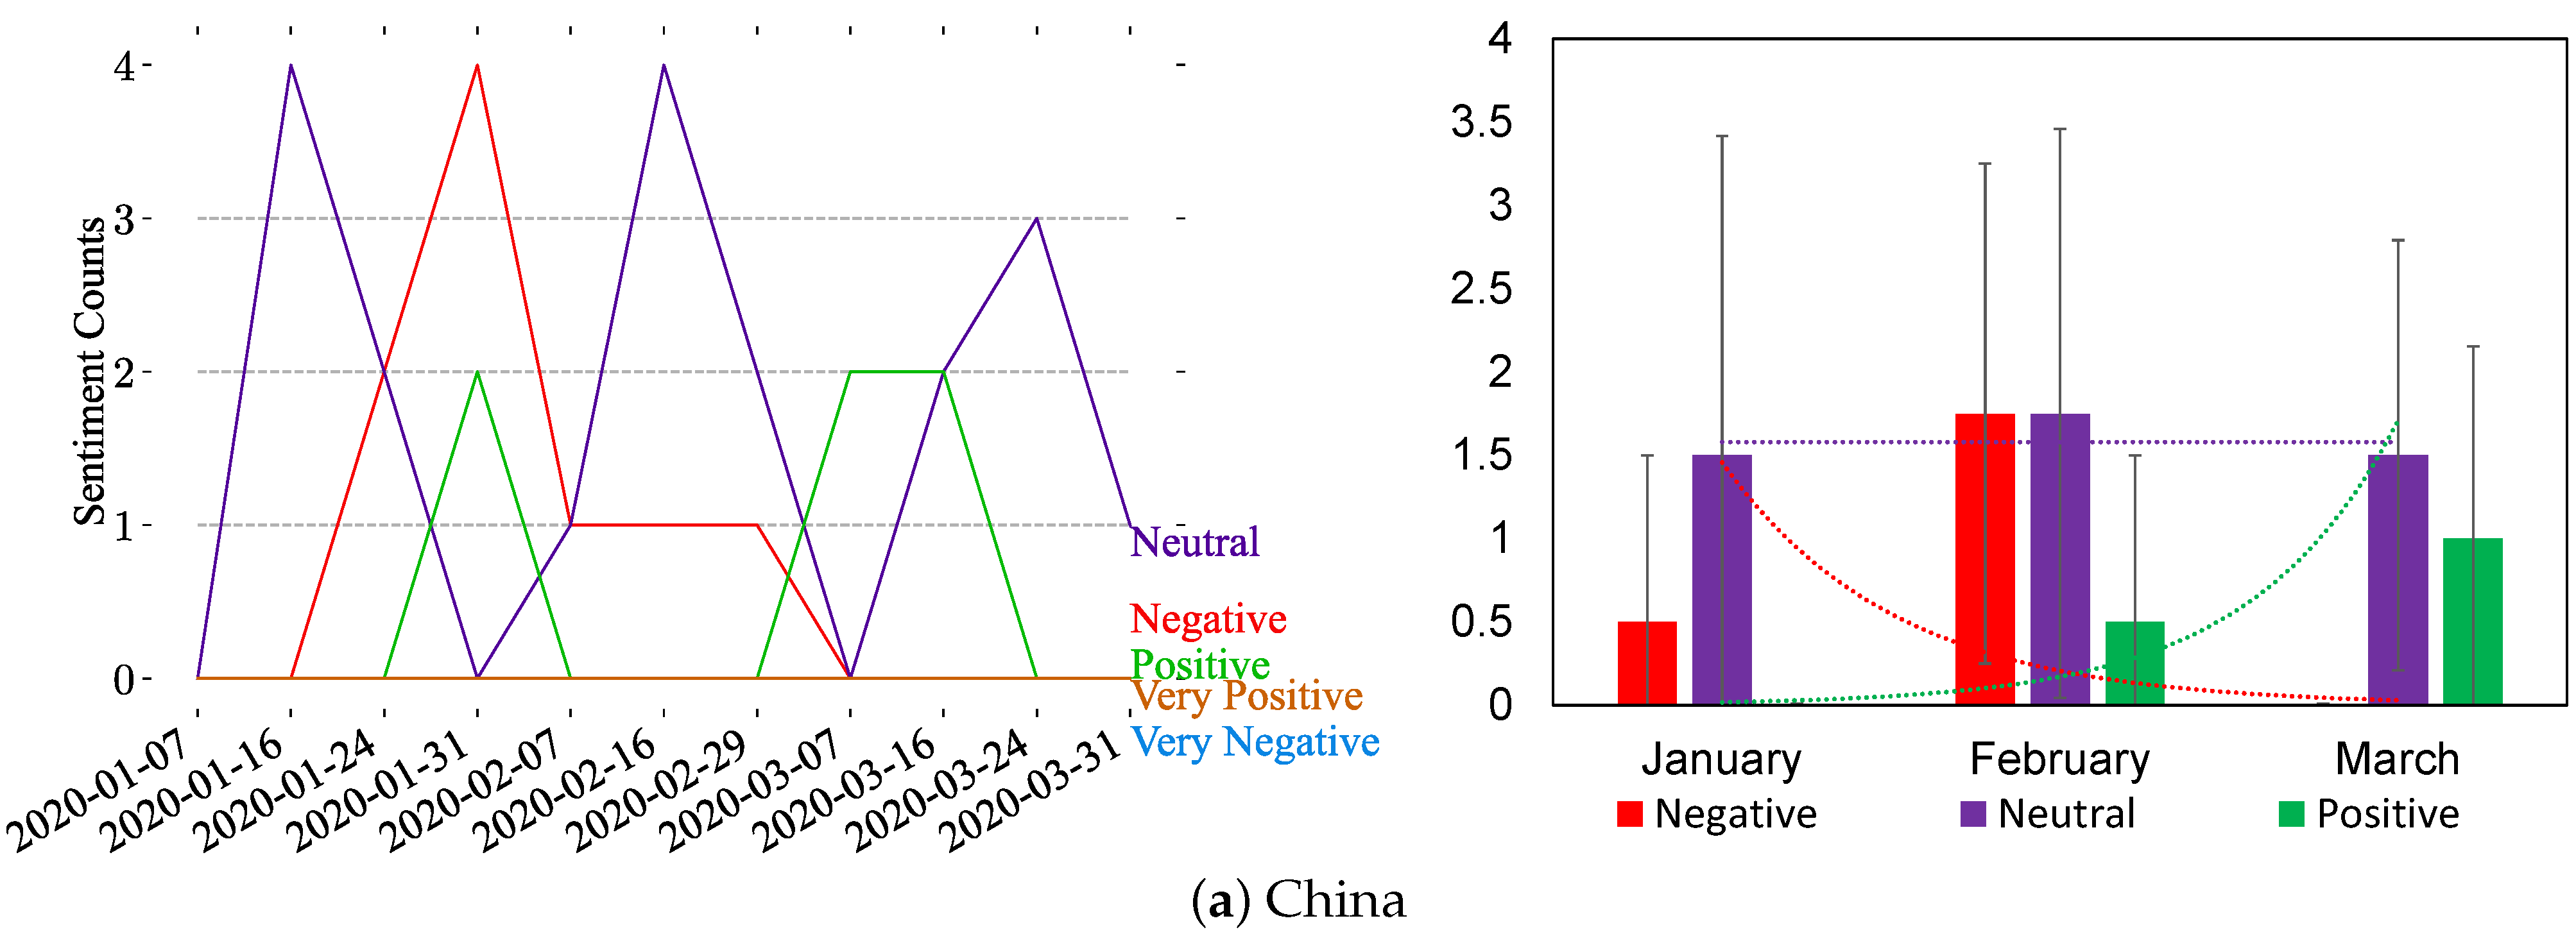
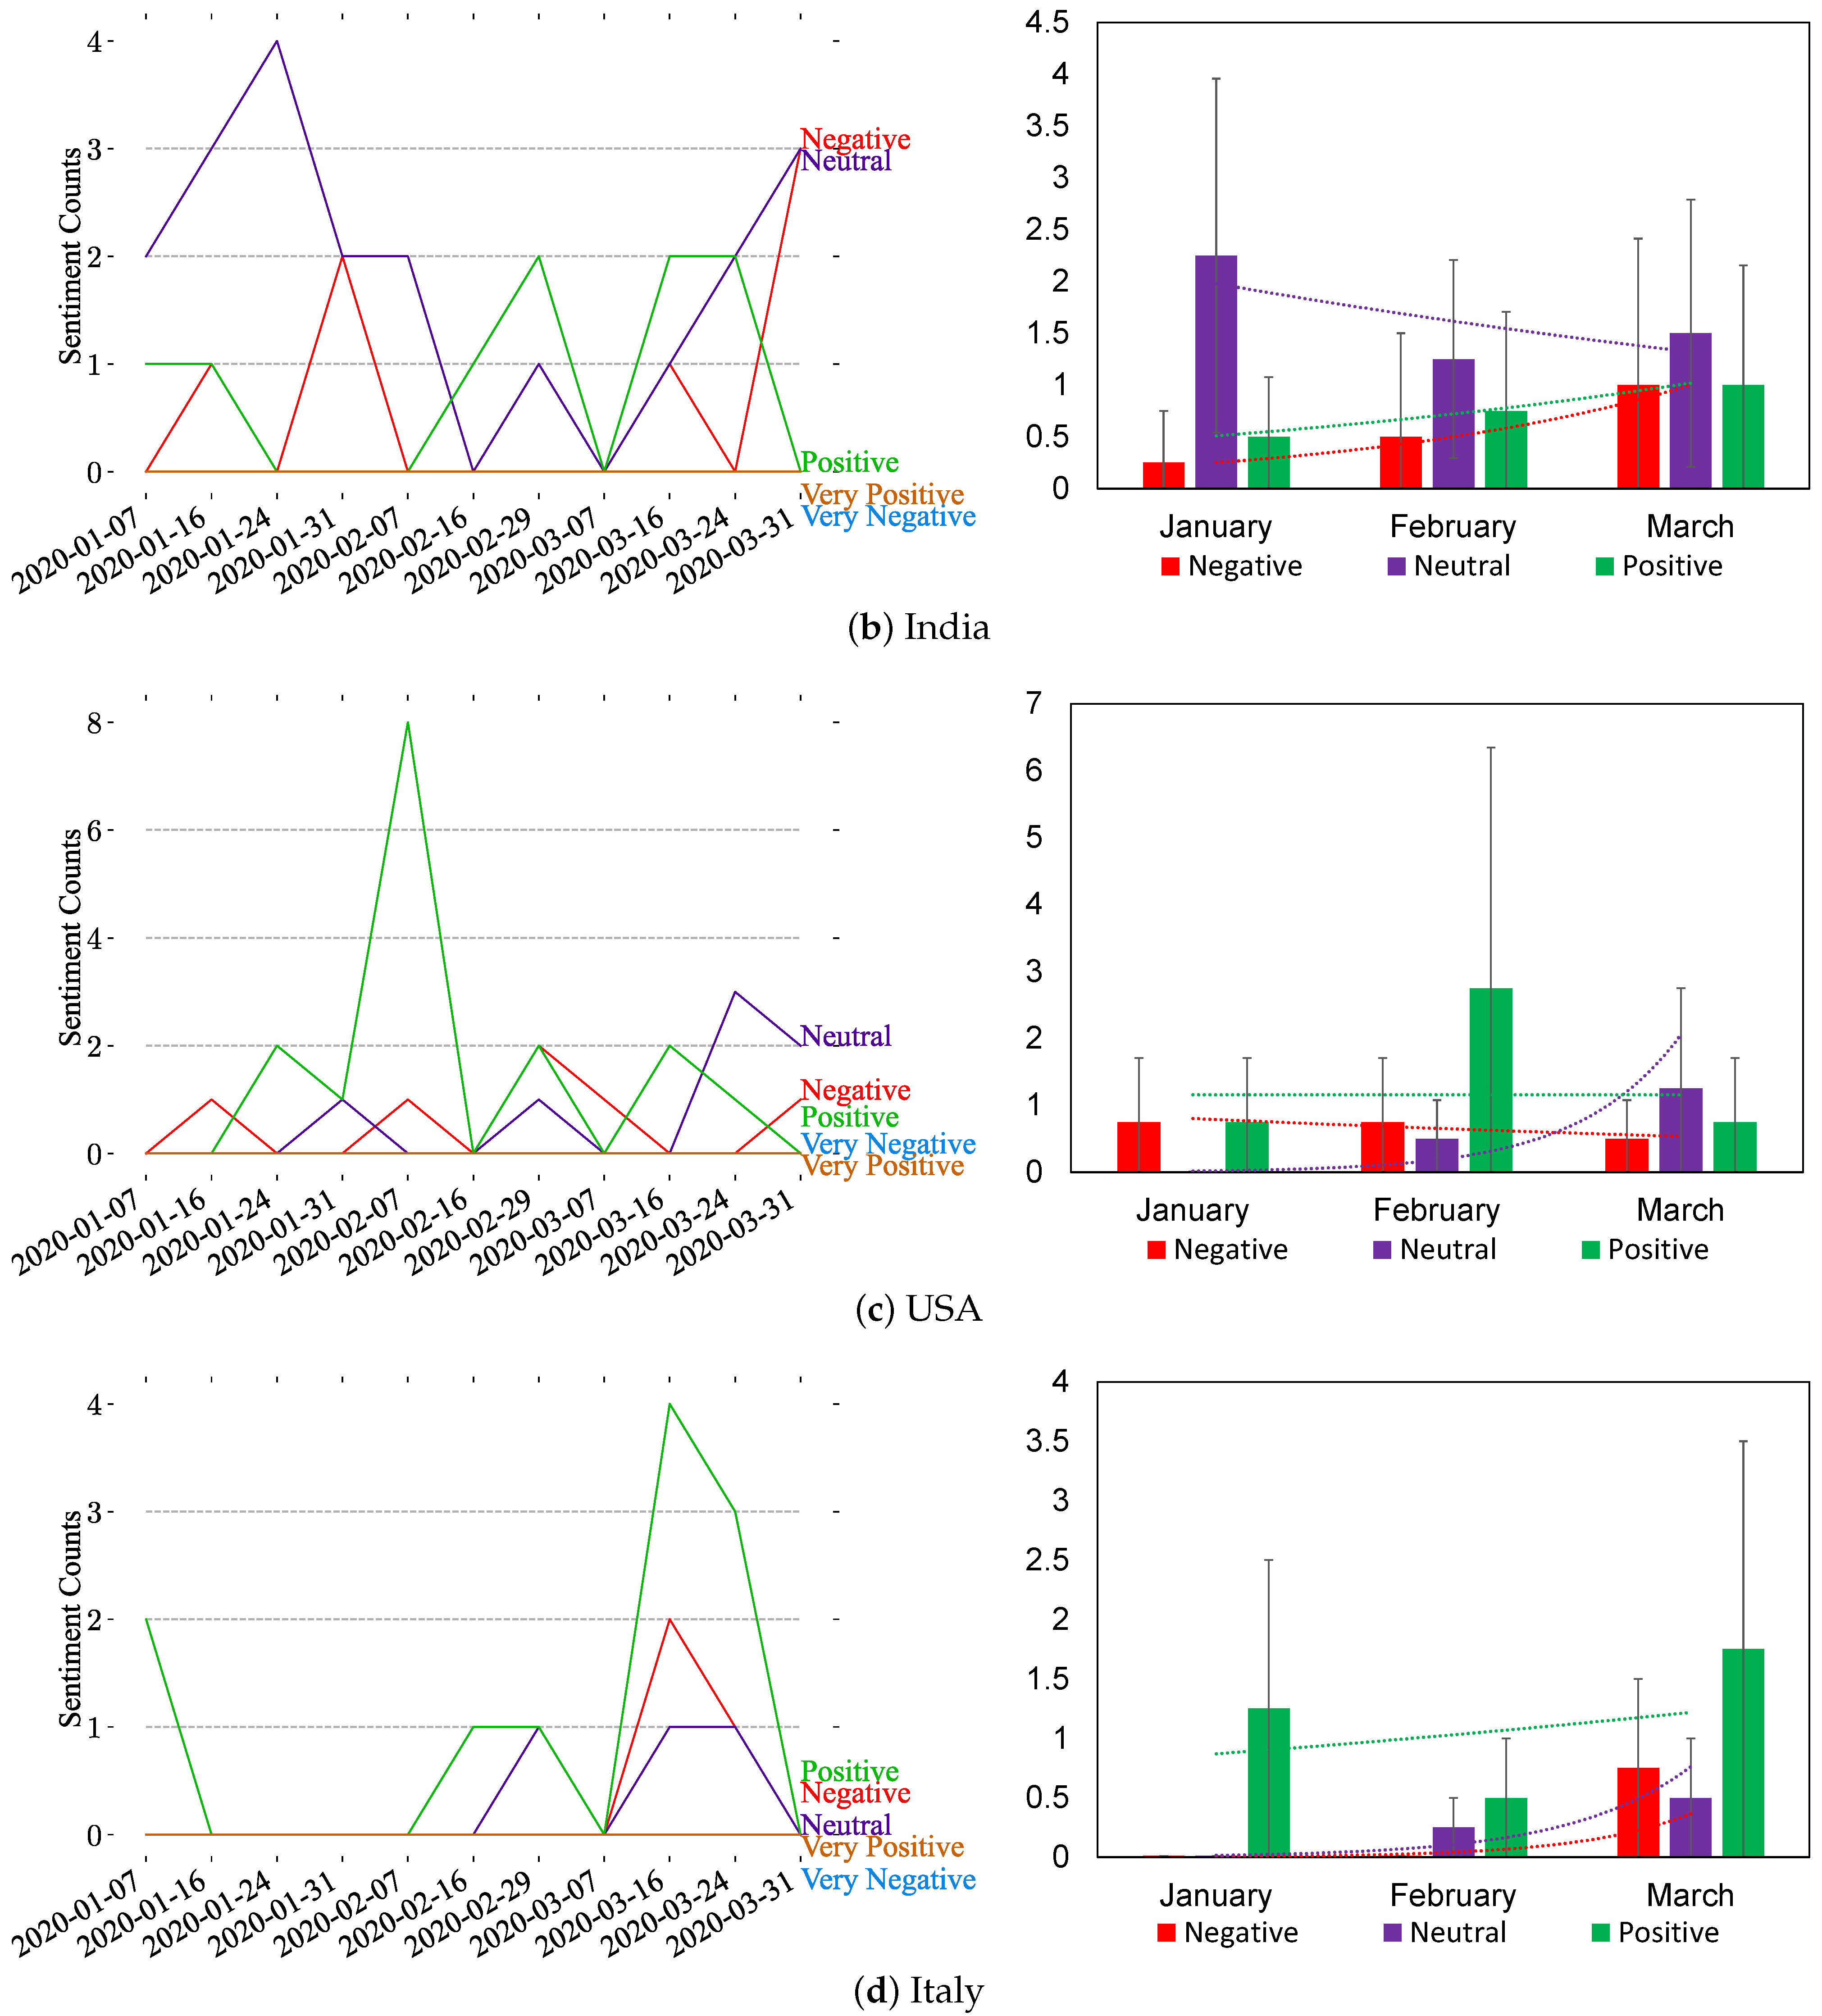
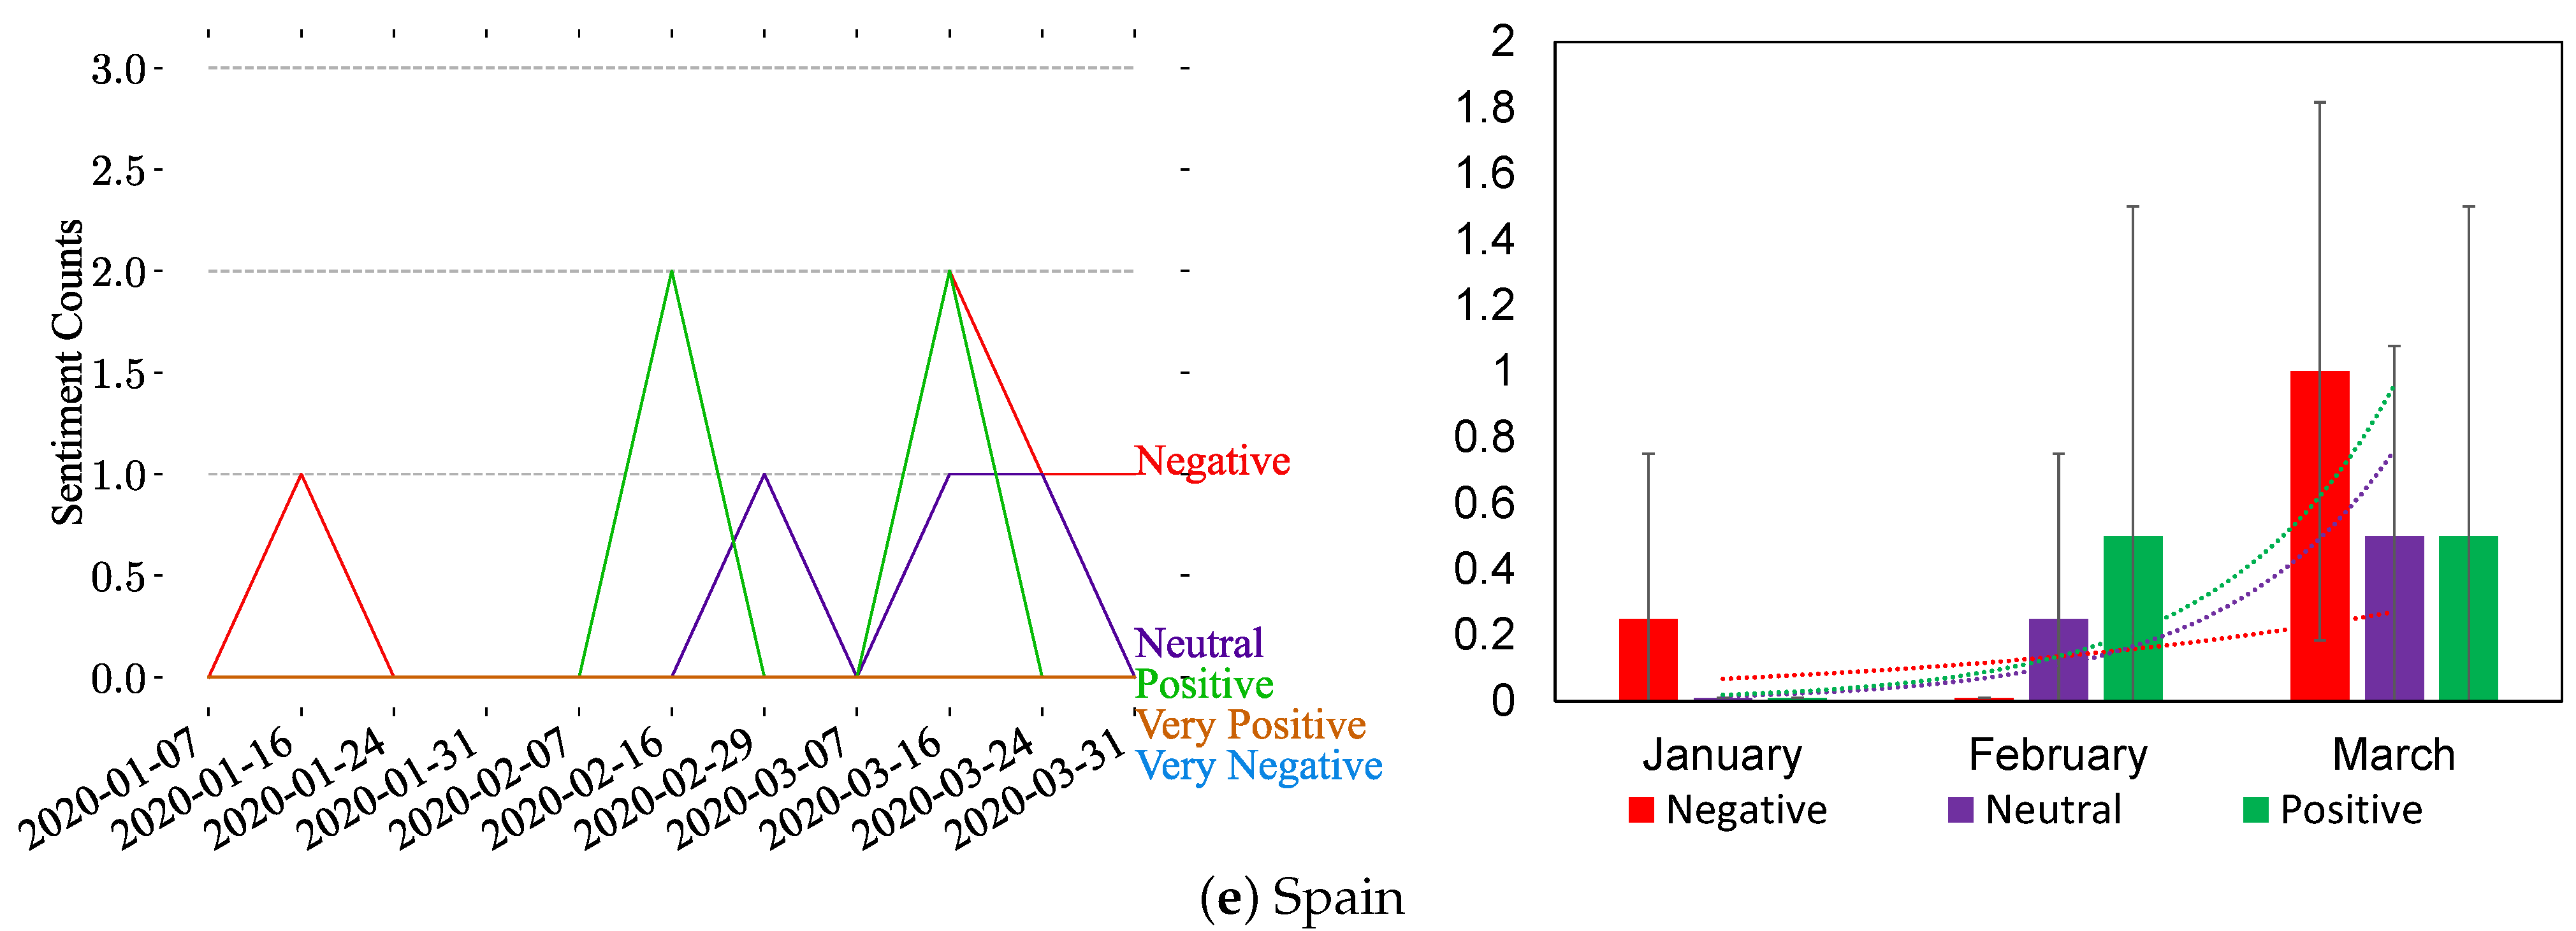
Figure 8 illustrates the sentiment analysis of the top-five countries, i.e., China, USA, India, UK, and Italy, from the Twitter dataset. The negative reactions and sentiments observed in tweets mentioning the top-five countries are more obvious than other sentiments over time. Figure 8a shows that China started with having more neutral tweets in January 2020. Interestingly, all countries except for China experienced an improvement in the growth of tweets in March, as shown in Figure 8. The figure also shows that the USA, India, and the UK charts are similar with respect to sentimentality spikes in March, April, and June, and they reached their highest points in June while Italy experienced its peak between 16 March 2020 and 31 March 2020.
- Instagram
Figure 9 illustrates the sentiment analysis of posts mentioning the top-five countries, i.e., China, India, USA, Italy, and Spain, using our Instagram dataset. Figure 9 shows that there are few posts mentioning the countries on Instagram. Based on the analysis, there are fluctuations in the reactions, as shown in Figure 9; therefore, there is no dominant sentiment type over time. Nevertheless, there are more occurrences of positive posts in the USA and Italy charts (see Figure 9c,d).
6.3. Topic Modeling on the Top Countries
To further analyze the data of the top-five countries, we conducted a topic modeling task to identify the major topics discussed on social media related to these countries. Identifying country-specific topics enables an understanding of how the people of these countries perceive the pandemic and to what extent their perception differs across localities. To this end, we employed LDA to extract country-specific topics in the top-five mentioned countries in our dataset. Using the default implementation and settings of LDA in the Gensim LDA MultiCore model [41], we explored various LDA models to extract a different number of topics ranging from 2 to 30. For our analysis, we selected the best-performing models, i.e., the models with the highest coherence score, to extract and identify the topics. The results of our study show the emergence of a variety of topics, such as safety messages, work, travel, COVID-19-related news, government response, emergency funding, and prevention measures, which are similar to the findings from Sharma et al. [17] and Ordun et al. [15].
- Twitter
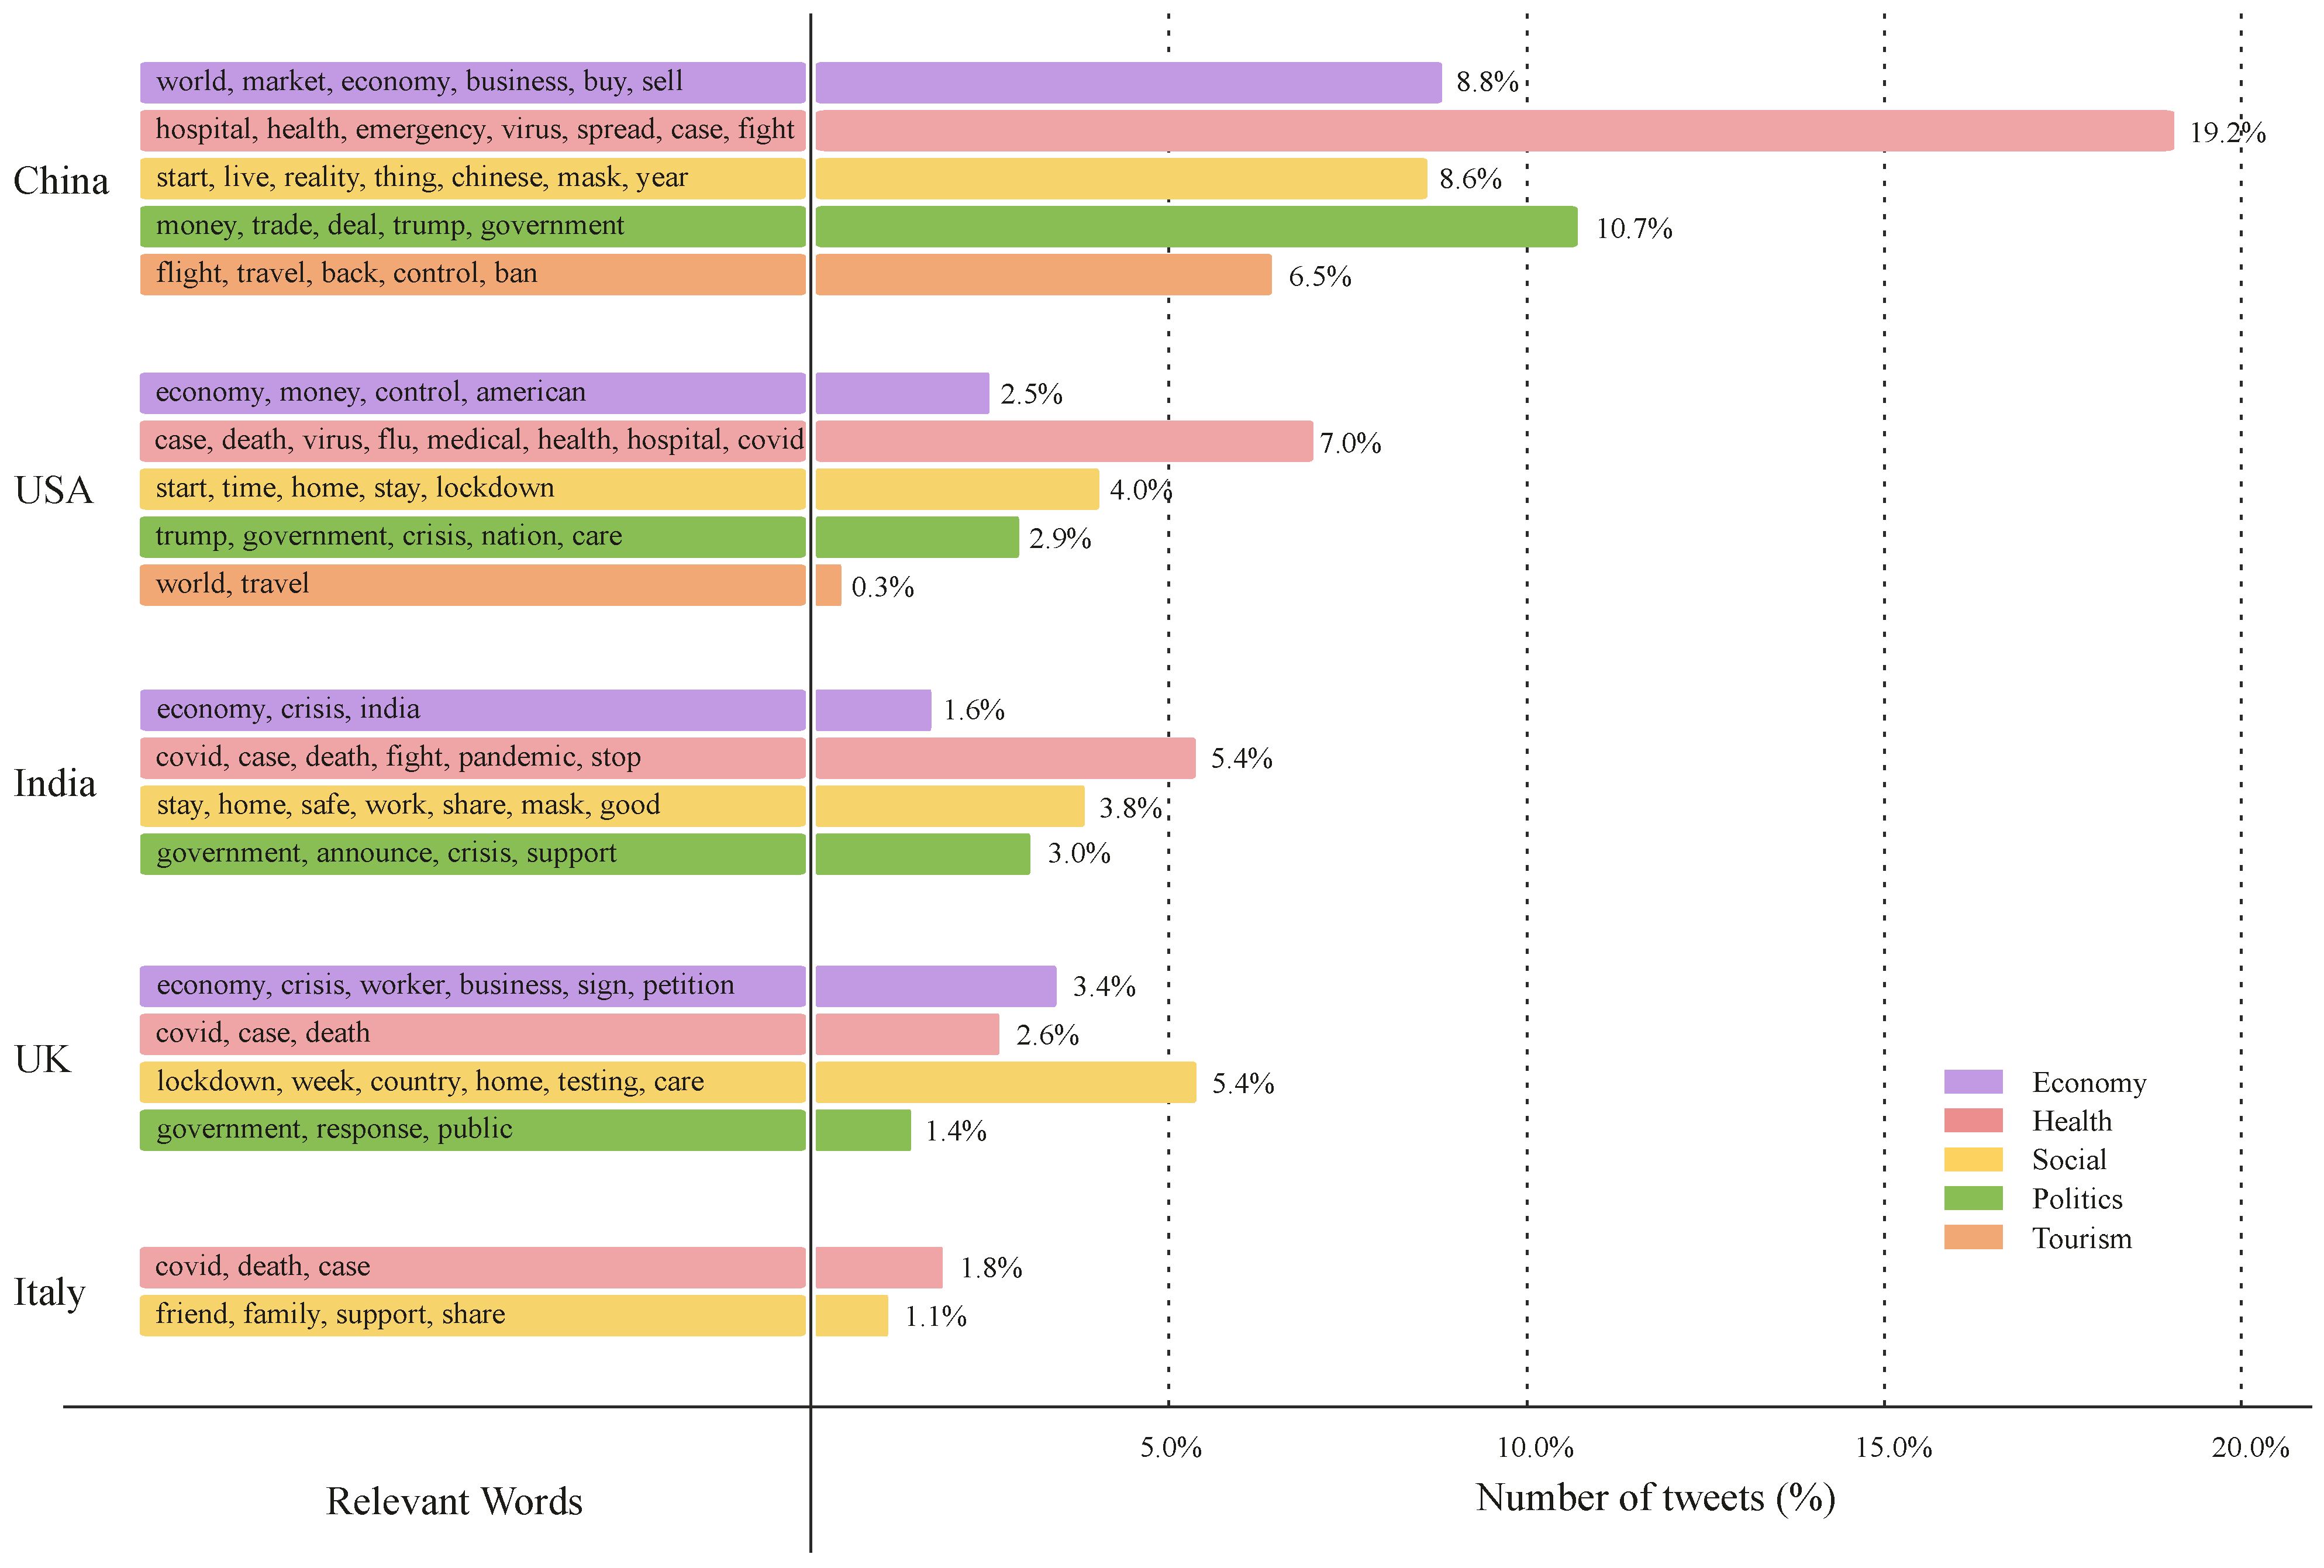
Figure 10 depicts the result of the topic modeling task on the Twitter dataset. The results show that health-related topics are the most-discussed topics across countries, except for the UK, where most tweets were related to the social category. The health-related tweets mentioning China constitute 19.2% of the total tweets, indicating people’s interest in China’s health situation, including hospitals, the spread of the virus, the number of cases, and how the Chinese handle the COVID-19 pandemic. Common concerns and trends in the health-related topics across all countries include COVID-19-related news, such as virus cases, the number of deaths, and the virus’ spread. This high popularity of health-related topics indicates that people are concerned about the COVID-19 pandemic. In terms of the economy-related category, which constitutes 16.3% of the total tweets in our dataset for the top-five countries, the trend concerned the virus’ economic aspects and implications. Although our analysis highlighted more than four topics for tweets mentioning China, the USA, India, and the UK, only two topic categories were extracted from tweets mentioning Italy during the data collection period. Tweets mentioning Italy are related to health and social categories, accounting for 1.8% and 1.1% of the total dataset, respectively. More specifically, tweets mentioning Italy focused on COVID-19 cases, deaths, and social aspects of life during the pandemic.
Generally, the social-related tweets across different countries indicate the users’ attempt to inform others about prevention measures, such as staying at home, caring, supporting, sharing, wearing a mask, etc.
- Instagram
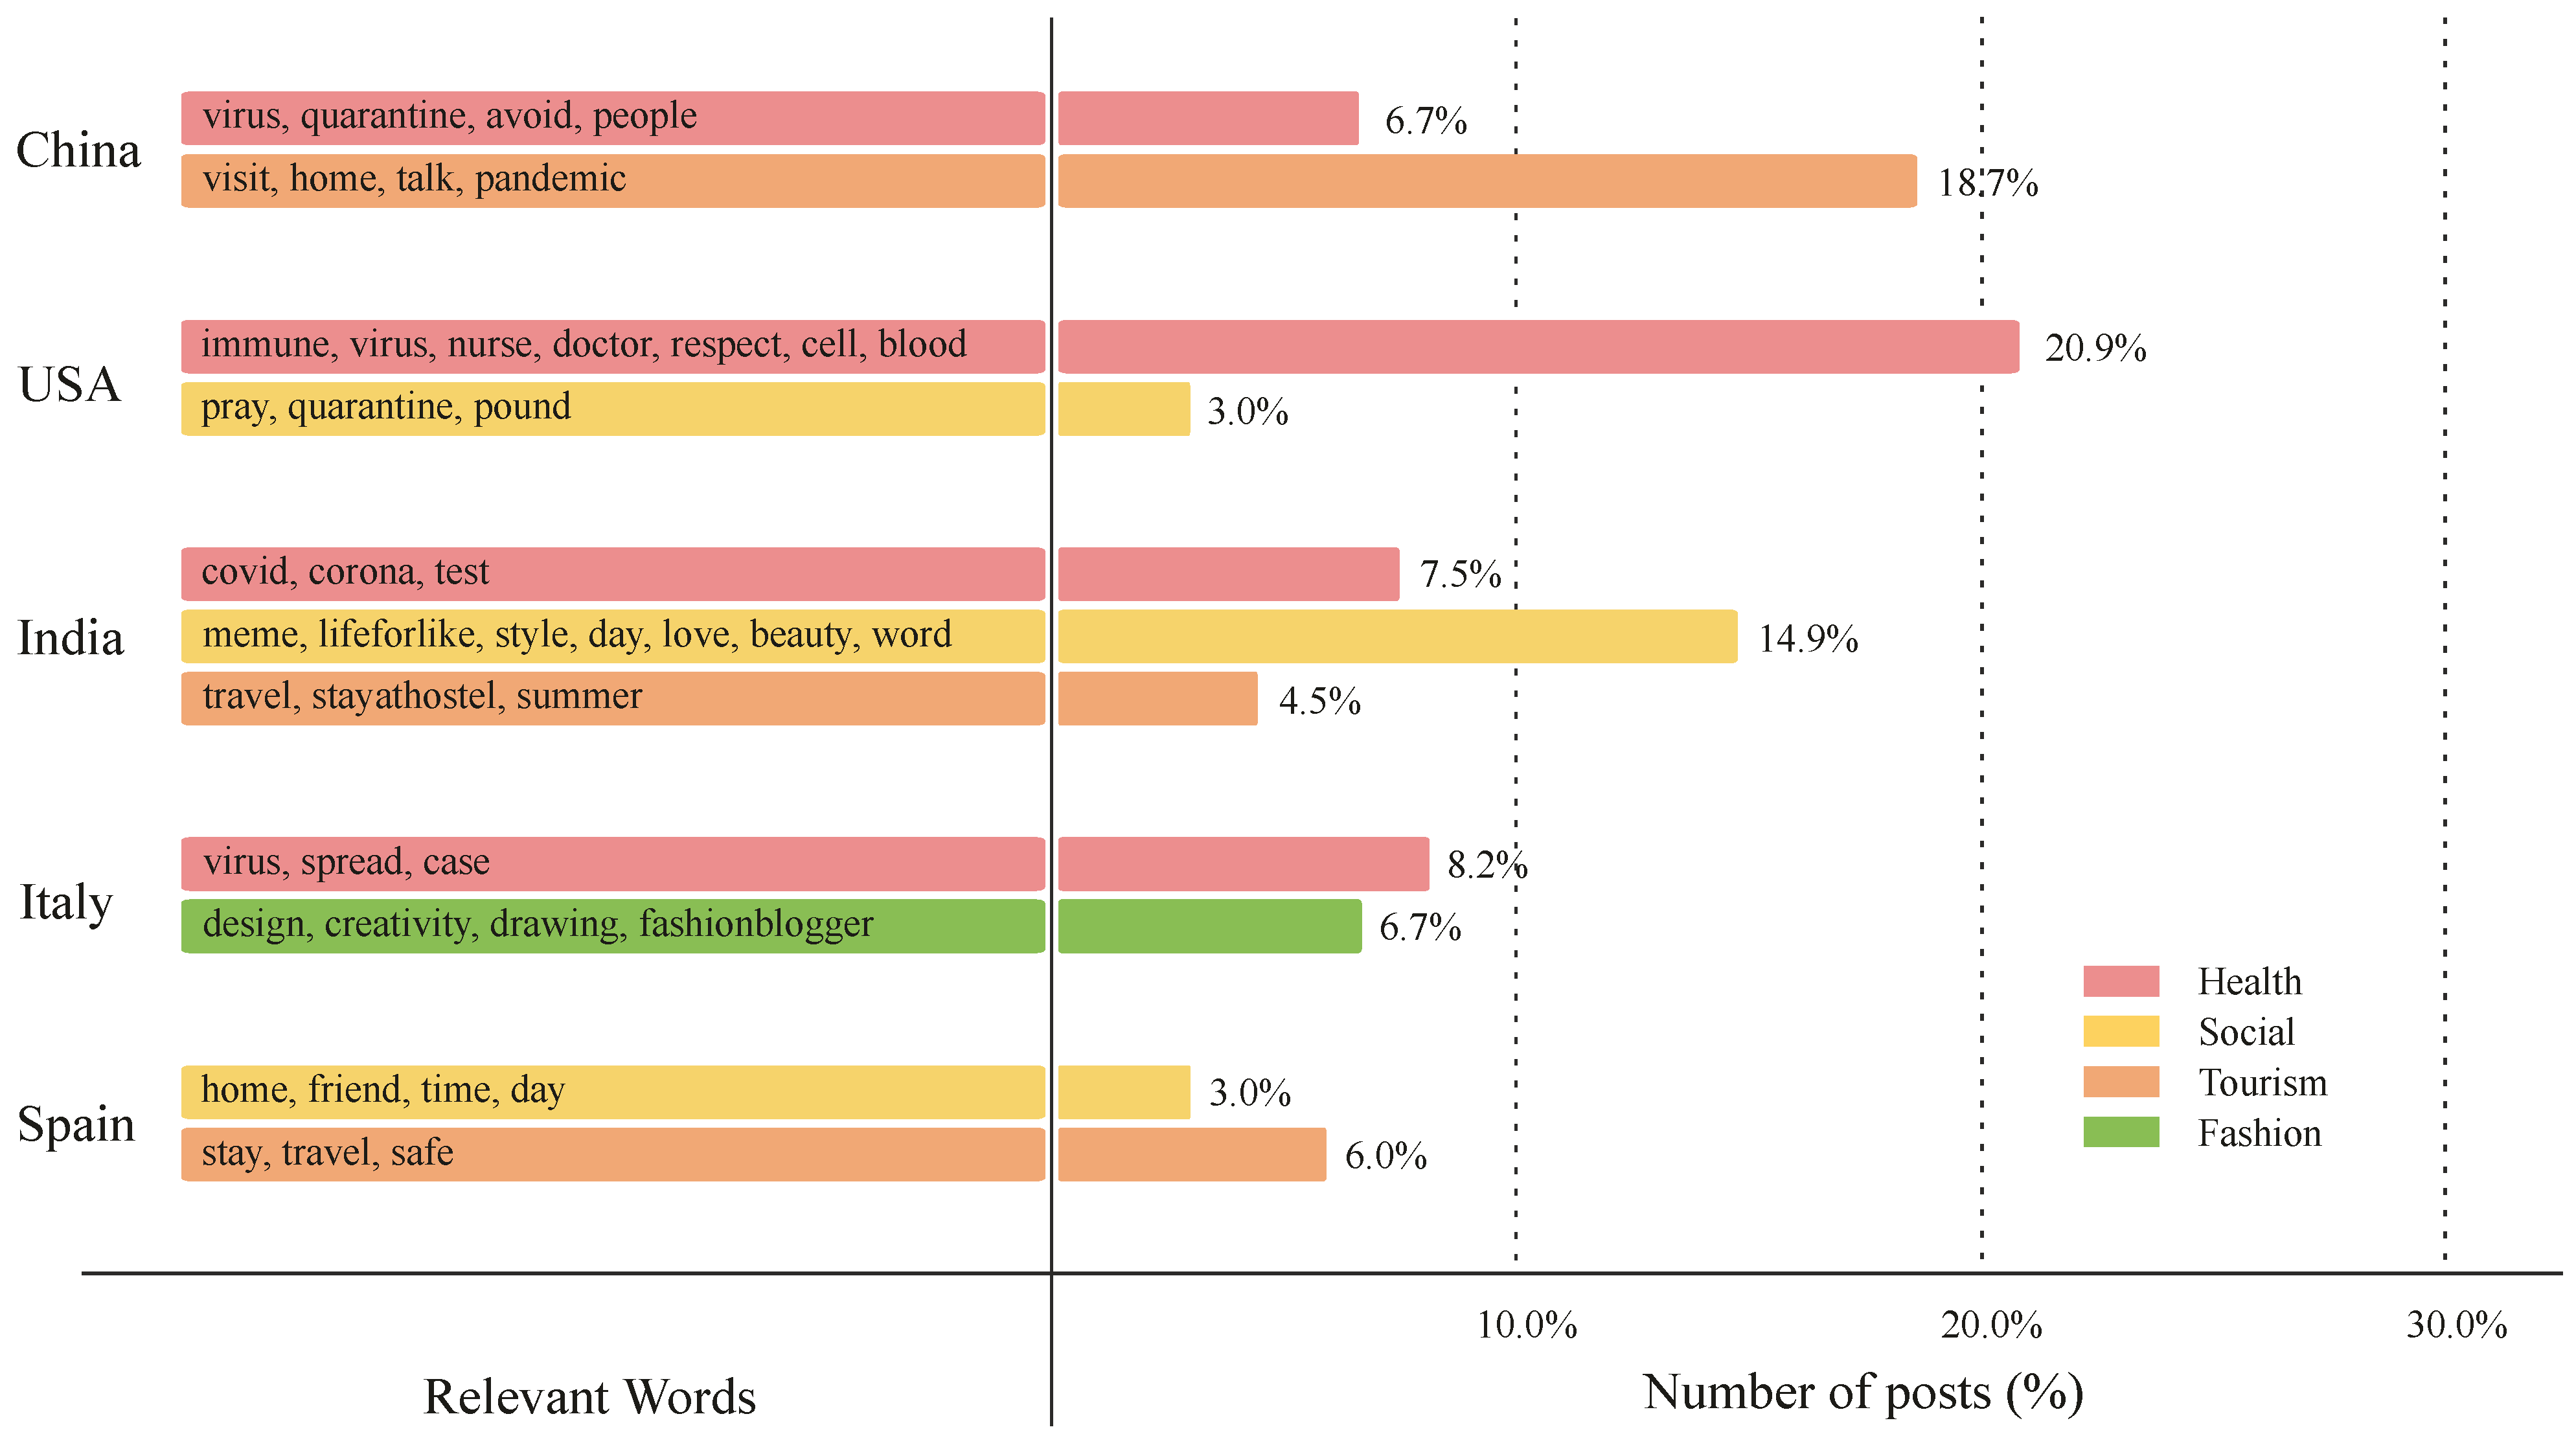
The result of the topic modeling analysis on the Instagram dataset is displayed in Figure 11. The dominant topic categories across countries include health, social, fashion, and tourism, which account for 43.3%, 20.9%, 6.7%, and 29.2% of the topics, respectively. Health-related posts are prominent when mentioning countries such as China, the USA, India, and Italy (as shown in Figure 11). Similar to trends from the Twitter dataset, users express their concern about the number of virus cases spread across different countries. Moreover, Figure 11 shows that travel-related topics are the second most discussed topics in Instagram posts that mention the top-five countries, accounting for a total of 29.2% of the entire dataset.
6.4. Word2vec Analysis of the Top Countries
Our exploration of social media topics has shown that people expressed interest in aspects and issues in specific countries more than others. In previous sections, we discussed the topics mentioning the top-five countries on social media. This section aims to identify the temporal patterns of used terms when mentioning the top-five countries. It is interesting to explore the words frequently associated with a specific country and whether such words persisted or shifted during the pandemic. To this end, we apply a word-embedding technique to investigate the context of the terms associated with the top-five countries in each month and for the entire collection period.
- Methods
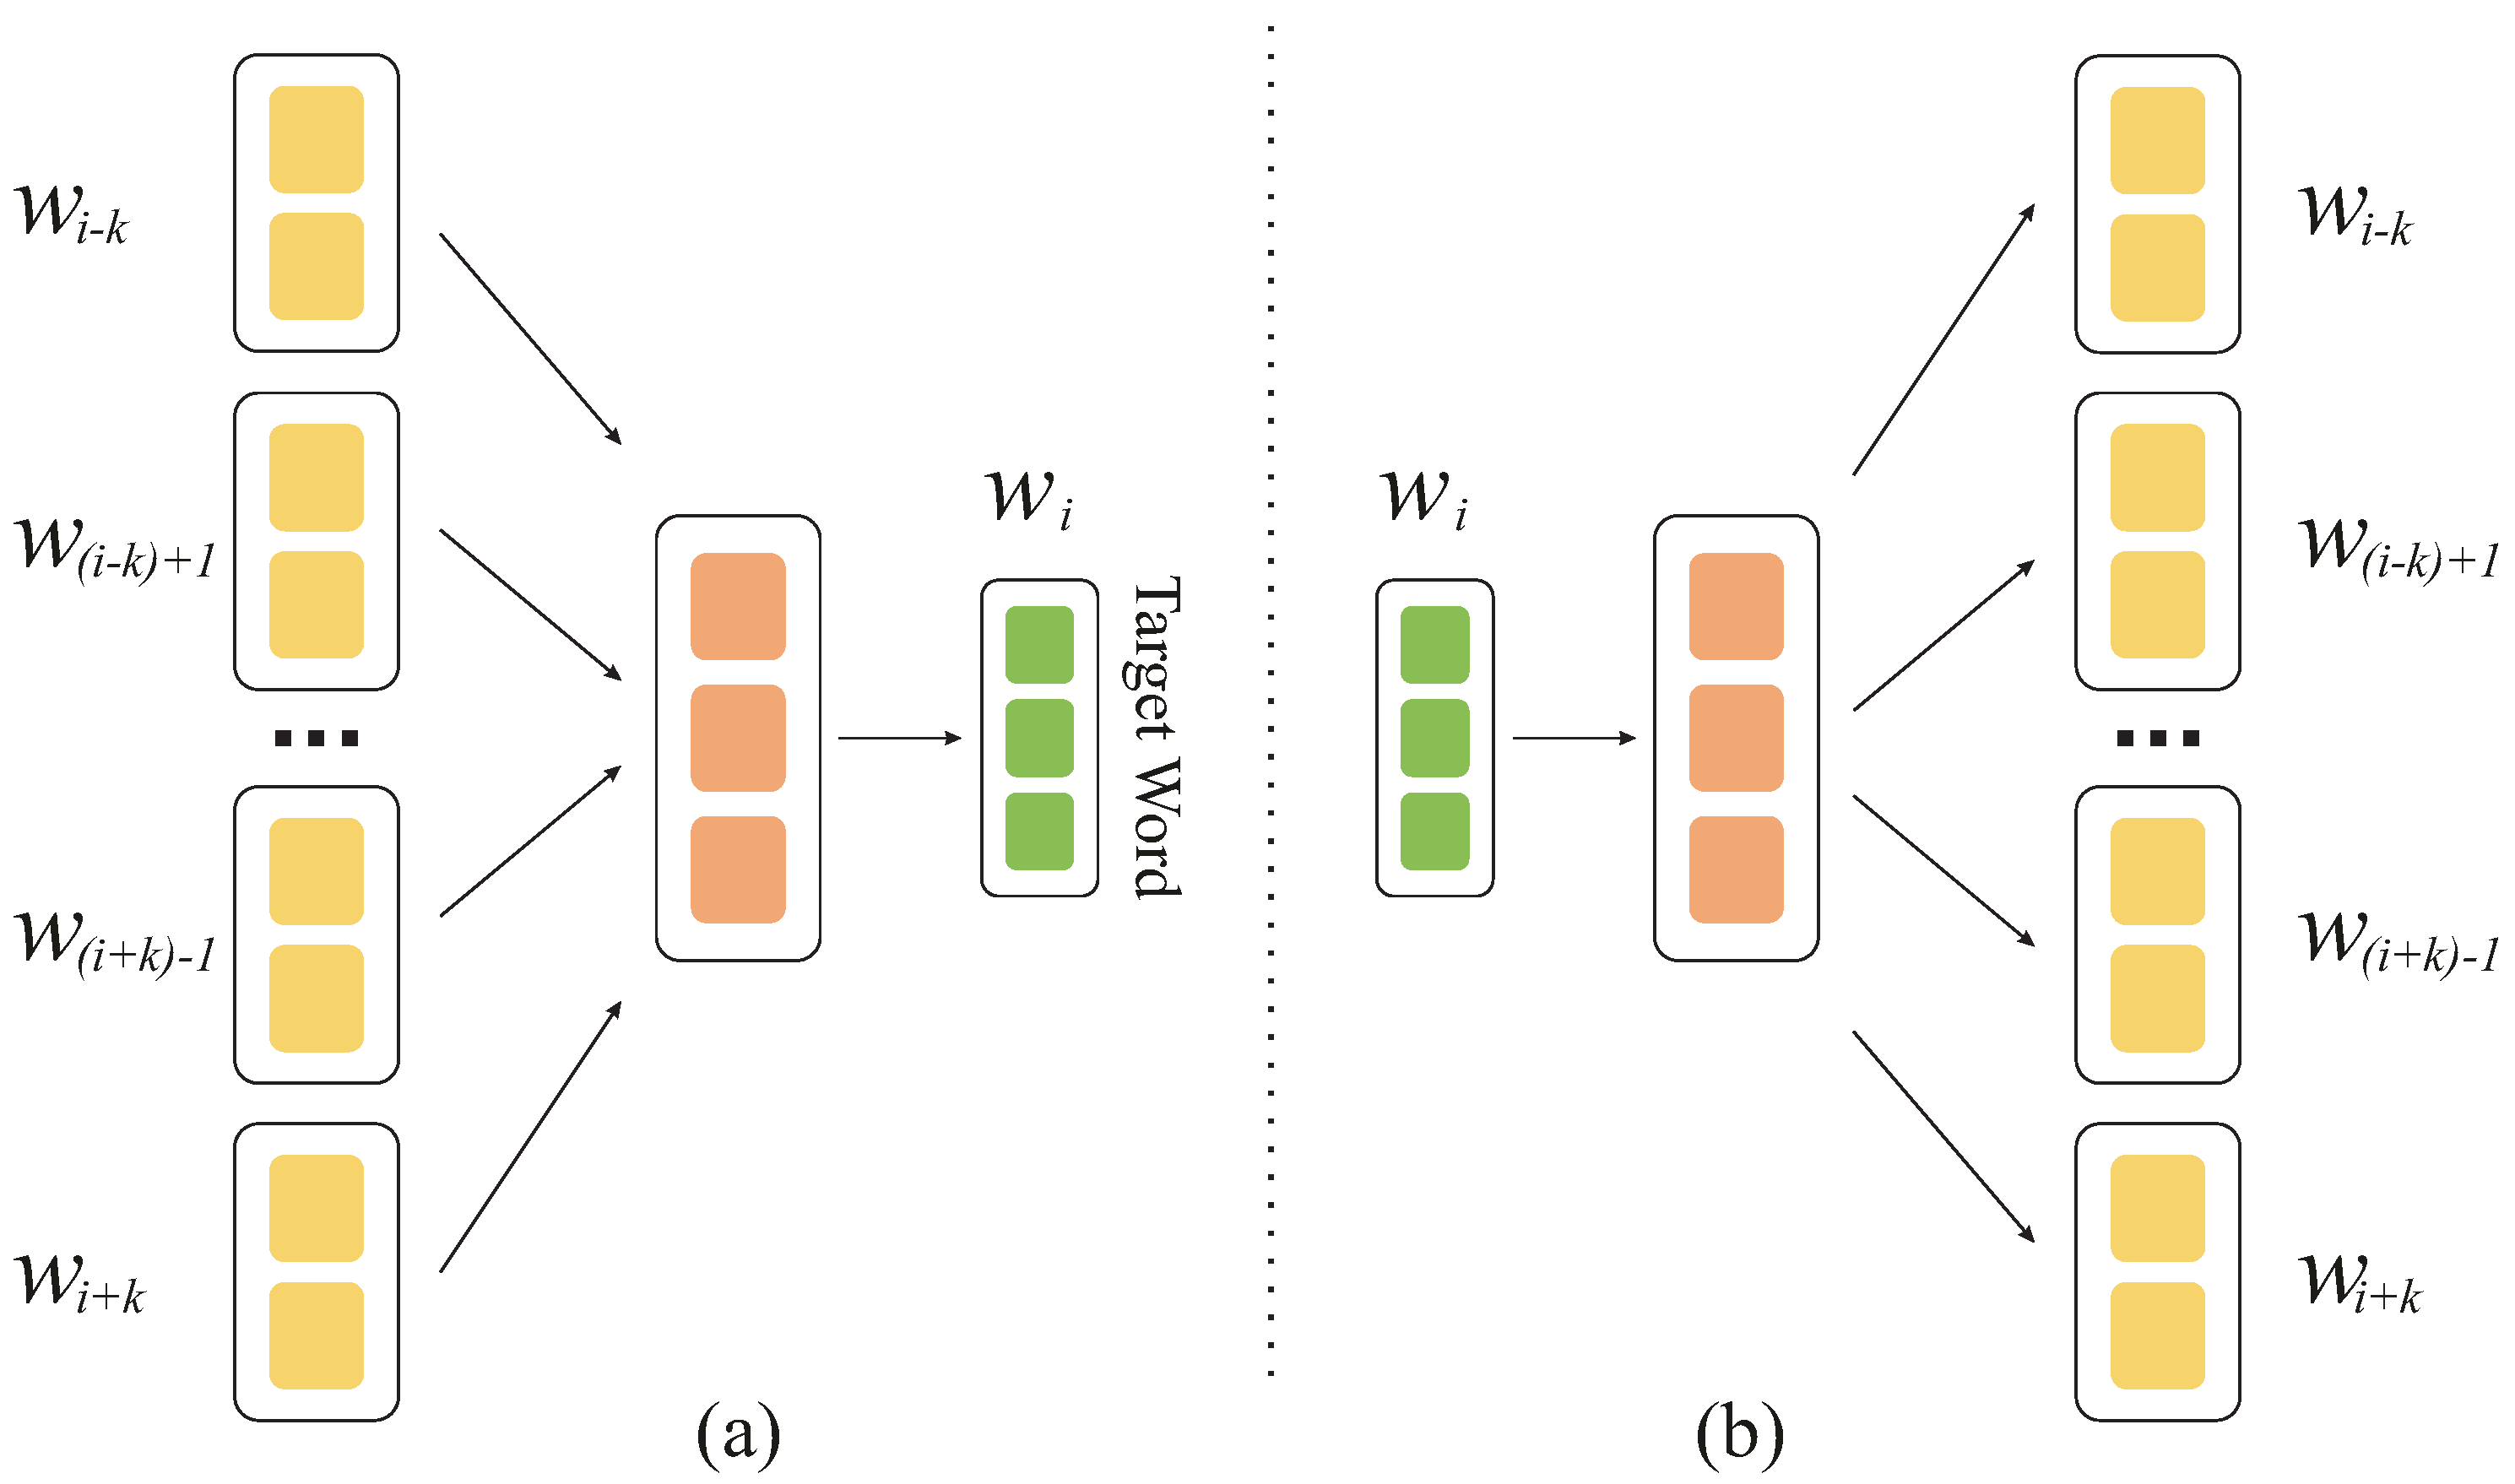
We utilize the word2vec model that adopts a shallow neural network to embed words for the analysis. Word2vec has two main algorithms: a bag of words (CBOW) and a skip-gram (see Figure 12). The difference between those algorithms is that CBOW is used to predict a target word from a context, while skip-gram predicts a target context from a given word. For our implementation of the word2vec model, we used the Gensim library [41] with the default settings including hyperparameters such as window, size, sample, alpha, min-alpha, negative, and workers. However, we set the min_count hyperparameter to 20, which means that the words with an occurrence of less than 20 are ignored.
Word2vec captures different degrees of similarity between words, and it uses vector arithmetic to reproduce syntactic and semantic patterns. Therefore, we use it to identify key terms and top countries on both social networks. Schild et al. [14] used a similar technique, where the authors investigated the spread of Sinophobic slurs in social networks based on specific keywords such as “China”, “Chinese”, “virus”, etc. The difference between the work of Schild et al. [14] and ours is that we use word embeddings to explore the dynamics and temporal patterns of used words in the social network over time, considering their association with different countries. Specifically, we extract words from the monthly dataset and determine whether a new word associated with the target country has been added or whether a word has remained consistent in a particular month relative to previous months.
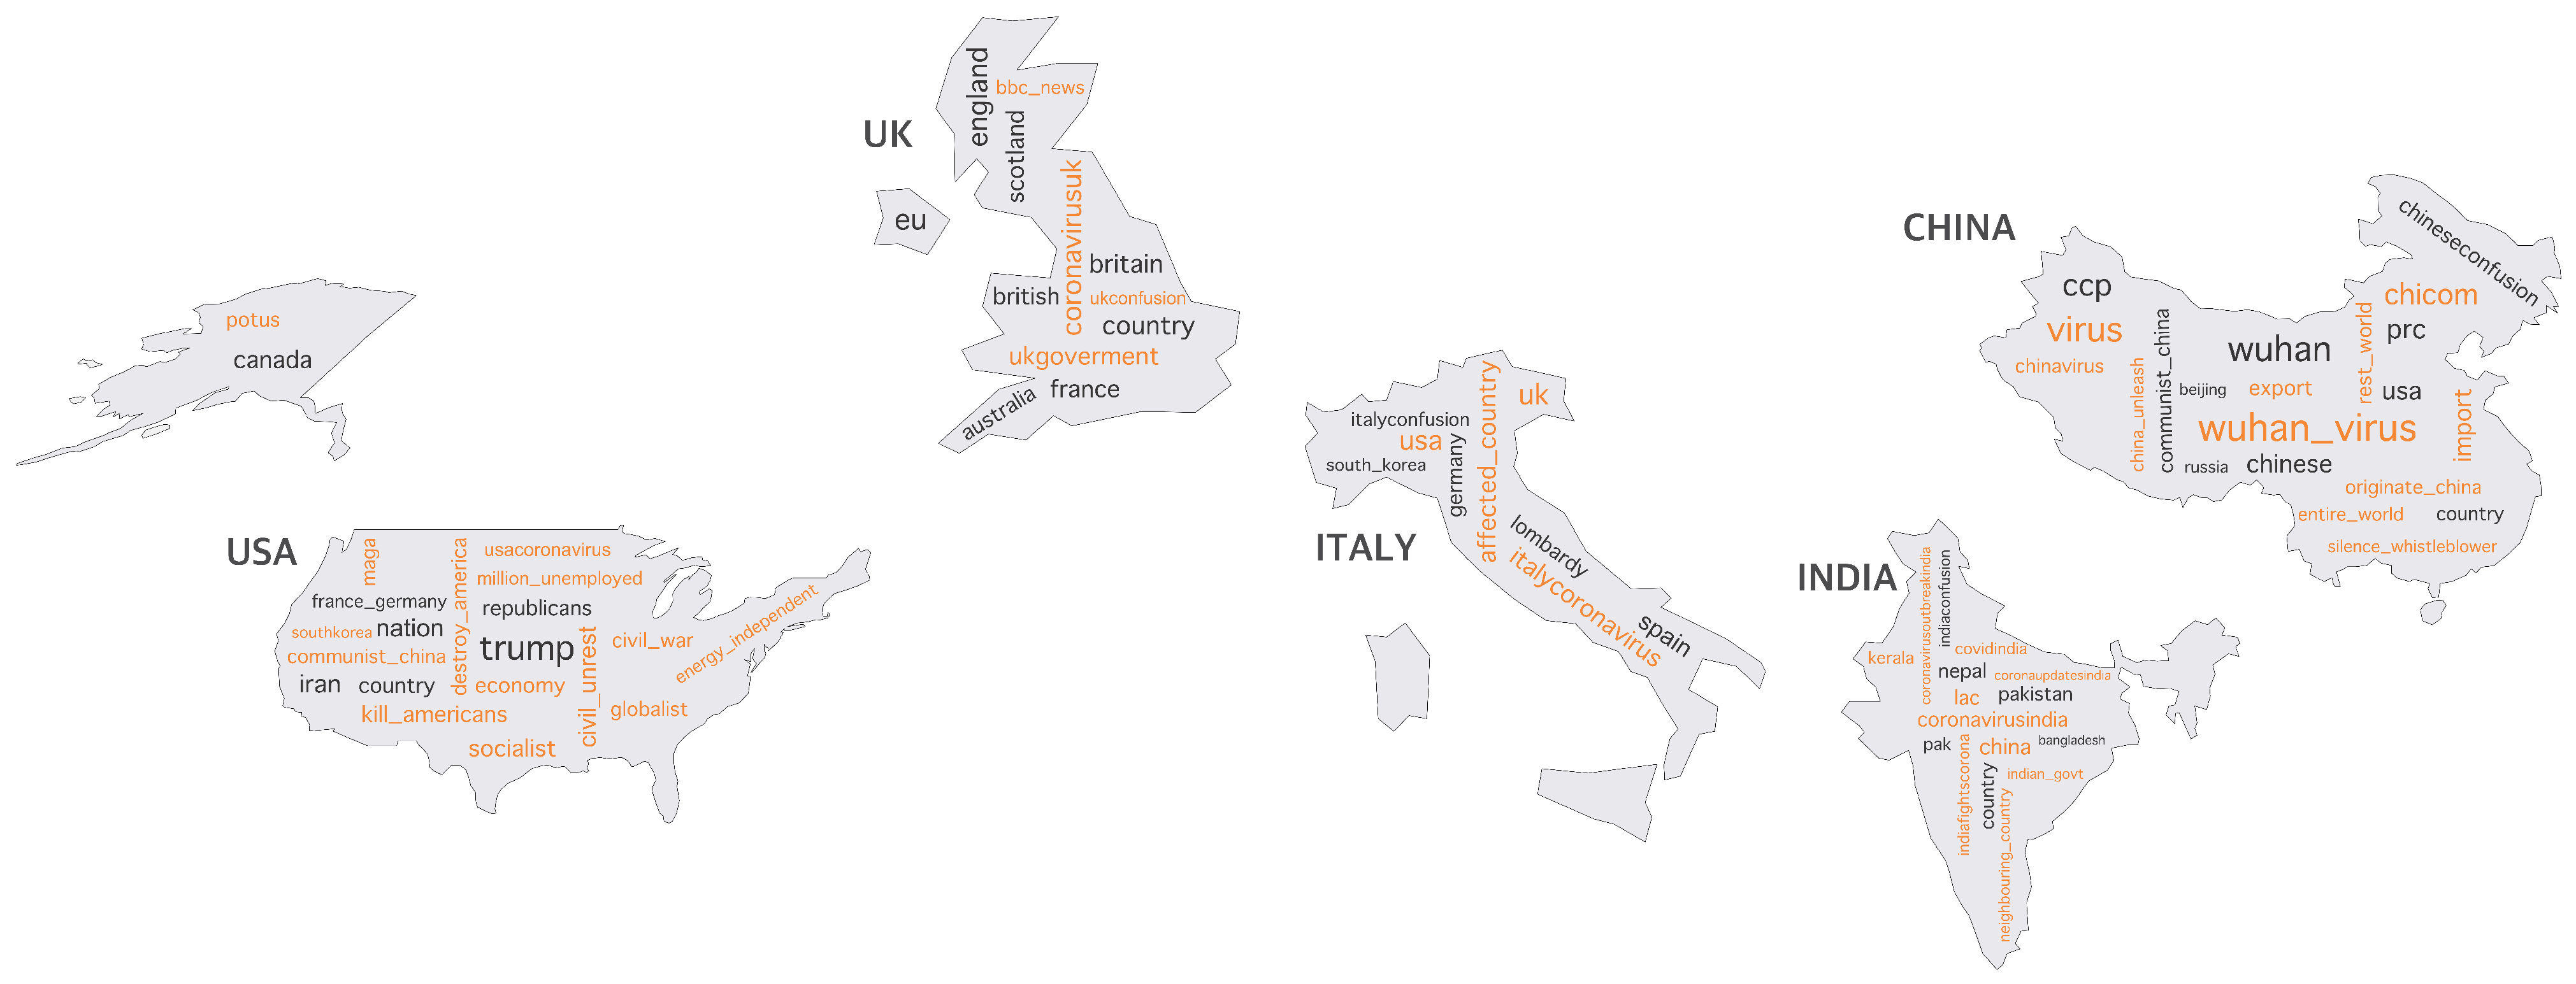
The results of our analysis using Twitter and Instagram datasets are shown in Figure 13 and Figure 14, respectively. The figures show the words colored in black and orange. The black-colored words represent persistent words through the data collection period, and the orange-colored words represent trending words that shifted from January to June. Information about the most frequent words on both social networks is given in Table 5 and Table 6, respectively.
- Twitter
Figure 13 shows the color-coded words that persisted or shifted during the data collection period of Twitter posts mentioning different countries. We noticed a shift in using other words in association with different countries. For example, the term “wuhan_virus” was increasingly associated with mentioning “China” over time, as well as other terms, such as “originate_China” and “chinavirus”, indicating people’s interest in communicating news about the COVID-19 virus, which was first documented in Wuhan, China. Other terms, such as “silence_whistleblower”, have shown a trend over time in tweets mentioning China. The phrase “silence_whistleblower” was in reference to the doctor who revealed COVID-19 in China, e.g., one tweet says: “Sad: Chinese doctor who worked with late whistleblower dead from #coronavirus”. Our analysis also highlights terms that were associated with the USA, including terms that are not related to coronavirus but to events that occurred during the pandemic. For example, the terms “civil_unrest” and “civil_war” were associated with the death of George Floyd on 25 May 2020, and its consequences nationwide. Another trend was captured for the phrase “million_unemployed” which was more likely related to an article published in The New York Times [44] pointing out the unemployment numbers in the USA, specifically, mentioning that 51 million Americans were unemployed since the start of the COVID-19 pandemic. The following tweet is an example for this case: “Coronavirus: 3.3 million more unemployed in a week in the United States, a historic record …”. Similar coronavirus-related trends were also obvious in association with other countries, such as India, the UK, and Italy.
- Instagram
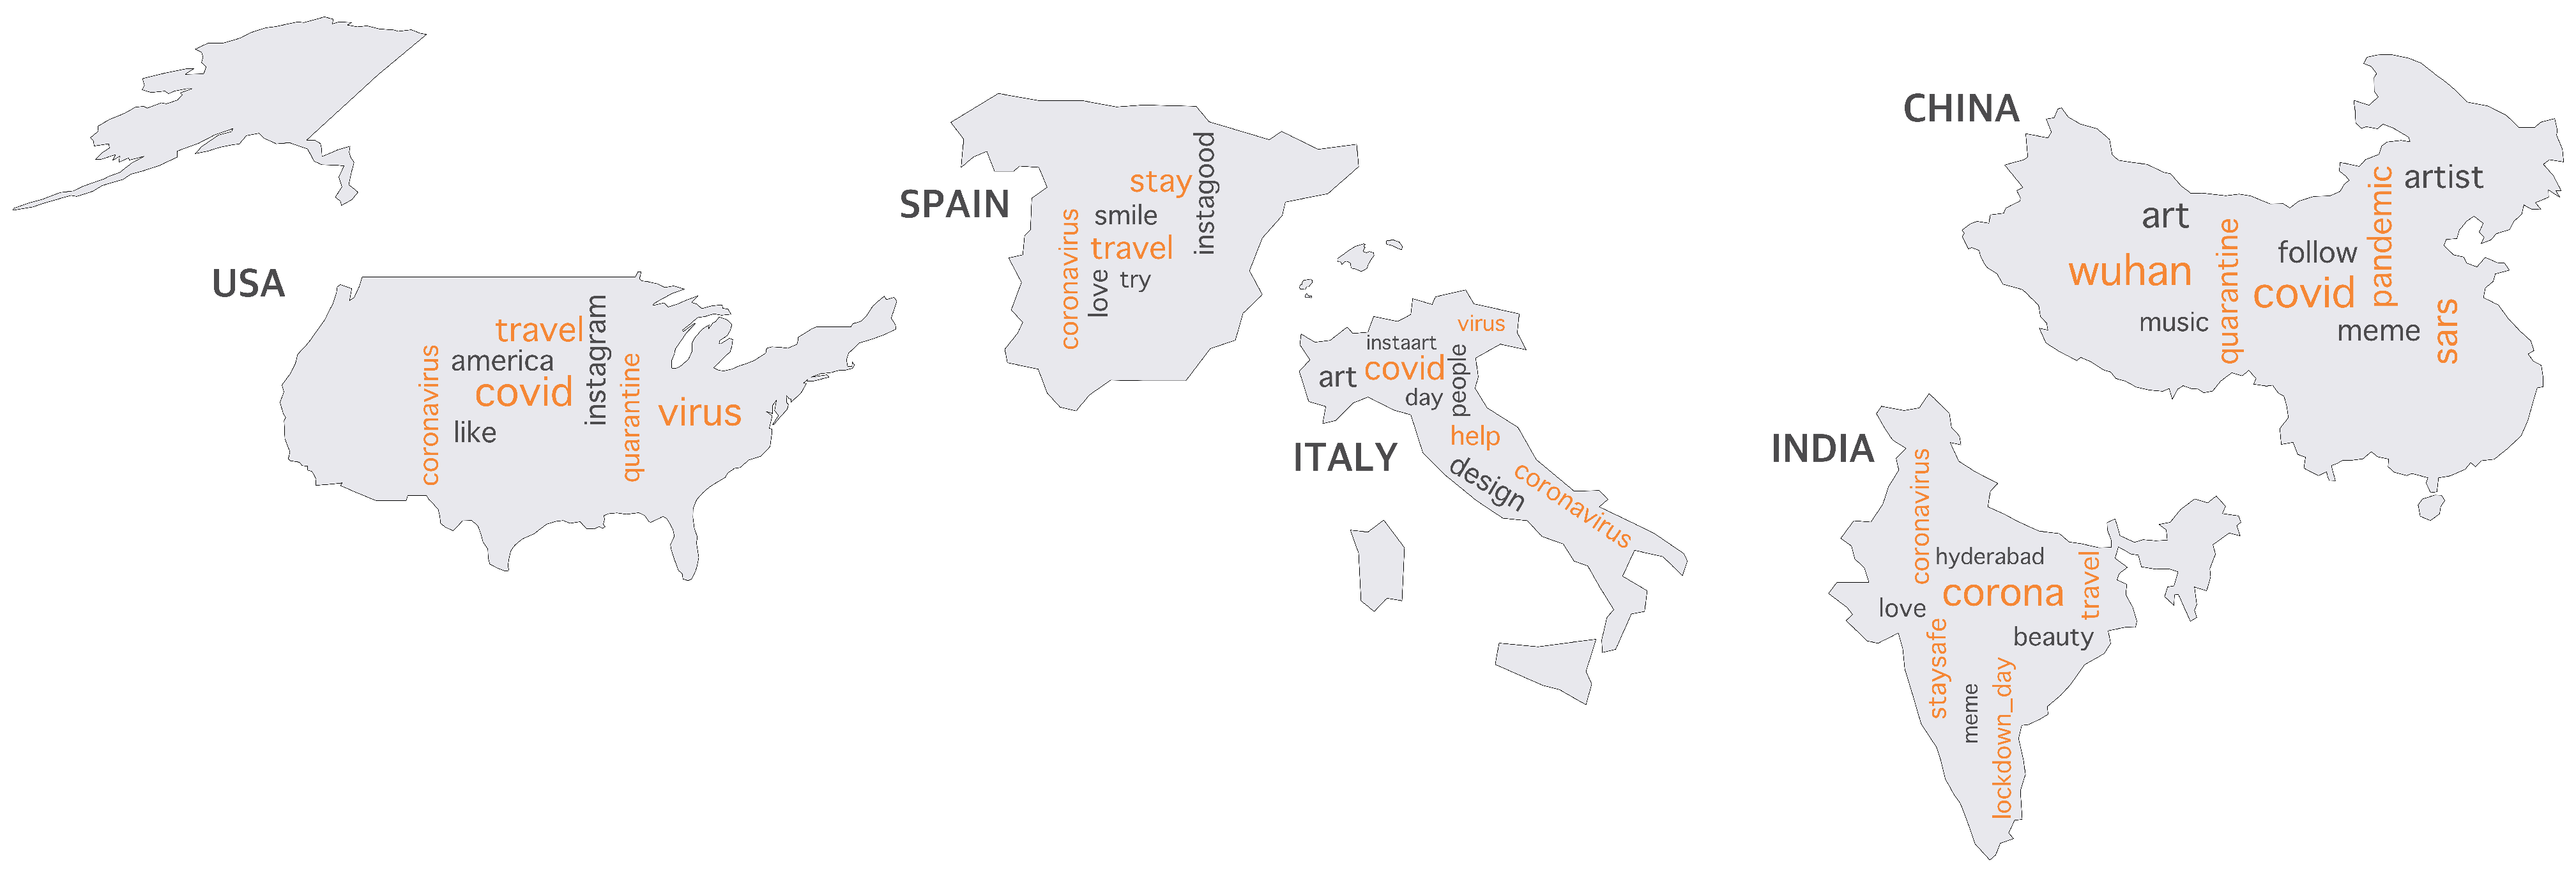
The result of word representations and trends using the Instagram posts is shown in Figure 14. The results show that some terms such as, “smile”, “love”, “instagood”, “art”, “follow”, etc., remain unchanged within the data collection period. However, there was a shift in some other terms, such as “travel”, “help”, and “stay_safe”, across different countries. We also observed the trends for using terms related to coronavirus over time. Accordingly, this means that people started publishing posts related to COVID-19 indicating their attention to the pandemic’s spread. Some such posts show that Instagram users were trying to compare past diseases, e.g., severe acute respiratory syndrome (SARS), with COVID-19. This can be the reason for observing the keyword “sars” in association with China, especially referencing the beginning of the SARS outbreak in China (November 2002, Xu et al. [45]).
6.5. Locality Analysis of Posts Associated with the Top Countries
To study users’ localities interacting on social media through posts mentioning the top-mentioned countries, we further investigated the posts and locations of users showing interest in different topics associated with these countries. Indeed, users worldwide can share an interest in a variety of topics across other countries. Therefore, posts on social media mentioning a specific country do not necessarily need to have originated from that country. In this section, we aim to identify the localities of posts mentioning the top countries.
- Twitter
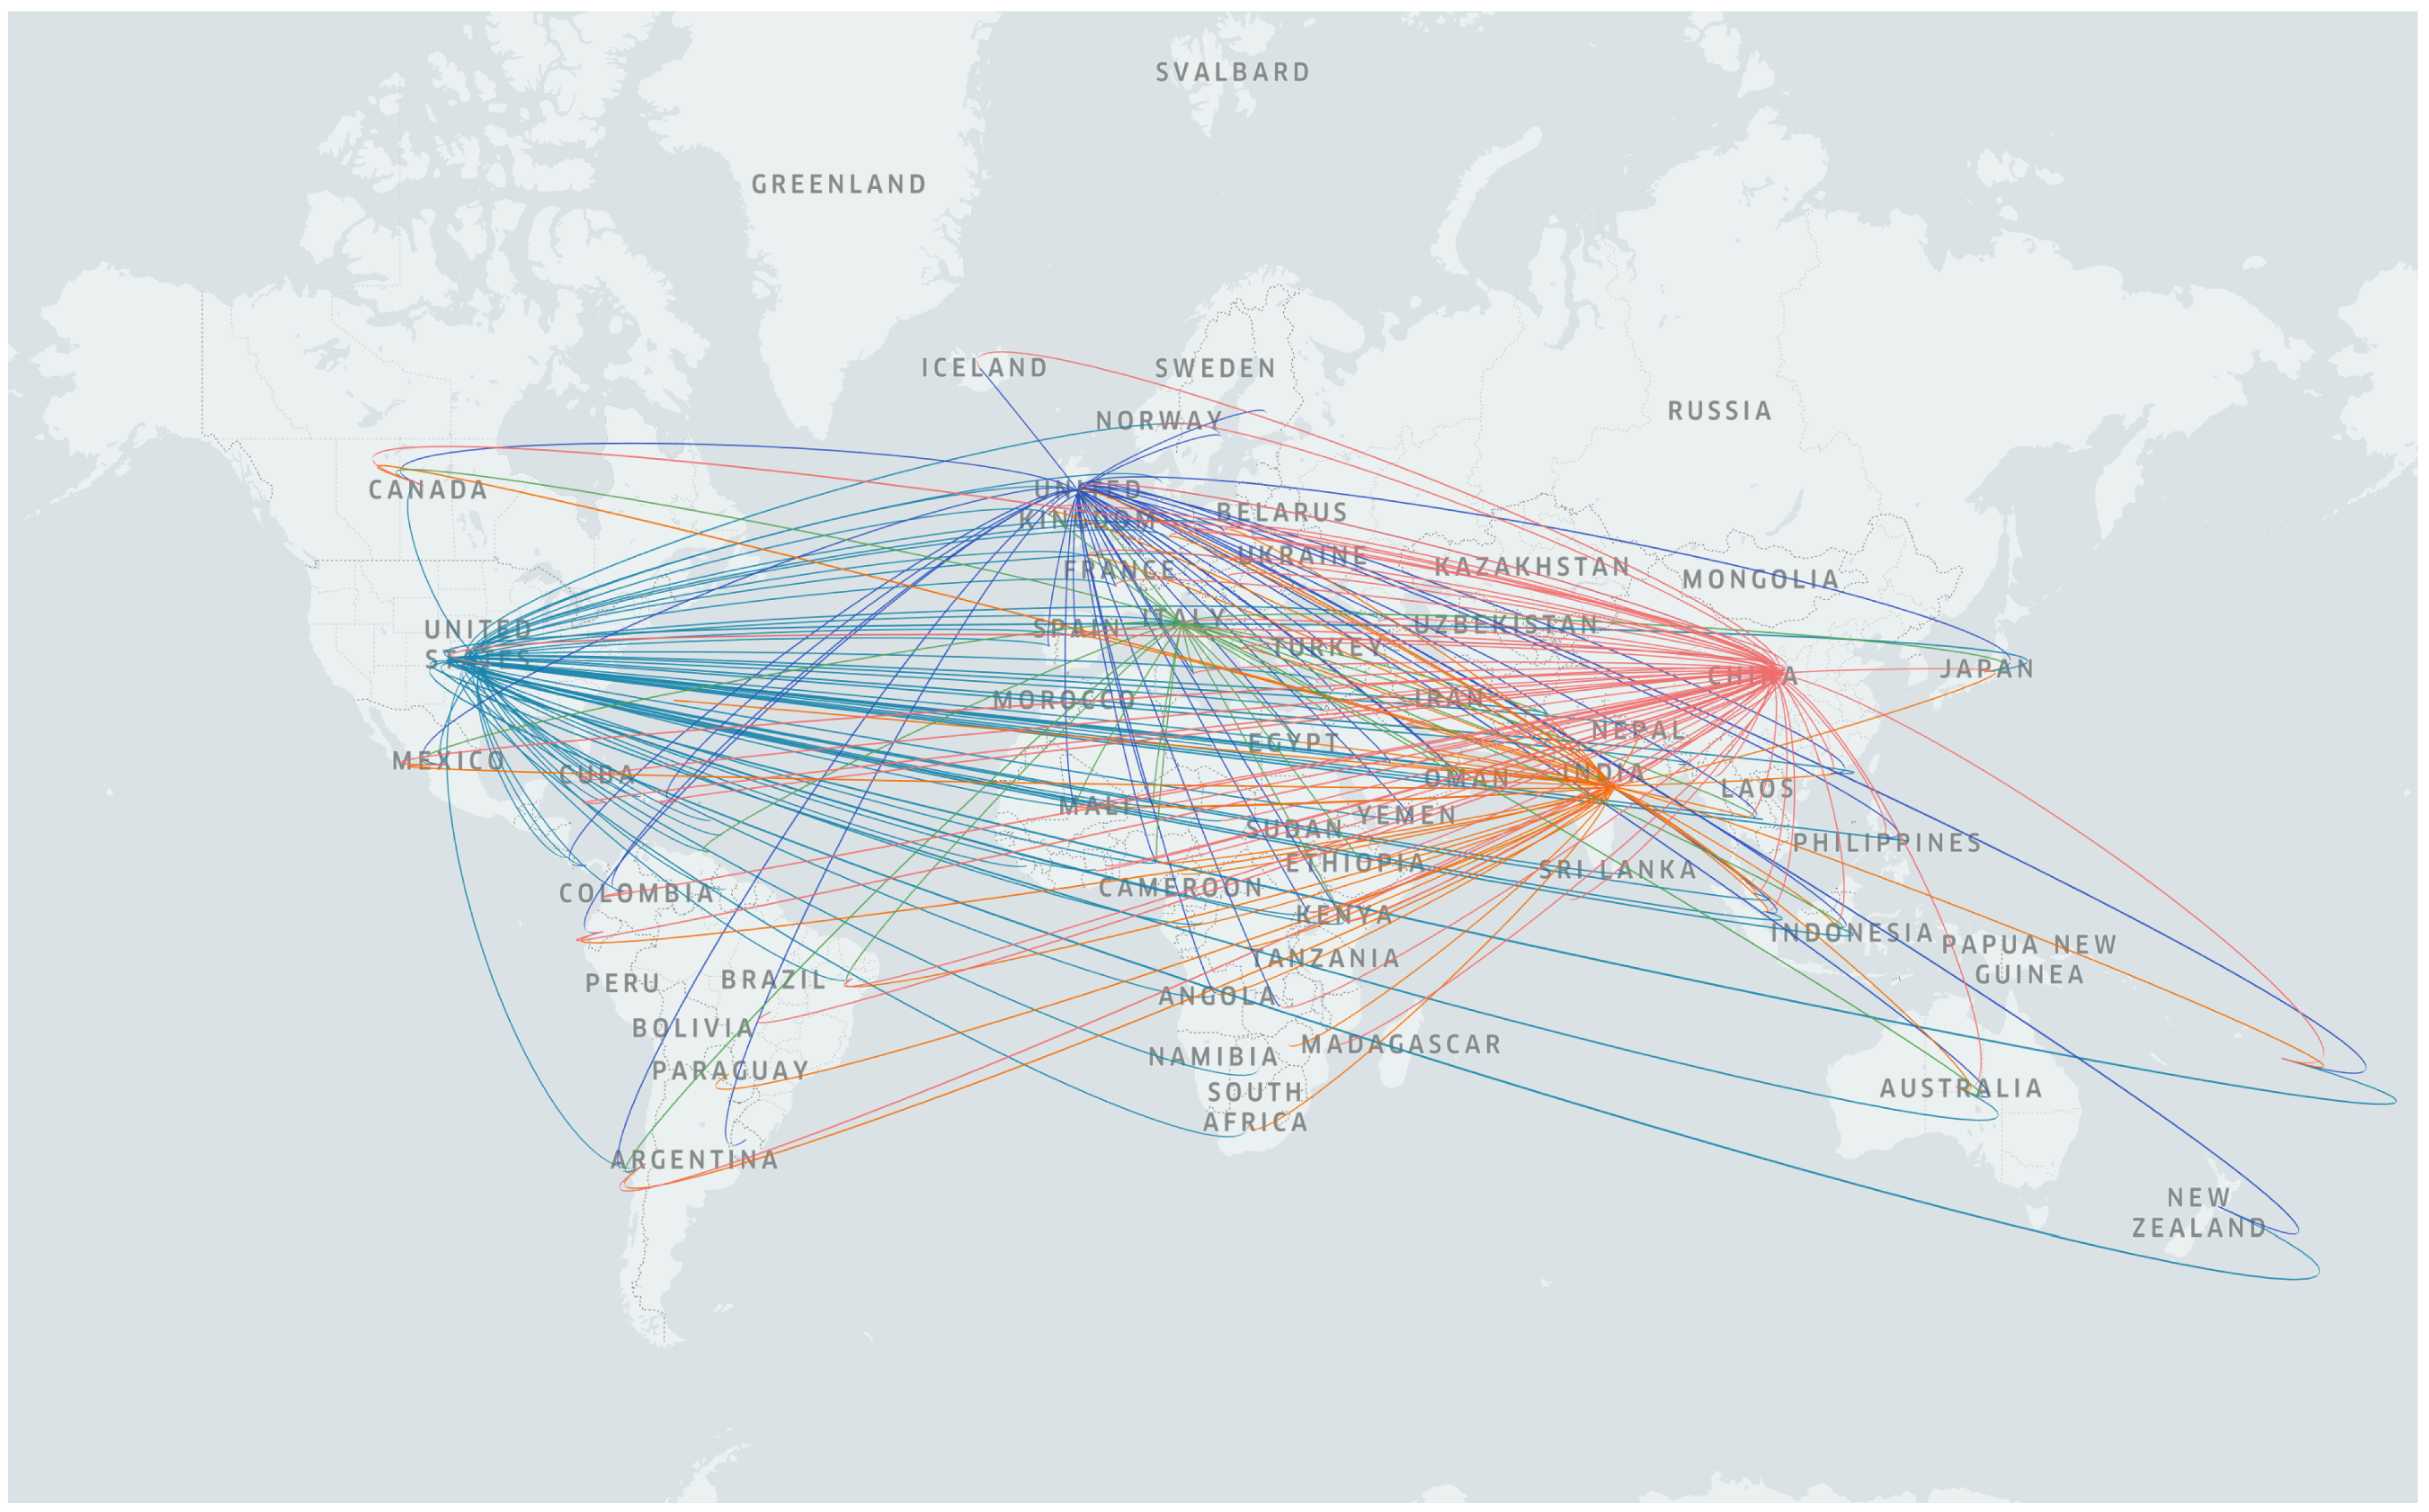
Figure 15 displays locations on a map pointing to the top countries, where the connecting lines mean that users from those locations published tweets about the top countries. China-related tweets include 66 countries, while tweets about the USA, UK, India, and Italy are published from 64, 50, 44, and 26 countries, respectively.
Taking those number of countries into account (the numbers do not include the counts from the top countries), it can be said that China was mentioned by users from more places than other countries, while the USA is the second highest one. Since our results and analysis showed that the most discussed topics are related to the health category, we can deduce that most countries discussed the health situations in China. Even though a smaller number of countries mention Italy, people only had discussions about its health and social matters. It should be underlined that people from 50 different locations focused on the UK’s social aspects, while the health category is dominant for other top countries.
- Instagram
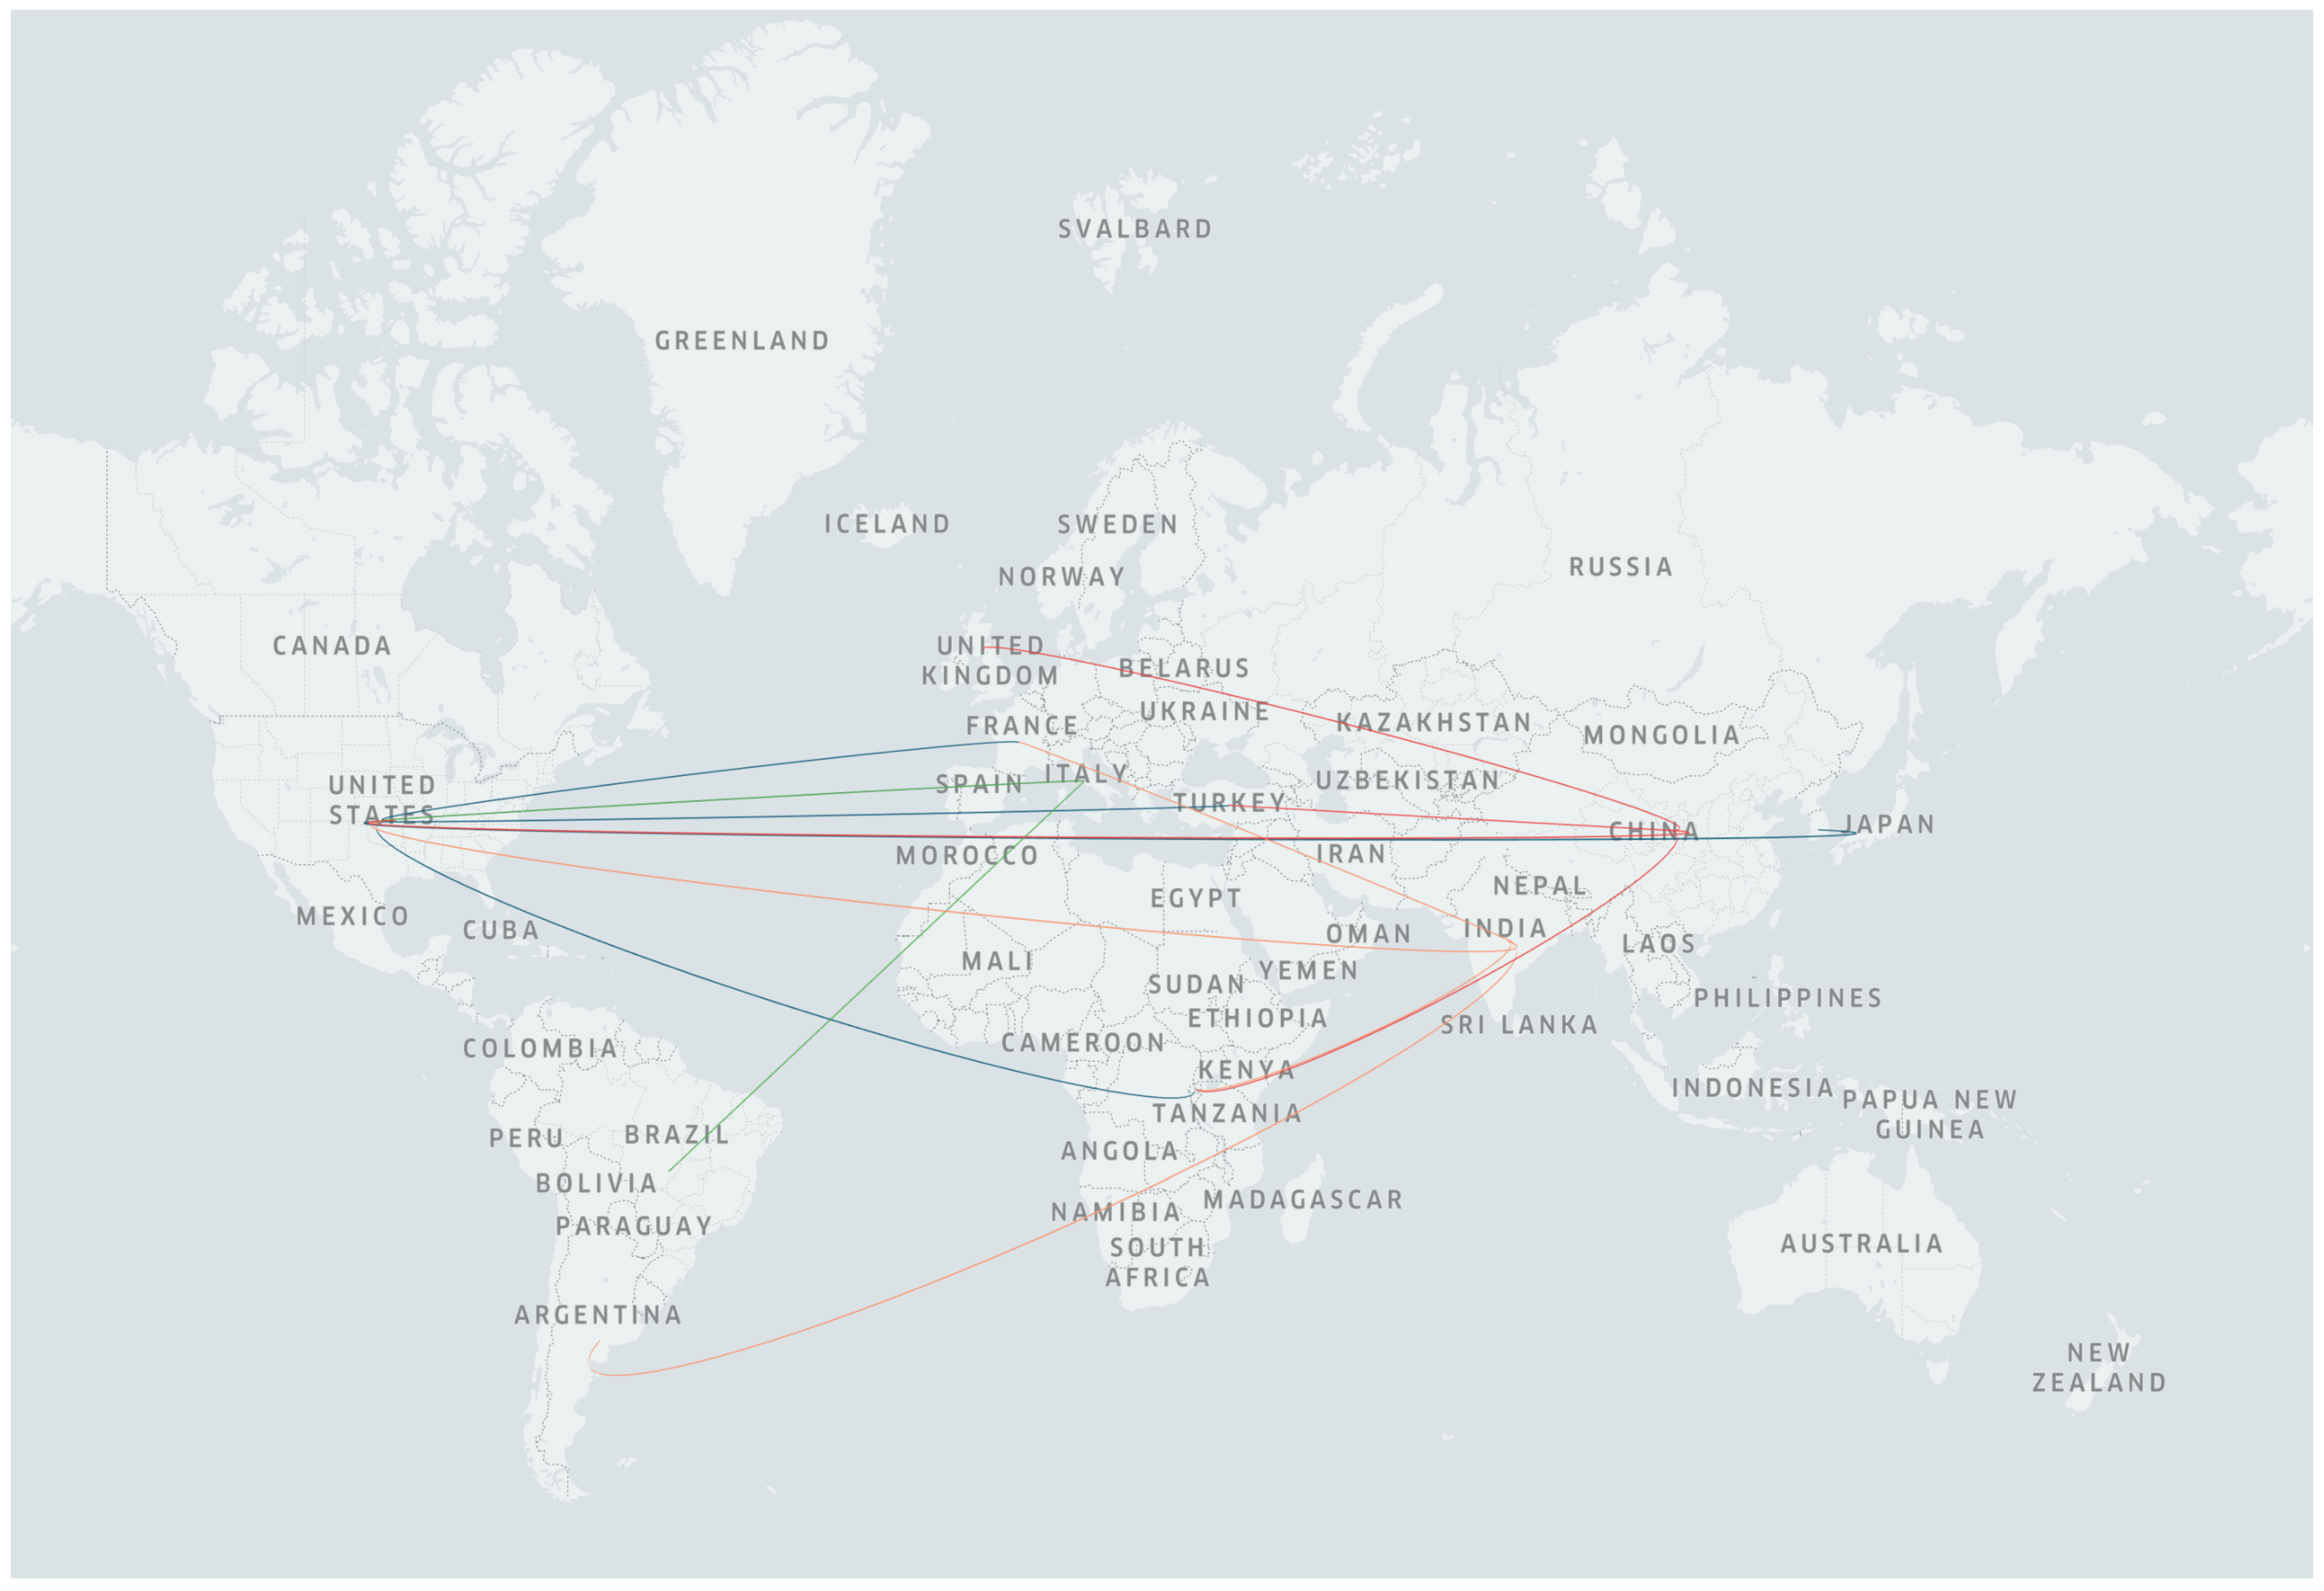
Figure 16 depicts the results of our locality analysis of the posts associated with the top countries. The figure shows that there are fewer localities where people mention the top countries, in comparison to the Twitter data. For example, Spain is not mentioned by any user from other countries, while China, the USA, and India have only four separate external locations where people published posts about them. Italy is discussed by only two other countries, i.e., Brazil and the USA. Users from Turkey, the UK, Rwanda, the USA, and China paid attention to topics that are related to travel. Health-related topics from the USA were the main point of interest to users from South Korea, France, Turkey, Rwanda, and the USA.
7. Conclusions
First, we identified people’s overall reactions that could be deduced from sentiment analysis. We found that users of both social networks published more neutral tweets and posts, but the number of negative tweets is also significantly high. Second, we implemented topic modeling on the datasets with distinct sentiment types (negative, neutral, positive) on specific periods that led to spikes. Third, we performed a country analysis to observe the countries that were discussed and found that China, the USA, India, the UK, and Italy are the countries that attracted the attention of the highest number of Twitter users. Interestingly, those countries, except for the UK, are the most discussed countries by Instagram users, along with Spain. Fourth, by displaying each country’s sentiment analysis on both social media platforms, we detected spikes during specific time periods and identified what topics led to those spikes. It can be inferred that topics related to the economy, politics, health, social factors, and tourism are the reasons for those spikes on Twitter. In contrast, the health, fashion, social, and tourism categories are superior on Instagram. We can conclude that on both social media platforms, health topics dominate over other categories based on the resultant Figure 10 and Figure 11. Fifth, we detected the words that remained or shifted towards the top countries by carrying out the word2vec analysis. The results showed that COVID-19 affected the top countries, and those countries experienced a shift of meaning. Thus, terms related to coronavirus are linked with the countries’ names on Twitter and Instagram. Sixth, we measured the impact areas of the top countries by identifying the location of publishing of the retweets and posts. According to the results of our analysis, users of 66 countries (Twitter) along with another four countries (Instagram) focused on China more than any other country. In conclusion, as our analysis provides detailed insight into the COVID-19 datasets of both social networks, this paper can be used to comprehend people’s reactions and the attention they pay to certain topics. We intend to extend our experiments to gain a deeper understanding of social network responses to the pandemic over a longer period of time. In addition, we intend to investigate the measures taken by governments and their results. Finally, we will investigate how user responses have changed prior to, during, and after the pandemic.
Author Contributions
Conceptualization, methodology, data curation, and software: E.A. and F.J.; validation and formal analysis: M.A. and S.E.-S.; investigation, resources, and writing—original draft preparation: S.E.-S. and T.A.; visualization: F.J.; supervision: T.A. All authors have read and agreed to the published version of the manuscript.
Funding
This research was supported by the MSIT (Ministry of Science and ICT), Korea, under the ICT Creative Consilience Program (IITP-2021-2020-0-01821) supervised by the IITP (Institute for Information & Communications Technology Planning & Evaluation), and the National Research Foundation of Korea (NRF) grant funded by the Korean government (MSIT) (No. 2021R1A2C1011198).
Data Availability Statement
The data presented in this study are available on request from the corresponding author as Tweet IDs. The data are not publicly available due to Twitter’s Developer Terms & Conditions.
Conflicts of Interest
The authors declare no conflict of interest.
References
- Shuja, J.; Alanazi, E.; Alasmary, W.; Alashaikh, A. COVID-19 open source data sets: A comprehensive survey. Appl. Intell. 2020, 51, 1296–1325. [Google Scholar] [CrossRef] [PubMed]
- El-Rashidy, N.; Abdelrazik, S.; Abuhmed, T.; Amer, E.; Ali, F.; Hu, J.W.; El-Sappagh, S. Comprehensive Survey of Using Machine Learning in the COVID-19 Pandemic. Diagnostics 2021, 11, 1155. [Google Scholar] [CrossRef] [PubMed]
- Shrivastav, L.K.; Jha, S.K. A gradient boosting machine learning approach in modeling the impact of temperature and humidity on the transmission rate of COVID-19 in India. Appl. Intell. 2020, 51, 2727–2739. [Google Scholar] [CrossRef] [PubMed]
- Kumari, P.; Singh, H.P.; Singh, S. SEIAQRDT model for the spread of novel coronavirus (COVID-19): A case study in India. Appl. Intell. 2020, 51, 2818–2837. [Google Scholar] [CrossRef] [PubMed]
- Singh, K.K.; Kumar, S.; Dixit, P.; Bajpai, M.K. Kalman filter based short term prediction model for COVID-19 spread. Appl. Intell. 2021, 51, 2714–2726. [Google Scholar] [CrossRef] [PubMed]
- Lamsal, R. Design and analysis of a large-scale COVID-19 tweets dataset. Appl. Intell. 2020, 51, 2790–2804. [Google Scholar] [CrossRef]
- Goel, T.; Murugan, R.; Mirjalili, S.; Chakrabartty, D.K. OptCoNet: An optimized convolutional neural network for an automatic diagnosis of COVID-19. Appl. Intell. 2020, 51, 1351–1366. [Google Scholar] [CrossRef]
- Turkoglu, M. COVIDetectioNet: COVID-19 diagnosis system based on X-ray images using features selected from pre-learned deep features ensemble. Appl. Intell. 2020, 51, 1213–1226. [Google Scholar] [CrossRef]
- Li, D.; Fu, Z.; Xu, J. Stacked-autoencoder-based model for COVID-19 diagnosis on CT images. Appl. Intell. 2020, 51, 2805–2817. [Google Scholar] [CrossRef]
- Mukherjee, H.; Ghosh, S.; Dhar, A.; Obaidullah, S.M.; Santosh, K.C.; Roy, K. Deep neural network to detect COVID-19: One architecture for both CT Scans and Chest X-rays. Appl. Intell. 2020, 51, 2777–2789. [Google Scholar] [CrossRef]
- El-Rashidy, N.; Abuhmed, T.; Alarabi, L.; El-Bakry, H.; Abdelrazek, S.; Ali, F.; El-Sappagh, S. Sepsis prediction in intensive care unit based on genetic feature optimization and stacked deep ensemble learning. Neural Comput. Appl. 2022, 34, 3603–3632. [Google Scholar] [CrossRef]
- El-Sappagh, S.; Saleh, H.; Ali, F.; Amer, E.; Abuhmed, T. Two-stage deep learning model for Alzheimer’s disease detection and prediction of the mild cognitive impairment time. Neural Comput. Appl. 2022. [Google Scholar] [CrossRef]
- Abdukhamidov, E.; Abuhamad, M.; Juraev, F.; Chan-Tin, E.; AbuHmed, T. AdvEdge: Optimizing Adversarial Perturbations Against Interpretable Deep Learning. In Computational Data and Social Networks, Proceedings of the 10th International Conference, CSoNet 2021, Virtual Event, Montreal, QC, Canada, 15–17 November 2021; Springer: Cham, Switzerland, 2021; pp. 93–105. [Google Scholar]
- Tahmasbi, F.; Schild, L.; Ling, C.; Blackburn, J.; Stringhini, G.; Zhang, Y.; Zannettou, S. “Go Eat a Bat, Chang!”: On the Emergence of Sinophobic Behavior on Web Communities in the Face of COVID-19. In Proceedings of the Web Conference 2021, Ljubljana, Slovenia, 19–23 April 2021; pp. 1122–1133. [Google Scholar] [CrossRef]
- Ordun, C.; Purushotham, S.; Raff, E. Exploratory Analysis of Covid-19 Tweets using Topic Modeling, UMAP, and DiGraphs. arXiv 2020, arXiv:2005.03082. [Google Scholar]
- Li, X.; Zhou, M.; Wu, J.; Yuan, A.; Wu, F.; Li, J. Analyzing COVID-19 on Online Social Media: Trends, Sentiments and Emotions. arXiv 2020, arXiv:2005.14464. [Google Scholar]
- Sharma, K.; Seo, S.; Meng, C.; Rambhatla, S.; Liu, Y. COVID-19 on Social Media: Analyzing Misinformation in Twitter Conversations. arXiv 2020, arXiv:2003.12309. [Google Scholar]
- Jahanbin, K.; Rahmanian, V. Using twitter and web news mining to predict COVID-19 outbreak. Asian Pac. J. Trop. Med. 2020, 13, 378–380. [Google Scholar] [CrossRef]
- Banda, J.M.; Tekumalla, R.; Wang, G.; Yu, J.; Liu, T.; Ding, Y.; Chowell, G. A large-scale COVID-19 twitter chatter dataset for open scientific research—An international collaboration. Epidemiologia 2021, 2, 315–324. [Google Scholar] [CrossRef]
- Medford, R.J.; Saleh, S.N.; Sumarsono, A.; Perl, T.M.; Lehmann, C.U. An “Infodemic”: Leveraging High-Volume Twitter Data to Understand Early Public Sentiment for the Coronavirus Disease 2019 Outbreak. In Open Forum Infectious Diseases; Oxford University Press: Oxford, UK, 2020; Volume 7. [Google Scholar] [CrossRef]
- Singh, L.; Bansal, S.; Bode, L.; Budak, C.; Chi, G.; Kawintiranon, K.; Padden, C.; Vanarsdall, R.; Vraga, E.K.; Wang, Y. A first look at COVID-19 information and misinformation sharing on Twitter. arXiv 2020, arXiv:2003.13907. [Google Scholar]
- Lopez, C.E.; Gallemore, C. An augmented multilingual Twitter dataset for studying the COVID-19 infodemic. Soc. Netw. Anal. Min. 2021, 11, 102. [Google Scholar] [CrossRef]
- Cinelli, M.; Quattrociocchi, W.; Galeazzi, A.; Valensise, C.M.; Brugnoli, E.; Schmidt, A.L.; Zola, P.; Zollo, F.; Scala, A. The COVID-19 social media infodemic. Sci. Rep. 2020, 10, 16598. [Google Scholar] [CrossRef]
- Kouzy, R.; Abi Jaoude, J.; Kraitem, A.; El Alam, M.B.; Karam, B.; Adib, E.; Zarka, J.; Traboulsi, C.; Akl, E.W.; Baddour, K. Coronavirus Goes Viral: Quantifying the COVID-19 Misinformation Epidemic on Twitter. Cureus 2020, 12, e7255. [Google Scholar] [CrossRef] [PubMed] [Green Version]
- Alshaabi, T.; Minot, J.R.; Arnold, M.V.; Adams, J.L.; Dewhurst, D.R.; Reagan, A.J.; Muhamad, R.; Danforth, C.M.; Dodds, P.S. How the world’s collective attention is being paid to a pandemic: COVID-19 related 1-gram time series for 24 languages on Twitter. arXiv 2020, arXiv:2003.12614. [Google Scholar] [CrossRef] [PubMed]
- Chen, E.; Lerman, K.; Ferrara, E. Tracking Social Media Discourse about the COVID-19 Pandemic: Development of a Public Coronavirus Twitter Data Set. JMIR Public Health Surveill. 2020, 6, e19273. [Google Scholar] [CrossRef] [PubMed]
- Yang, K.; Torres-Lugo, C.; Menczer, F. Prevalence of Low-Credibility Information on Twitter During the COVID-19 Outbreak. arXiv 2020, arXiv:2004.14484. [Google Scholar]
- Kabir, M.Y.; Madria, S. CoronaVis: A Real-time COVID-19 Tweets Data Analyzer and Data Repository. arXiv 2020, arXiv:2004.13932. [Google Scholar]
- Documenting the Now. Hydrator [Computer Software]. 2020. Available online: https://github.com/docnow/hydrator (accessed on 6 May 2022).
- Summers, E.; Hugo; Binkley, P.; Chudnov, D.; Ruest, N.; recrm; Chosak, A.; Littman, J.; Costa, S.; Milajevs, D.; et al. edsu/twarc: v0.8.2. 2016. Available online: https://doi.org/10.5281/zenodo.162183 (accessed on 6 May 2022).
- Poldi, F. TWINT-Twitter Intelligence Tool. Available online: https://github.com/twintproject/twint (accessed on 6 May 2022).
- Instaloader—A Tool to Download Metadata from Instagram. Available online: https://github.com/instaloader/instaloader (accessed on 6 May 2022).
- Zarei, K.; Farahbakhsh, R.; Crespi, N.; Tyson, G. A First Instagram Dataset on COVID-19. arXiv 2020, arXiv:2004.12226. [Google Scholar]
- Abuhmed, T.; El-Sappagh, S.; Alonso, J.M. Robust hybrid deep learning models for Alzheimer’s progression detection. Knowl.-Based Syst. 2021, 213, 106688. [Google Scholar] [CrossRef]
- Abuhamad, M.; Abuhmed, T.; Mohaisen, D.; Nyang, D. Large-Scale and Robust Code Authorship Identification with Deep Feature Learning. ACM Trans. Priv. Secur. 2021, 24, 1–35. [Google Scholar] [CrossRef]
- El-Rashidy, N.; El-Sappagh, S.; Abuhmed, T.; Abdelrazek, S.; El-Bakry, H.M. Intensive Care Unit Mortality Prediction: An Improved Patient-Specific Stacking Ensemble Model. IEEE Access 2020, 8, 133541–133564. [Google Scholar] [CrossRef]
- Abuhamad, M.; Abuhmed, T.; Mohaisen, D.; Nyang, D. AUToSen: Deep-Learning-Based Implicit Continuous Authentication Using Smartphone Sensors. IEEE Internet Things J. 2020, 7, 5008–5020. [Google Scholar] [CrossRef]
- Abuhamad, M.; Abuhmed, T.; Nyang, D.; Mohaisen, D. Multi-χ: Identifying Multiple Authors from Source Code Files. Proc. Priv. Enhancing Technol. 2020, 2020, 25–41. [Google Scholar] [CrossRef]
- Manning, C.D.; Bauer, J.; Finkel, J.; Bethard, S.J. The Stanford CoreNLP Natural Language Processing Toolkit. In Proceedings of the 52nd Annual Meeting of the Association for Computational Linguistics: System Demonstrations, Baltimore, MD, USA, 22–27 June 2014; pp. 55–60. [Google Scholar]
- Fischer, G.B. Recursive Deep Models for Semantic Compositionality Over a Sentiment Treebank. In Proceedings of the 2013 Conference on Empirical Methods in Natural Language Processing, Alicante, Spain, 20–22 October 2004; pp. 1631–1642. [Google Scholar] [CrossRef]
- Řehůřek, R.; Sojka, P. Software Framework for Topic Modelling with Large Corpora. In Proceedings of the LREC 2010 Workshop on New Challenges for NLP Frameworks, Valletta, Malta, 22 May 2010; pp. 45–50. [Google Scholar]
- MALLET: A Machine Learning for Language Toolkit. McCallum, Andrew Kachites. 2002. Available online: https://people.cs.umass.edu/~mccallum/mallet (accessed on 6 May 2022).
- World Health Organization. WHO Coronavirus Disease (COVID-19) Dashboard; World Health Organization: Geneva, Switzerland, 2020. [Google Scholar]
- About 30 Million Workers Are Collecting Jobless Benefits. The New York Times, 23 July 2020.
- Xu, R.H.; He, J.F.; Evans, M.R.; Peng, G.W.; Field, H.E.; Yu, D.W.; Lee, C.K.; Luo, H.M.; Lin, W.S.; Lin, P.; et al. Epidemiologic clues to SARS origin in China. Emerg. Infect. Dis. 2004, 10, 1030–1037. [Google Scholar] [CrossRef] [PubMed]
Figure 1.
The overall architecture of Stanford CoreNLP to find sentiment classes of Twitter and Instagram datasets.
Figure 1.
The overall architecture of Stanford CoreNLP to find sentiment classes of Twitter and Instagram datasets.

Figure 2.
Weekly and monthly sentiment analysis of Twitter (a) and Instagram (b) datasets based on five sentiment classes (very negative, negative, neutral, positive, and very positive). For weekly analysis (right side), spikes are highlighted with vertical black dashed lines, and trends are illustrated in the monthly analysis (left side) after merging the very positive and very negative to their corresponding classes.

Figure 3.
Plate notation of the latent Dirichlet allocation (LDA) method to discover topics discussed on both social networks.
Figure 3.
Plate notation of the latent Dirichlet allocation (LDA) method to discover topics discussed on both social networks.

Figure 4.
Topics generated for each sentiment type and the number of tweets belonging to each topic (Twitter).
Figure 4.
Topics generated for each sentiment type and the number of tweets belonging to each topic (Twitter).

Figure 5.
Topics generated for each sentiment type and the number of tweets belonging to each topic (Instagram).
Figure 5.
Topics generated for each sentiment type and the number of tweets belonging to each topic (Instagram).

Figure 6.
Countries that are mentioned in tweets.

Figure 7.
Countries that are mentioned in Instagram posts.

Figure 8.
Weekly and monthly sentiment analysis of the most discussed countries on Twitter based on five sentiment classes (very negative, negative, neutral, positive, and very positive). For the weekly analysis (right side), spikes are highlighted with vertical black dashed lines, and trends are illustrated in the monthly analysis (left side) after merging the very positive and very negative sentiments to their corresponding classes.


Figure 9.
Weekly and monthly sentiment analysis of the most discussed countries on Instagram based on five sentiment classes (very negative, negative, neutral, positive, and very positive). For the weekly analysis (right side), spikes are highlighted with vertical black dashed lines, and trends are illustrated in the monthly analysis (left side) after merging the very positive and very negative sentiments to their corresponding classes.


Figure 10.
Topics generated for each country and the number of tweets belonging to each topic (Twitter).
Figure 10.
Topics generated for each country and the number of tweets belonging to each topic (Twitter).

Figure 11.
Topics generated for each country and the number of posts belonging to each topic (Instagram).
Figure 11.
Topics generated for each country and the number of posts belonging to each topic (Instagram).

Figure 12.
Word2vec architecture for (a) bag of words (CBOW) and (b) skip-gram algorithms (W refers to a word).
Figure 12.
Word2vec architecture for (a) bag of words (CBOW) and (b) skip-gram algorithms (W refers to a word).

Figure 13.
(Twitter) Words that are related to the top countries. Black words represent words that remained unchanged between January and June. Orange words represent words that shifted towards the countries during the same period.
Figure 13.
(Twitter) Words that are related to the top countries. Black words represent words that remained unchanged between January and June. Orange words represent words that shifted towards the countries during the same period.

Figure 14.
(Instagram) Words that are related to the top countries. Black-colored words represent words that remained unchanged between January and March. Orange-colored words represent words that shifted towards the countries during the same period.
Figure 14.
(Instagram) Words that are related to the top countries. Black-colored words represent words that remained unchanged between January and March. Orange-colored words represent words that shifted towards the countries during the same period.

Figure 15.
Countries where users published posts about China, India, the USA, Italy, and the UK on Twitter.
Figure 15.
Countries where users published posts about China, India, the USA, Italy, and the UK on Twitter.

Figure 16.
Countries where users published posts about China, India, the USA, Italy, and Spain on Instagram.
Figure 16.
Countries where users published posts about China, India, the USA, Italy, and Spain on Instagram.


Table 1.
Comparison of the related papers based on the Twitter dataset and different analyses.
| Authors | Keywords | Feature Analysis | Geospatial | Topic Modeling | Sentiment | Locality Analysis | Country Analysis | Network Models | ||
|---|---|---|---|---|---|---|---|---|---|---|
| Tweet Count | Time Period | |||||||||
| Jahanbin et al. [18] | 364,080 | December 2019–February 2020 | X | |||||||
| Banda et al. [19] | 30,990,645 | January–April 2020 | X | |||||||
| Medford et al. [20] | 126,049 | January–January 2020 | X | X | X | X | ||||
| Singh et al. [21] | 2,792,513 | January–March 2020 | X | X | X | X | ||||
| Lopez et al. [22] | 6,468,526 | January–March 2020 | X | X | X | |||||
| Cinelli et al. [23] | 1,187,482 | January–February 2020 | X | X | ||||||
| Kouzy et al. [24] | 673 | February 2020 | X | X | ||||||
| Alshaabi et al. [25] | Unknown | March–March 2020 | X | X | ||||||
| Sharma et al. [17] | 30,800,000 | March–March 2020 | X | X | X | X | X | X | ||
| Chen et al. [26] | 8,919,411 | March–March 2020 | X | |||||||
| Schild et al. [14] | 222,212,841 | November 2019–March 2020 | X | X | X | X | ||||
| Yang et al. [27] | Unknown | March–March 2020 | X | X | ||||||
| Ordun et al. [15] | 23,830,322 | March–April 2020 | X | X | X | X | ||||
| Yasin-Kabir et al. [28] | 100,000,000 | March–April 2020 | X | X | X | X | ||||
| Ours | 131,083,839 | January–June 2020 | X | X | X | X | X | X | X | X |
Table 2.
Twitter dataset information about the tweet count and tweet length in terms of characters (average, minimum, and maximum).
Table 2.
Twitter dataset information about the tweet count and tweet length in terms of characters (average, minimum, and maximum).
| January | February | March | April | May | June | Overall Stats. | |
|---|---|---|---|---|---|---|---|
| Total Tweet Count | 8,893,215 | 20,029,797 | 31,085,147 | 28,680,224 | 4,421,008 | 37,974,448 | 131,083,839 |
| Unique Tweet Count | 2,842,466 | 3,946,405 | 13,160,649 | 15,331,109 | 4,222,937 | 8,883,869 | 48,387,435 |
| Tweet Length (average number of characters) | 133.9 | 134.6 | 142 | 150.8 | 161.8 | 136.5 | 141.3 |
| Tweet Length (minimum number of characters) | 4 | 2 | 3 | 3 | 3 | 2 | 2 |
| Tweet Length (maximum number of characters) | 1012 | 1013 | 1023 | 1021 | 1014 | 1007 | 1023 |
Table 3.
Instagram dataset’s information about the post count and post length in terms of characters (average, minimum, and maximum).
Table 3.
Instagram dataset’s information about the post count and post length in terms of characters (average, minimum, and maximum).
| January | February | March | Overall Stats. | |
|---|---|---|---|---|
| Total Post Count | 749 | 1530 | 1564 | 3843 |
| Post Length (average number of characters) | 392 | 372 | 402 | 388.1 |
| Post Length (minimum number of characters) | 4 | 2 | 2 | 2 |
| Post Length (maximum number of characters) | 2199 | 2376 | 2228 | 2376 |
Table 4.
Total number of topics of the spike periods per sentiment type and the general topics’ contribution per the generated topics.
Table 4.
Total number of topics of the spike periods per sentiment type and the general topics’ contribution per the generated topics.
| General Topics | ||||||
|---|---|---|---|---|---|---|
| Sentiment Types | Sentiment Types | |||||
| Negative | Neutral | Positive | Negative | Neutral | Positive | |
| Economy | 1 | 1 | 2 | 0 | 0 | 0 |
| Health | 4 | 2 | 1 | 2 | 1 | 1 |
| Social | 5 | 3 | 6 | 5 | 1 | 4 |
| Politics | 1 | 1 | 1 | 0 | 0 | 0 |
| Tourism | 1 | 1 | 0 | 1 | 0 | 0 |
| Fashion | 0 | 0 | 0 | 0 | 0 | 1 |
| Topics Count | 12 | 8 | 10 | 8 | 2 | 6 |
| Coherent Score | 0.4754 | 0.4132 | 0.4533 | 0.4810 | 0.5734 | 0.4175 |
Table 5.
Distribution of the most frequent words of the Twitter dataset (%).
| Months | Covid | Coronavirus | People | China | Pandemic | Virus | Lockdown | Case | Corona | Like |
|---|---|---|---|---|---|---|---|---|---|---|
| January | 0 | 8.20 | 4.12 | 20.00 | 0.63 | 9.06 | 0.42 | 8.87 | 1.12 | 3.54 |
| February | 1.60 | 14.30 | 9.90 | 42.89 | 2.35 | 17.52 | 0.59 | 10.80 | 9.22 | 11.52 |
| March | 28.56 | 37.16 | 28.55 | 18.78 | 16.42 | 27.35 | 10.61 | 23.20 | 27.21 | 27.95 |
| April | 38.21 | 25.89 | 20.74 | 8.31 | 23.45 | 14.94 | 21.00 | 22.48 | 12.33 | 19.10 |
| May | 8.89 | 4.95 | 11.78 | 3.63 | 17.52 | 9.33 | 26.16 | 8.15 | 12.05 | 10.99 |
| June | 22.72 | 9.50 | 24.90 | 39.63 | 39.63 | 21.80 | 41.23 | 26.50 | 38.07 | 26.89 |
Table 6.
Distribution of the most frequent words of the Instagram dataset (%).
| Months | Coronavirus | Covid | Love | Face | Follow | Quarantine | Stayhome | Time | Corona | Virus |
|---|---|---|---|---|---|---|---|---|---|---|
| January | 15.29 | 8.94 | 20.45 | 22.09 | 38.99 | 12.16 | 12.72 | 11.98 | 26.54 | 18.45 |
| February | 35.95 | 23.10 | 38.66 | 30.67 | 28.52 | 24.71 | 22.37 | 17.96 | 26.15 | 30.36 |
| March | 48.76 | 67.96 | 40.90 | 47.24 | 32.49 | 63.14 | 64.91 | 70.06 | 47.31 | 51.19 |
Publisher’s Note: MDPI stays neutral with regard to jurisdictional claims in published maps and institutional affiliations. |
© 2022 by the authors. Licensee MDPI, Basel, Switzerland. This article is an open access article distributed under the terms and conditions of the Creative Commons Attribution (CC BY) license (https://creativecommons.org/licenses/by/4.0/).
Share and Cite
MDPI and ACS Style
Abdukhamidov, E.; Juraev, F.; Abuhamad, M.; El-Sappagh, S.; AbuHmed, T. Sentiment Analysis of Users’ Reactions on Social Media during the Pandemic. Electronics 2022, 11, 1648. https://doi.org/10.3390/electronics11101648
AMA Style
Abdukhamidov E, Juraev F, Abuhamad M, El-Sappagh S, AbuHmed T. Sentiment Analysis of Users’ Reactions on Social Media during the Pandemic. Electronics. 2022; 11(10):1648. https://doi.org/10.3390/electronics11101648
Chicago/Turabian StyleAbdukhamidov, Eldor, Firuz Juraev, Mohammed Abuhamad, Shaker El-Sappagh, and Tamer AbuHmed. 2022. "Sentiment Analysis of Users’ Reactions on Social Media during the Pandemic" Electronics 11, no. 10: 1648. https://doi.org/10.3390/electronics11101648
Note that from the first issue of 2016, this journal uses article numbers instead of page numbers. See further details here.