
Geometric Simplifications of Natural Caves in Ray-Tracing-Based Propagation Modelling


1
Department of Communication Systems, Jožef Stefan Institute, SI-1000 Ljubljana, Slovenia
2
Camborne School of Mines, Cornwall Campus, University of Exeter, Exeter EX4 4PY, UK
*
Author to whom correspondence should be addressed.
Electronics 2021, 10(23), 2914; https://doi.org/10.3390/electronics10232914
Submission received: 15 October 2021
/
Revised: 19 November 2021
/
Accepted: 22 November 2021
/
Published: 25 November 2021
(This article belongs to the Special Issue Channel Measurements, Modelling and Simulations for Future Wireless Communication Systems)
Abstract
:Natural caves show some similarities to human-made tunnels, which have previously been the subject of radio-frequency propagation modelling using deterministic ray-tracing techniques. Since natural caves are non-uniform because of their inherent concavity and irregular limestone formations, detailed 3D models contain a large number of small facets, which can have a detrimental impact on the ray-tracing computational complexity as well as on the modelling accuracy. Here, we analyse the performance of ray tracing in repeatedly simplified 3D descriptions of two caves in the UK, i.e., Kingsdale Master Cave (KMC) Roof Tunnel and Skirwith Cave. The trade-off between the size of the reflection surface and the modelling accuracy is examined. Further, by reducing the number of facets, simulation time can be reduced significantly. Two simplification methods from computer graphics were applied: Vertex Clustering and Quadric Edge Collapse. We compare the ray-tracing results to the experimental measurements and to the channel modelling based on the modal theory. We show Edge Collapse to be better suited for the task than Vertex Clustering, with larger simplifications being possible before the passage becomes entirely blocked. The use of model simplification is predominantly justified by the computational time gains, with the acceptable simplified geometries roughly halving the execution time given the laser scanning resolution of 10 cm.
1. Introduction
Wireless communications in natural caves are required for search and rescue operations, commercial cave management, military reconnaissance, and other cave-related research. Natural caves differ from the human-made tunnels used in mining and transportation in several aspects, such as cross-section uniformity, dimensions, geology, sharpness of bends, complex junctions, as well as surface roughness.
Propagation modelling of radio signals in artificially made underground tunnels can be performed by both numerical methods and ray-tracing techniques, as well as by using waveguide-based models and other empirical models [1,2]. Due to the specifics of the human-made environment, the applicability of those radio propagation modelling approaches in natural caves is questionable because existing models cannot be used without adaptation. While solving Maxwell equations is computationally expensive [3], the approximation with the lossy waveguides is problematic since natural caves have more bends and curves compared to the artificial tunnels and the cross-section diameter is much smaller. Well-known empirical multi-slope models [4,5,6,7] developed for the human-made tunnels are relatively inaccurate without additional modifications and correction factors. On the other hand, with newly emerged handheld laser scanners capable of obtaining accurate 3D cave models [8], deterministic propagation modelling by ray-tracing techniques became feasible [9]. However, signal measurements in cave environments are still rarely reported as opposed to the measurements in human-made tunnels [10].
Research on wireless propagation in natural passages has received little attention so far. On the contrary, radio signal propagation in mine environments is extensively summarized in [11,12]. In [11], measurements at four frequencies for vertically, horizontally and cross-polarized signals in concrete tunnels and different mines passages are reported. In [12], a simplified two-stage approach devoted to mining practitioners is presented and compared with measurements at 2.4 and 5.8 GHz. In the first stage, the average attenuation rate is calculated by modal theory taking into account available environment characteristics and tuned to information about the likely differences predicted by the model.
Channel modelling in underground mines by ray tracing and the modal method is reported in [13] where good agreement is shown between measurements and simulations at three different frequencies. Further, the impact of the surface roughness is emphasized, which is expected to significantly influence the radio signal propagation in natural passages. The author continued the work on surface roughness in [14]. In [15], the behaviour of the radio waves on rough surfaces was analysed by the ray-tracing technique that combines the modified Fresnel reflection coefficient for random rough surfaces. The results can be a good starting point for cave environment investigations.
Based on the measurements, an empirical model in the UHF band was derived in five underground environments in [16]; however, the model is only suitable for regular galleries and not for a highly irregular environment of natural caves.
To the best of our knowledge, the first adaption of the existing approaches developed for the human-made tunnels to the underground cave passages is documented in Bedford et al. [17]. Although the adjusted method of modal analysis gives comparable results to the measurements, the approach shows a discrepancy when modelling propagation around bends that are close together. In [9], the influence of the environment simplifications have been studied to a limited extent using commercially available modelling software.
Since natural caves are a non-uniform environment, a 3D model contains large numbers of small facets, which impacts, together with the applied ray-tracing mechanisms, the computational complexity and the final accuracy. It must be noted that the ray-tracing techniques are applicable if the sizes of the reflection surfaces are large enough in terms of the signal wavelength since the radio waves have to be planar at the interaction point. According to [18], the size of the reflection surfaces has an impact on the accuracy of the radio channel model in the tunnel and cave environments. The optimal facet size depends on the cross-sectional dimensions and carrier frequency, and it is in the range between 3 up to 20. The number of reflection surfaces in scanned 3D models of cave passages is high when their size does not meet the above-mentioned presumptions. The only existing work on ray tracing in natural caves [9] pointed to the issues of model simplification and roughness handling. In addition, the authors state that ray tracing is the only technique suitable for more complex cave passages. However, classical ray tracing is incapable of accurately modelling propagation effects caused by curved surfaces, which can be observed in natural caves because of their inherent concavity and irregular limestone formations. The problem has drawn some attention from researchers with limited success. One way to approach curved surfaces is to revise the method to fit a particular shape, such as a cylinder of large passenger aircraft [19] or an arch-shaped tunnel [20]. Other proposals model the curvature as a series of flat surfaces [18]. In such a rather naive approach, too little energy is accounted for when using only a single reflection plane, whereas having too many reflection planes in series without proper analytical correction leads to the energy overestimate.
In this paper, the impact of different environment simplification approaches and, particularly, the impact of the reflection facet size on the ray-tracing outcome are studied. The trade-off between the size of the reflection surface and the modelling accuracy is examined. Three-dimensional models of two caves, i.e., Kingsdale Master Cave (KMC) Roof Tunnel and Skirwith Cave in the UK, are repeatedly simplified by two different algorithms from computer graphics. The computational time gain is the other important aspect of the study. Note that triangle, patch and facet are used interchangeably throughout the paper to describe the geometric primitive.
The remainder of the paper is organized as follows. In Section 2, we identify ray-tracing limits if the method is applied to irregular environments. The geometric descriptions of such environments are expected to become widely available with the proliferation of the advanced scanning equipment. In Section 3, we present computer graphics algorithms for model simplifications. Next, we describe physical properties of the caves, the measurement campaign and configuration of the ray-tracing tool in Section 4. We compare the performance of ray tracing on simplified models against the experimental measurements and modal theory in Section 5. Channel modelling accuracy, as well as computational time gains, is discussed, followed by the conclusion in Section 6.
2. Ray-Tracing Limits in Irregular Environments
The irregular environments of natural caves pose a significant threat to ray-tracing efficiency in terms of degraded accuracy and increased computational complexity. Ray tracing is accurate if electromagnetic propagation interacts with large, preferably smooth planar surfaces, for which Fresnel coefficients may be safely assumed. A typical brute force ray-tracing algorithm follows a large number of rays from the source in all directions [21]. The initial set of launched rays needs to be separated as uniformly as possible. In 3D, icosahedral grids are commonly used with a well-defined space distribution [22]. Using geometrical optics concepts in describing radio frequency propagation implies that the initial rays are an abstraction of a single wavefront spreading into space. Subsequent electromagnetic interactions with matter initiate new wavefronts, described by other sets of reflected, refracted, diffracted or scattered rays. The signal evaluation at any given observation point combines these wavefronts freely, in the same way as if they are being transmitted by multiple independent sources. Fresnel equations for electric and magnetic fields consider incident angle and electric field polarization while modelling reflection and refraction phenomena on the propagation media boundaries [23].
Modelling edge diffraction is preferably conducted using the geometrical theory of diffraction [24]. In practice, rays passing in close vicinity to a diffraction edge initiate a number of diffracted rays on the surfaces of Keller cones. The number of edges in irregular environments is so high that it quickly prevents any meticulous simulation of even first-order edge diffraction, which is why this propagation effect is typically ignored.
Finally, rays passing close to a reception point need to be detected. The major computational efforts are due to the intersection tests of rays with the scene primitives that are usually but not necessarily in the shape of triangles. The number of tests grows with the scene complexity and with the accuracy of its description. The number is further multiplied by the number of rays and the number of consequent interactions with matter. The problem of high processing demands can be alleviated to a certain degree by hardware accelerators and massive parallelization [25]. The speed of finding intersection points can be further boosted by employing appropriate data structures, such as a bounding volume hierarchy [26]. However, even a carefully optimized and coded ray-tracing algorithm will eventually hit the time barrier. By reducing the number of facets, as proposed in the following, the simulation time can be reduced significantly and, more importantly, Fresnel coefficients will be more accurate.
Next, the discrete nature of rays with no thickness shows a weakness in the aggregation step where nearby rays to the observation point need to be detected and differentiated. The concept of a reception sphere is usually needed to detect rays passing by the receivers, which poses another threat to the simulation accuracy in high-resolution geometries. The fact that angular defects cannot be distributed evenly for more than twelve rays in space leads to a double-counting phenomenon, i.e., the radius of a reception sphere cannot exclude all but one ray per wave front [27]. This either leads to significant signal errors or it requires the use of space-consuming and time-consuming wave front differentiation. The problem is further exaggerated if the uniform distribution of rays in space is affected by irregular surfaces, which calls for either improved double-counting suppression or larger primitives in the description of the simulation environment. Here, we consider the latter approach.
3. Environment Simplification
The geometrical descriptions of cave interiors that result from the precise laser scans need to be simplified to achieve the best ray-tracing accuracy. Effectively, we are adjusting the facet size to be closer to the size of the first Fresnel zone. Here, computer graphics offers some proven methods [28].
One possible classification of the simplification methods is based on the number of algorithmic passes, with a method being either single-pass or iterative. Single-pass methods can use vertex clustering, as proposed in [29]. In its simplified form, all vertices falling in an elementary 3D-grid cube are collapsed into a single vertex, which can be at the cube centre or at some more elaborately chosen location. The size of the elementary cube is an input parameter.
On the other hand, iterative simplification removes either a vertex or edge, one at the time. In the case of vertex removal, a triangulation of the missing mesh patch follows [30]. The process is governed by the mesh error function, the value of which is minimized on each step. On the other hand, the advantage of removing an edge by collapsing the end vertices is the absence of any new hole in the mesh. For this reason, the latter method is preferred in many mesh simplifications. A quadric error criterion is proposed to select the next edge in [31]. The quadric error metric provides information on how large the resulting optical error would be if the corresponding edge were to be collapsed. Further, it provides a hint on where the newly emerging vertex should be placed. The algorithm stops when the number of facets is reached or when the quadric error is above the specified value.
We used the open source tool MeshLab [32] for geometry simplifications tasks. Two methods suitable for given 3D descriptions were applied: (i) Cluster Decimation and (ii) Quadric Edge Collapse Decimation. The first is a single-pass clustering method that collapses vertices by creating a 3D grid envelope over the mesh and proceeds using newly introduced cells, as described above. The required input parameter is a simplification level given as a percentage. The second edge removal approach iterates until the requested reduction is achieved. Edges are placed in a priority queue based on the quadric error measure. The simplification level is configurable by several parameters, including the target number of faces, reduction percentage, boundary preserving weight, and whether a surface normal should be kept unchanged.
4. Simulation Setup and Measurement Campaign
The proposed geometric approximations in ray-tracing modelling were tested in two different cave passages located in the UK. The KMC Roof Tunnel has already been studied by a modal method in [17], whereas a similar analysis of the second highly irregular Skirwith Cave is available in [9]. The latter study also focused on the importance of the reflection surface sizes, with extensive measurements supporting the findings but without taking into account different approximation algorithms and gradual simplifications, i.e., only several alternatives were explored. Further, commercial ray-tracing software was used in the latter study but with limited insight into the channel modelling algorithm, which is crucial for a better explanation of the in-cave propagation phenomena. Here, we use in-house ray-tracing software [33] with complete control and understanding of the source code.
4.1. Caves Physical Properties
The KMC Roof Tunnel has an approximately 1.5 m high and 1.5 m wide rounded rectangular cross-section, with some water on the floor. It has two 45° bends at 8 and 21 m and a 90° bend at 27 m. The average surface roughness is estimated to be 10 mm. Skirwith Cave is 2.1 m high and 0.6 m wide on average. Its cross-sectional shape and size vary considerably, and it is slightly meandering. The surface roughness also significantly varies due to the calcite formations and is estimated at around 100 mm. Both caves are made of limestone with typical electrical conductivity of 2 mS/m and relative permittivity of 10.
The accurate geometric models of both caves in 3D were obtained by handheld laser scanner ZEB1 from GeoSLAM [8]. The process involved walking with the scanner through both passages, followed by the post-processing of the captured point cloud in order to obtain a set of triangular patches describing the surface.
4.2. Measurements
The measurements were taken at three standard frequencies for wireless digital communications, i.e., 1.2969, 2.3209, and 5.802 GHz. The transmitters were mounted on a tripod in the passage centre at the height of 1.1 m. They were equipped with vertically polarized omni-directional antennas and were transmitting a continuous wave beacon. A spectrum analyser with an omni-directional antenna in vertical polarisation was used as a receiver. The measurements were taken along the passage at a 1 m resolution. The receiving antenna was as close as possible to the cross-sectional centre at the height of 1.1 m. Due to the received signal fluctuation, the highest stable signal level was recorded at each location. Other transmitter properties for the selected frequencies are shown in Table 1.
4.3. Signal3D Ray Tracer
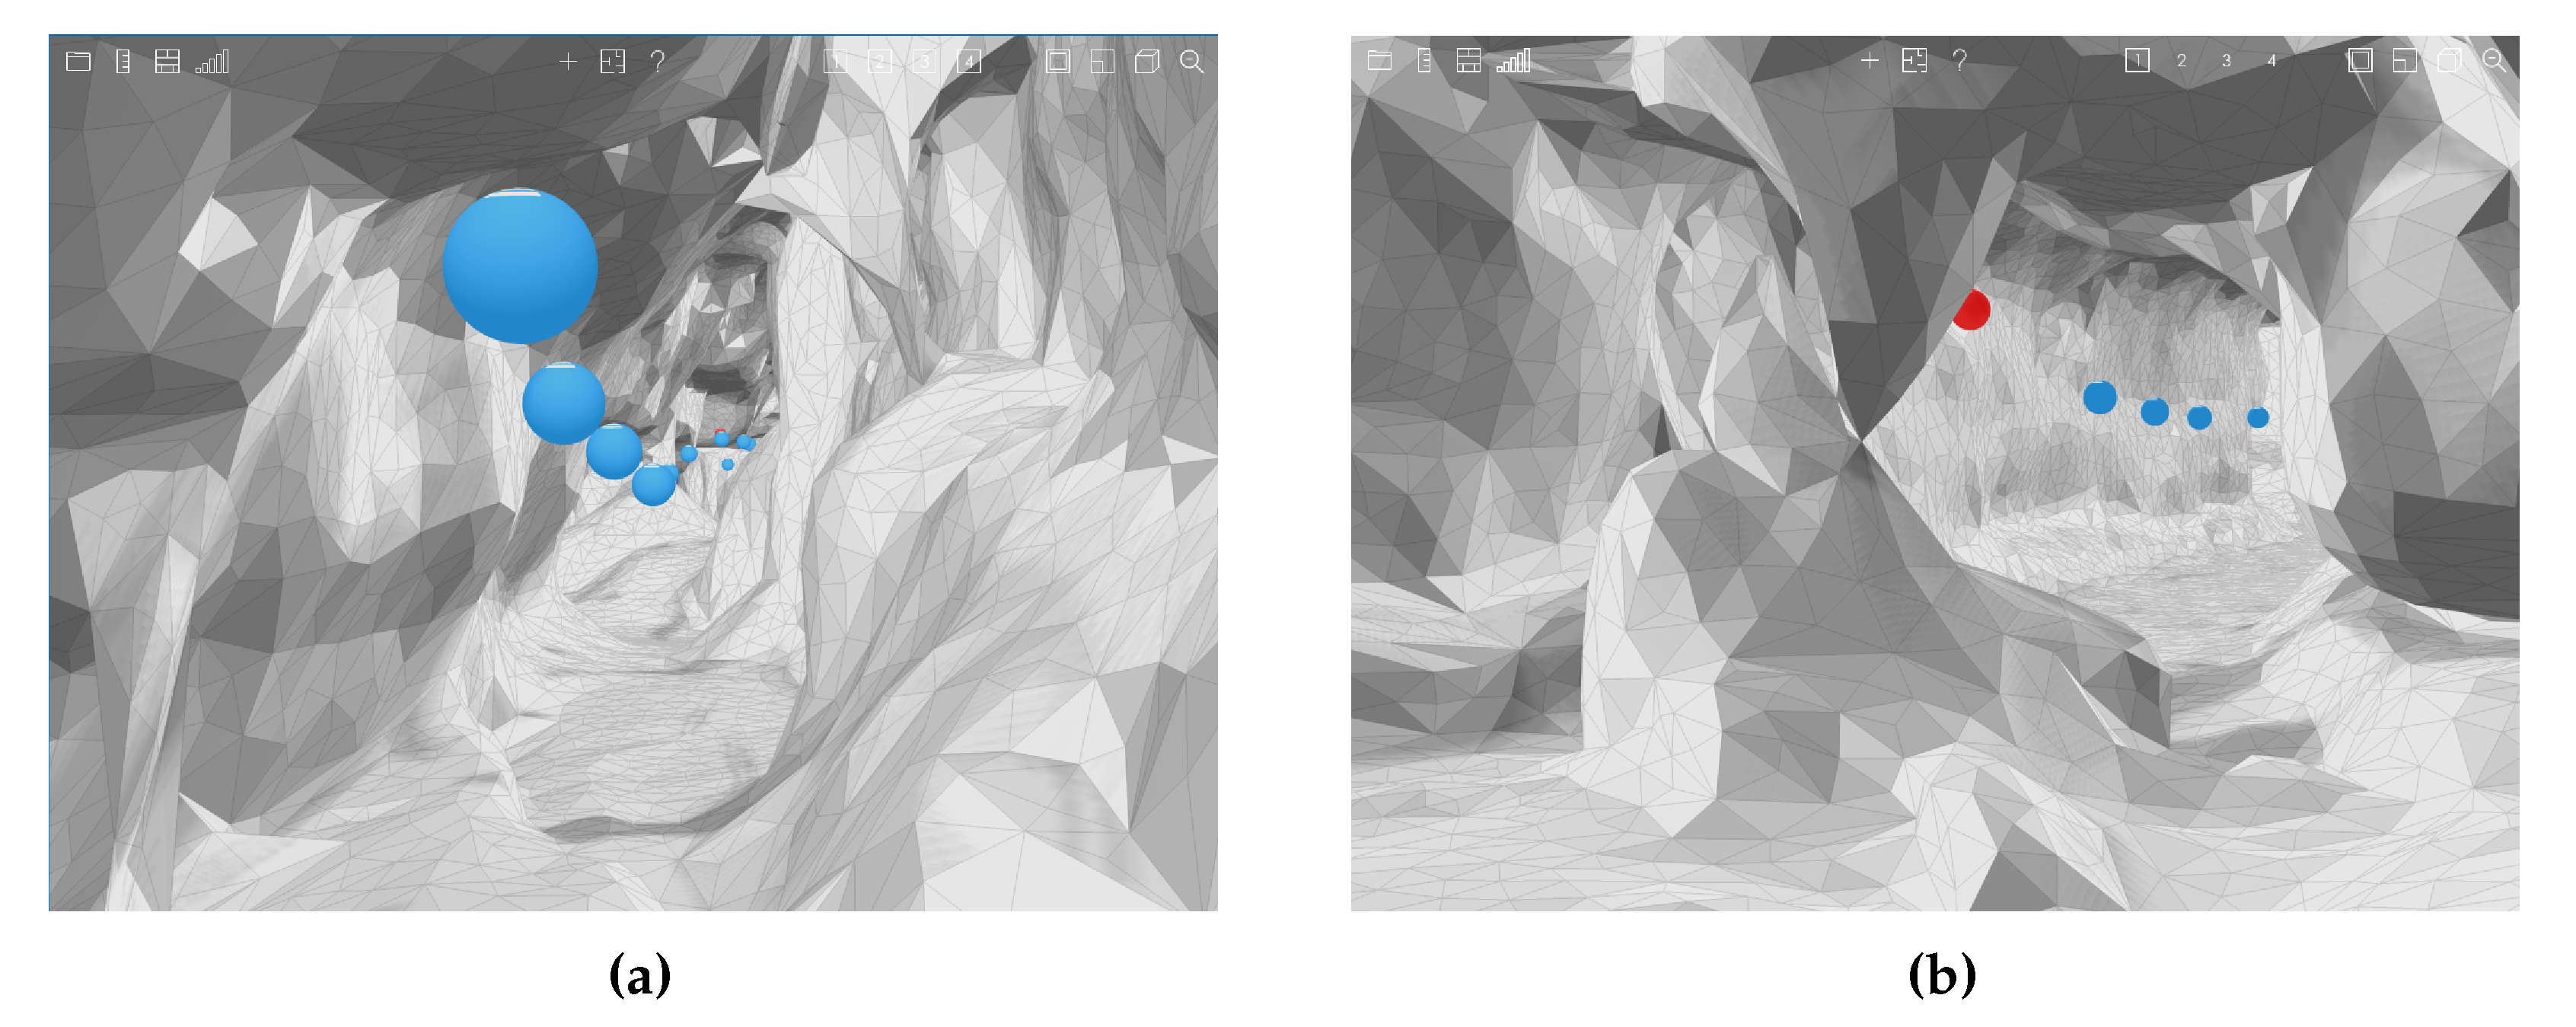
Signal3D, our radio frequency ray-tracing tool, has been extended with the concepts outlined in this paper. The front-end allows the visualisation of cave geometries and simulation parameters settings. In Figure 1, some screen snapshots of both caves used in the present study are shown. RTX is Signal3D’s ray-tracing back-end that runs on a dedicated GPU server. It features some specific properties not found in the commercial tools. For instance, RTX is configurable with either recursive or non-recursive icosahedral grids for ray launching. Further, it supports highly configurable Bloom filtering for a ray’s double counting avoidance [27]. RTX has a proven record of efficiency in several projects within the telecommunication industry. At its core is a highly optimized GPU-based ray tracer using the NVIDIA OptiX ray-tracing engine [26], which is adapted to radio frequency simulations. Scene objects are kept in a bounding volume hierarchy entirely on a GPU, with rays generated and traced through the scene in parallel threads. The tool was selected over the commercially available ray tracers because it is fully customizable at a source code level, which is experimentation-friendly.
4.4. Simulation Parameters
Line-of-sight and reflected rays were simulated. There were 30 reception points in the KMC Roof Tunnel and 41 in Skirwith Cave. Both the transmission and the reception were simulated assuming ideal vertically oriented dipole antennas. Multipath signal components were limited by simulation depth and by the individual path signal loss. The allowed was a ray-tracing depth of 30 consecutive reflections. Note that cave geometry has an unmanageable number of potential diffraction edges; thus, a diffraction phenomenon was not accounted for. On the other hand, signal transmission through thick layers of limestone is negligible; therefore, the passing of rays through the material was also disabled. Up to 150 dB signal loss per multipath component was allowed in both scenarios before a ray was terminated. The number of launched rays was 671,088,642, which amounts to the maximum angular distance between neighbouring rays of approximately radians. Template icosahedral grids used in ray generation with a matching number of points are recursive grids at the refinement level of 13. The criterion in a selection of the above number of rays was the maximum reception sphere radius of 10 cm for the theoretically longest ray path, given the scene dimensions and the allowed number of interactions. Actual reception sphere radii for most of the simulated paths are significantly smaller. For example, given the maximum angular distance, the reception sphere radius for rays travelling 100 m is only 0.93 cm. Therefore, an efficient double counting prevention needs to be present. Our tool implements space-efficient probabilistic Bloom filters configured for a false positive rate of 0.0001 [27].
5. Results and Discussion
In the following, the performance of ray tracing on the simplified geometric descriptions of caves is analyzed. First, we present the reference computations using the originally scanned detailed geometry and compare the results to the experimental measurements and to the channel modelling presented in [17], where the modal theory was applied in the same setup. Standard deviation of the difference between the modelled path loss, either using the ray tracer or modal theory, and the measured values is used as the primary evaluation metric. Further, the reduction in computation time as a consequence of simplifications was also monitored.
Here, we must stress that modal analysis, like ray tracing, has not been designed for caves because it relies on the uniform cross-sectional dimensions and curvature radii of waveguides. The adaptation of the modal theory for human-made tunnels as over-sized lossy waveguides with tuned attenuation to account for geometric imperfections is rather common [34,35], whereas applying it to the highly irregular cave environment has been attempted only recently [9].
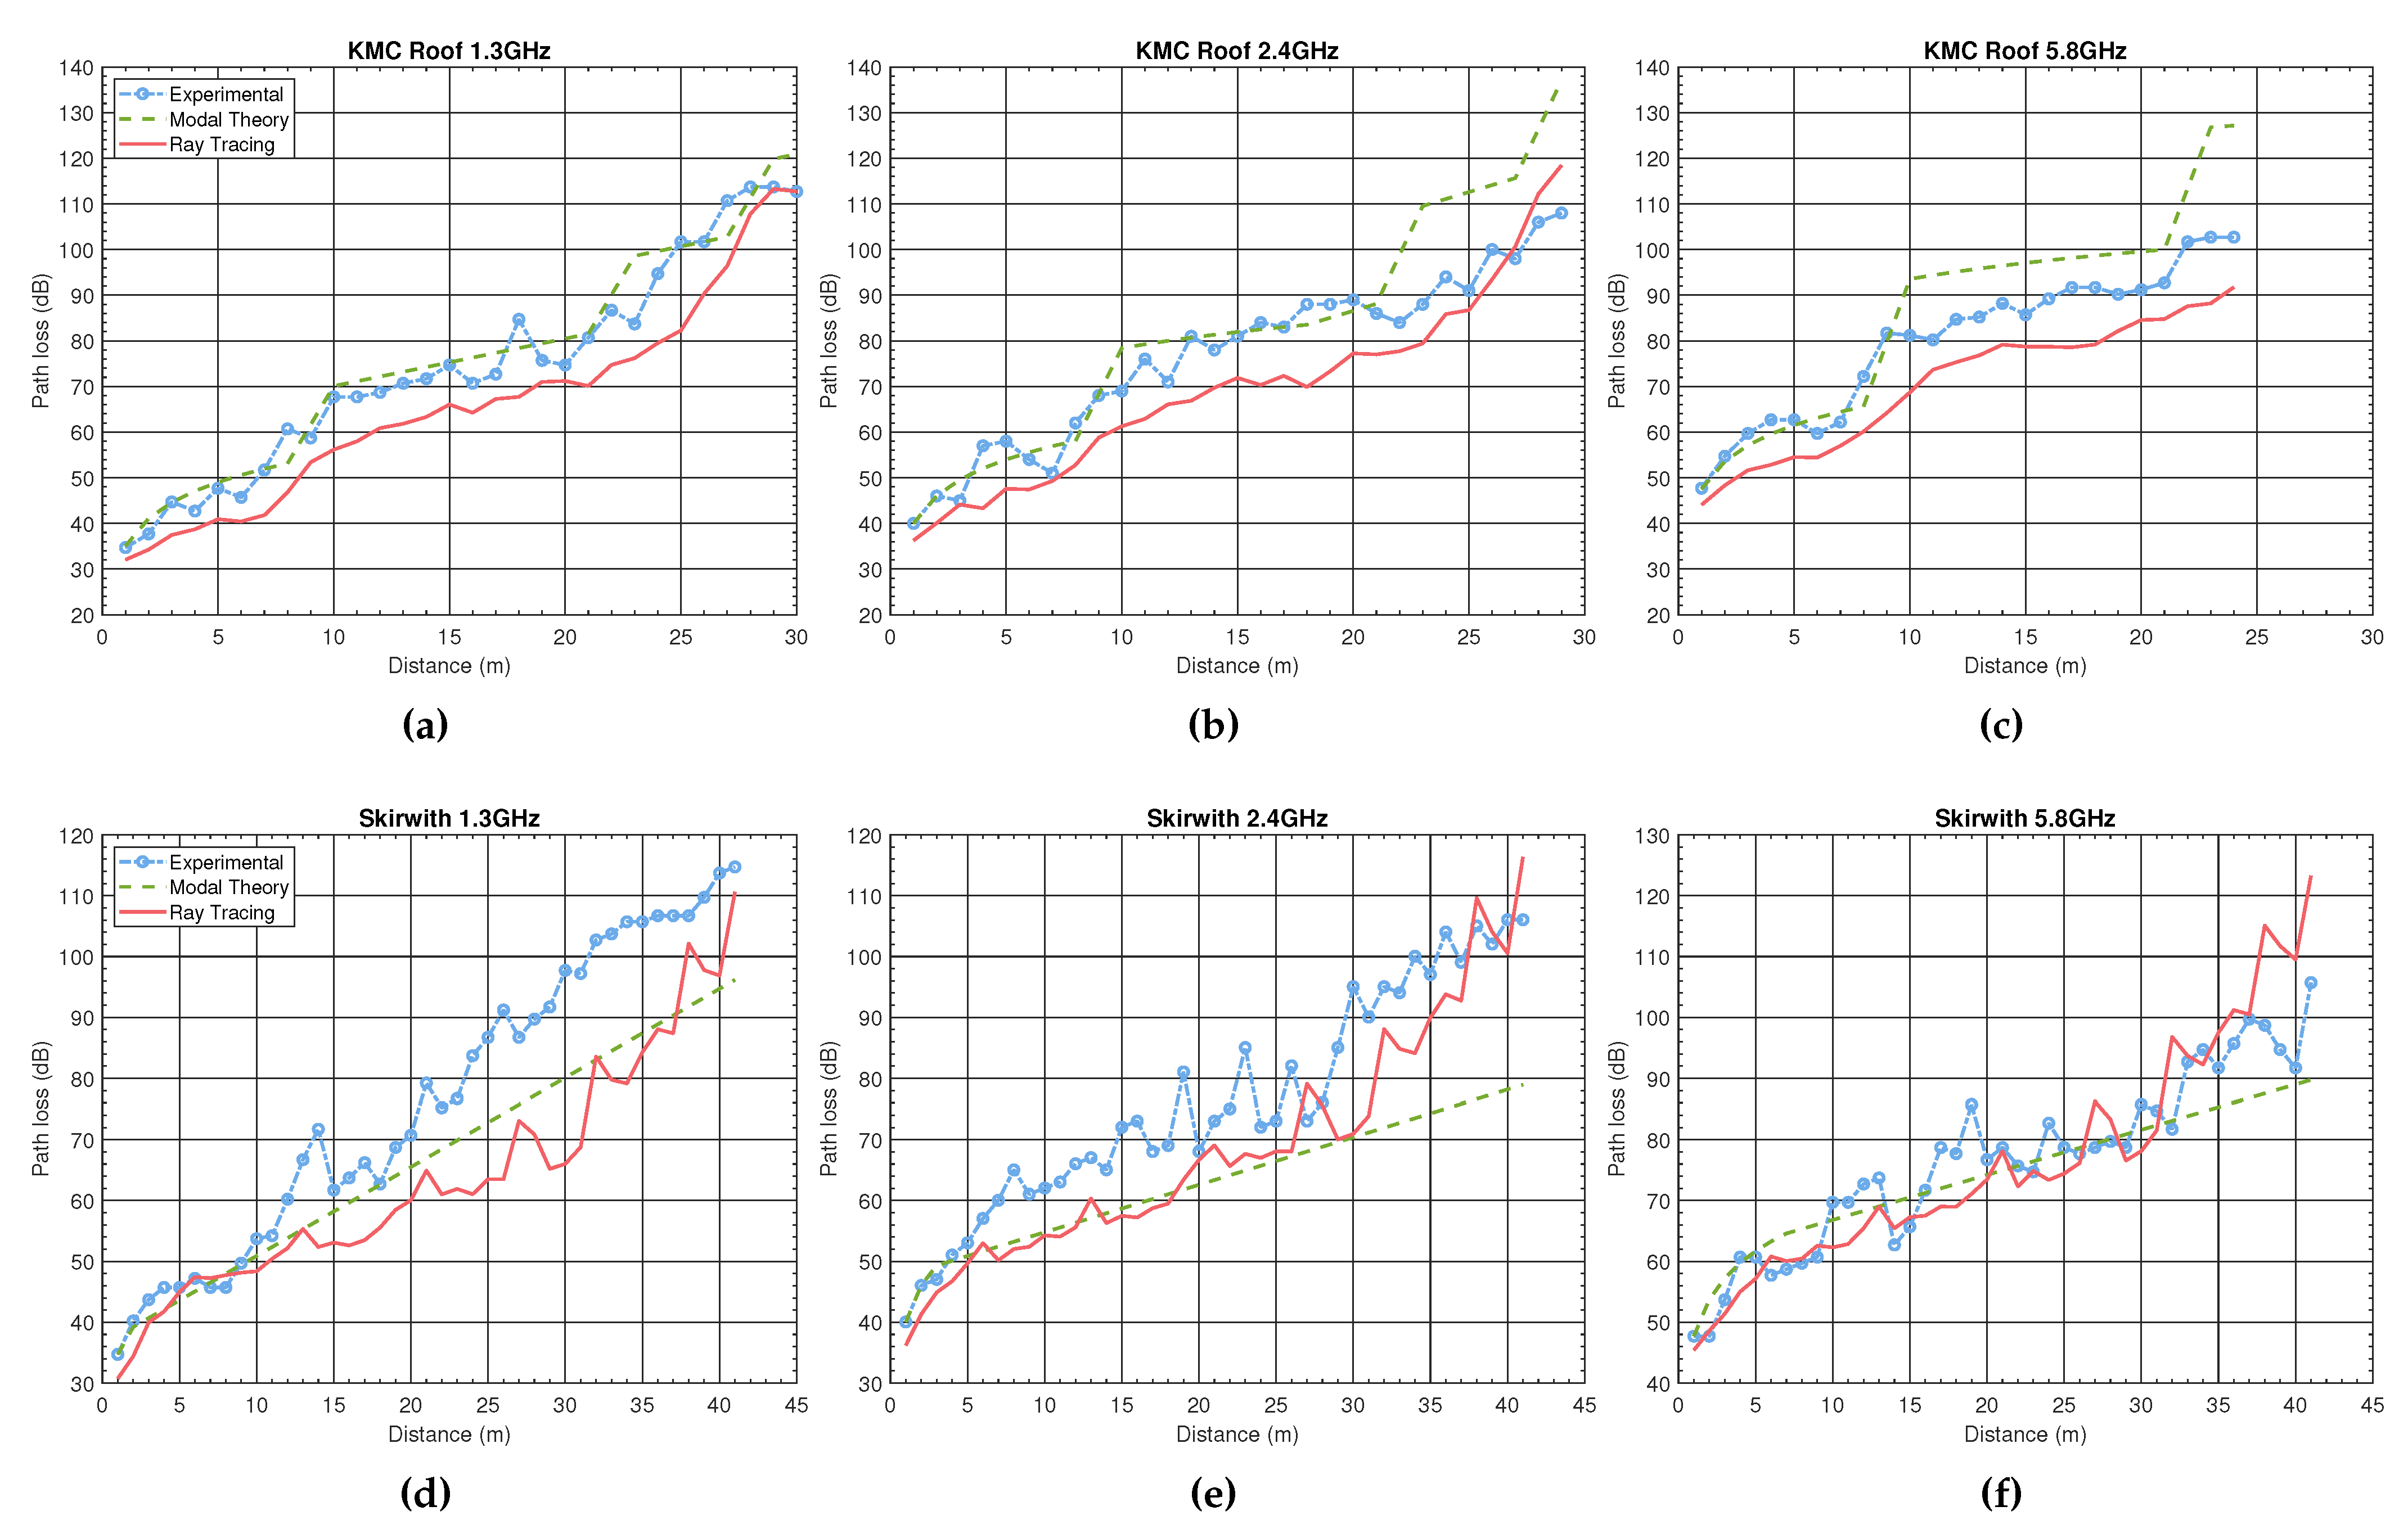
The path losses for both caves at the three selected frequencies are shown in Figure 2. The ray-tracing curves roughly follow variations of the measurements while being underestimated by several dB, i.e., overestimated in terms of the received power. As expected, modal analysis is smoother with abrupt changes only at points with a significant parameter change.
Too strong signals from the ray-tracing simulations can be attributed to several factors. First, using excessively small patches invalidates the fundamental ray-tracing assumption of the planar reflected waves. Next, because each patch is considered as a separate reflection surface, even elaborate double counting fails to eliminate double accumulation from the neighbouring patches. Further, the power level shift could simply occur due to the mismatched antenna gains between the simulations and field trials, which is the main reason why we evaluate the ray-tracing performance by the mean-independent standard deviation of the error, defined as where N is the number of measurements, is the error between the measured value and the predicted (simulated) value, both expressed in dB, , and is the mean value of the errors given by According to [18,36], the mean-independent standard deviation of the error is between 6 dB and 20 dB while modelling radio propagation in road tunnels. In this respect, we can assume channel models with the standard deviation error below 6 dB as acceptable. The results are summarised in Table 2. Simulations of the KMC Roof Tunnel show better correlation with the measurements, which is particularly noticeable at 1.2 GHz and 5.8 GHz. Better modelling of the KMC Roof Tunnel with respect to Skirwith Cave can be explained by the less irregular surface of the former. The modal analysis of the KMC Roof Tunnel shows larger deviations. On the other hand, the comparison between the two methods in Skirwith Cave has no clear winner. The modal theory is not working well for caves with series of bends close to each other or where the passage section changes abruptly, which is the case in the second cave. The reason is believed to be in the waveguide mode conversions, as explained in [9].
5.1. Accuracy of Simplified Models
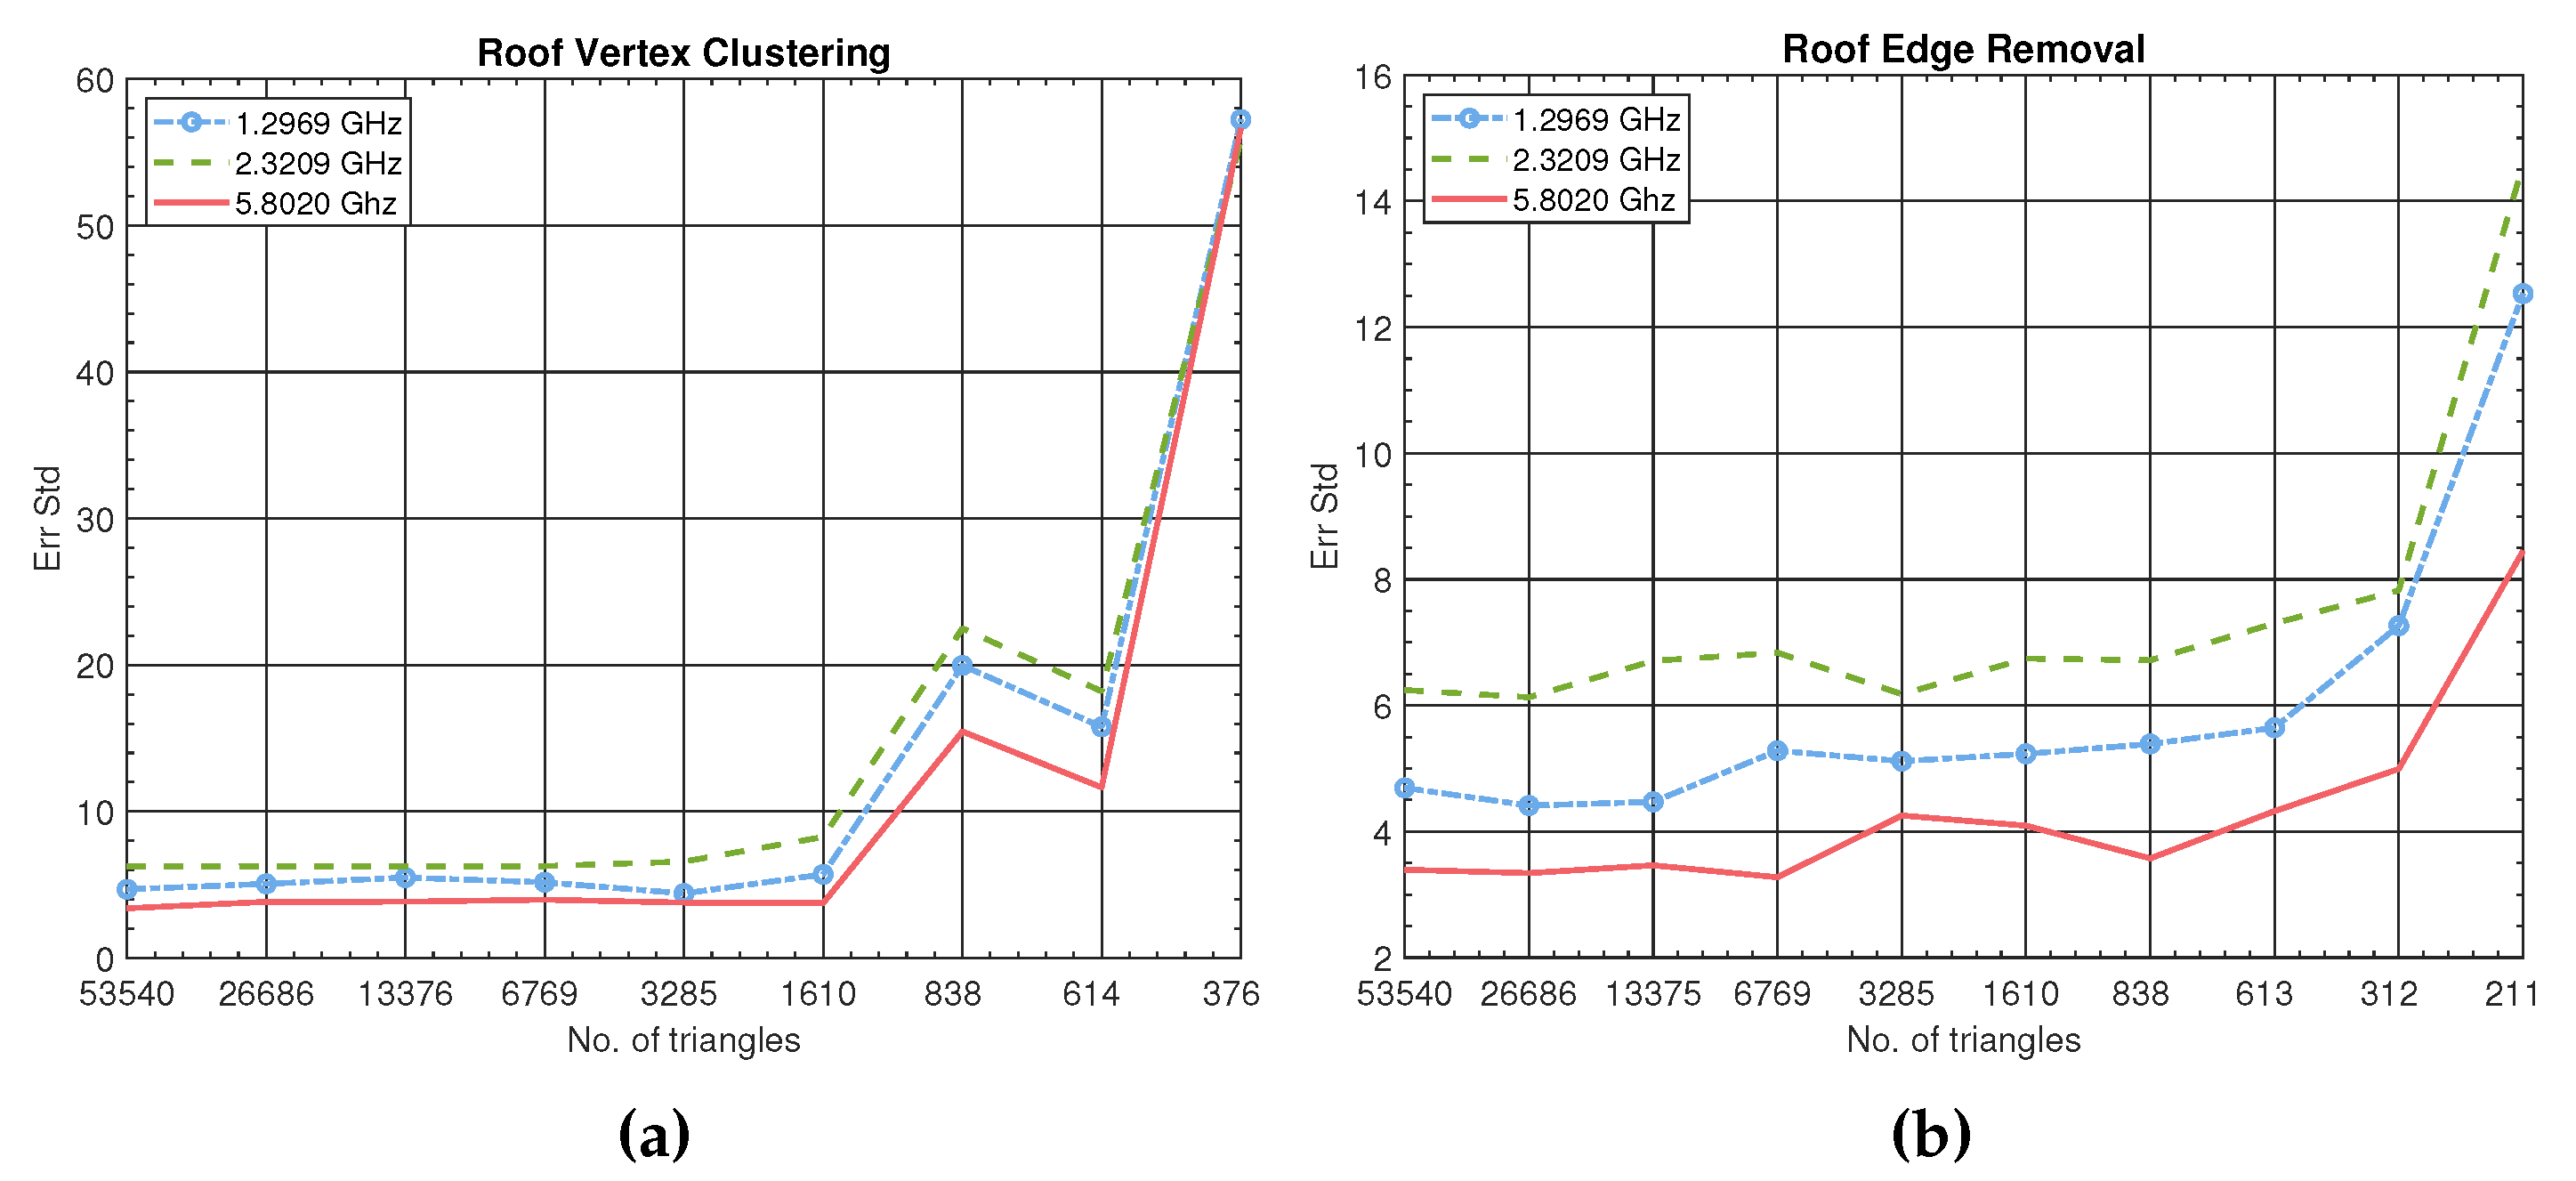
Channel modelling accuracy is studied next for the simplified geometric descriptions, as listed in Table 3. The simplifications took place up to the point when geometries had become physically impassable, with impassable geometries not included in the table. Instead of the path loss curves, a single standard deviation metric, which was introduced earlier, is computed per each simulation run. Figure 3 shows the accuracy of channel modelling in the KMC Roof Tunnel for both simplification algorithms, i.e., vertex clustering and edge removal. The results are summarized in Table 4. There is no significant change in accuracy unless the cave geometry is oversimplified. Note that channel modelling is fairly precise already in the original KMC Roof Tunnel geometry because the cross-section of this particular cave is close to some human-made tunnels, for which ray tracing is known to perform well. The accuracy drastically deteriorates for the last three simplifications, suggesting that there is a lower bound on the acceptable triangle sizes even if geometry provides free passage. The vertex clustering has a minor advantage over the edge removal for comparable geometry sizes, i.e., the number of triangles. However, the edge removal has the ability of larger simplifications before the passage becomes entirely blocked. Even though the triangle sizes are larger, the accuracy is still acceptable, e.g., the grid with 312 facets and 0.86 m2 average triangle size performs equally well as the grid of 1610 facets and 0.16 m2 average triangle size of the vertex clustering simplification.
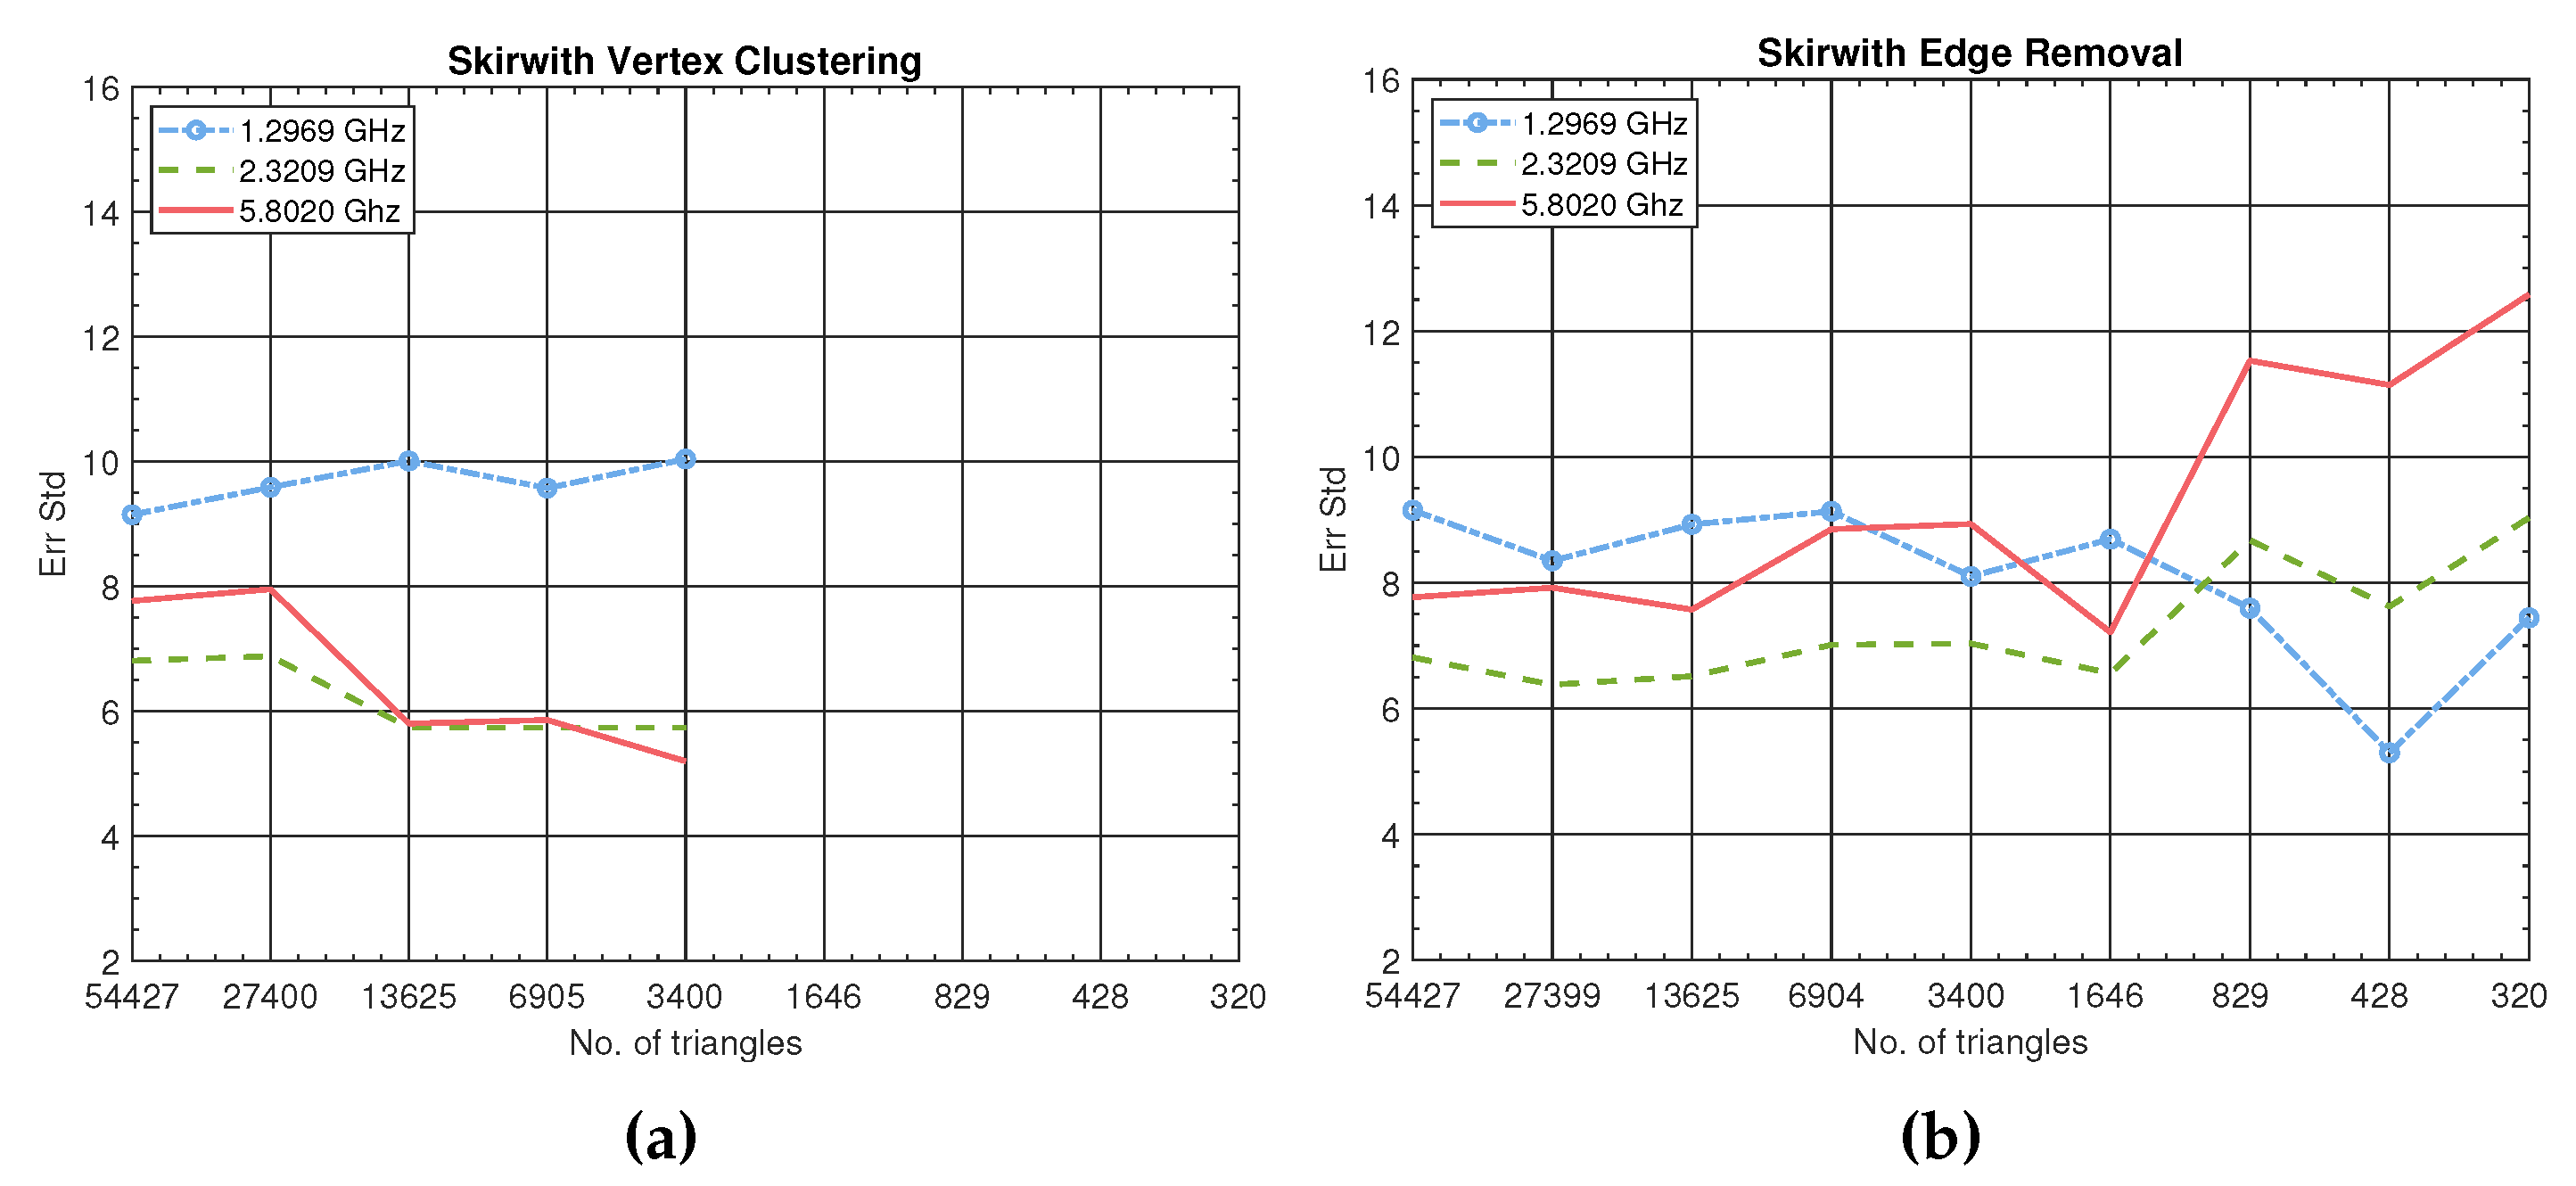
Skirwith Cave has a smaller and highly irregular cross-section compared to the KMC Roof Tunnel with the height exceeding the width considerably. The accuracy results are presented in Figure 4 and reviewed in Table 5. The vertex clustering simplifications for the number of triangles less than 3400 produce impassable cave environments; therefore, the presented curves in the left-hand graph stops early. The results show some improvements in the smaller geometrical models, indicating that narrow underground passages can benefit from the simplification. The models obtained by vertex clustering are more accurate at 2.4 and 5.8 GHz. The opposite holds at 1.3 GHz, for which edge removal produces better models. Nevertheless, the edge removal allows for at least 4-times smaller models without significant accuracy penalties.
5.2. Computational Time Gains
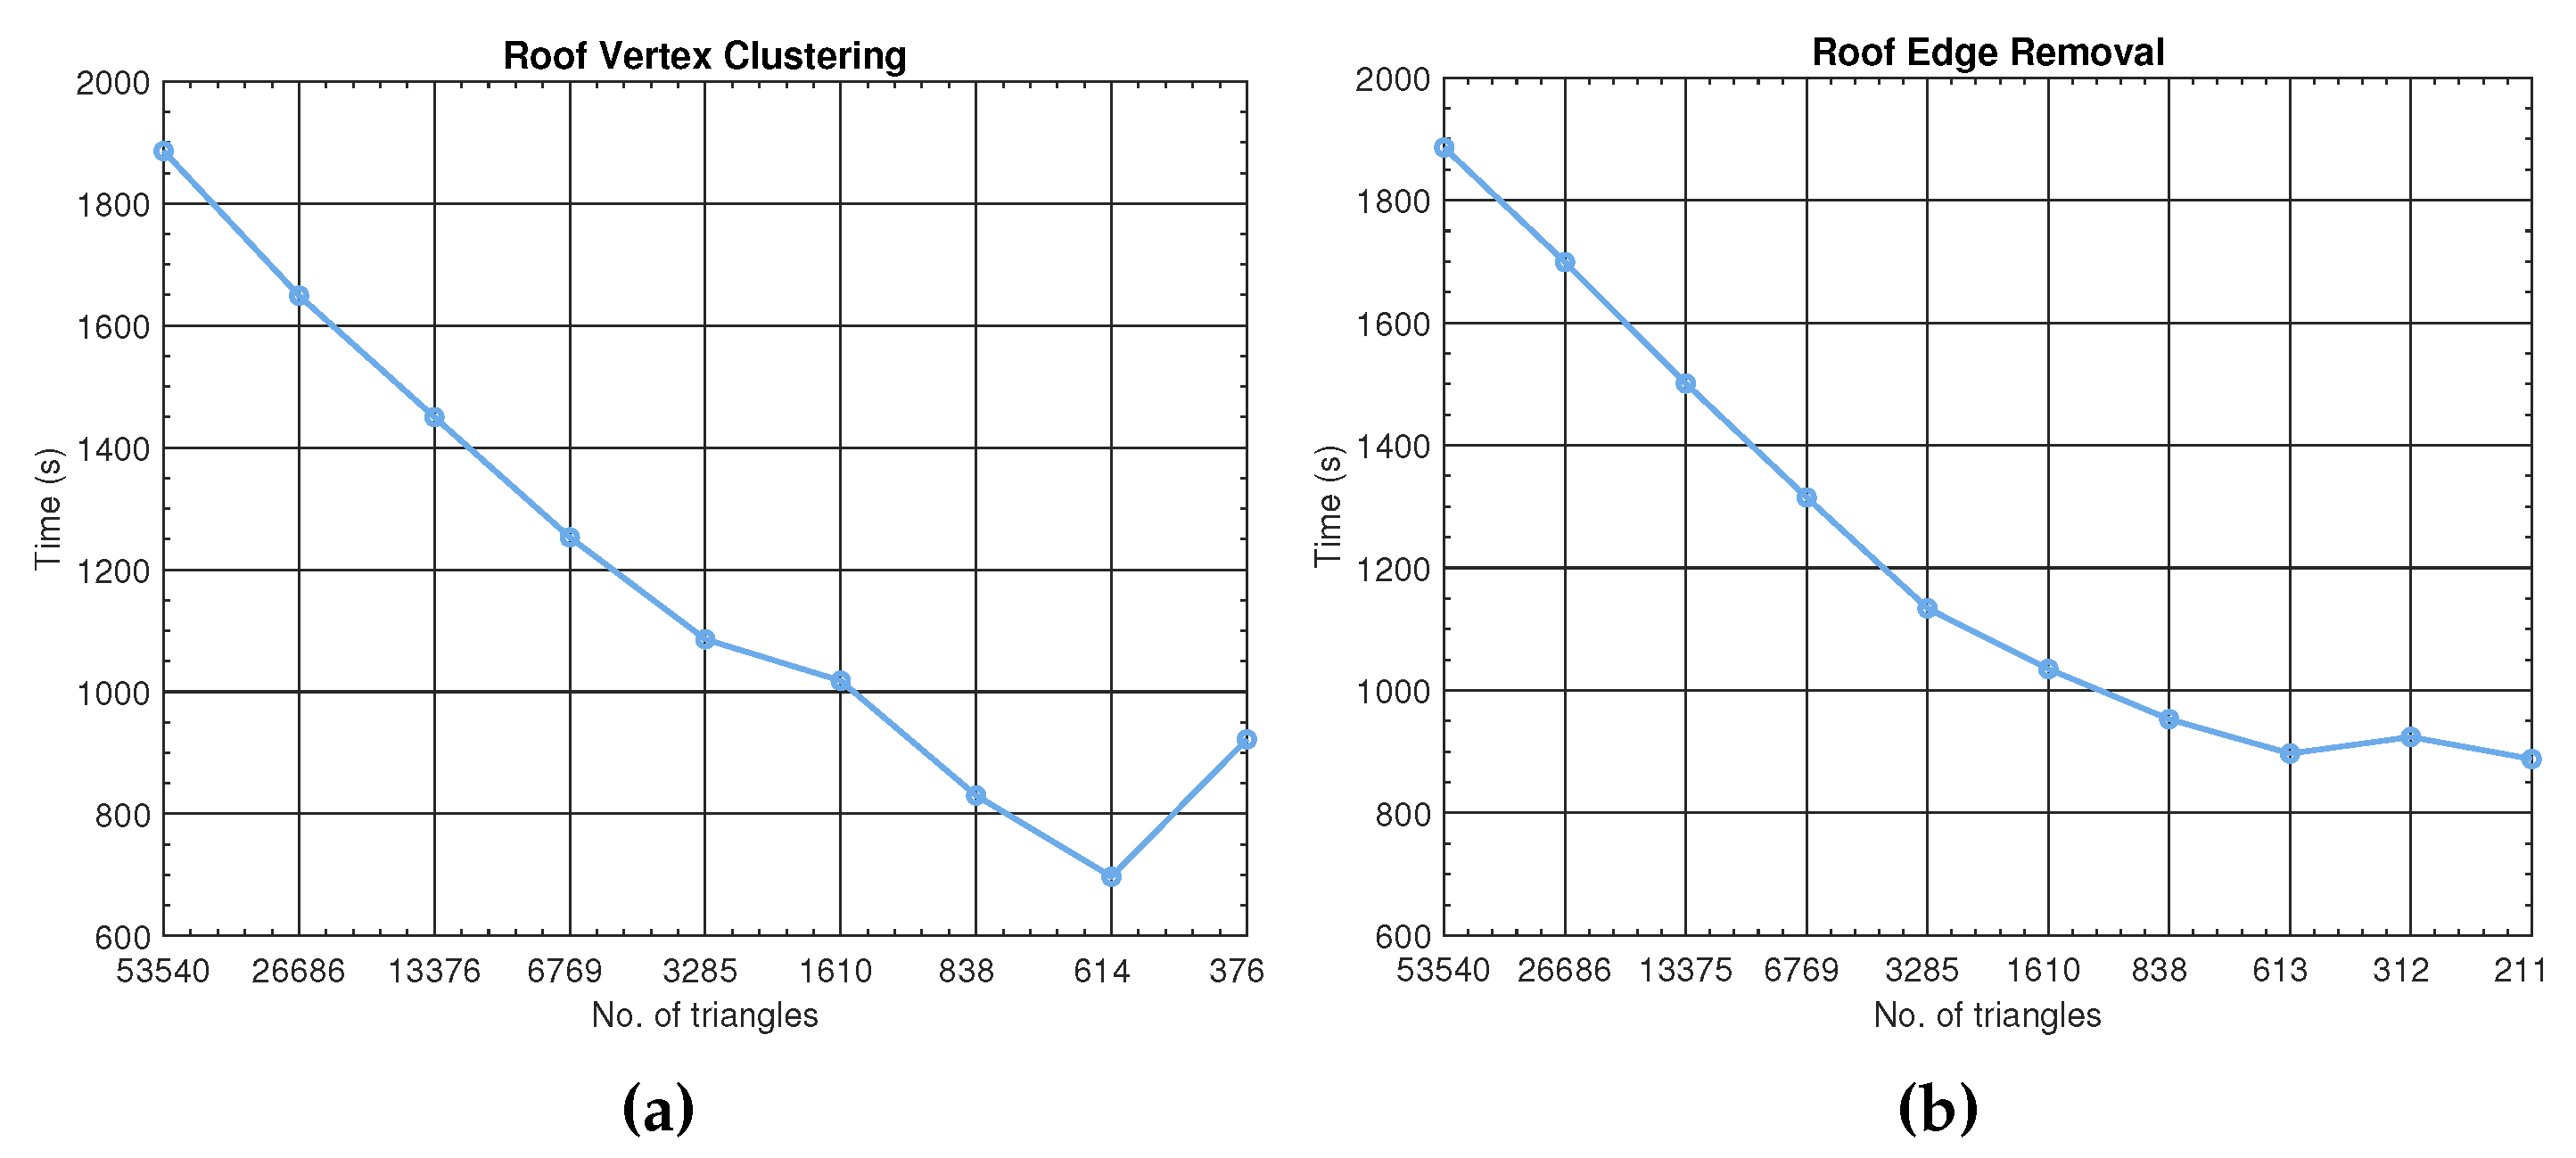
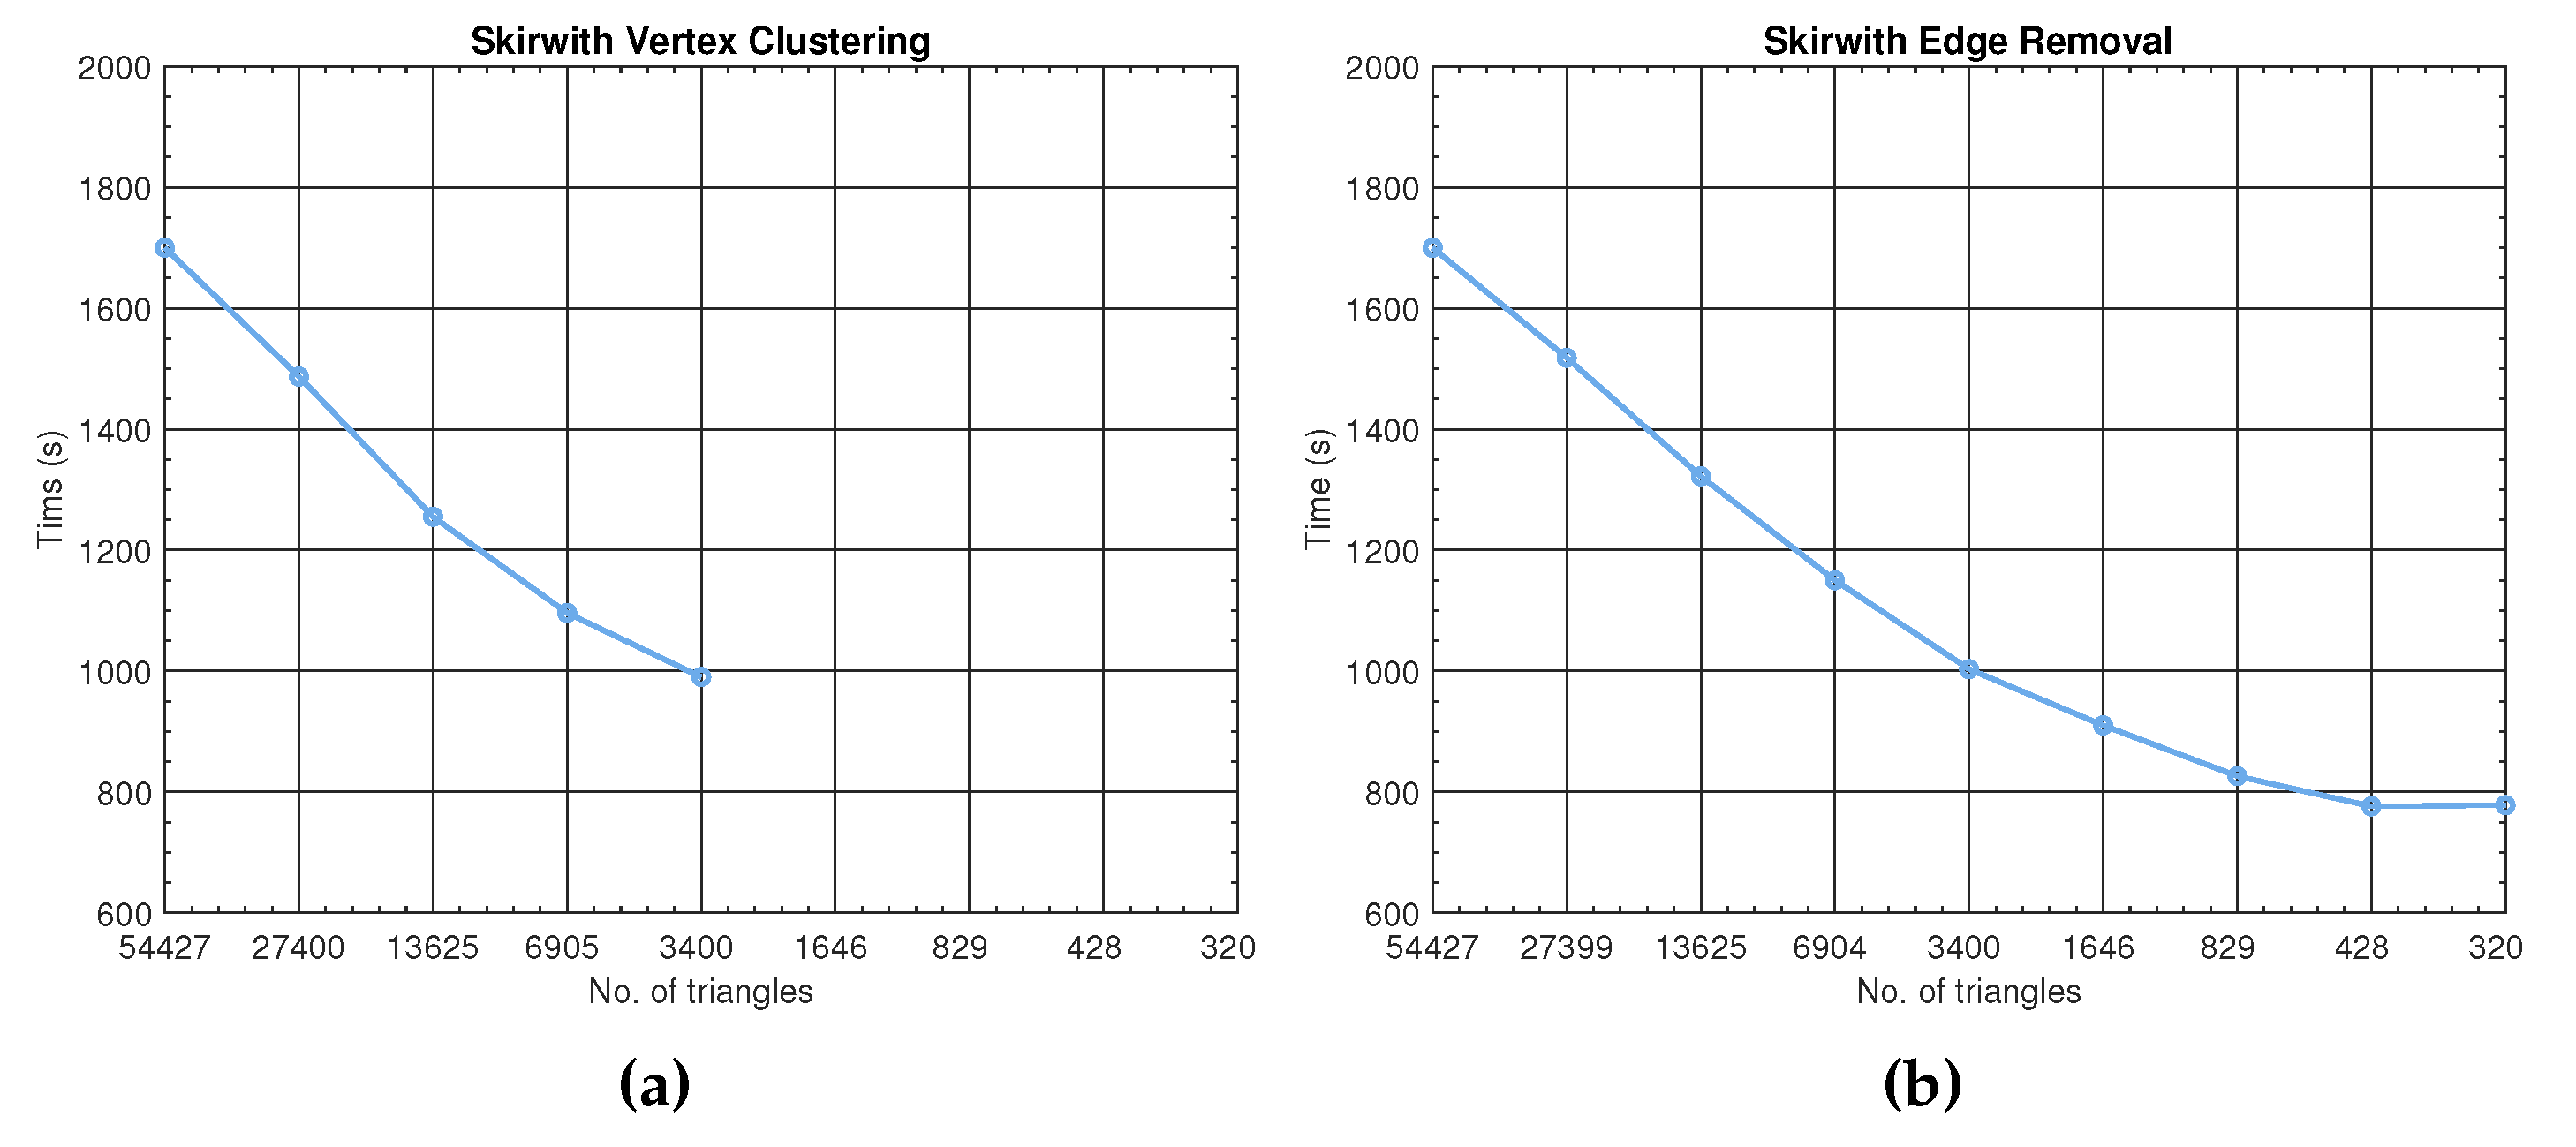
We have shown that benefits in terms of accuracy are small and mostly expected for narrow irregular underground passages. The use of model simplification is predominantly justified by computational time gains. Even though our ray tracer uses highly optimized dedicated code based on the latest solutions in the field of computer graphics, Figure 5 and Figure 6 show considerable reductions in simulation time.
The RTX, ray-tracing module of Signal3D, was being run on the Intel 64 processor architecture, i.e., Intel Xeon W3565 at 3.2 GHz, on a system with 12 GB memory and a 64-bit Windows 7 operating system. The presented simulation times are primarily determined by the provided GPU computing capabilities, in our case NVIDIA GeForce GTX 780 with 2304 stream processors at 941 MHz and 3 GB on-board memory. The ray-tracing program flow closely follows the ray-tracing pipeline of the OptiX Execution Model presented in [26].
Still, acceptable simplifications require roughly 50% less execution time than needed in the originally scanned models. In particular, the KMC Roof Tunnel execution time dropped by 46% at 1610 facets and by 52% at 613 facets when using vertex clustering and edge removal, respectively. It must be noted that the increase in computational time at 376 facets is due to to the large simplifications where the orientation of the surfaces can cause additional signal reflections as obstacles along the passage grow. Similar speed-up is observed for the Skirwith Cave simulation times, with recorded improvements of 42% at 6905 facets and 54% at 428 facets for the respective algorithms. When both simplification algorithms are compared to each other, the edge removal due to larger simplifications offers 12 and 29% faster execution times than vertex clustering. The difference is calculated at the lowest acceptable simplification bounds, i.e., the edge removal simplification of the KMC Roof Tunnel takes 897 s as opposed to the 1018 s needed for the vertex clustering simplification, whereas even larger improvement is observed modelling Skirwith Cave with 1096 s being reduced to 776 s.
6. Conclusions
This paper studied geometrical simplifications of two natural cave descriptions for channel modelling purposes. We have shown that the choice of simplification algorithm influences the level of acceptable simplification. In both cases, the edge removal simplification had some advantage over the vertex clustering algorithms. The larger tunnel-like cave shows minimal accuracy changes up to the point when the cave becomes impassable, whereas the narrower and less-uniform cave shows some accuracy improvements, at least for the frequencies of 2.4 GHz and above. Note, however, that some local minima are hard to explain without in-depth analysis of the accumulated rays. The major benefit of the proposed approach is the decrease in modelling time, which is roughly halved given the available scanning resolution. Due to larger simplifications, the edge removal algorithm has expectedly better performance. Without measurements to decide on the exact simplification level, the rule of thumb for the edge removal simplification, derived from the presented results, would be to generate a model with four times the number of patches present at the simplification level for which the cave becomes entirely blocked.
The diffraction phenomenon on the convex edges was not taken into account in the ray-tracing channel modelling, which may lead to some discrepancies between the measured and simulated results. Since there are no convex edges in the regular caves without sharp bends, such as KMC, the simulation results largely agree with the measurements. Nevertheless, in caves with sharp bends and high variation in cross-sectional dimension, the number of significant diffraction edges may be high, which would require tracing an unmanageable number of diffracted rays on the surfaces of Keller cones and excessive computation times. We are planning to address this problem by developing the approach for selecting the most significant convex edges to be considered in the simulation model.
Author Contributions
Conceptualization, A.H., R.N. and T.J.; methodology, R.N., A.H. and T.J.; software, R.N. and T.J.; validation, R.N., A.H. and T.J.; formal analysis, R.N., A.H. and T.J.; investigation, A.H., R.N. and T.J.; resources, A.H., R.N., M.D.B. and T.J.; data curation, M.D.B., A.H. and R.N.; writing—original draft preparation, R.N., A.H. and T.J.; writing—review and editing, M.D.B.; visualization, R.N.; supervision, T.J.; project administration, A.H.; funding acquisition, T.J. All authors have read and agreed to the published version of the manuscript.
Funding
This work was supported by the Slovenian Research Agency under grants J2-3048, P2-0016 and J2-2507.
Conflicts of Interest
The authors declare no conflict of interest. The funders had no role in the design of the study; in the collection, analyses, or interpretation of data; in the writing of the manuscript; or in the decision to publish the results.
References
- Hrovat, A.; Kandus, G.; Javornik, T. A survey of radio propagation modeling for tunnels. IEEE Commun. Surveys Tuts. 2014, 16, 658–669. [Google Scholar] [CrossRef]
- Gerasimov, J.; Balal, N.; Liokumovitch, E.; Richter, Y.; Gerasimov, M.; Bamani, E.; Pinhasi, G.A.; Pinhasi, Y. Scaled Modeling and Measurement for Studying Radio Wave Propagation in Tunnels. Electronics 2021, 10, 53. [Google Scholar] [CrossRef]
- Huang, Y.; Boyle, K. Antennas: From Theory to Practice; Wiley: Chichester, UK, 2008. [Google Scholar]
- Molina-Garcia-Pardo, J.M.; Lienard, M.; Degauque, P. Propagation in Tunnels: Experimental Investigations and Channel Modeling in a Wide Frequency Band for MIMO Applications. EURASIP J. Wirel. Commun. Netw. 2009, 2009, 9. [Google Scholar] [CrossRef] [Green Version]
- Hrovat, A.; Kandus, G.; Javornik, T. Four-slope channel model for path loss prediction in tunnels at 400 MHz. IET Microwaves Antennas Propag. 2010, 4, 571–582. [Google Scholar] [CrossRef]
- Klemenschits, T.; Bonek, E. Radio coverage of road tunnels at 900 and 1800 MHz by discrete antennas. In Proceedings of the 5th IEEE International Symposium on Personal, Indoor and Mobile Radio Communications, Wireless Networks—Catching the Mobile Future, Hague, The Netherlands, 18–23 September 1994; Volume 2, pp. 411–415. [Google Scholar] [CrossRef]
- Zhang, Y. Novel model for propagation loss prediction in tunnels. IEEE Trans. Veh. Technol. 2003, 52, 1308–1314. [Google Scholar] [CrossRef]
- Zlot, R.; Bosse, M. Three-dimensional mobile mapping of caves. J. Cave Karst Stud. 2014, 76, 191–206. [Google Scholar] [CrossRef]
- Bedford, M.D.; Hrovat, A.; Kennedy, G.; Javornik, T.; Foster, P. Modeling Microwave Propagation in Natural Caves Using LiDAR and Ray Tracing. IEEE Trans. Antennas Propag. 2020, 68, 3878–3888. [Google Scholar] [CrossRef]
- Al-Saman, A.; Cheffena, M.; Elijah, O.; Al-Gumaei, Y.A.; Abdul Rahim, S.K.; Al-Hadhrami, T. Survey of Millimeter-Wave Propagation Measurements and Models in Indoor Environments. Electronics 2021, 10, 1653. [Google Scholar] [CrossRef]
- Zhou, C.; Plass, T.; Jacksha, R.; Waynert, J.A. RF Propagation in Mines and Tunnels: Extensive measurements for vertically, horizontally, and cross-polarized signals in mines and tunnels. IEEE Trans. Antennas Propag. 2015, 57, 88–102. [Google Scholar] [CrossRef]
- Bedford, M.D.; Kennedy, G.A.; Foster, P.J. Radio transmission characteristics in tunnel environments. Min. Technol. 2017, 126, 77–87. [Google Scholar] [CrossRef]
- Zhou, C.; Jacksha, R. Modeling and measurement of wireless channels for underground mines. In Proceedings of the IEEE International Symposium on Antennas and Propagation (APSURSI), Fajardo, Puerto Rico, 26 June–1 July 2016; pp. 1253–1254. [Google Scholar] [CrossRef] [Green Version]
- Zhou, C. Ray Tracing and Modal Methods for Modeling Radio Propagation in Tunnels With Rough Walls. IEEE Trans. Antennas Propag. 2017, 65, 2624–2634. [Google Scholar] [CrossRef] [PubMed] [Green Version]
- Soo, Q.P.; Lim, S.Y.; Gin Lim, D.W. Investigation of rough surfaces for propagation modeling in caves. In Proceedings of the IEEE International Symposium on Antennas and Propagation USNC/URSI National Radio Science Meeting, Boston, MA, USA, 8–13 July 2018; pp. 555–556. [Google Scholar] [CrossRef]
- Rak, M.; Pechac, P. UHF Propagation in Caves and Subterranean Galleries. IEEE Trans. Antennas Propag. 2007, 55, 1134–1138. [Google Scholar] [CrossRef]
- Bedford, M.D.; Kennedy, G.A. Modeling Microwave Propagation in Natural Caves Passages. IEEE Trans. Antennas Propag. 2014, 62, 6463–6471. [Google Scholar] [CrossRef]
- Masson, E.; Combeau, P.; Berbineau, M.; Vauzelle, R.; Pousset, Y. Radio wave propagation in arched cross section tunnels simulations and measurements. J. Commun. 2009, 4, 276–283. [Google Scholar] [CrossRef]
- Futatsumori, S.; Morioka, K.; Kohmura, A.; Yonemoto, N.; Hikage, T.; Yahagi, K.; Shirafune, M.; Yamamoto, M.; Nojima, T.; Narahashi, S. Aircraft electromagnetic field estimation for wireless avionics intra-communication band using large-scale FDTD analysis — Field estimation of A320 class passenger aircraft at 4 GHz band. In Proceedings of the International Applied Computational Electromagnetics Society Symposium—Italy (ACES), Firenze, Italy, 26–30 March 2017; pp. 1–2. [Google Scholar] [CrossRef]
- Masson, E.; Cocheril, Y.; Combeau, P.; Aveneau, L.; Berbineau, M.; Vauzelle, R.; Fayt, E. Radio wave propagation in curved rectangular tunnels at 5.8 GHz for metro applications. In Proceedings of the 11th International Conference on ITS Telecommunications, St. Petersburg, Russia, 23–25 August 2011; pp. 81–85. [Google Scholar] [CrossRef]
- Fuschini, F.; Vitucci, E.M.; Barbiroli, M.; Falciasecca, G.; Degli-Esposti, V. Ray tracing propagation modeling for future small-cell and indoor applications: A review of current techniques. Radio Sci. 2015, 50, 469–485. [Google Scholar] [CrossRef] [Green Version]
- Durgin, G.; Patwari, N.; Rappaport, T. An advanced 3D ray launching method for wireless propagation prediction. In Proceedings of the IEEE 47th Vehicular Technology Conference, Phoenix, AZ, USA, 4–7 May 1997; Technology in Motion. Volume 2, pp. 785–789. [Google Scholar] [CrossRef]
- Saunders, S.; Aragón-Zavala, A. Antennas and Propagation for Wireless Communication Systems, 2nd ed.; Wiley: Hoboken, NJ, USA, 2007. [Google Scholar]
- Keller, J.B. Geometrical Theory of Diffraction. J. Opt. Soc. Am. 1962, 52, 116–130. [Google Scholar] [CrossRef]
- Tao, Y.; Lin, H.; Bao, H. GPU-Based Shooting and Bouncing Ray Method for Fast RCS Prediction. IEEE Trans. Antennas Propag. 2010, 58, 494–502. [Google Scholar] [CrossRef]
- Parker, S.G.; Bigler, J.; Dietrich, A.; Friedrich, H.; Hoberock, J.; Luebke, D.; McAllister, D.; McGuire, M.; Morley, K.; Robison, A.; et al. OptiX: A General Purpose Ray Tracing Engine. ACM Trans. Graph. 2010, 29. [Google Scholar] [CrossRef]
- Novak, R. Bloom filter for double-counting avoidance in radio frequency ray tracing. IEEE Trans. Antennas Propag. 2019, 67, 2176–2190. [Google Scholar] [CrossRef]
- Luebke, D. A developer’s survey of polygonal simplification algorithms. IEEE Comput. Graph. Appl. 2001, 21, 24–35. [Google Scholar] [CrossRef]
- Rossignac, J.; Borrel, P. Multi-resolution 3D approximations for rendering complex scenes. In Modeling in Computer Graphics; Falcidieno, B., Kunii, T.L., Eds.; Springer: Berlin/Heidelberg, Germany, 1993; pp. 455–465. [Google Scholar]
- Yirci, M. Polygonal Mesh Simplification and Regular Remeshing. Master’s Thesis, Department of Electrical and Electronics Engineering, Middle East Technical University, Ankara, Turkey, 2008. [Google Scholar]
- Garland, M.; Heckbert, P.S. Surface Simplification Using Quadric Error Metrics. In Proceedings of the 24th Annual Conference on Computer Graphics and Interactive Techniques, Los Angeles, CA, USA, 3–8 August 1997; ACM Press/Addison-Wesley Publishing Co.: New York, NY, USA, 1997. SIGGRAPH ’97. pp. 209–216. [Google Scholar] [CrossRef] [Green Version]
- Cignoni, P.; Callieri, M.; Corsini, M.; Dellepiane, M.; Ganovelli, F.; Ranzuglia, G. MeshLab: An Open-Source Mesh Processing Tool. In Eurographics Italian Chapter Conference; Scarano, V., Chiara, R.D., Erra, U., Eds.; The Eurographics Association: Salerno, Italy, 2–4 July 2008; pp. 129–136. [Google Scholar] [CrossRef]
- Signal3D. Available online: http://e6.is.si/tools/signal3d/ (accessed on 14 September 2021).
- Dudley, D.G.; Lienard, M.; Mahmoud, S.F.; Degauque, P. Wireless propagation in tunnels. IEEE Trans. Antennas Propag. 2007, 49, 11–26. [Google Scholar] [CrossRef]
- Molina-Garcia-Pardo, J.M.; Lienard, M.; Degauque, P.; Dudley, D.G.; Juan-Llacer, L. Interpretation of MIMO Channel Characteristics in Rectangular Tunnels From Modal Theory. IEEE Trans. Veh. Technol. 2008, 57, 1974–1979. [Google Scholar] [CrossRef]
- Wang, T.-S.; Yang, C.-F. Simulations and Measurements of Wave Propagations in Curved Road Tunnels for Signals From GSM Base Stations. IEEE Trans. Antennas Propag. 2006, 54, 2577–2584. [Google Scholar] [CrossRef]
Figure 1.
Signal3D screen snapshots of (a) Skirwith Cave and (b) the KMC Roof Tunnel; both caves are located in the UK.
Figure 1.
Signal3D screen snapshots of (a) Skirwith Cave and (b) the KMC Roof Tunnel; both caves are located in the UK.

Figure 2.
Measured vs. modelled path loss for the two caves at the three selected frequencies; ray tracing and modal theory path loss is compared against the measured values. Modal theory results shown here were reported in [9].
Figure 2.
Measured vs. modelled path loss for the two caves at the three selected frequencies; ray tracing and modal theory path loss is compared against the measured values. Modal theory results shown here were reported in [9].

Figure 3.
The accuracy of ray tracing is evaluated against the measurements in a number of simplified geometrical descriptions of the KMC Roof Tunnel using (a) vertex clustering and (b) edge removal simplifications.
Figure 3.
The accuracy of ray tracing is evaluated against the measurements in a number of simplified geometrical descriptions of the KMC Roof Tunnel using (a) vertex clustering and (b) edge removal simplifications.

Figure 4.
The accuracy of ray tracing is evaluated against the measurements in a number of simplified geometrical descriptions of Skirwith Cave using (a) vertex clustering and (b) edge removal simplifications. The missing values in the case of vertex clustering correspond to impassable geometries.
Figure 4.
The accuracy of ray tracing is evaluated against the measurements in a number of simplified geometrical descriptions of Skirwith Cave using (a) vertex clustering and (b) edge removal simplifications. The missing values in the case of vertex clustering correspond to impassable geometries.

Figure 5.
Reduction in ray-tracing simulation time in the KMC Roof Tunnel with (a) vertex clustering and (b) edge removal simplifications; the reduction is practically independent of transmission frequency.
Figure 5.
Reduction in ray-tracing simulation time in the KMC Roof Tunnel with (a) vertex clustering and (b) edge removal simplifications; the reduction is practically independent of transmission frequency.

Figure 6.
The reduction in simulation time of the simplified Skirwith Cave geometries in case of (a) vertex clustering is stopped early as the cave becomes impassable, whereas the simulation time of the simplified models of Skirwith Cave using (b) the edge removal algorithm can be halved.
Figure 6.
The reduction in simulation time of the simplified Skirwith Cave geometries in case of (a) vertex clustering is stopped early as the cave becomes impassable, whereas the simulation time of the simplified models of Skirwith Cave using (b) the edge removal algorithm can be halved.


Table 1.
Transmitter properties.
| Frequency | Tx Power | Antenna Gain | Antenna Length |
|---|---|---|---|
| (GHz) | (dBm) | (dBi) | (mm) |
| 1.2969 | 29 | 5.5 | 340 |
| 2.3209 | 30 | 9 | 625 |
| 5.8020 | 22 | 11 | 700 |
Table 2.
Standard deviations of the difference between modelled and measured values.
| Frequency (GHz) | (KMC Roof) | (Skirwith) | ||
|---|---|---|---|---|
| Modal | Ray | Modal | Ray | |
| 1.2969 | 4.54 | 4.69 | 7.11 | 9.15 |
| 2.3209 | 9.52 | 6.24 | 9.02 | 6.81 |
| 5.8020 | 7.89 | 3.40 | 5.74 | 7.77 |
1 Values reported in [9].
Table 3.
3D model geometric approximations.
| Cave | Simplification Algorithm | No. of Triangles | Avg. Triangle Size (cm2) | Simp. VLevel (%) |
|---|---|---|---|---|
| KMC Roof | None | 53,540 | 53 | 0.0 |
| Vertex clustering | 26,686 | 106 | 50.2 | |
| 13,376 | 209 | 75.0 | ||
| 6769 | 406 | 87.4 | ||
| 3285 | 816 | 93.9 | ||
| 1610 | 1624 | 97.0 | ||
| 838 | 3025 | 98.4 | ||
| 614 | 4023 | 98.9 | ||
| 376 | 6198 | 99.3 | ||
| Edge removal | 26,685 | 107 | 50.2 | |
| 13,375 | 213 | 75.0 | ||
| 6769 | 420 | 87.4 | ||
| 3285 | 865 | 93.9 | ||
| 1610 | 1757 | 97.0 | ||
| 838 | 3341 | 98.4 | ||
| 613 | 4519 | 98.9 | ||
| 312 | 8633 | 99.4 | ||
| 211 | 12,988 | 99.6 | ||
| Skirwith | None | 54,427 | 60 | 0.0 |
| Vertex clustering | 27,400 | 119 | 49.7 | |
| 13,625 | 239 | 75.0 | ||
| 6905 | 464 | 87.3 | ||
| 3400 | 905 | 93.8 | ||
| Edge removal | 27,399 | 120 | 49.7 | |
| 13,625 | 241 | 74.6 | ||
| 6904 | 476 | 87.3 | ||
| 3400 | 964 | 93.8 | ||
| 1646 | 1972 | 97.0 | ||
| 829 | 3831 | 98.5 | ||
| 428 | 7241 | 99.2 | ||
| 320 | 9752 | 99.4 |
Table 4.
KMC Roof Tunnel channel modelling accuracy.
| Simp. Algorithm | Vertex Clustering | Edge Removal | ||||
|---|---|---|---|---|---|---|
| Frequency (GHz) | 1.2969 | 2.3209 | 5.802 | 1.2969 | 2.3209 | 5.802 |
| No. of Triangles | Err Std | Err Std | ||||
| 53,540 | 4.69 | 6.24 | 3.40 | 4.69 | 6.24 | 3.40 |
| 26,686 | 5.07 | 6.27 | 3.84 | 4.41 | 6.13 | 3.34 |
| 13,376 | 5.49 | 6.26 | 3.85 | 4.47 | 6.71 | 3.46 |
| 6769 | 5.17 | 6.28 | 3.98 | 5.28 | 6.84 | 3.28 |
| 3285 | 4.41 | 6.58 | 3.79 | 5.12 | 6.18 | 4.25 |
| 1610 | 5.71 | 8.27 | 3.75 | 5.23 | 6.74 | 4.09 |
| 838 | 19.97 | 22.50 | 15.46 | 5.39 | 6.72 | 3.57 |
| 614 | 15.78 | 18.21 | 11.65 | 5.65 | 7.30 | 4.32 |
| 376 | 57.23 | 55.83 | 56.63 | |||
| 312 | 7.27 | 7.82 | 4.99 | |||
| 211 | 12.53 | 14.58 | 8.45 | |||
Table 5.
Skirwith Cave channel modelling accuracy.
| Simp. Algorithm | Vertex Clustering | Edge Removal | ||||
|---|---|---|---|---|---|---|
| Frequency (GHz) | 1.2969 | 2.3209 | 5.802 | 1.2969 | 2.3209 | 5.802 |
| No. of Triangles | Err Std | Err Std | ||||
| 54,427 | 9.15 | 6.81 | 7.77 | 9.15 | 6.81 | 7.77 |
| 27,400 | 9.59 | 6.88 | 7.96 | 8.35 | 6.38 | 7.92 |
| 13,625 | 10.01 | 5.74 | 5.81 | 8.93 | 6.51 | 7.57 |
| 6905 | 9.58 | 5.74 | 5.86 | 9.13 | 7.01 | 8.85 |
| 3400 | 10.04 | 5.74 | 5.20 | 8.10 | 7.03 | 8.93 |
| 1646 | 8.69 | 6.56 | 7.21 | |||
| 829 | 7.59 | 8.68 | 11.53 | |||
| 428 | 5.30 | 7.62 | 11.14 | |||
| 321 | 7.44 | 9.03 | 12.58 | |||
Publisher’s Note: MDPI stays neutral with regard to jurisdictional claims in published maps and institutional affiliations. |
© 2021 by the authors. Licensee MDPI, Basel, Switzerland. This article is an open access article distributed under the terms and conditions of the Creative Commons Attribution (CC BY) license (https://creativecommons.org/licenses/by/4.0/).
Share and Cite
MDPI and ACS Style
Novak, R.; Hrovat, A.; Bedford, M.D.; Javornik, T. Geometric Simplifications of Natural Caves in Ray-Tracing-Based Propagation Modelling. Electronics 2021, 10, 2914. https://doi.org/10.3390/electronics10232914
AMA Style
Novak R, Hrovat A, Bedford MD, Javornik T. Geometric Simplifications of Natural Caves in Ray-Tracing-Based Propagation Modelling. Electronics. 2021; 10(23):2914. https://doi.org/10.3390/electronics10232914
Chicago/Turabian StyleNovak, Roman, Andrej Hrovat, Michael D. Bedford, and Tomaž Javornik. 2021. "Geometric Simplifications of Natural Caves in Ray-Tracing-Based Propagation Modelling" Electronics 10, no. 23: 2914. https://doi.org/10.3390/electronics10232914
Note that from the first issue of 2016, this journal uses article numbers instead of page numbers. See further details here.