Explaining Fertility Variation in Rural Communities: The Role of Electricity in Ghana

1
Audit Services, Wells Fargo, Charlotte, NC 28202, USA
2
College of Business, Delta State University, Cleveland, MS 38733, USA
3
Department of Economics, University of Ghana, Legon, Ghana
*
Author to whom correspondence should be addressed.
Economies 2018, 6(3), 40; https://doi.org/10.3390/economies6030040
Submission received: 16 May 2018
/
Revised: 28 June 2018
/
Accepted: 29 June 2018
/
Published: 16 July 2018
(This article belongs to the Special Issue Towards Agro-Food Economics and Rural Development Challenges and Perspectives in Competitive Economies)
Abstract
:We believe the massive rural electrification, which began in 1992, played a significant role in the varying fertility rates across rural Ghana. Rural households with electricity, tend to have fewer children ever born to a woman than households without electricity. Using control function regressions, we identify the contribution of electrification to the rural-rural variation in fertility by exploiting the exogenous variations in the access rate to electricity at the district-level. Our results indicate that electrification contributes to a fall in fertility among rural women by between one and three children. These results are qualitatively similar to results from our two-stage least squares estimations and counterfactual analysis. Although our results may not reflect what happens in other countries, they suggest that electrification reduces fertility and should be considered when examining the costs and benefits of rural electrification programs in developing countries.
1. Introduction
Ghana experienced a rapid decline in fertility after 1992. Interestingly, there still exists a rural-urban difference and a rural-rural variation in fertility. It appears the massive rural electrification program in 1992 contributed significantly to the observed rural-rural difference in fertility. Electrified rural households tend to have fewer children compared to the non-electrified rural households. For many developing countries like Ghana, the debate remains whether large-scale family planning programs or economic development triggers the fertility transition (Grimm et al. 2015; Bongaarts and Casterline 2013). It appears electrification affects both and they, in turn, affect fertility. It is important to understand the relationship between electrification and fertility because fertility is linked to poverty reduction, income distribution and economic growth (Becker and Barro 1988; Eastwood and Lipton 1999). Recent research (Cornwell and Robinson 1988; Bailey and Collins 2011; Peters and Vance 2011; Grimm et al. 2015) has found mixed results on the relationship between fertility and electricity.
To establish the relationship between fertility and electrification, we study the 1990s expansion of electricity to rural areas in Ghana. Electrification rates have risen progressively from 28% in 1988 to 43% in 2000 and 55% by 2008. Much of the improved access is due to two main electrification programs: the 1989–1990 “Self-Help Electrification Program” (SHEP) and the “District Capitals Electrification Project” (DCEP). In 1989, only 5% of rural residents had access and only 478 of 4221 communities had access to electricity (Abavana 2012). The DCEP aimed at extending electricity to the remaining 64 districts without electricity at the time. As part of the DCEP, towns and villages en route to the district capitals were also connected to the national grid. In all, 455 communities including the 64 district capitals were covered (Abavana 2012).
SHEP on the other hand connected communities in which households were willing to bear some of the cost of the electrification. Such a community needed to satisfy a three-pronged criterion: be within 20 km of an existing 11 kV or 33 kV network suitable for further extension; procure and erect all the low voltage electricity poles required for the local network; and have a minimum of one-third of homes in the wired and ready to receive electricity supply. Overall, SHEP helped in the extension of electricity to about 82.5% Ghanaians (Kumi 2017). The expansion in electricity to rural communities has come with declining fertility in many rural communities.
The fall in Ghana’s fertility has received some attention in the literature (Boadu 2002; Chuks 2002; Gyimah 2006; Gyimah et al. 2012; Gaisie 2013). Some studies attribute the fall in fertility to increase the knowledge and use of contraceptive (Boadu 2002). However, Gyimah et al. (2012) argue that although the knowledge of contraceptive use is almost universal in Ghana, its prevalence rate remains low. The relatively low contraceptive demand and use can be attributed to sociocultural factors that undermine the relevance of family planning services and reinforce the rationalization of high fertility (Gyimah et al. 2012). Gyimah (2006) attributes the fall in fertility to rural-urban migration: rural dwellers who move to urban areas tend to adopt the fertility behaviors of urban households. While this may explain rural-urban fertility differences, it does not explain rural-rural differences in fertility. Nyarko (2012) finds that the level of education of the female adolescent and her partner; the work status of the female adolescent; the wealth status; and the exposure to media significantly influence adolescent fertility. All of the factors influencing fertility as outlined by Nyarko (2012) are more pronounced when electricity is available in the household.
Despite the attempts to explain fertility variation across Ghana, no study has examined the link between electrification and fertility. The rural-rural variation in fertility across Ghana offers a unique opportunity to study the effects of electrification on fertility. Rural areas in Ghana are homogenous as far as the family unit is concerned. Rural communities, before electrification, are characterized by a high number births per woman. These communities are agricultural-based and often have high levels of poverty. With electricity, there appears a divergence in fertility between rural communities connected to the national grid and those without electricity. Thus, the goal of this paper is to estimate the effect of electrification on fertility.
Electrification may affect fertility through increased access to information (including family planning) and through employment opportunities. The introduction of electrification in an area creates new channels of information (Jensen and Oster 2009; La Ferrara et al. 2012). Grimm et al. (2015) note that a key channel through which electrification affects fertility relates to increased exposure to television. For instance, a woman with a television at home may gain knowledge of contraceptive use through commercials that encourage family planning. Exposure to television dramas, which often feature a couple with few children, also affects reproductive behavior as the ideal family size is subconsciously implanted (Jin and Jeong 2010). In addition, the introduction of electrification increases household technology adoption that affects fertility through child quantity-quality tradeoff favoring quality (see, for example, Lewis 2015 or Bailey and Collins 2011).
Alternatively, electrification affects fertility by increasing the opportunity cost of having children. The electrification of a community usually creates income shocks in the area through newly available job opportunities (Khandker et al. 2009; Bensch et al. 2011). New jobs in these areas affect both participation in the labor market and available hours of work for those already employed, as observed in South Africa (Dinkelman 2011). The increased opportunity cost means that the benefits of each additional child must be carefully considered so that couples can maximize the utility from having children (Becker [1993] 2012; Goldin and Katz 2000; Greenwood et al. 2005; Black et al. 2013).
There are studies that have investigated how electrification affects fertility in other countries. However, the empirical evidence of the relationship between electrification and fertility remains mixed. Peters and Vance (2011) find that rural electrification reduces fertility among rural households in Côte d’Ivoire. Bailey and Collins (2011) also find that exposure to electricity is negatively correlated with fertility among the Amish in the United States. Using panel data, Grimm et al. (2015) find that electrification is responsible for a fertility decline by 18% to 24% in Indonesia. Herrin (1979) finds that the increase in socioeconomic status of couples through rural electrification decreases the demand for children in communities in southern Philippines. In their examination of the electrification-fertility relationship in Southern counties of the US, Cornwell and Robinson (1988, p. 291) conclude, “electrification was relatedly indirectly to fertility through the impact it had on farm and home production modes and also through its facilitation of more general socioeconomic change.” In their review of 10 studies, Harbison and Robinson (1985) conclude that higher rural electrification leads to higher contraceptive prevalence and lower levels of fertility. However, in all but two studies, Bangladesh and the Philippines, electrification functions as a community level variable rather than an individual or household variable. At the level of community, these studies suggest that rural electrification affects fertility in between five and ten years.
On the other hand, some studies find a positive relationship between electrification and fertility. For instance, in their study of non-Southern counties in the United States, Cornwell and Robinson (1988) find that rural electrification leads to an increase in fertility. Peters and Vance (2011) find a similar result in Côte d’Ivoire. Without accounting for the endogeneity of fertility in their model, the study reveals that electrification increases fertility among urban households but decreases among rural women in Côte d’Ivoire.
The results of our study are similar to studies that find a negative relationship between electrification and fertility. We recognize that households are not randomly connected to electricity; the decision is often based on both observed and unobserved characteristics. For our analysis, we control for this endogeneity using exogenous variations in access rate to electricity at the district level to identify the effect of rural electrification on fertility. We use the control function approach as our estimation strategy. The control function approach provides more efficient estimates since access to electricity in our model is binary and endogenous (Wooldridge 2010). To check the stability of our results, we also investigate the counterfactual effect of rural electrification on fertility. Our analysis indicates that women who do not have electricity at home would have similar fertility outcomes in the presence of electricity in their homes when compared to women who have electricity at home.
The rest of this study is organized as follows: Section 2 presents the trends in fertility in Ghana. Section 3 describes the dataset for our analysis and presents its descriptive statistics. Section 4 presents the empirical results from various estimations. In Section 5, we undertake some robustness checks and conclude the study in Section 6.
2. Fertility in Ghana
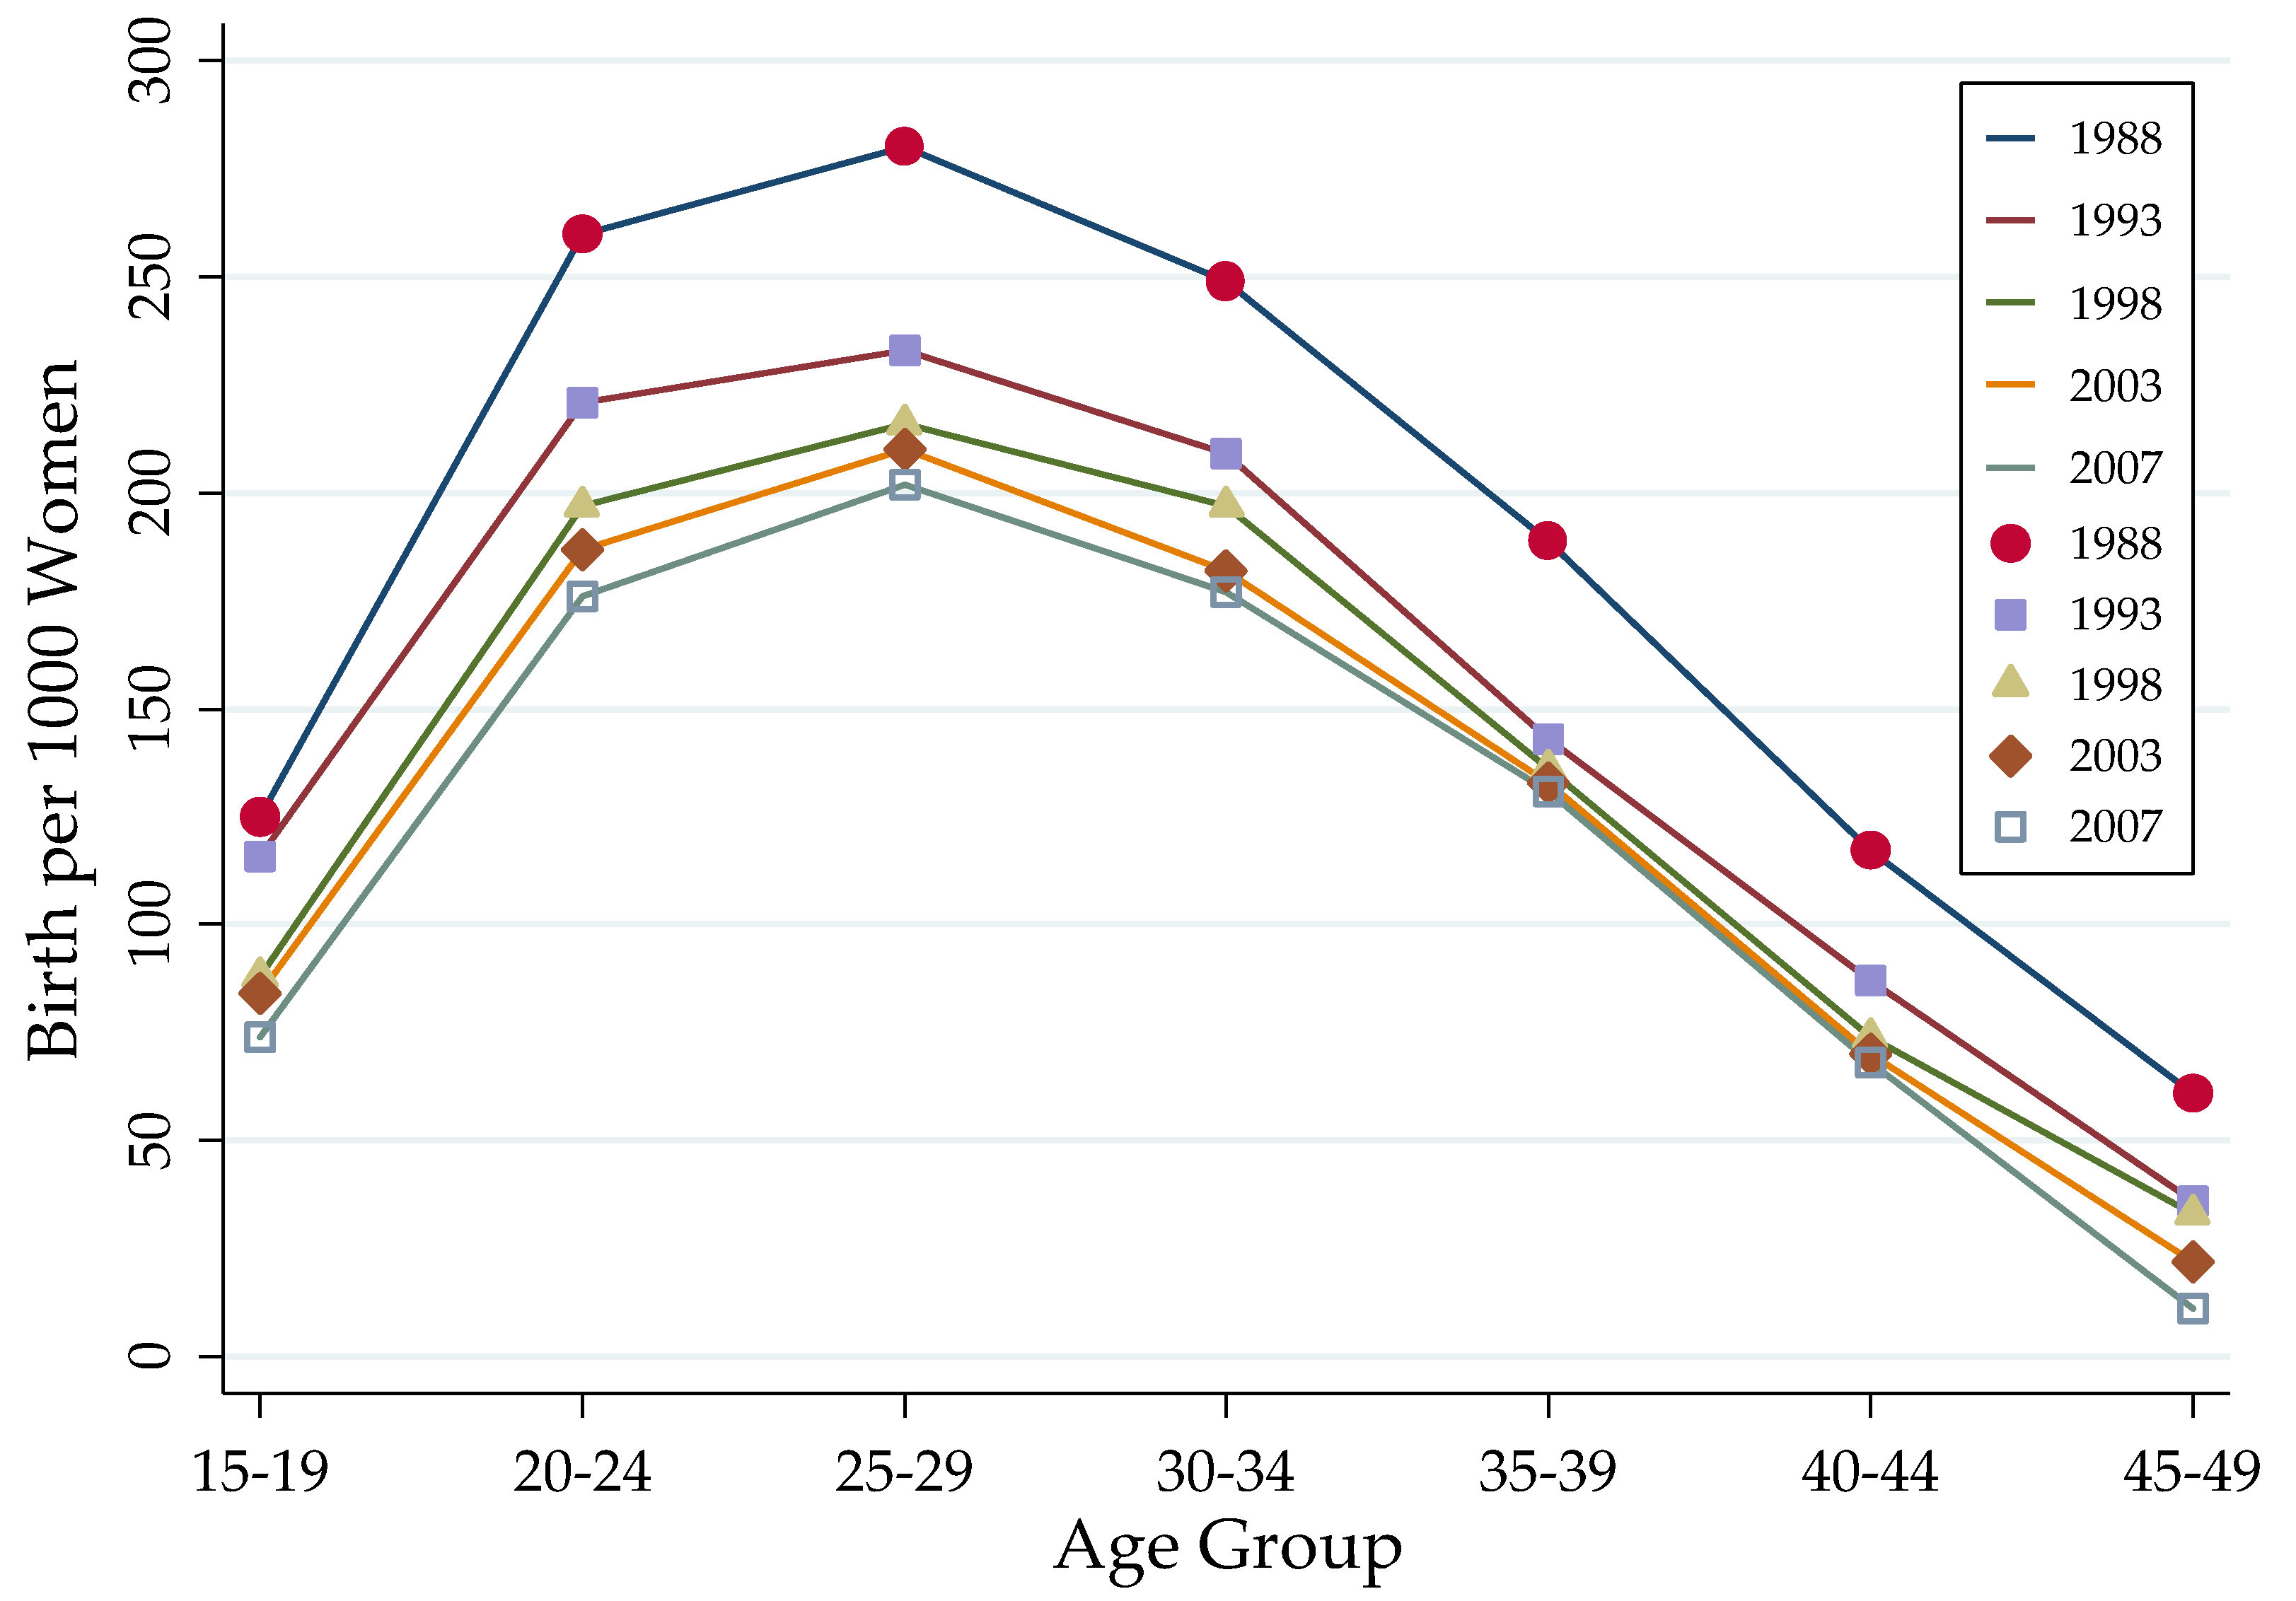
Ghana’s fertility rate has been on the decline for some time now. Table 1 reports estimates of total fertility rate in Ghana from the Ghana Demographic and Health Survey for various years. The Table shows that total fertility declined from 6.4 to 4.6 children per woman from 1988 to 2007. Also, Table 1 reports the age-specific fertility rate for some age groups. There has been a reduction in age-specific fertility rate from 1988 to 2007 as revealed in Table 1. The cumulative percentage reduction in age-specific fertility for the age group of 15–29 between 1988 and 1993 is 39.5% compared to 42.2% between 1993 and 1998, which is the period immediately after the massive rural electrification program in Ghana. It appears there is a spike in fertility reduction after the rural electrification project. Given this observation, it is important to know the extent to which electrification contributed to fertility reduction of rural women in Ghana. Women within the age groups of 15–19 and 45–49 experienced the most drastic change in fertility as revealed in Table 1. As expected, age-specific fertility rate increases with age groups, reaches a peak and then, declines in each year as shown in Table 1.
Figure 1, below, shows a clear picture of the trend in age-specific fertility rate between 1988 and 2007. We can see that there is a fall in fertility between 1988 and 1993, as portrayed by the gap between the lines for 1988 and 1993. After 1993, fertility continued to decrease but at an increasing rate before becoming steady, as seen by the small gaps between the lines for the remaining years.
In Table 2, we show the rural-urban variation in fertility through time; this has received considerable attention in the literature. It also highlights the differences in fertility at the regional level. The Brong-Ahafo region of Ghana records one of the most severe falls in fertility rate over time. Fertility rates in the Northern, Upper East and Upper West regions are consistently higher than the remaining seven regions. Table 2 also presents fertility by income quintiles. Women found in higher income quintiles compared to women found in lower income quintiles have lower fertility rates. We see that fertility rate generally falls as we move along the income quintiles from the lowest to highest. This suggests that the electrification of an area, may lead to new employment opportunities and thus a reduction in fertility as women divert their time from reproduction to income-generating activities (Khandker et al. 2009; Bensch et al. 2011).
While there exists a clear rural-urban difference in fertility, as demonstrated in Table 2, the existence of a rural-rural dichotomy in fertility is only obvious upon a closer examination of the data. The Greater Accra Region, the most urbanized and electrified region, has the lowest fertility rate. The more rural northern-most three regions have the highest fertility rates, on average. In the next section, we show the variation in fertility across rural areas.
3. Data and Descriptive Statistics
The main data for this study is the 2005/2006 Ghana Living Standard Survey data (GLSS). The GLSS is a nationally representative survey conducted by the Ghana Statistical Service (GSS). The purpose of the GLSS is to provide comprehensive information on living standards and to evaluate the effects of various government policies on the indicators of living standards. Each round of the survey covers a nationally representative sample of households spread over a period of 12 months.
So far, the GLSS data is the only comprehensive and most reliable data on the living standards of households in Ghana. One good thing about this data is that the questionnaires are updated for each wave to include new questions. The main weakness of this strategy is that tracking a phenomenon through time can be a difficult exercise. Also, the same households are not necessarily followed from wave to wave. Also, house numbers and cluster identification numbers change from survey to survey. For these reasons, we only use the 2005/2006 GLSS in this study. As mentioned earlier, rural electrification affects fertility in about five to ten years. Thus, the window of our study should adequately capture this effect.
To examine the role of rural electrification of fertility, we construct a cross-section of women in rural Ghana using the reported district-level codes, cluster numbers, household numbers and individual identification numbers. We further restrict our sample to rural women who reported having their first ever child after 1992 (the year of the massive rural electrification) and for whom information about electricity in their homes is available. Imposing these restrictions result in a final sample of 3288 observations covering 170 districts. We include individual-level covariates reported in the Survey. In particular, we include the number of years spent in school, income, type of job, technology adoption, religion and contraceptive use.
In Table 3, we present summary statistics. Around 42% of rural women have electricity in their homes. The average number of children ever borne by a woman in the total sample is 2.88. From Table 3, it is clear that there is a difference in fertility rates across rural communities. Women with electricity at home also have fewer children: 2.63 against 3.04 for women without electricity. The majority of women with electricity at home are also located in districts with higher access rates to electricity.
Table 3 further highlights some individual-level differences between women with and those without electricity at home. Women with electricity at home stay longer in school than those without electricity at home. Women with electricity at home also earn higher incomes, on average. A longer stay in school and higher income potentially leads to a quality-quantity tradeoff in the number children ever born, in favor of quality. As far as birth control goes, a larger percentage of women who have electricity at home use some form of contraceptive: 21.78% compared to 14.37%. However, there seems to be no meaningful difference in reported age, age at first sexual encounter and age at first birth.
4. Methodology
Our goal is to estimate the extent to which electrification contributes to fertility reduction of rural women in our sample. As a result, we estimate a model with a general form
where the variables Y is fertility and X denotes access to electricity. The variable Z is a vector of exogenous explanatory variables, which includes education, income, white-collar job, radio, television, contraceptive, Catholic, age, age at first sexual encounter, the age at first birth and six regional dummy variables. The variable u is the error term and is assumed to be normally distributed.
Although we can estimate the effect of electrification on fertility, ignoring the endogeneity of the household’s decision to connect the grid will render our estimated results invalid. As discussed earlier, while the decision to expand electricity to all district capitals was without any preconditions, expansion to communities needed to satisfy a three-pronged criterion. By this criterion, it is assured that communities meet both potential gains and the feasibility of supplying electricity to the said community. Thus, some women have electricity because they simply live in communities that are close to the electricity grid. Some of these women would not connect to the electricity grid if they were distant from the grid. Thus, there are econometric concerns that must be accounted for in estimating the effect of electricity on fertility. This is because, by virtue of being close to an electricity grid, a household may connect to the grid. The same household may not connect to the grid if it were further away from the grid. This situation results in the selection of households into electrifying their homes. As a result, electrification correlates with unobservable characteristics of the fertility of a woman. This leads to a correlation between electrification and the error term in the structural equation of electrification, leading to a biased and inconsistent estimate of if Equation (1) is estimated using OLS. Thus, OLS suffers from selectivity and endogeneity biases.
The identification strategy of this study is to use exogenous variations in the access rates of electricity in the 170 districts where these women are located to identify in Equation (1). We assume that the probability of a woman having electricity in her home is higher in a district with higher access rate to electricity. As a result, access rate to electricity and having electricity at home should be positively related.
Since electricity in our model is binary and endogenous, we estimate our model using control function approach (Wooldridge 2010). Compared to the two-stage least square or the generalized method of moments, this strategy gives more efficient estimates and it relies on the same identification conditions as the two other methods. To use the control function approach, we project in Equation (1) onto the exogenous variables, by writing a reduced form equation with an error term as
where is a vector of coefficients. We further write a linear projection of on in an error form as
where is the population regression coefficient. By definition, and because and are both uncorrelated with We then plug Equation (3) into Equation (1) to give
where we now have as an explanatory variable in Equation (4). Because is uncorrelated with and , we can consistently estimate and by running an OLS regression of on and using a random sample. These OLS estimates are the control function estimates. The inclusion of controls for the endogeneity of electrification, in Equation (1). Estimation of Equation (2) is done using probit.
5. Empirical Results
We present our estimates of the structural equations in Table 4. Each row corresponds to a different explanatory variable, while each column reports the results from a different specification. Standard errors are clustered at the district level and are reported in parentheses. The covariates in all specifications are electricity (i.e., whether a household is connected to or otherwise), education, income, white-collar job, radio, television, contraceptive, Catholic, age, age at first sexual encounter, the age at first birth and five regional dummies whose coefficients are not reported.
Column 1 shows that in the absence of any other explanatory variable, electrification has a significant and negative relationship with fertility. When we include other explanatory in column 2, the relationship between electrification and fertility remains negative and statistically significant. The coefficient of electrification also increases in magnitude. The results show that electrification reduces fertility by 0.5 children. This result is in line with Bailey and Collins (2011) and Grimm et al. (2015) but can be contrasted with some results from a similar study in Côte d’Ivoire by Peters and Vance (2011). We also observe income to be statistically significant, which indicates that as women move up the income ladder, fertility declines. As expected, age has a diminishing returns effect on fertility. This observation is consistent with previous research by Klein and Sauer (2001). However, the OLS estimation ignores selection and endogeneity issues as discussed earlier. Ignoring these issues may mean we underestimate the actual effect of electrification on fertility. To account for selection and endogeneity, we use a control function approach1. To check the robustness of our results, we also estimate results from two-stage least squares.
Results from the first stage regression of the control function approach and the two-stage least squares are presented in Table A1 in the Appendix A. The probability of a woman having electricity at home is assumed to be high in districts with high access rates to electricity. The positive coefficient on access rate to electricity is supported by results from previous studies (Davis 1998; Kanagawa and Nakata 2008; Winkler et al. 2011). As noted by Winkler et al. (2011), access means that “households and businesses in a given area can connect to electricity that is established either by grid or smaller nongrid connected supply.” The explanatory variables used to control for other factors that affect electrification of a home are also statistically significant and have their theoretical expected signs. The chi-square statistic of 113 and the high F-statistic of 161 in the case of the first stage regression results for the CF and TSLS respectively, give us some comfort that our instrument will not suffer from weak instrument bias.
Column 3 presents the results of the structural model of the control function regression. After taking care of the selection and endogeneity of having electricity in a home by using the exogenous variations in the access rate to electricity in a district, electrification now has a much large effect on fertility compared to the OLS estimates. Electrification reduces the fertility by 3.16 children. This means the effect of electrification on fertility is grossly underestimated when the endogeneity of connecting to the grid is ignored.
The negative coefficient of electricity supports the anticipated direct effects of electrification on fertility such as the availability of alternatives to intercourse and the increase in the opportunity cost of having children; both of which lead to a decrease in the demand for children. It also supports the indirect effects such introduction of new channels of information. It is therefore not surprising that Cornwell and Robinson (1988) find that electrification plays a moderating role among farm women in Southern counties of the US. Our result is also similar to Peters and Vance (2011) study on the effect of electrification on fertility for rural households in Côte d’Ivoire.
We also implement the TSLS regression method for purposes of comparison. Column 4 of Table 4 presents the second stage results, which show qualitatively the same results as the control function estimation. Electrification and other explanatory variables are significant as previously presented. The estimated coefficient of electrification is negative, as before, implying the robustness of the finding that electrification reduces the fertility of rural women. Again, accounting for the presence of selection and endogeneity has a larger impact on the coefficient on electrification. OLS, therefore, understates the effect of electrification on fertility as mentioned earlier.
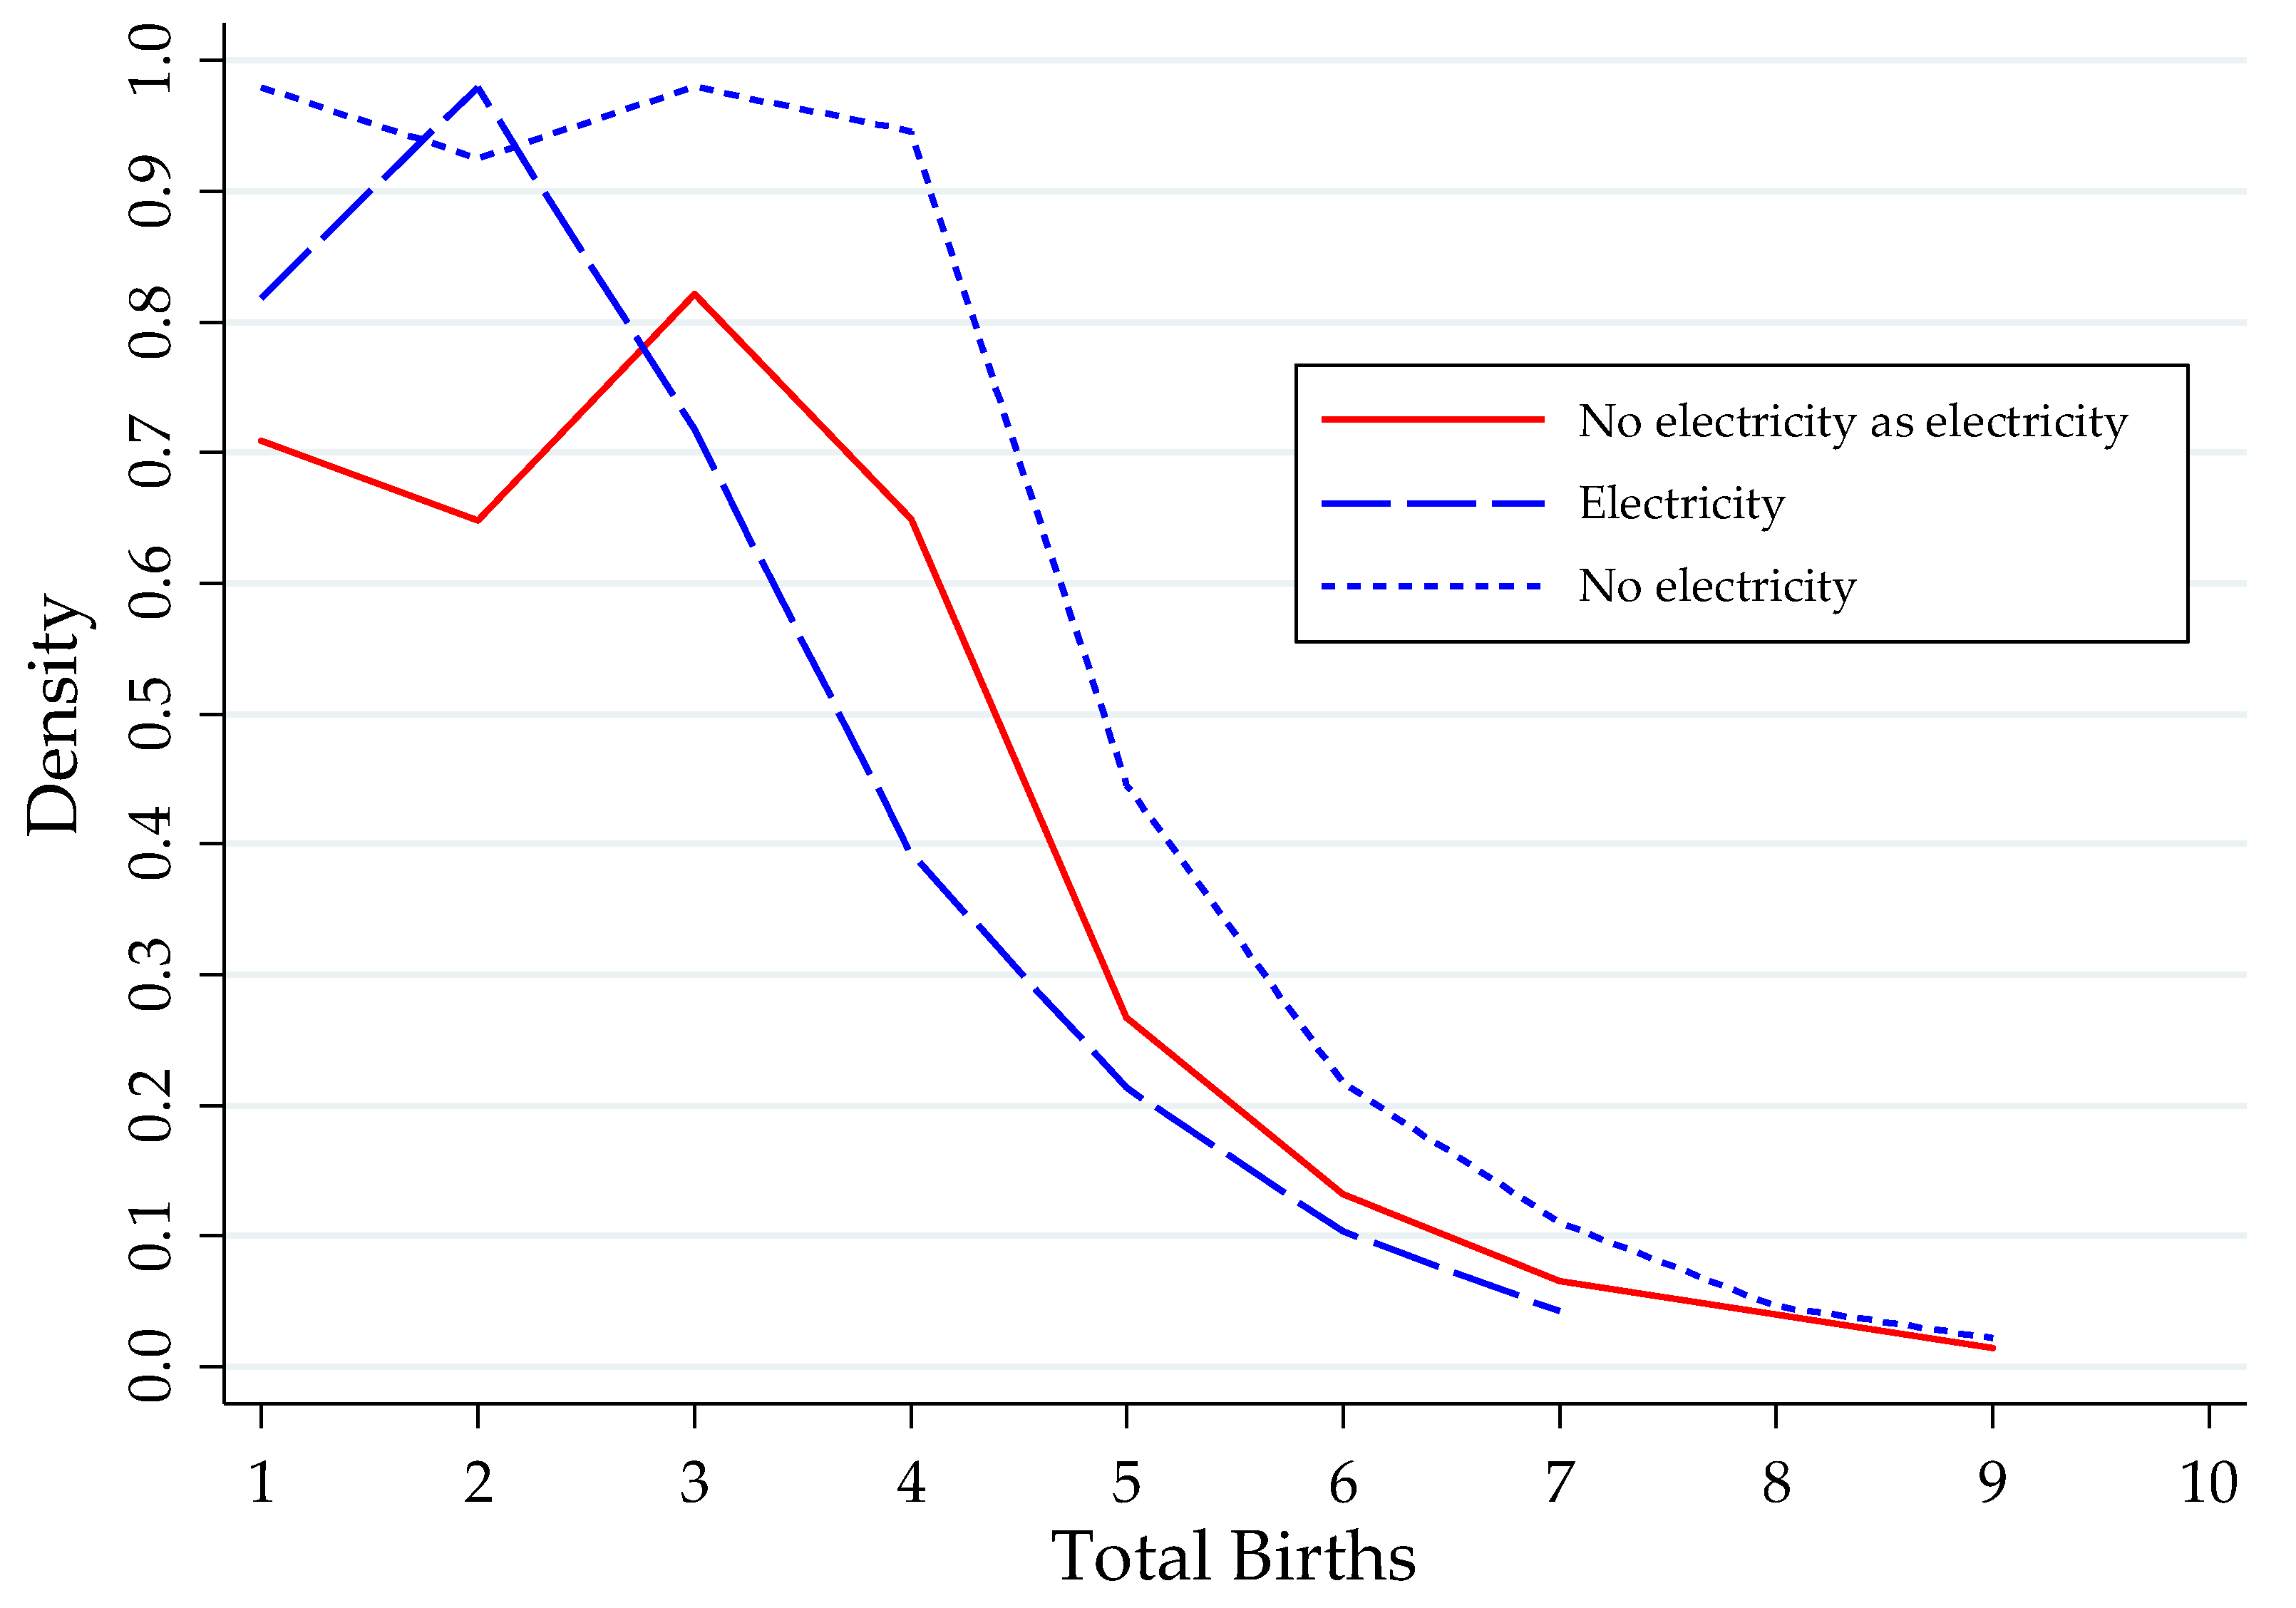
Finally, we also investigate the counterfactual effect of rural electrification on fertility. Both CF and TSLS may yield biased estimates where the exclusion restriction(s) is weak: if for instance, district-level electrification is correlated with other determinants of fertility other than household grid connection then our regression results are biased. Figure 2 illustrates that women who do not have electricity at home would have similar fertility outcomes in the presence of electricity in their homes when compared to women who have electricity at home.
As shown in Figure 2, women with electricity at home compared to women without electricity at home have a lower density of fertility. When we hypothetically make women without electricity at home have electricity, their density of fertility falls. This result shows that electrification plays an important role in fertility decline. Ashcraft et al. (2013) use a similar counterfactual in their study of the adverse effects of birth on teenage mothers.
6. Conclusions
In this study, we investigate the effect of electricity on fertility in rural Ghana. Our results suggest that rural electrification reduces fertility by about one to three children per woman. This result has policy implications for Ghana. This is a big effect, especially if we compare this with factors that are often cited for decreasing fertility, such as increased female education, for which we find its contribution to be negligible. However, given that our results are based on cross-sectional GLSS data, these results can be susceptible to omitted variable bias and selection issues and therefore require some caution to be interpreted as causal effects. Selection issues will largely arise if smaller families in rural areas choose to settle near electricity grids in other rural communities so as to have their dwellings connected to electricity. That said, our results are still informative and consistent with results from similar studies. It is true that we cannot entirely rule out biases due to time-varying district-specific unobservable factors that may be correlated with both electrification and fertility decisions but the strength of our approach potentially holds a high degree of external validity because our analysis is based on a nationally representative sample and our counterfactual analysis provide similar evidence. Our results may not also reflect what happens in other countries but they do suggest that electrification reduces fertility and this should be taken into account when examining the costs and benefits of rural electrification programs in developing countries.
7. Notes
- Fertility is the total number of children a woman ever born.
- Education is the number of years of schooling of a woman.
- Income is the total income earned from employment.
- White-collar job is any formal sector employment and is equal to one if employed in the formal sector.
- Radio is the ownership of radio and equal to one if a woman owns a radio.
- Television is the ownership of radio and equal to one if a woman owns a television.
- Contraceptive is the usage of contraceptive to control birth and is equal to one if a woman uses any form of contraceptive.
- Catholic is defined as a member of the Roman Catholic Church.
- Age is the age in years of a woman.
- Age at first sex is the age a woman first had sex.
- Age at first birth is the age at which a woman first had her first child.
- Access rate of electricity is the percentage of homes with electricity in a district.
Appendix A

Table A1.
First-stage Estimates from Control Function Regression (CF) and Two-stage-least squares (TSLS).
Table A1.
First-stage Estimates from Control Function Regression (CF) and Two-stage-least squares (TSLS).
| Dependent Variable: Electricity | ||
|---|---|---|
| Independent Variables | CF | TSLS |
| District electricity access rate | 0.01922 *** | 0.006 *** |
| (0.00045) | (0.000) | |
| Education | 0.06971 *** | −0.000 *** |
| (0.00147) | (0.000) | |
| Income | −0.00028 *** | 0.360 *** |
| (0.00003) | (0.007) | |
| White-collar job | 1.65711 *** | 0.060 *** |
| (0.04151) | (0.007) | |
| Radio | 0.19754 *** | 0.164 *** |
| (0.02226) | (0.007) | |
| Television | 0.58398 *** | 0.012 ** |
| (0.02633) | (0.005) | |
| Contraceptive | 0.05337 *** | 0.128 *** |
| (0.01548) | (0.007) | |
| Catholic | 0.53353 *** | 0.067 *** |
| (0.02802) | (0.003) | |
| Age | 0.23140 *** | −0.001 *** |
| (0.01099) | (0.000) | |
| Age-square | −0.00274 *** | 0.008 *** |
| (0.00018) | (0.001) | |
| Age of first sex | 0.01932 *** | −0.008 *** |
| (0.00329) | (0.000) | |
| Age of first birth | −0.03024 *** | 0.090 *** |
| (0.00153) | (0.012) | |
| Constant | −5.53245 *** | −1.184 *** |
| (0.17653) | (0.053) | |
| Number of observations | 2560 | 2660 |
| Log-likelihood | −23409 | |
| Chi-square | 113 | |
| Bayesian Information Criteria | 47012 | |
| F-statistic | 161 |
Standard errors in parentheses. * p < 0.10, ** p < 0.05, *** p < 0.001.
References
- Abavana, Clement G. 2012. Electricity Access Progress in Ghana. Paper presented at the SE4 All Workshop, Copenhagen, Denmark, November 9–12. [Google Scholar]
- Ashcraft, Adam, Iván Fernández-Val, and Kevin Lang. 2013. The Consequences of Teenage Childbearing: Consistent Estimates When Abortion Makes Miscarriage Non-Random. The Economic Journal 123: 875–905. [Google Scholar] [CrossRef] [PubMed]
- Bailey, Martha J., and William J. Collins. 2011. Did Improvements in Household Technology Cause the Baby Boom? Evidence from Electrification, Appliance Diffusion and the Amish. American Economic Journal: Macroeconomics 3: 189–217. [Google Scholar] [CrossRef]
- Becker, Gary. 2012. A Treatise on the Family. Cambridge: Harvard University Press. First published in 1993. [Google Scholar]
- Becker, Gary S., and Robert J. Barro. 1986. Altruism and the Economic Theory of Fertility. Population and Development Review 12: 69–76. [Google Scholar] [CrossRef]
- Bensch, Gunther, Jochen Kluve, and Jörg Peters. 2011. Impacts of Rural Electrification in Rwanda. Journal of Development Effectiveness 3: 567–88. [Google Scholar] [CrossRef]
- Black, Dan A., Natalia Kolesnikova, Seth G. Sanders, and Lowell J. Taylor. 2013. Are Children ‘Normal’? The Review of Economics and Statistics 95: 21–33. [Google Scholar] [CrossRef] [PubMed]
- Boadu, Kwame. 2002. The Effect of Contraceptive Practice on Fertility in Ghana: A Decade of Experience. Canadian Studies in Population 29: 265–91. [Google Scholar] [CrossRef]
- Bongaarts, John, and John Casterline. 2013. Fertility Transition: Is Sub-Saharan Africa Different? Population and development Review 38: 153–68. [Google Scholar] [CrossRef] [PubMed]
- Cornwell, Gretchen T., and Warren C. Robinson. 1988. Fertility of US farm women during the electrification era, 1930–50. Population Research and Policy Review 7: 277–91. [Google Scholar] [CrossRef]
- Chuks, J. 2002. Ghana’s Reproductive Revolution: Analysis of the Determinants of Fertility Transition. Ontario: Union for African Population Studies (UAPS). [Google Scholar]
- Davis, Mark. 1998. Rural Household Energy Consumption: The Effects of Access to Electricity—evidence from South Africa. Energy Policy 26: 207–17. [Google Scholar] [CrossRef]
- Dinkelman, Taryn. 2011. The Effects of Rural Electrification on Employment: New Evidence from South Africa. American Economic Review 101: 3078–108. [Google Scholar] [CrossRef]
- Eastwood, Robert, and Michael Lipton. 1999. The Impact of Changes in Human Fertility on Poverty. The Journal of Development Studies 36: 1–30. [Google Scholar] [CrossRef]
- Gaisie, Samuel. 2013. Fertility Trend in Ghana. African Population Studies 20: 1–23. [Google Scholar] [CrossRef]
- Goldin, Claudia, and Lawrence F. Katz. 2000. Career and Marriage in the Age of the Pill. American Economic Review 90: 461–65. [Google Scholar] [CrossRef] [PubMed]
- Greenwood, Jeremy, Ananth Seshadri, and Guillaume Vandenbroucke. 2005. The Baby Boom and Baby Bust. American Economic Review 95: 183–207. [Google Scholar] [CrossRef]
- Grimm, Michael, Robert Sparrow, and Luca Tasciotti. 2015. Does Electrification Spur the Fertility Transition? Evidence from Indonesia. Demography 52: 1773–96. [Google Scholar] [CrossRef] [PubMed] [Green Version]
- Gyimah, Stephen Obeng. 2006. Migration and Fertility Behavior in Sub-Saharan Africa: The Case of Ghana. Journal of Comparative Family Studies 37: 235–52. [Google Scholar]
- Gyimah, Stephen Obeng, Jones K. Adjei, and Baffour K. Takyi. 2012. Religion, Contraception and Method Choice of Married Women in Ghana. Journal of Religion and Health 51: 1359–74. [Google Scholar] [CrossRef] [PubMed]
- Harbison, Sarah F., and Warren C. Robinson. 1985. Rural electrification and fertility change. Population Research and Policy Review 4: 149–71. [Google Scholar] [CrossRef]
- Herrin, Alejandro N. 1979. Rural Electrification and Fertility Change in the Southern Philippines. Population and Development Review 5: 61–86. [Google Scholar] [CrossRef]
- Jensen, Robert, and Emily Oster. 2009. The Power of TV: Cable Television and Women’s Status in India. The Quarterly Journal of Economics 124: 1057–94. [Google Scholar] [CrossRef]
- Jin, Bumsub, and Seongjung Jeong. 2010. The Impact of Korean Television Drama Viewership on the Social Perceptions of Single Life and Having Fewer Children in Married Life. Asian Journal of Communication 20: 17–32. [Google Scholar] [CrossRef]
- Kanagawa, Makoto, and Toshihiko Nakata. 2008. Assessment of Access to Electricity and the Socio-Economic Impacts in Rural Areas of Developing Countries. Energy Policy 36: 2016–29. [Google Scholar] [CrossRef]
- Klein, Jeffrey, and Mark V. Sauer. 2001. Assessing Fertility in Women of Advanced Reproductive Age. American Journal of Obstetrics and Gynecology 185: 758–770. [Google Scholar] [CrossRef] [PubMed]
- Khandker, Shahidur R., Douglas F. Barnes, and Hussain A. Samad. 2009. Welfare Impacts of Rural Electrification: A Case Study from Bangladesh. World Bank Policy Research Working Papers #4859. [Google Scholar]
- Kumi, Ebenezer N. 2017. The Electricity Situation in Ghana: Challenges and Opportunities. CGD Policy Paper. Washington, DC: Center for Global Development. [Google Scholar]
- La Ferrara, Eliana, Alberto Chong, and Suzanne Duryea. 2012. Soap Operas and Fertility: Evidence from Brazil. American Economic Journal: Applied Economics 4: 1–31. [Google Scholar] [CrossRef] [Green Version]
- Lewis, Joshua. 2015. The Impact of Technological Change within the Home. Ph.D. Dissertation, George Washington University, Washington, DC, USA. [Google Scholar]
- Nyarko, Samuel H. 2012. Determinants of Adolescent Fertility in Ghana. International Journal of Sciences: Basic and Applied Research 5: 21–32. [Google Scholar]
- Peters, Jörg, and Colin Vance. 2011. Rural electrification and fertility–evidence from Côte d'Ivoire. The Journal of Development Studies 47: 753–766. [Google Scholar] [CrossRef]
- Winkler, Harald, André Felipe Simões, Emilio Lèbre La Rovere, Mozaharul Alam, Atiq Rahman, and Stanford Mwakasonda. 2011. Access and Affordability of Electricity in Developing Countries. World Development 39: 1037–50. [Google Scholar] [CrossRef]
- Wooldridge, Jeffrey M. 2010. Econometric Analysis of Cross Section and Panel Data. Cambridge: MIT Press. [Google Scholar]
| 1 | We reject the null hypothesis that the OLS estimator would yield consistent estimates by performing the Durbin-Wu-Hausman endogeneity test. This means that instrumental variable technique is required. We performed the Anderson canonical correlation LM test for under-identification. The test results show that the model is not under-identified. We also perform weak identification test. By computing the Cragg-Donald Wald F-statistics and comparing them with the Stock and Yogo weak identification test critical value of 10% maximal IV size, we reject the null hypothesis that the model specification is weakly identified. |
Figure 1.
Age-specific Fertility Rate in Ghana. Data Source: Ghana Demographic and Health Survey reports (1988, 1993, 1998, 2003 and 2007).
Figure 1.
Age-specific Fertility Rate in Ghana. Data Source: Ghana Demographic and Health Survey reports (1988, 1993, 1998, 2003 and 2007).

Figure 2.
Densities of Fertility by Electricity. Data Source: GLSS, 2005/2006.

Table 1.
Age-specific and total fertility rates.
| Age-Specific Fertility Rate per 1000 Women | |||||
|---|---|---|---|---|---|
| Age Group | 1988 | 1993 | 1998 | 2003 | 2007 |
| 15–19 | 125 | 116 | 88 | 84 | 74 |
| 20–24 | 260 | 221 | 197 | 187 | 176 |
| 25–29 | 280 | 233 | 216 | 210 | 202 |
| 30–34 | 249 | 209 | 197 | 182 | 177 |
| 35–39 | 189 | 143 | 136 | 133 | 131 |
| 40–44 | 117 | 87 | 74 | 70 | 68 |
| 45–49 | 61 | 36 | 33 | 22 | 11 |
| TFR | 6.40 | 5.50 | 4.55 | 4.40 | 4.60 |
TFR: Total fertility rate, expressed per woman. Source: Ghana Demographic and Health Survey reports (1988, 1993, 1998, 2003 and 2007).
Table 2.
Total fertility rate by regions.
| Characteristics | 1988 | 1993 | 1998 | 2003 | 2008 |
|---|---|---|---|---|---|
| Residence | |||||
| Urban | 5.3 | 3.7 | 3.0 | 3.1 | 3.1 |
| Rural | 7.0 | 6.0 | 5.3 | 5.6 | 4.9 |
| Region | |||||
| Western | 5.91 | 5.54 | 4.70 | 4.5 | 4.2 |
| Central | 6.57 | 5.57 | 4.78 | 5.0 | 5.4 |
| Greater Accra | 4.54 | 3.56 | 2.66 | 2.9 | 2.5 |
| Volta | 6.82 | 5.41 | 4.44 | 4.4 | 3.8 |
| Eastern | 5.77 | 5.10 | 4.41 | 4.3 | 3.6 |
| Ashanti | 5.96 | 5.60 | 4.76 | 4.1 | 3.6 |
| Brong-Ahafo | 7.11 | 5.46 | 5.40 | 4.8 | 4.1 |
| Northern | 6.60 * | 7.39 | 6.98 | 7.0 | 6.8 |
| Upper East | 6.02 | 6.14 | 4.7 | 4.1 | |
| Upper West | 6.44 | 4.98 | 5.5 | 5.0 | |
| Wealth quintile | |||||
| Lowest | - | - | - | 6.4 | 6.5 |
| Second | - | - | - | 5.9 | 4.9 |
| Middle | - | - | - | 4.9 | 4.0 |
| Fourth | - | - | - | 3.3 | 3.4 |
| Highest | - | - | - | 2.8 | 2.3 |
| Total | 6.41 | 5.50 | 4.55 | 4.4 | 4.0 |
Note: Total fertility rates are for the period 1–36 months preceding the interview. * The figure is the total fertility rate for Northern, Upper East and Upper West regions. Source: Ghana Demographic and Health Survey reports (1988, 1993, 1998, 2003 and 2008).
Table 3.
Summary Statistics by Electricity at Home.
| Variables | Electricity | No Electricity | Full Sample | Std. Dev. |
|---|---|---|---|---|
| Total children ever born | 2.63 | 3.04 | 2.88 | 1.64 |
| Electricity at home (%) | - | - | 42.04 | 0.49 |
| Access rate to electricity (%) | 51.34 | 32.22 | 40.25 | 21.42 |
| Education in years | 3.28 | 1.79 | 4.97 | 5.24 |
| Income (Ghana Cedis) | 66.69 | 60.91 | 63.60 | 166.72 |
| Whit-Collar job (%) | 5.61 | 0.95 | 2.91 | 0.17 |
| Radio (%) | 13.54 | 13.60 | 13.57 | 0.34 |
| Television (%) | 12.69 | 2.61 | 6.85 | 0.25 |
| Contraceptive (%) | 21.78 | 14.37 | 17.50 | 0.38 |
| Catholic (%) | 5.48 | 1.59 | 3.22 | 0.18 |
| Age in years | 31.84 | 30.50 | 31.07 | 10.01 |
| Age at first sexual encounter | 18.06 | 17.65 | 17.83 | 2.47 |
| Age at first birth | 21.01 | 20.10 | 20.50 | 3.44 |
| Region of residence | ||||
| Accra (%) | 2.49 | 2.54 | 2.52 | 0.16 |
| Central (%) | 13.01 | 4.82 | 8.26 | 0.28 |
| Volta (%) | 21.57 | 28.32 | 25.49 | 0.44 |
| Eastern (%) | 23.97 | 30.59 | 27.81 | 0.45 |
| Ashanti (%) | 11.34 | 9.43 | 10.23 | 0.30 |
| Northern (%) | 27.61 | 24.31 | 25.70 | 0.44 |
Note: The excluded category of region of residence if Accra. The number of observations shown in the table are weighted. The actual number of observations is 3288.
Table 4.
Estimates from Various Regression Methods.
| Dependent Variable: Fertility | ||||
|---|---|---|---|---|
| Independent Variables | OLS (1) | OLS (2) | CF (3) | TSLS (4) |
| Electricity | −0.41054 *** | −0.51753 *** | −3.16071 *** | −2.572 *** |
| (0.00679) | (0.01281) | (0.06474) | (0.072) | |
| Education | −0.03813 *** | −0.01022 *** | −0.008 *** | |
| (0.00127) | (0.00173) | (0.002) | ||
| Income | −0.00015 *** | 0.00030 *** | 0.000 *** | |
| (0.00004) | (0.00003) | (0.000) | ||
| White-collar Job | −0.33967 *** | −0.52896 *** | −0.462 *** | |
| (0.01943) | (0.03037) | (0.037) | ||
| Radio | −0.03572 ** | −0.13616 *** | −0.147 *** | |
| (0.01522) | (0.01563) | (0.022) | ||
| Television | −0.00014 | −0.37985 *** | −0.377 *** | |
| (0.01758) | (0.01942) | (0.026) | ||
| Contraceptive | −0.12769 *** | −0.10934 *** | −0.115 *** | |
| (0.01071) | (0.01048) | (0.015) | ||
| Catholic | 0.19647 *** | 0.46815 *** | 0.441 *** | |
| (0.02238) | (0.02180) | (0.030) | ||
| Age | 0.36717 *** | 0.48621 *** | 0.478 *** | |
| (0.00942) | (0.01037) | (0.012) | ||
| Age-square | −0.00380 *** | −0.00504 *** | −0.005 *** | |
| (0.00016) | (0.00017) | (0.000) | ||
| Age at first sex | −0.07712 *** | −0.05616 *** | −0.052 *** | |
| (0.00322) | (0.00319) | (0.003) | ||
| Age at first birth | −0.05925 *** | −0.08103 *** | −0.082 *** | |
| (0.00302) | (0.00294) | (0.002) | ||
| Constant | 3.04455 *** | −1.57650 *** | −3.16071 *** | −3.274 *** |
| (0.00463) | (0.13779) | (0.06474) | (0.182) | |
| Number of observations | 3288 | 2610 | 2610 | 2610 |
| R-square | 0.0151 | 0.3425 | 0.3687 | 0.1137 |
| Adjusted R-square | 0.0151 | 0.3422 | 0.3684 | 0.1142 |
| Log-likelihood | −433909 | −64853 | −63971 | −76281 |
| F-statistic | 365 | 124 | 137 | 72 |
| Anderson-Rubin LR statistic | - | - | 1592 | |
| Cragg-Donald F-statistic | - | - | 1864 | |
| Root mean square error | 1.6283 | 1.0797 | 1.0579 | 1.4049 |
Columns 2–4 include 5 statistically significant regional dummies that are omitted. Columns 3 and 4 report the second stage results of the CF and TSLS regressions, respectively. Standard errors are robust. Standard errors in parentheses. * p < 0.10, ** p < 0.05, *** p < 0.001.
© 2018 by the authors. Licensee MDPI, Basel, Switzerland. This article is an open access article distributed under the terms and conditions of the Creative Commons Attribution (CC BY) license (http://creativecommons.org/licenses/by/4.0/).
Share and Cite
MDPI and ACS Style
Akpandjar, G.; Puozaa, C.; Quartey, P. Explaining Fertility Variation in Rural Communities: The Role of Electricity in Ghana. Economies 2018, 6, 40. https://doi.org/10.3390/economies6030040
AMA Style
Akpandjar G, Puozaa C, Quartey P. Explaining Fertility Variation in Rural Communities: The Role of Electricity in Ghana. Economies. 2018; 6(3):40. https://doi.org/10.3390/economies6030040
Chicago/Turabian StyleAkpandjar, George, Conrad Puozaa, and Peter Quartey. 2018. "Explaining Fertility Variation in Rural Communities: The Role of Electricity in Ghana" Economies 6, no. 3: 40. https://doi.org/10.3390/economies6030040
Note that from the first issue of 2016, this journal uses article numbers instead of page numbers. See further details here.