
The Dynamics of the Profitability and Growth of Restaurants; The Case of Norway


1
NTNU Business School, Norwegian University of Science and Technology, 7491 Trondheim, Norway
2
Department of Environmental Sciences, Western Norway University of Applied Sciences, 6856 Sogndal, Norway
*
Author to whom correspondence should be addressed.
†
These authors contributed equally to this work.
‡
Current address: Høgskulen på Vestlandet Campus Sogndal, Røyrgata 6, 6856 Sogndal, Norway.
Economies 2022, 10(2), 53; https://doi.org/10.3390/economies10020053
Submission received: 18 January 2022
/
Revised: 10 February 2022
/
Accepted: 11 February 2022
/
Published: 19 February 2022
Abstract
:The restaurant industry is quite similar across borders. It is a labour-intensive industry that is important for tourism and employment. It consists mainly of many small businesses that are regionally dispersed. There are many studies that have analysed this sector. However, rather few articles have focused on the dynamics of growth and profit. The purpose of this paper is to apply the theory of profit persistence and the law of proportionate effect (LPE) to Norwegian restaurants by using publicly available public panel data from 2010 to 2019. The sample includes 866 restaurants. One important finding is that Gibrat’s law (LPE) does not seem to hold, meaning the growth is not independent of the size of the firms. Small businesses grow faster than the others, and they are also more profitable. There is some degree of profit persistence in the restaurant industry. Profitability is negatively linked to debt ratios but positively related to working capital. The study shows there is a trade-off between size and profit. These findings are useful for the industry and for others (public planning, lenders, and more).
1. Introduction
The topics of growth and profitability in different sectors have attracted increasing interest over recent decades. According to classical economic theory, competition, entry, and exit of companies drive the profit to zero in the long run. However, empirical research shows profit persistence can exist over a longer period with substantial variation across sectors Cable and Mueller (2008).
Many empirical studies have applied the approach of Mueller (1986) to estimate the degree of profit persistence. Other studies investigate the persistence in firm growth by using a Gibrat’s law of proportionate effect (LPE) framework Gibrat (1931). Gibrat’s law of proportionate effect and Mueller’s profit persistence both estimate the first-order autoregressive parameter to find their answer, that is, the parameter describing the expected effect of the lagged dependent variable. Mueller uses this parameter to describe the speed of adjustment to the sector mean profit rate, while Gibrat’s law states that firm size follows a random walk, with firm growth being independent of firm size. When Gibrat’s law is rejected, the usual finding is that firm size is mean-reverting, with smaller firms growing proportionately faster than larger firms. Moreover, many researchers have investigated the link between the growth and profits of firms Fitzsimmons et al. (2005). There are many studies related to the restaurant industry, but only a few have focused on profit persistence and the link between growth and profits Giotopoulos (2014). The restaurant industry is characterised by small businesses, overcapacity, easy entry for new businesses, and consistently low profits Van Veldhoven et al. (2021).
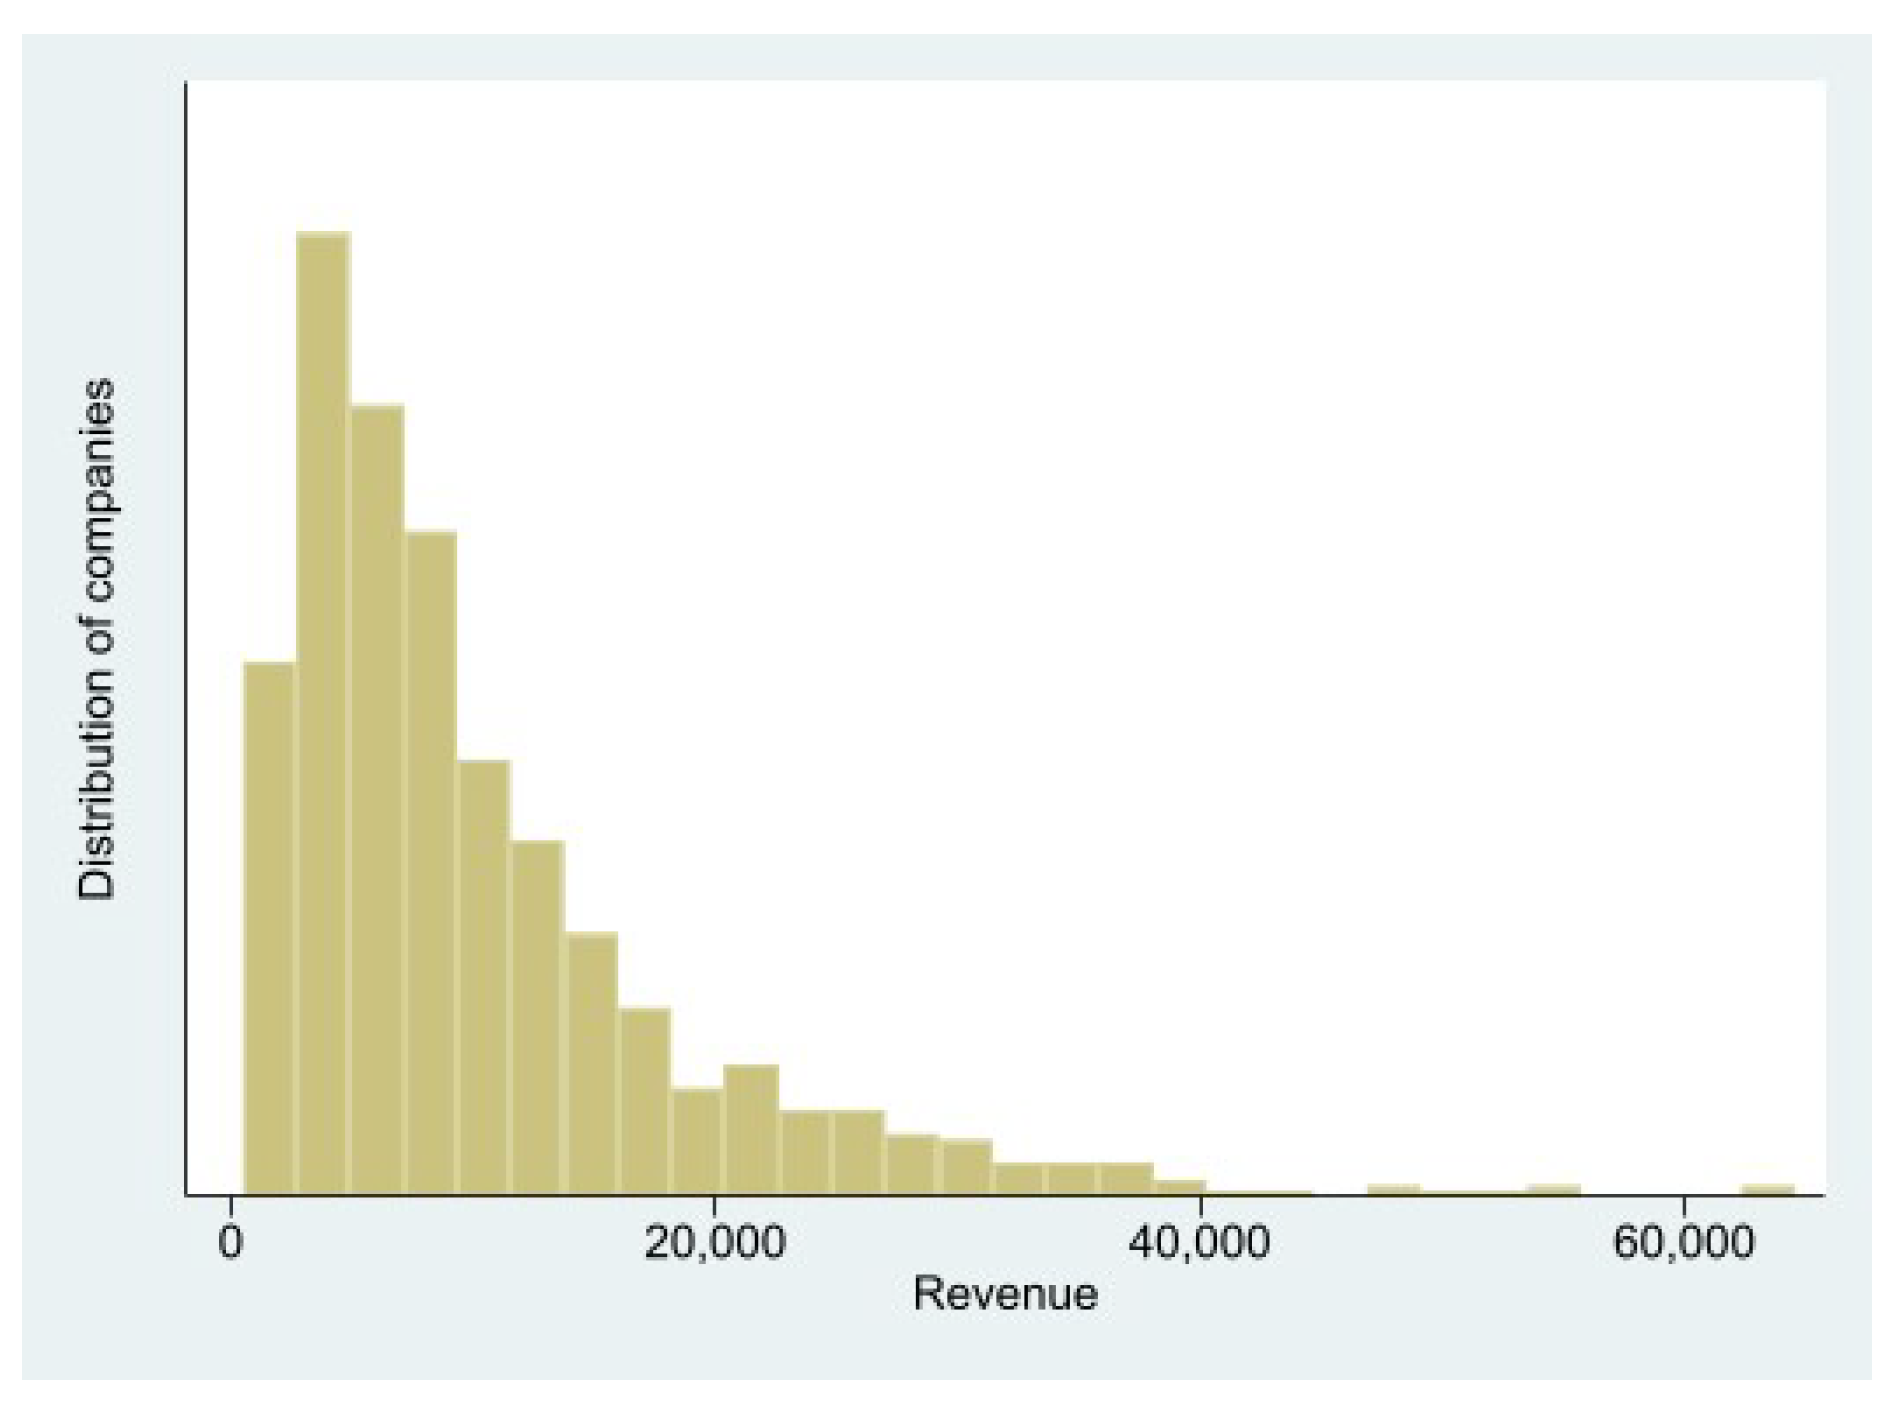
As mentioned above, the restaurant industry in Norway consists mainly of many small businesses that are regionally dispersed. This is illustrated in Figure 1.
The purpose of this paper is to analyse the dynamic elements related to growth and profit for Norwegian restaurants. Since there are few international studies on the topic, it is important to gain more insight into this sector. This will be of general interest. Furthermore, it is useful information for those involved in the sector, not least for banks and lenders. More knowledge is likely to be gained about the risks associated with lending to restaurants. In the important contribution of Mueller, he analysed the extent to which a company that has either higher- or lower-than-average profit rates approached the norm of profit rates in the sector over time Mueller (1986), which is the starting point of our analysis.
This article can be placed in the framework given in classical industry organisation theory or industrial economics within the structure–conduct–performance paradigm. The question of whether a company’s profits can persistently outperform the market is a central question in this theory Hirsch et al. (2021).
2. Profitability and Degree of Profit Persistence—Theory and Literature Review
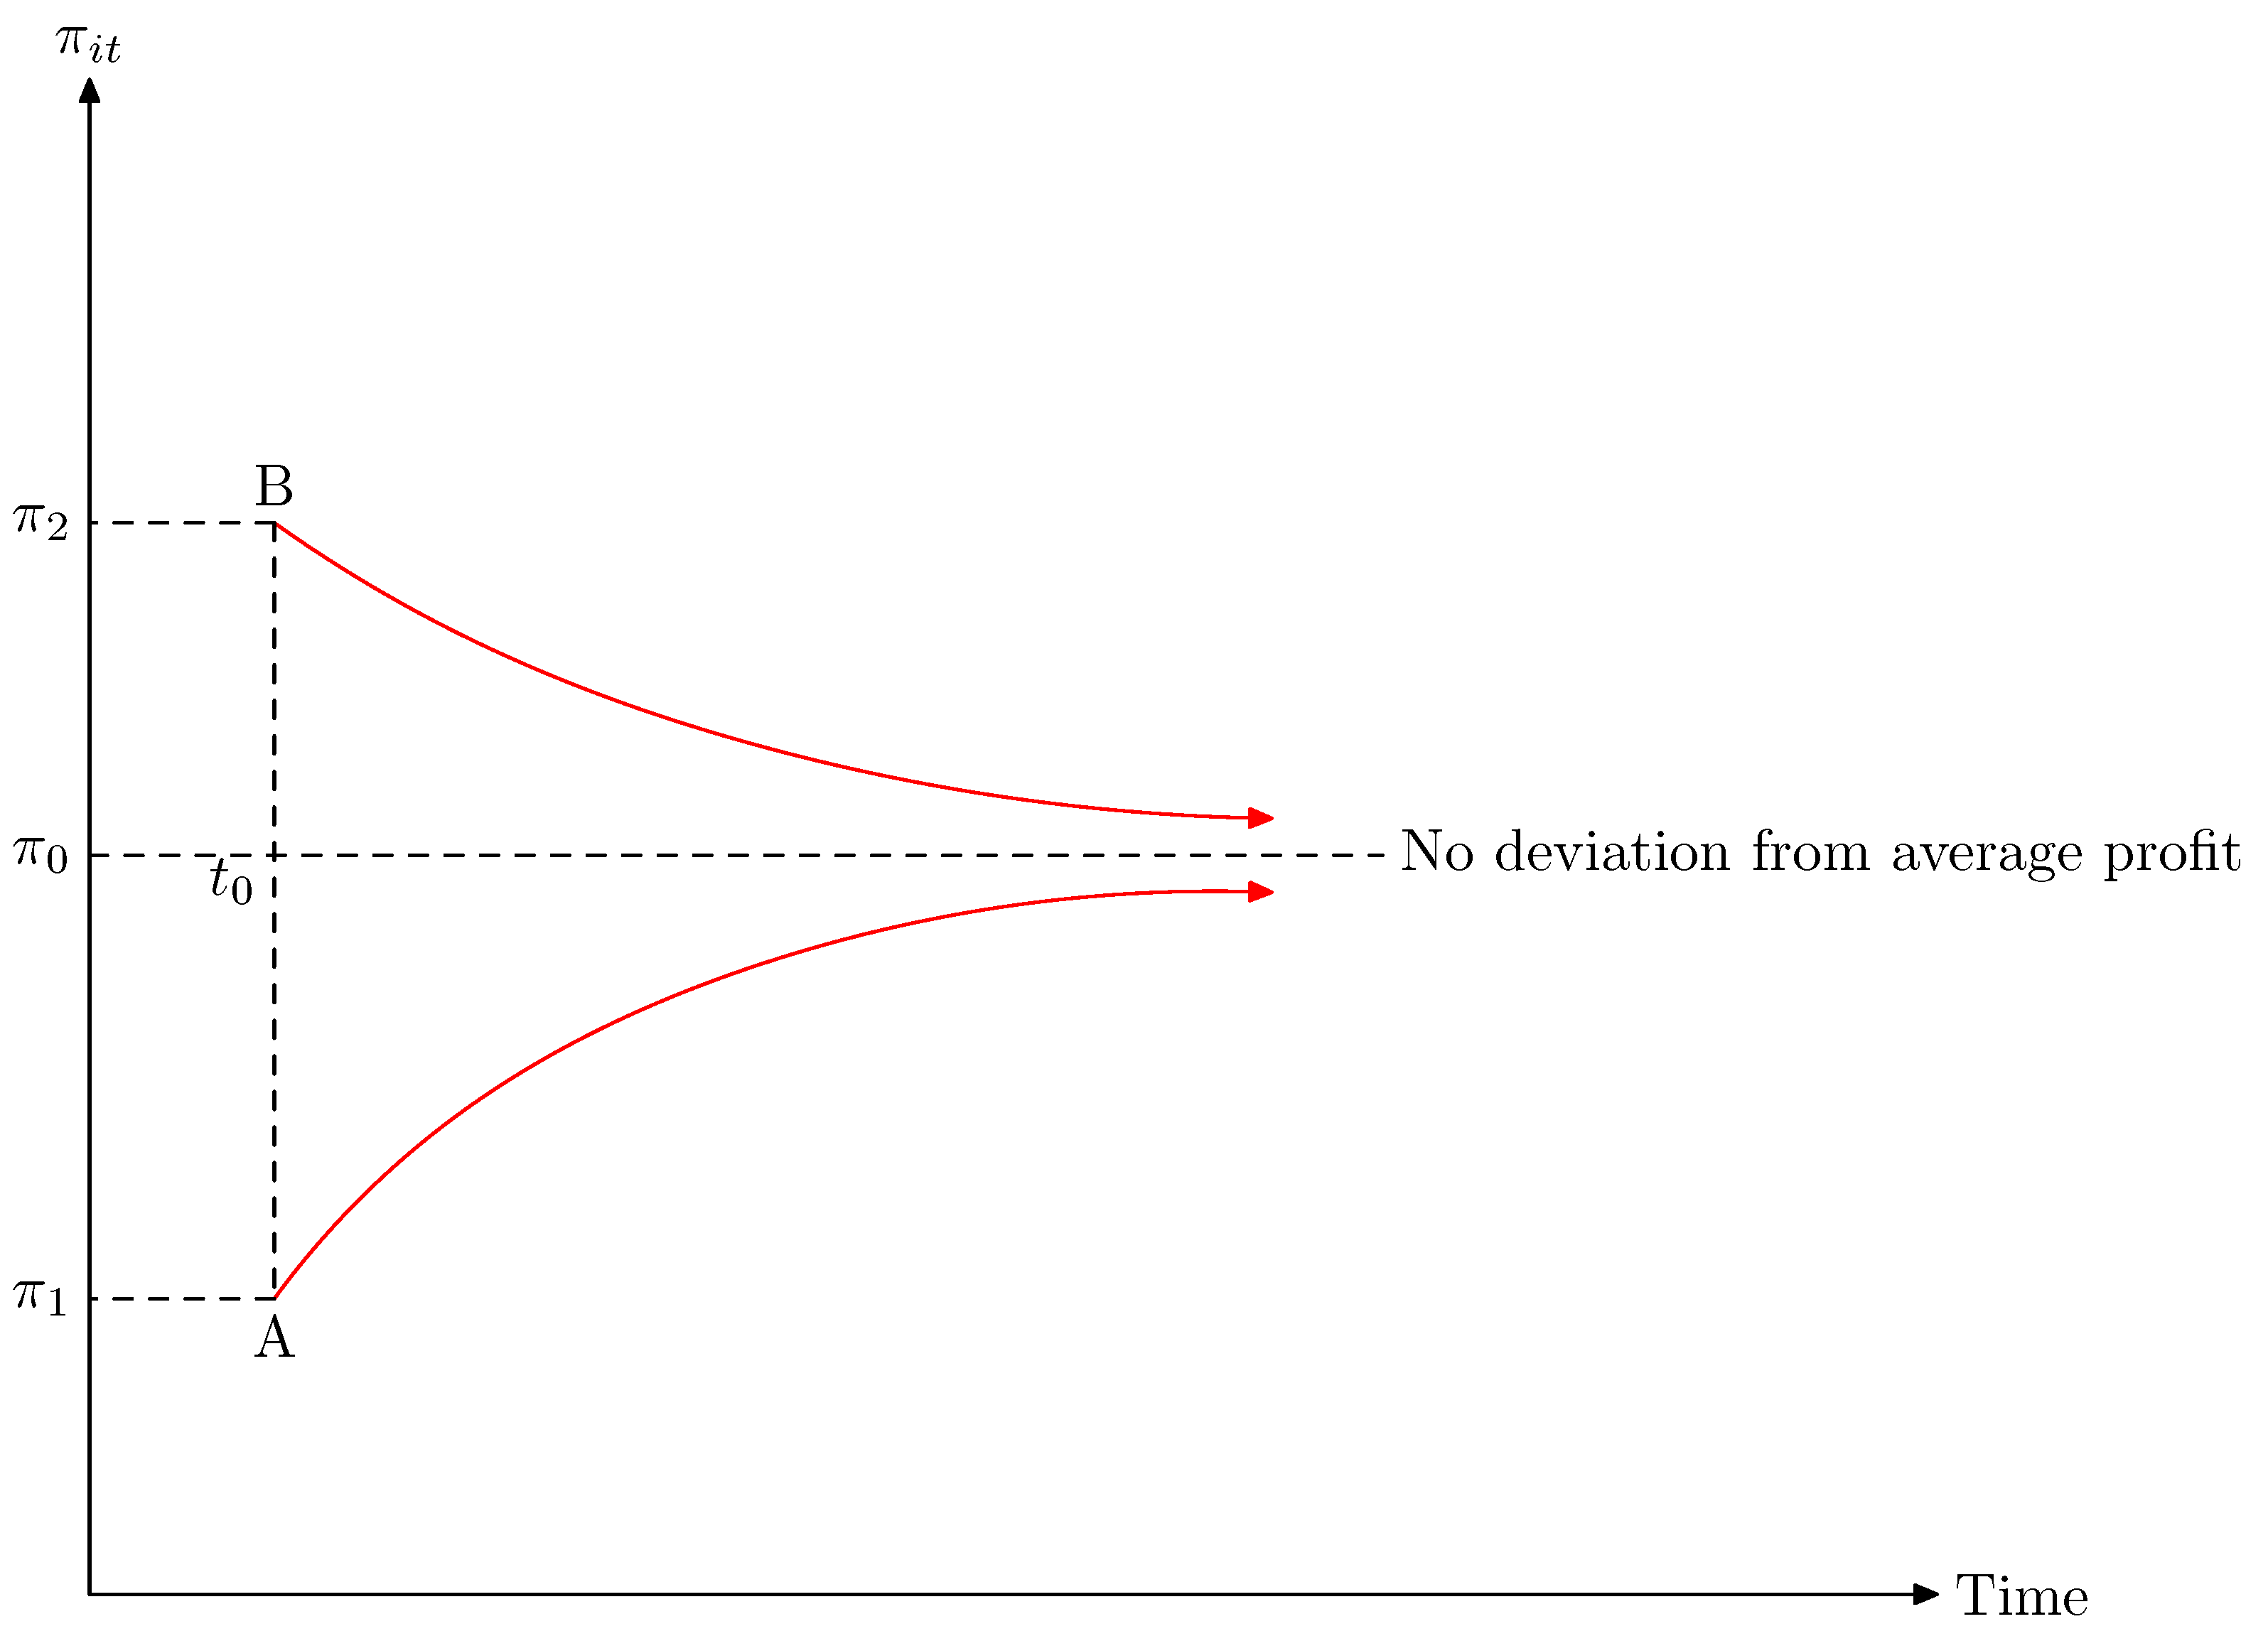
Profit and profitable operations are essential for a business to survive in the long term. A key goal of a business is to achieve high profits that can be divided among shareholders and owners. Mueller (1986) studied the development of firms’ profits in the long term. The method he used was to examine firms that had deviations from the average profit rate, either higher or lower levels, and if the profit rate for these companies converged over time to the norm for the industry. Examples of two possible cases of this convergence process are illustrated in Figure 2.
The mathematical presentation is:
The simple autoregressive (AR1) model is:
expresses the profit rate for firm i in period t defined as operating profit (EBIT) divided by sales revenues. is the average profit rate, is the deviation form the profit rate, and is a random error. The factor measures the speed of adjustment to the normal profit rate. Its value varies between 0 and 1. If the value is zero, there is no degree of profit persistence, since there will be a rapid adaptation to the normal profit rate level. The second extreme is that equals 1.0 (100 percent). In this case, once a deviation in profit occurs for a firm, it will persist into perpetuity. Usually, the degree of profit persistency lies between 10 and 40 percent, meaning that shocks in profit in one year persist with about 10 to 40 percent the next year. This is symmetric in the base model, with the interpretation being that those above want to stay above while those below want to reach the mean.
Mueller discussed the factors affecting the value of Mueller (1986). The better the classical market works, the closer to zero the value of will be, indicating a market with strong competition, homogeneous and simple products, good information, and ease of entry.
The literature discusses various factors that can contribute to profit persistence. One set identifies various isolation mechanisms. An isolation mechanism is any knowledge, physical, or legal barrier preventing a competitor from replicating a product Mazur (2013), Lepak et al. (2007); Rumelt (1984). There can be cases where it is too costly for competitors, and they are not willing to take the risk, or where the competitors are not able to imitate the product or services Madhok et al. (2010). The established companies may have such low costs that it is not possible for others to match them. Furthermore, some companies might have information or unique technical knowledge they benefit from. Other factors include localisation, loyal employees, financial situation, and good relations with customers or the authorities. In a market with differentiated products, companies can achieve high and sustained profits using strategic goals, portray the product as unique through advertising, as well as secure loyal customers Deszczynski (2021). Firms can offer client-specific solutions, which increases loyalty Muller and Zenker (2001).
The degree of profit persistence (PoP) varies across sectors Bhangu (2020). Labour-intensive sectors such as food processing tend to have a greater speed towards the average level of profit for the sector than knowledge-intensive business industries Gschwandtner and Hirsch (2018). There are several factors that can contribute to profit persistence within the restaurant industry. It is a heterogenous product with different levels of food quality and service quality Kim et al. (2021). Furthermore, there are different pricings and locations, and some restaurants focus on local food Severt et al. (2020). Some restaurants focus on sustainability Cantele and Cassia (2020); some have local roots, while others belong to an international brand. These aspects can connect customers to certain restaurants and contribute to increased loyalty. The result may be some degree of profit persistence. Based on this, we postulate the following hypothesis:
Hypothesis 1 (H1).
Despite low variation in turnover, there is still considerable risk associated with restaurant operations due to operational and financial leverage Skalpe (2003), Yoon and Jang (2005). A factor that might influence profitability is the level of working capital (difference between current assets and liabilities), which is an indicator of the company’s liquidity level (cash, accounts payable, etc.) Management of working capital is particularly important for small and medium-sized companies such as restaurants Teruel and Solano (2007). Working capital is needed for the firm to operate well. A low level may inhibit ongoing operations. Many researchers suggest there exists an optimal level of working capital Baños-Caballero et al. (2014). Hence, a considerably higher level of working capital than the optimal might reduce the profit rate. Companies adapt differently, and this may explain why the research shows a mixed result in terms of correlation between working capital and profit. This also applies to the restaurant industry Mun and Jang (2015). Therefore, we are open to the possibility that linking can be either negative or positive.
Hypothesis 2 (H2).
There is a correlation between working capital and profitability (profit deviation rate).
The financial cost through borrowing is higher than by self-financing. High debt can cause considerable interest costs, and this will reduce profits unless the firm has used the loan to make lucrative investments to compensate the increased costs. Some researchers have, therefore, found a positive correlation between debt and profit rate Dinh and Pham (2020), but most of the studies find a negative link Ali and Faisal (2020), Nguyen and Nguyen (2020), Nunes et al. (2009).
Hypothesis 3 (H3).
There is a negative relationship between the debt ratio and profitability (profit deviation rate).
Previous literature shows a mixed result between company size and profitability. This effect is likely to be different depending on the sector being analysed. If the largest companies are the most profitable, this may indicate that there are economies of scale. This is reflected in the study of Giotopoulos. He reports a significant positive correlation for retail trade, a significant negative correlation for hotels and restaurants, and no impact for transport Giotopoulos (2014). We postulate that there might be a relationship (positive or negative) for restaurants:
Hypothesis 4 (H4).
There is a correlation between firm’s size and profitability (profit deviation rate).
3. Law of Proportionate Effect (LPE)
The law of proportionate effect (LPE), also known as Gibrat’s law, assumes the growth rate is independent of the firm’s size Gibrat (1931). The mathematical model of LPE is:
where
is a constant, and is a random disturbance term. is the logarithmic value of size, measured by sales revenue, for firm i at time t.
If Gibrat’s law holds, the growth patterns for the firms will follow a random walk. Firm size in year t is best predicted by firm size in year . That is, growth is independent of the size and conditional on the size; any deviation in size (growth) will be random. This is the case if the value of is equal to 1.0. If is below 1.0, small companies will expand more than large ones, reflecting a long-term convergence towards perfect competition. The opposite is the case if is above 1.0, where there would be higher growth among large firms, and they will increase their market share, indicating a long-term convergence towards oligopoly or monopoly. Many empirical works have rejected the LPE Bentzen et al. (2012). Audretsch et al. suggest Gibrat’s law is valid for the Dutch hospitality industry Audretsch et al. (2004). Giotopoulos reports a mixed result Giotopoulos (2014), while Park and Jang suggest LPE does not hold for the restaurant industry, suggesting instead that small firms tend to grow faster than firms at the mean size Jang and Park (2011). The firms take advantage of scale economics until they reach the minimum efficient scale (MES). For Norwegian campsites, the simple version of Gibrat’s law was rejected, but the extended version was only partly rejected Valenta et al. (2021).
A broader version, proposed by Tschoegl extends the analysis to the error term Tschoegl (1983). The moving average parameter in Equation (4) defines the serial correlation of the disturbance terms from one period to the next period; if it is equal to 0, there is no serial correlation. The economic interpretation is that of a spill-over or inertia effect. If the parameter is significant, a positive or negative shock in the production level, in excess to the trend , will have an impact on the growth in the coming years. If it is insignificant, shocks are absorbed within the year it happens. The trend of firm size and its inertia when faced with shocks yields:
Hypothesis 5 (H5).
Firm growth is independent of the size ();
Hypothesis 6 (H6).
Success or fiasco in one year has no effect on growth in the next year .
Profit Rate and Growth
Based on economic theory, there is no obvious correlation between growth and profit. It depends on the cost structure of the enterprises. It can be argued that growth can contribute to improving profit, if growth increases the productivity or if there is an economy of scale Jang and Park (2011).
When exploring a firm’s dynamics, an important issue is the interlinkage between profitability and growth. Goddard et al. suggest those two factors are closely related from theoretical arguments Goddard et al. (2004). Previous profits make it easier to access capital for financing further growth. Hence, it is easier and less risky to invest and expand the production level. For some companies, not only profits but also size and growth are included in the company’s objective function. With increasing marginal cost there is a trade-off between growth and profit. In such cases, higher growth might decrease the profitability.
Fitzsimmons et al. argue that the strategic trade-off between growth and short-term profit depends on where the firm is in its life cycle Fitzsimmons et al. (2005). For newcomers, growth is required to exploit economics of scale through reinvestment, while well-established businesses may cash in after successful years.
According to Morettini et al., a firm’s growth is an indicator of success and can provide competitive advantages Morettini et al. (2020). On the other hand, rapid growth can lead to production problems and diminish the ability to generate profits. Some researchers even find a positive relationship between growth and profits Cowling (2004); Federico and Capelleras (2015); Morettini et al. (2020), though the empirical evidence of any link is mixed and weak Fitzsimmons et al. (2005); Markman and Gartner (2002); Yadav et al. (2021). The relationship between profit and growth varies between different sectors’ markets, firm behaviour, and cost structures Fitzsimmons et al. (2005). Therefore, one must be careful to generalise any connection between growth and profitability. For restaurants, some studies have found a negative link between previous growth and profitability Giotopoulos (2014); Jang and Park (2011).
In line with Giotopoulos (2014), we postulate the following hypotheses:
Hypothesis 7 (H7).
Past profitability is correlated with current growth;
Hypothesis 8 (H8).
Past growth is related to current profitability.
4. Methodology and Data
In the field of dynamic panel data estimation, which includes both Mueller’s and Gibrat’s analyses, the generalised method of moments (GMM) framework is usually the best approach, especially with short data sets (large N, small T). When the parameter of interest is expected to approach unity, the system GMM estimator developed by Blundell and Bond is best suited Blundell and Bond (1998), although it assumes that the variables have reached a steady state (which is rarely the case for all firms in a sector). Valenta et al. describe and use the different estimators that are relevant for dynamic panel data estimation Valenta et al. (2021).
To estimate and evaluate H7 and H8, the best approach is to use a framework that allows for the simultaneous estimation of both equations, as they occur at the same time. For this, we use a vector autoregressive (VAR) framework developed for panel data analysis. We use the PVAR estimator Holtz-Eakin et al. (1988); Binder et al. (2005), which was programmed into Stata Abrigo and Love (2016). It is based on the same GMM framework as we use in the remaining hypotheses, but extended to the vector case where we use two endogenous variables.
The Sample
The financial account information of Norwegian firms are available at a public register (Brønnøysund Register Centre). From this register, we collected accounting information from restaurants that have existed for the past ten years. In total, we used 866 restaurants for the analysis, which existed during the period from 2010 to 2019. Table 1 shows the descriptive statistics of the selected companies.
The mean profit rate is rather low (around 3–4 percent), while the largest restaurant included had a five percent market share. The mean growth, debt, and salary rate was 6.6, 29, and 37 percent. Working capital (4) is defined as current assets minus current liabilities divided by revenue. All our explanatory variables were divided by firm revenue (sales) and expected market share (being divided by industry revenue).
5. The Models
In addition to the original relationship of Mueller (1986) (see relationship (2)), we had an extended version, including several company-specific elements (growth, size, working capital, and debt). In another version, the share of salaries is also included in Equation (5):
where i is the firm number and t is the period (year). LPE was tested using relationships (3) and (4), where a heteroskedasticity test of the variation in unit with regard to size completed Tschoegl’s stricter version of Gibrat’s law; that is, a test of whether in was related to size. The most econometrically inclined papers apply a system GMM framework to the estimation and subsequent testing of the LPE Giotopoulos (2014); Hirsch and Gschwandtner (2013). Using GMM instead of OLS has the advantage of yielding consistent and unbiased estimates of both (PoP) and (LPE), as OLS will struggle with feedback-bias. Using system GMM instead of difference GMM is superior as the parameter of interest approaches unity, a case most relevant for Gibrat’s law, where the null hypothesis is equal to unity.
The two-model specification for testing Hypotheses 7 and 8 are:
where is the profit rate for firm i at time t. The model included only the last period for growth and profit rate. These equations can be estimated one-by-one with the same estimator as above, but are best estimated simultaneously through a vector GMM framework.
6. Findings
Table 2 and Table 3 present the results of the regression models. Using the method of Mueller, the degree of profit persistence was significantly positive and around 0.25, confirming hypothesis 1 () Mueller (1986). Controlling for firm-specific characteristics changed little for . However, the value of was lower in model three (which included salary rates) than in model two. The inclusion of the salary rate reduced most of the parameter significance, except for the size effect. Furthermore, there was a significant positive relationship between working capital and profitability (rate in deviation of sector mean), meaning that H2 was confirmed. In both versions (models two and three), there was a significant link between debt ratio and profitability (H3 was confirmed). There was a negative connection between the size and profitability (H4 was confirmed).
As for Gibrat’s law of proportional effect, the value of was below 1.0 in both models, leading to a rejection of proportional effect in both cases (at the one percent significance level). Hypothesis 5 was rejected, and so was Hypothesis 6, as the firms experienced a significant, though economically small, level of inertia to their deviations from trend.
Thus far, we estimated simple autoregressive processes for the size and profit rate (deviation), finding that the size was mean-reverting with a slight inertia in deviations, while deviations from the mean profit rate maintained about 25 percent in the next period. In the next table, we estimate the cross-relation of growth and profit—that is, while controlling for both autoregressive trends. Since we are interested in real values here, the profit rate is no longer in deviation.
To perform the estimation correctly, the best approach is to run all four relations simultaneously, which was completed in model six. There was no significant effect of the profit rate on revenue in the simultaneous model (H7 was rejected). The effect of size on the profit rate was robust, negative, and significant (H8 was confirmed). The results are shown in Table 4.
7. Discussion
7.1. Profitability and Degree of Profit Persistence (PoP) (Hypotheses 1–5)
Following the model of Mueller, the coefficient of the speed of adjustment to the normal level was around 0.2 Mueller (1986). This was the same level Opstad et al. found for Norwegian campsites Opstad et al. (2021). The level of profit persistence varies across sectors. For all sectors, Hirsch reported a significant positive value of Hirsch (2018, ). The value tends to be high in the financial sector and low in the service sector. Our finding is in line with previous research. Even if there are small establishment costs and few other barriers to enter the sector, there are still some isolation mechanisms. This probably explains why our study identifies significant positive profit persistence. For the restaurant industry, it may be that a firm focuses on different products that attract specific customer groups. This can ensure loyal customer groups, but if other businesses can copy the product, the degree of profit persistence will be limited. Customers often have a lack of information about an individual restaurant. By being connected to a chain that one trusts, this helps the chain to gain more customers and increase profitability. As for the rest of the business firms, the management of the company will have a major impact on profitability.
Previous studies have shown that the degree of profit persistence tends to decline when controlling for business-specific variables. This study confirms this result. Model two shows a lower value of than model one (Table 2). By including salary shares as an explanatory factor, the value of lambda is reduced but it is still statistically significant at 5 percent. It is also logical that including corporate-specific characteristics decreases the degree of profit persistence.
Working capital management is important for the economic performance of the firm Enqvist et al. (2014). The finding in this study confirms this. A higher level of working capital was positively related to profitability. However, too low or too a high level of working capital can reduce the level of the profit rate Mun and Jang (2015).
A negative relationship between the debt ratio and profit deviation rate is in line with other studies Bartoloni and Baussola (2009), Opstad et al. (2021). High debt imposes financial costs on the company. It can be a financial burden and reduces the chances of achieving good performance. A high debt ratio will, therefore, reduce profitability.
Gschwandtner et al. reported a significant positive link between the firm size and profitability deviating from the norm for the food-processing industry Gschwandtner and Hirsch (2018). The interpretation is that there is an economy of scale for these companies. Large firms achieve a higher profit rate than small ones.
Giotopoulos reported a negative relationship for hotels and restaurants using data from Greece Giotopoulos (2014). Small firms tend to outperform large firms. This study confirmed this result. The interpretation is that there is a dis-economy of scale for the Norwegian restaurant industry. One explanation is that this is a labour-intensive industry that favors small businesses.
There was a strong negative correlation between the salary rate and the profit deviation from the norm. One possible explanation is that companies with a high wage share are more inefficient compared with the others.
7.2. Law of Proportionate Effect (LPE) (Hypotheses 5–6)
The coefficient was below unity in this study, and we rejected the hypothesis of random walk for the restaurant companies (H5). Park and Jang reported that Gibrat’s law does not hold for restaurants since very small and micro firms have difficulties growing quickly Jang and Park (2011). Larger firms take advantages of scale economics but only to certain level. Firms above the MES cannot benefit from economics of scale; therefore, they grow more slowly. The highest growth was among small firms below the MES. Park and Jang emphasised that this result might vary from country to country Jang and Park (2011). There are probably fewer small and family-owned restaurants in Norway than in many other countries. This might explain the different results. Smaller restaurants that have been in the industry for at least ten years face proportionately faster growth than their larger counterparts. Further research should analyse how entry and exit affect this, as well as the trend of firms that enter and exit.
Notice that H6 was also rejected. If a company does anything extraordinary one year, which contributes to lower or higher growth, this does impact the result the following year. The disturbance will not be a random walk. However, this disturbance was rather small and positive. A success one year will also have a positive impact on the result in the following year, and a year with a particularly poor performance will have consequences for the following year. The deviation can, therefore, not only be due to chance. However, the effect was rather small. It may well be that some companies are creative and innovative. However, if this is quickly copied by others, then this effect greatly decreases.
7.3. Profit Rate and Growth (Hypotheses 7–8)
Previous articles point out that there is no unambiguous correlation between growth and profit. According to Jang and Park (2011), high profit rates will have a positive influence on growth until the profit rates attain zero. After this point, further growth will have a negative impact on profit, since marginal costs are above marginal income. This might explain the significant negative correlation between past growth and present profit rates (Model 6). Our finding is in line with previous reports for the restaurant industry Giotopoulos (2014). One possible reason for why some companies have higher production than the level that provides a profit maximum may be that many of the restaurants have objectives other than maximizing profits Skalpe (2003). Ownership can give social prestige and the opportunity to cultivate an interest in food. However, choosing a higher level of production than the MES (minimum efficient scale) means the marginal costs are higher than marginal income. Hence, the profit rate declines.
8. Limitations
Since this article relies on official statistics, access to variables that identify a specific company’s characteristics is limited. As a result, we could analyse different factors more deeply by investigating, for example, the extent to which companies have objectives other than maximising profits. There may also be some errors in the reported figures. It is probable that larger companies are more professional, providing more accurate data than the small companies. Therefore, the data may not reflect the same type of information. Some firms can also deliberately give incorrect accounting figures, since it affects the tax level. Another weakness is that the data can give inaccurate figures on the value of the companies.
9. Conclusions
There are many published research articles about the restaurant industry, but few analyse the dynamic development of growth and profit, which is researched in this study.
This research into the Norwegian restaurant industry has shown several interesting results, mostly in line with previous findings. Gibrat’s law does not apply, since small companies grow faster than larger companies. There is a dis-economy of scale for the sector, since the profitability is negatively related to size. This means that small businesses have higher growth and higher profit rates than larger ones. Firms above the MES will obtain reduced profit rates, and there is trade-off between size and profit. This research found a negative correlation between the debt rate and profitability and a positive link between working capital and profitability.
Author Contributions
All authors contributed equally to this work. All authors have read and agreed to the published version of the manuscript.
Funding
This research received no external funding.
Institutional Review Board Statement
Not applicable.
Informed Consent Statement
Not applicable.
Data Availability Statement
Not applicable.
Conflicts of Interest
The authors declare no conflict of interest.
References
- Abrigo, Michael R. M., and Inessa Love. 2016. Estimation of panel vector autoregression in stata. The Sage Journal 16: 778–804. [Google Scholar] [CrossRef] [Green Version]
- Ali, Anis, and Shaha Faisal. 2020. Capital structure and financial performance: A case of Saudi petrochemical industry. Journal of Asian Finance, Economics, and Business 7: 105–12. [Google Scholar] [CrossRef]
- Audretsch, David B., Luuk Klomp, Enrico Santarelli, and A. Roy Thurik. 2004. Gibrat’s Law: Are the services different? Review of Industrial Organization 24: 301–24. [Google Scholar] [CrossRef] [Green Version]
- Baños-Caballero, Sonia, Pedro J. García-Teruel, and Pedro Martínez-Solano. 2014. Working capital management, corporate performance, and financial constraints. Journal of Business Research 67: 332–38. [Google Scholar] [CrossRef]
- Bartoloni, Eleanora, and Maurizio Baussola. 2009. The persistence of profits, sectoral heterogeneity and firms’ characteristics. International Journal of the Economics of Business 16: 87–111. [Google Scholar] [CrossRef]
- Bentzen, Jan, Erik Madsen, and Valdemar Smith. 2012. Do firms’ growth rates depend on firm size? Small Business Economics 39: 937–47. [Google Scholar] [CrossRef]
- Bhangu, Parneet Kaur. 2020. Persistence of profitability in top firms: Does it vary across sectors? Competitiveness Review: An International Business Journal 30: 269–87. [Google Scholar] [CrossRef]
- Binder, Michael, Cheng Hsiao, and M. Hashem Pesaran. 2005. Estimation and inference in short panel vector autoregressions with unit roots and cointegration. Econometric Theory 21: 795–837. [Google Scholar] [CrossRef] [Green Version]
- Blundell, Richard, and Stephen Bond. 1998. Initial conditions and moment restrictions in dynamic panel data models. Journal of Econometrics 87: 115–43. [Google Scholar] [CrossRef] [Green Version]
- Cable, John R., and Dennis C. Mueller. 2008. Testing for persistence of profits’ differences across firms. International Journal of the Economics of Business 15: 201–28. [Google Scholar] [CrossRef]
- Cantele, Silvia, and Fabio Cassia. 2020. Sustainability implementation in restaurants: A comprehensive model of drivers, barriers, and competitiveness-mediated effects on firm performance. International Journal of Hospitality Management 87: 102510. [Google Scholar] [CrossRef]
- Cowling, Marc. 2004. The Growth—Profit Nexus. Small Business Economics 22: 1–9. [Google Scholar] [CrossRef]
- Deszczynski, Bartosz. 2021. Firm Competitive Advantage Through Relationship Management. Cham: Springer Nature Switzerland AG. [Google Scholar] [CrossRef]
- Dinh, Hung The, and Cuong Duc Pham. 2020. The effect of capital structure on financial performance of Vietnamese listing pharmaceutical enterprises. Journal of Asian Finance, Economics, and Business 7: 329–40. [Google Scholar] [CrossRef]
- Enqvist, Julius, Michael Graham, and Jussi Nikkinen. 2014. The impact of working capital management on firm profitability in different business cycles: Evidence from Finland. Research in International Business and Finance 32: 36–49. [Google Scholar] [CrossRef]
- Federico, Juan S., and Joan-Lluis Capelleras. 2015. The heterogeneous dynamics between growth and profits: The case of young firms. Small Business Economics 44: 231–53. [Google Scholar] [CrossRef]
- Fitzsimmons, Jason R., Paul Steffens, and Evan J. Douglas. 2005. Growth and profitability in small and medium sized Australian firms. Paper presented at AGSE Entrepreneurship Exchange, Conference, Melbourne, Australia, February 1–4. [Google Scholar]
- García-Teruel, Pedro Juan, and Pedro Martínez-Solano. 2007. Effects of working capital management on SME profitability. International Journal of Managerial Finance 3: 164–77. [Google Scholar] [CrossRef]
- Gibrat, Robert. 1931. Les inégalits économiques. Paris: Sirey. [Google Scholar]
- Giotopoulos, Joannis. 2014. Dynamics of firm profitability and growth: Do knowledge-intensive (business) services persistently outperform? International Journal of the Economics of Business 21: 291–319. [Google Scholar] [CrossRef]
- Goddard, John, Phil Molyneux, and John O. S. Wilson. 2004. Dynamics of growth and profitability in banking. Journal of Money, Credit and Banking 36: 1069–90. [Google Scholar] [CrossRef]
- Gschwandtner, Adelina, and Stefan Hirsch. 2018. What drives firm profitability? A comparison of the US and EU food processing industry. The Manchester School 86: 390–416. [Google Scholar] [CrossRef] [Green Version]
- Hirsch, Stefan, and Adelina Gschwandtner. 2013. Profit persistence in the food industry: Evidence from five European countries. European Review of Agricultural Economics 40: 741–59. [Google Scholar] [CrossRef] [Green Version]
- Hirsch, Stefan, David Lanter, and Robert Finger. 2021. Profitability and profit persistence in EU food retailing: Differences between top competitors and fringe firms. Agribusiness 37: 235–63. [Google Scholar] [CrossRef]
- Hirsch, Stefan. 2018. Successful in the long run: A meta-regression analysis of persistent firm profits. Journal of Economic Surveys 32: 23–49. [Google Scholar] [CrossRef]
- Holtz-Eakin, Douglas, Whitney Newey, and Harvey S. Rosen. 1988. Estimating Vector Autoregressions with Panel Data. Econometrica 56: 1371–95. [Google Scholar] [CrossRef]
- Jang, SooCheong (Shawn), and Kwangmin Park. 2011. Inter-relationship between firm growth and profitability. International Journal of Hospitality Management 30: 1027–35. [Google Scholar] [CrossRef]
- Kim, Eojina, Juan Luis Nicolau, and Liang (Rebecca) Tang. 2021. The Impact of Restaurant Innovativeness on Consumer Loyalty: The Mediating Role of Perceived Quality. Journal of Hospitality & Tourism Research 45: 1464–88. [Google Scholar] [CrossRef]
- Lepak, David P., Ken G. Smith, and M. Susan Taylor. 2007. Value Creation and Value Capture. A Multilevel Perspective. Academy of Management Review 2: 180–94. [Google Scholar] [CrossRef] [Green Version]
- Madhok, Anoop, Sali Li, and Richard L. Priem. 2010. The resource-based view revisited: Comparative firm advantage, willingness-based isolating mechanisms and competitive heterogeneity. European Management Review 7: 91–100. [Google Scholar] [CrossRef]
- Markman, Gideon D., and William B. Gartner. 2002. Is extraordinary growth profitable? A study of Inc. 500 high–growth companies. Entrepreneurship Theory and Practice 27: 65–75. [Google Scholar] [CrossRef]
- Mazur, Karolina. 2013. Isolating mechanisms as sustainability factors of resource-based competitive advantage. Management 17: 31. [Google Scholar] [CrossRef] [Green Version]
- Morettini, Lucio, Bianca Potì, and Roberto Gabriele. 2020. Persistent fast growth and profitability (CNR-IRCrES Working Paper 10/2020). Istituto di Ricerca sulla Crescita Economica Sostenibile. Available online: http://dx.doi.org/10.23760/2421-7158.2020.010 (accessed on 16 January 2022).
- Mueller, Dennis C. 1986. Profits in the Long Run. Cambridge: Cambridge University Press. [Google Scholar]
- Muller, Emmanuel, and Andrea Zenker. 2001. Business services as actors of knowledge transformation: The role of KIBS in regional and national innovation systems. Research Policy 30: 1501–16. [Google Scholar] [CrossRef]
- Mun, Sung Gyun, and SooCheong (Shawn) Jang. 2015. Working capital, cash holding, and profitability of restaurant firms. International Journal of Hospitality Management 48: 1–11. [Google Scholar] [CrossRef]
- Nguyen, Hieu Thanh, and Anh Huu Nguyen. 2020. The impact of capital structure on firm performance: Evidence from Vietnam. Journal of Asian Finance, Economics, and Business 7: 97–105. [Google Scholar] [CrossRef]
- Nunes, Paulo J. Maçãs, Zélia M. Serrasqueiro, and Tiego N. Sequeira. 2009. Profitability in Portuguese service industries: A panel data approach. The Service Industries Journal 29: 693–707. [Google Scholar] [CrossRef]
- Opstad, Leiv, Johannes Idsø, and Robin Valenta. 2021. The degree of profit persistence in tourism industry. The case of Norwegian campsites. International Journal of Economics and Business Administration 9: 140–55. [Google Scholar] [CrossRef]
- Rumelt, Richard P. 1984. Towards a strategic theory of the firm. Competitive Strategic Management 26: 556–70. [Google Scholar]
- Severt, Kimberly, Yeon Ho Shin, Hsiangting Shatina Chen, and Robin P. DiPietro. 2020. Measuring the Relationships between Corporate Social Responsibility, Perceived Quality, Price Fairness, Satisfaction, and Conative Loyalty in the Context of Local Food Restaurants. International Journal of Hospitality & Tourism Administration, 1–23. [Google Scholar] [CrossRef]
- Skalpe, Ole. 2003. Hotels and restaurants—Are the risks rewarded? Evidence from Norway. Tourism Management 24: 623–34. [Google Scholar] [CrossRef]
- Tschoegl, Adrian E. 1983. Size, growth, and transnationality among the world’s largest banks. Journal of Business 56: 187–201. [Google Scholar] [CrossRef]
- Valenta, Robin, Johannes Idsø, and Leiv Opstad. 2021. Evidence of a Threshold Size for Norwegian Campsites and Its Dynamic Growth Process Implications—Does Gibrat’s Law Hold? Economies 9: 175. [Google Scholar] [CrossRef]
- Van Veldhoven, Ziboud, Paulien Aerts, Sanne Lies Ausloos, Jente Bernaerts, and Jan Vanthienen. 2021. The Impact of Online Delivery Services on the Financial Performance of Restaurants. Paper presented at 7th International Conference on Information Management, London, UK, March 27–29; pp. 13–17. [Google Scholar] [CrossRef]
- Yadav, Inder Sekhar, Debasis Pahi, and Rajesh Gangakhedkar. 2021. The nexus between firm size, growth and profitability: New panel data evidence from Asia–Pacific markets. European Journal of Management and Business Economics. Volume and page ahead-of-print. [Google Scholar] [CrossRef]
- Yoon, Eunju, and SooCheong Jang. 2005. The effect of financial leverage on profitability and risk of restaurant firms. The Journal of Hospitality Financial Management 13: 35–47. [Google Scholar] [CrossRef] [Green Version]
Figure 1.
Most restaurants in Norway have revenue less than NOK 20 million per year (approximately EUR 2 million).
Figure 1.
Most restaurants in Norway have revenue less than NOK 20 million per year (approximately EUR 2 million).

Figure 2.
The figure shows two companies, A and B, where the profit rate deviations from the average profit rate in the industry at time are and , respectively. The profit rate converges towards a state where there is no difference between the two companies’ profit rates and the industry average. The factor in Equation (2) measures the speed of adjustment to the normal profit rate.


Table 1.
Descriptive statistics of the selected companies.
| Variable | Mean | St. Dev. | Min | Max |
|---|---|---|---|---|
| Revenue (1) | 11,096 | 14,150 | 496 | 287,973 |
| Profit rate | 0.0378 | 0.0644 | −0.347 | 0.367 |
| Market share | 0.0013 | 0.0021 | 0.000 | 0.052 |
| Growth rate (2) | 0.0657 | 0.1185 | −0.128 | 0.910 |
| Debt rate (3) | 0.2947 | 0.2021 | 0.071 | 1.642 |
| Working capital (4) | 0.0173 | 0.1585 | −1.302 | 1.810 |
| Salary rate (3) | 0.3738 | 0.0762 | 0.0427 | 0.6072 |
| Employees | 17.55 | 14.09 | 1 | 95 |
(1) NOK 1000 (Norwegian Kroner). (2) Growth rate = (Salesit − Salesi,t−1)/Salesi,t−1. (3) Share of turnover. (4) Working capital is Current Assets minus Current Liabilities divided by revenue.
Table 2.
Profitability and profit persistence (PoP).
| Variable | Model 1 | Model 2 | Model 3 |
|---|---|---|---|
| Profit Deviation | Profit Deviation | Profit Deviation | |
| Equation (2) | Equation (6) without Salary | Equation (6) | |
| Profit rate | 0.247 *** | 0.258 *** | 0.150 ** |
| dev. | (0.0125) | (0.0122) | (0.0090) |
| Growth rate | 0.620 *** | 0.368 *** | |
| (0.0461) | (0.0341) | ||
| Market share | −12.202 * | −17.693 *** | |
| (6.2129) | (4.5794) | ||
| Debt ratio | −1.499 *** | −1.371 ** | |
| (0.1250) | (0.0922) | ||
| Working | 1.349 *** | 0.879 *** | |
| capital | (0.1509) | (0.1114) | |
| Salary rate | −17.441 *** | ||
| (0.2769) | |||
| Constant | −0.259 *** | 0.127 *** | 6.650 *** |
| (0.0136) | (0.1299) | (0.1078) | |
| No. of firms (N) | 866 | 866 | 866 |
Standard errors in parentheses *** p < 0.01, ** p < 0.05, * p < 0.1.
Table 3.
LPE (Law of proportionate effect).
| Variable | Model 4 | Model 5 |
|---|---|---|
| LPE, Equation (3) | LPE, Equations (3) and (4) | |
| Revenue | 0.688 *** | 0.789 *** |
| (0.0146) | (0.0156) | |
| Deviation from trend | 0.042 *** | |
| (0.0119) | ||
| Constant | 2.811 *** | 1.903 *** |
| (0.1299) | (0.1392) | |
| No. of firms (N) | 866 | 866 |
Standard errors in parentheses *** p < 0.01.
Table 4.
Profit rate and growth.
| Hypotheses 7–8 | Model 6 | Model 6 |
|---|---|---|
| Variables | L.revenue | Profrate |
| L.revenue (t − 1) | 0.584 *** | −0.069 *** |
| (0.0276) | (0.0109) | |
| Profrate (t − 1) | −0.087 | 0.337 *** |
| (0.0736) | (0.0303) | |
| No. of firms (N) | 866 | 866 |
Standard errors in parentheses *** p < 0.01. L. means log.
Publisher’s Note: MDPI stays neutral with regard to jurisdictional claims in published maps and institutional affiliations. |
© 2022 by the authors. Licensee MDPI, Basel, Switzerland. This article is an open access article distributed under the terms and conditions of the Creative Commons Attribution (CC BY) license (https://creativecommons.org/licenses/by/4.0/).
Share and Cite
MDPI and ACS Style
Opstad, L.; Idsø, J.; Valenta, R. The Dynamics of the Profitability and Growth of Restaurants; The Case of Norway. Economies 2022, 10, 53. https://doi.org/10.3390/economies10020053
AMA Style
Opstad L, Idsø J, Valenta R. The Dynamics of the Profitability and Growth of Restaurants; The Case of Norway. Economies. 2022; 10(2):53. https://doi.org/10.3390/economies10020053
Chicago/Turabian StyleOpstad, Leiv, Johannes Idsø, and Robin Valenta. 2022. "The Dynamics of the Profitability and Growth of Restaurants; The Case of Norway" Economies 10, no. 2: 53. https://doi.org/10.3390/economies10020053
Note that from the first issue of 2016, this journal uses article numbers instead of page numbers. See further details here.