Article

Improper Light Curing of Bulkfill Composite Drives Surface Changes and Increases S. mutans Biofilm Growth as a Pathway for Higher Risk of Recurrent Caries around Restorations

by
Haifa Maktabi
1,
Maria Salem Ibrahim
2,3,
Abdulrahman A. Balhaddad
2,4,
Qoot Alkhubaizi
1,
Isadora Martini Garcia
5,
Fabrício Mezzomo Collares
5,
Howard Strassler
1,
Ana Paula P. Fugolin
6,
Carmem S. Pfeifer
6 and
Mary Anne S. Melo
1,2,*
1
Division of Operative Dentistry, Department of General Dentistry, University of Maryland School of Dentistry, Baltimore, MD 21201, USA
2
Ph.D. Program in Biomedical Sciences, University of Maryland School of Dentistry, Baltimore, MD 21201, USA
3
Department of Preventive Dental Sciences, College of Dentistry, Imam Abdulrahman Bin Faisal University, Dammam 31411, Saudi Arabia
4
Department of Restorative Dental Sciences, College of Dentistry, Imam Abdulrahman Bin Faisal University, Dammam 31411, Saudi Arabia
5
Dental Materials Laboratory, School of Dentistry, Federal University of Rio Grande do Sul, Rua Ramiro Barcelos, 2492, Rio Branco, Porto Alegre 90035-003, Brazil
6
Division of Biomaterials and Biomechanics, Department of Restorative Dentistry, School of Dentistry, Oregon Health & Science University, Portland, OR 97239, USA
*
Author to whom correspondence should be addressed.
Dent. J. 2021, 9(8), 83; https://doi.org/10.3390/dj9080083
Submission received: 21 May 2021 / Revised: 15 July 2021 / Accepted: 26 July 2021 / Published: 30 July 2021

Abstract

:
How dentists cure a resin-based material has deleterious effects on the material’s properties and its interaction with surrounding dental tissues. Biofilm accumulation has been implicated in the pathogenesis of carious lesions around dental restorations, with its composition manifesting expressed dysbiosis in patients suffering from dental caries. To evaluate the influence of varying radiant exposure on the degree of conversion (DC%), Streptococcus mutans biofilm growth, and surface roughness of bulk-fill composites under different light-curing conditions. Two light-curing units (LCU) at 600 and 1000 mW/cm2 were used to simulate curing conditions with different angulations (∢20° and ∢35°) or 2 mm-distance displacements of the LCU tip. The radiant exposure (RE) was assessed, and the composites were analyzed for DC%. Biofilm formation was induced over the bulk-fill composites and analyzed via colony-forming units counting and scanning electron microscopy (SEM). The surface roughness was analyzed via a profilometer and SEM after biofilm formation. Curing conditions with different angulation or displacement decreased RE compared to the “optimal condition”. The moderately (∢35°) angulated LCU tip and low (600 mW/cm2) radiant emittance significantly reduced the DC% (p < 0.05). The difference in DC% between the top and bottom of the composites ranged from 8 to 11% for 600 mW/cm2 and 10 to 20% for 1000 mW/cm2. Greater S. mutans biofilm and surface changes were found in composites with non-optimal RE delivery (e.g., tip displacement and angulation) (p < 0.05). Inadequate polymerization of bulk-fill composites was associated with more biofilm accumulation and surface topography changes. Overall, non-optimally performed curing procedures reduced the amount of delivered RE, which led to low DC%, more biofilm formation, and higher surface roughness. The improper light-curing of bulk-fill composites compromises their physicochemical and biological properties, which could lead to inferior clinical performance and reduced restorative treatments’ longevity.

1. Introduction

Appropriated photoactivation that enables optimal curing and cross-linking of polymer chains is essential for a reliable dental resin behavior [1,2]. Photopolymerization may become even more critical for clinical success with the increasing use of bulk-fill composites presenting different photoinitiators, monomer composition, and filler content [3]. Bulk-fill composites underpin modern restorative dentistry. This class of composites was developed to overcome limitations associated with conventional resin-based composites (RBCs), such as limited depth of cure and polymerization shrinkage [4,5].
Bulk-fill composites allow placement in increments up to 4–5 mm thick, which can speed up the restorative procedure, minimize oral fluid contamination, and eliminate the potential for voids between layers [6]. On the other hand, conventional RBCs should be limited to 2 mm increments to allow adequate light transmittance [7]. The light transmittance differs between these two types of composites. Bulk-fill composite is more translucent and has a higher depth of cure than conventional RBCs [8,9]. The light transmittance up to 4 mm can also be attributed to a different photoinitiator incorporated into the bulk-fill composite system [9]. Moreover, more modern bulk-fill composites undergo RAFT (reversible addition–fragmentation chain transfer) polymerization resulting in more cross-linking and improved depth of cure [10].
In compliance with the particular set of strategies developed to enhance the depth of bulk-fill cure, proper curing of bulk-fill composites is also essential for suitable service life in the oral environment [11,12,13,14]. The curing of bulk-fill demands to be optimal and may be compromised by improper curing practices [15,16,17,18]. If the bulk-fill is not adequately cured, the bottom layer, usually 4 mm or more distant from the light-curing tip, is the most affected [19]. This condition can be particularly significant as it can constitute the bottom layer in contact with the gingival wall in proximal cavity preparation for most class II restorations [20]. It is worth noting that the bottom layer in the above-described scenario is exposed to the oral environment and represents an area of constant concern to operative dentists.
Previous studies have emphasized that uncured monomers can be leach out, increasing the adhesion and growth of cariogenic species [17,21,22]. Thus, the enrichment of aciduric and acidogenic species, such as Streptococcus mutans, and the uncured rates of monomers can be factors governing the degradation behavior of the resin blend. This degradation may facilitate gap formation with bacterial penetration and subsequently increase the risk of developing secondary caries [23,24].
One of the most important parameters influencing the optimal curing is the delivery of radiant exposure (RE). This parameter refers to the amount of radiant energy absorbed by the restoration to achieve highly cross-linked networks [11,12]. Therefore, the curing adequacy often relies on the degree of conversion varying from 50 to 70% [25].
The majority of prior literature has also considered the radiance emittance (mW/cm2) generated by the light-curing unit (LCU) as essential to polymerize the composite optimally [14]. However, LCU with low radiant emittance or improper maintenance could compromise the delivered RE (J/cm2) to a bulk-fill composite [19].
Furthermore, both of these factors are greatly influenced by the curing conditions. Some operator-related factors, such as LCU tip position or angulation, could minimize the delivered RE and subsequently compromise the degree of conversion [11,15]. However, whether the variation of radiant exposure delivered to the top surface (occlusal view) of a bulk-fill composite will alter the properties pertinent for the longevity of restorations of the resin is not yet clear. Many studies in the broader literature have been published concerning biofilm growth over conventional and bulk-fill composite [16,17,18,19,20,21], but only considering ideal curing settings. No articles have been found dealing with the cariogenic biofilm growth over bulk-fill composites under curing settings that simulated the most frequently performed light-curing procedures.
We present the effects of radiant exposure (RE) and radiant emittance performed in optimum and underperformed conditions on the degree of conversion (DC%), Streptococcus mutans biofilm formation, and surface roughness. The null hypothesis to be tested is that varying RE delivered to bulk-fill composite would not affect DC%, S. mutans biofilm growth, and surface roughness.

2. Materials and Methods

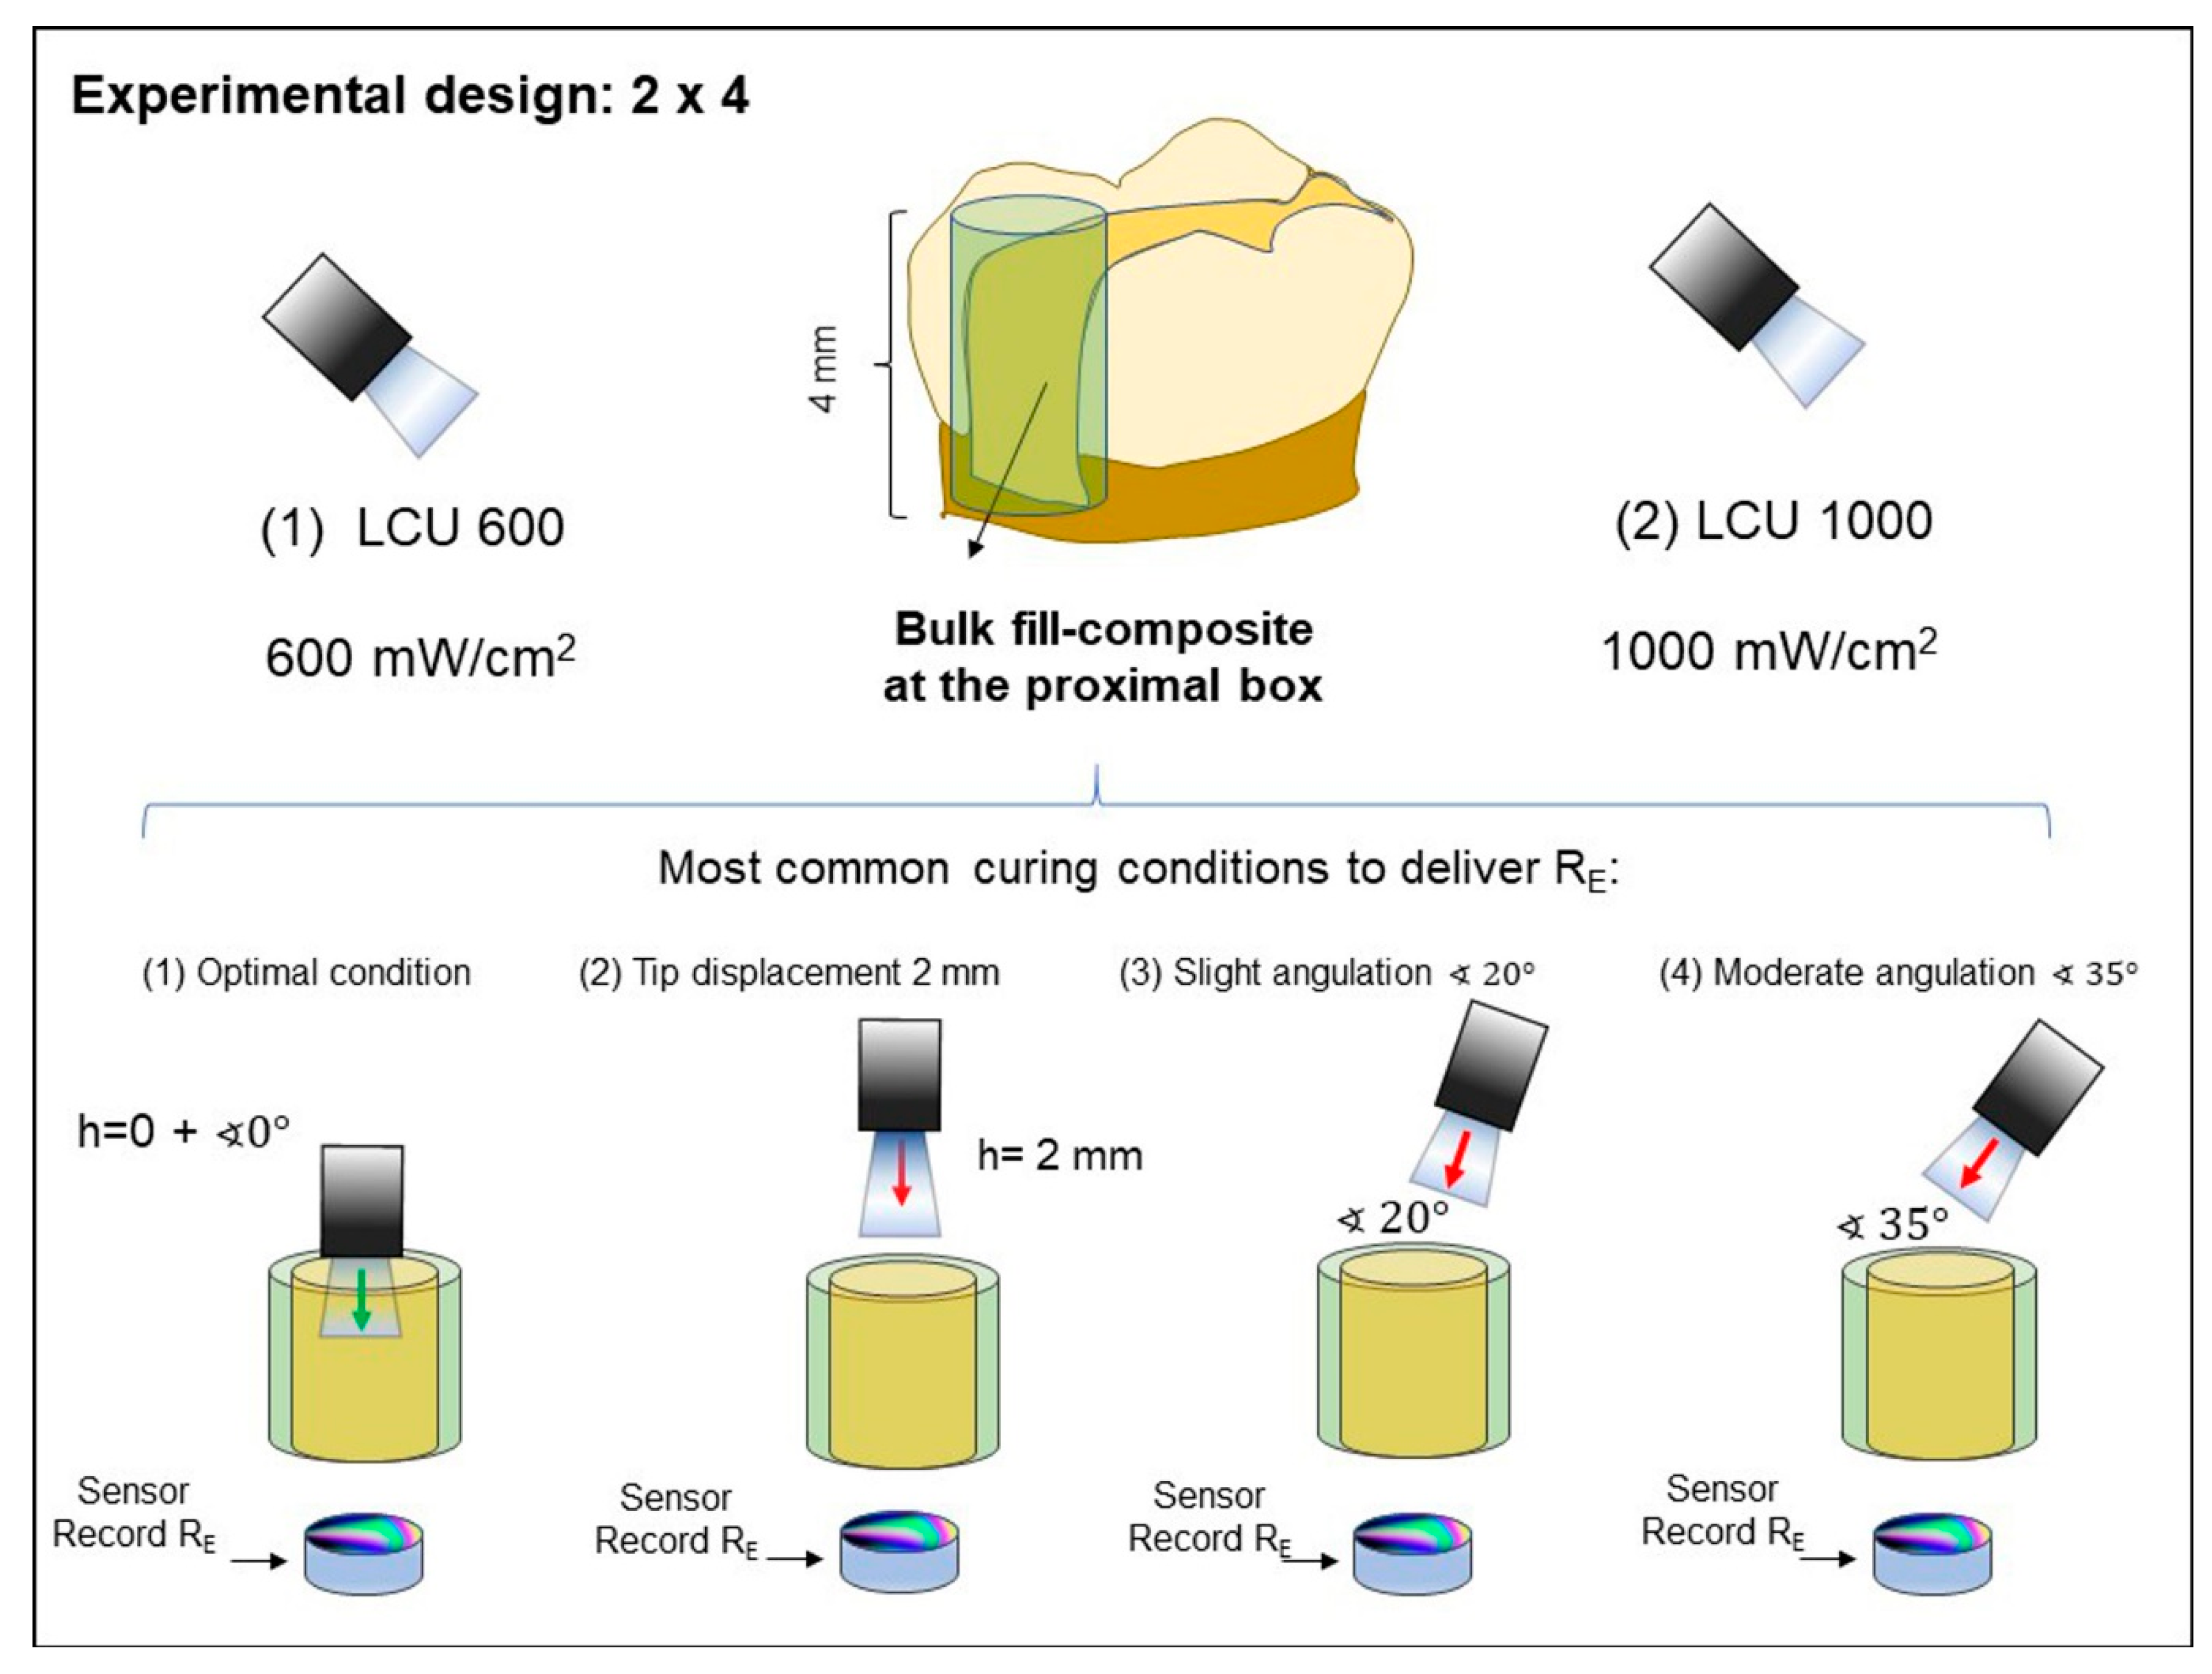
2.1. Experimental Design

Two LCUs were used, LCU600 (Radii-cal, SDI Limited Victoria, Australia; standard curing mode, radiant emittance output provided of almost 689 mW/cm2) and LCU1000 (Valo grand, Ultradent Products Inc., South Jordan, UT, USA; standard curing mode; radiant emittance output provided of 1029 mW/cm2). These LCUs were representative of the most common radiance emittance found in commercially available LCU: 600 and 1000 mW/cm2, respectively. The output of each LCU was confirmed using a laboratory-grade NIST-referenced USB4000 Spectrometer (MARC: Managing Accurate Resin Curing; System, Bluelight Analytics, Halifax, NS, Canada). The curing technique was performed following four conditions: (1) optimal condition (no angulation or tip displacement), (2) tip-displacement (2 mm), (3) light tip angulation (α = 20°) and (4) light tip angulation (α = 35°) (Figure 1). These scenarios represent the optimal and underperformed curing techniques, which have been described as the most commonly performed conditions in dental practice [26]. After performing the light-curing procedure following these conditions, four different values were recorded, which are (1) radiant exposure (RE in J/cm2), (2) the degree of conversion (DC%) on the top and bottom of specimens, (3) colony-forming units (CFU) of S. mutans, and (4) surface roughness.
A bulk-fill composite applied in a 4-mm increment was used in all tested conditions (3M ESPE Filtek Bulk Fill Posterior Restorative material, shade A2, St. Paul, MN, USA). According to the manufacturer, the bulk-fill composite contains silica, zirconia, zirconia/silica cluster, and ytterbium trifluoride filler particles (76.5 wt.% or 58.4 vol.%). It also contains aromatic dimethacrylate, urethane dimethacrylate, and 1,12-dodecanediol dimethacrylate in the comonomer blend.

2.2. Sample Preparation and Measurement of Radiant Exposure (RE) at the Bottom Surface of the Specimen

3D printed molds were designed to achieve good standardization during bulk-fill composites curing in the four different conditions, either with LCU1000 or LCU600 (Figure 1). The 3D printed molds (polylactic acid filament, melted Extrusion Modeling, 3D H800 Afinia printer, Chanhassen, MN, USA) were designed with an inner diameter of 7 mm and thickness of 4 mm. Before performing each condition, the RE values were obtained with the LCUs placed directly on the sensor of a laboratory-grade NIST-referenced USB4000 Spectrometer (MARC: Managing Accurate Resin Curing; System, Bluelight Analytics, Halifax, NS, Canada). An assessment was made from the top of the empty mold to observe the RE obtained without the bulk-fill. Afterward, the RE that was able to transmit through the bulk-fill thickness (n = 6) to the underlying sensor at the bottom of the composite cylinders was measured for each condition (Figure 1). The photoactivation was performed for 20 s using one of the two LED-curing units, LCU600 and LCU1000, at a radiant emittance output of approximately 600 or 1000 mW/cm2. All the composite cylinders were dried and stored at 37 °C for 24 h.
The total energy delivered to the specimen stated as radiant exposure (RE) was calculated according to the following Equation (1) [27]:
Equation (1):
J   ( joules ) cm 2 = mW cm 2 ×   t ( sec )
where mW/cm2 is the radiant emittance or intensity from the LCU.

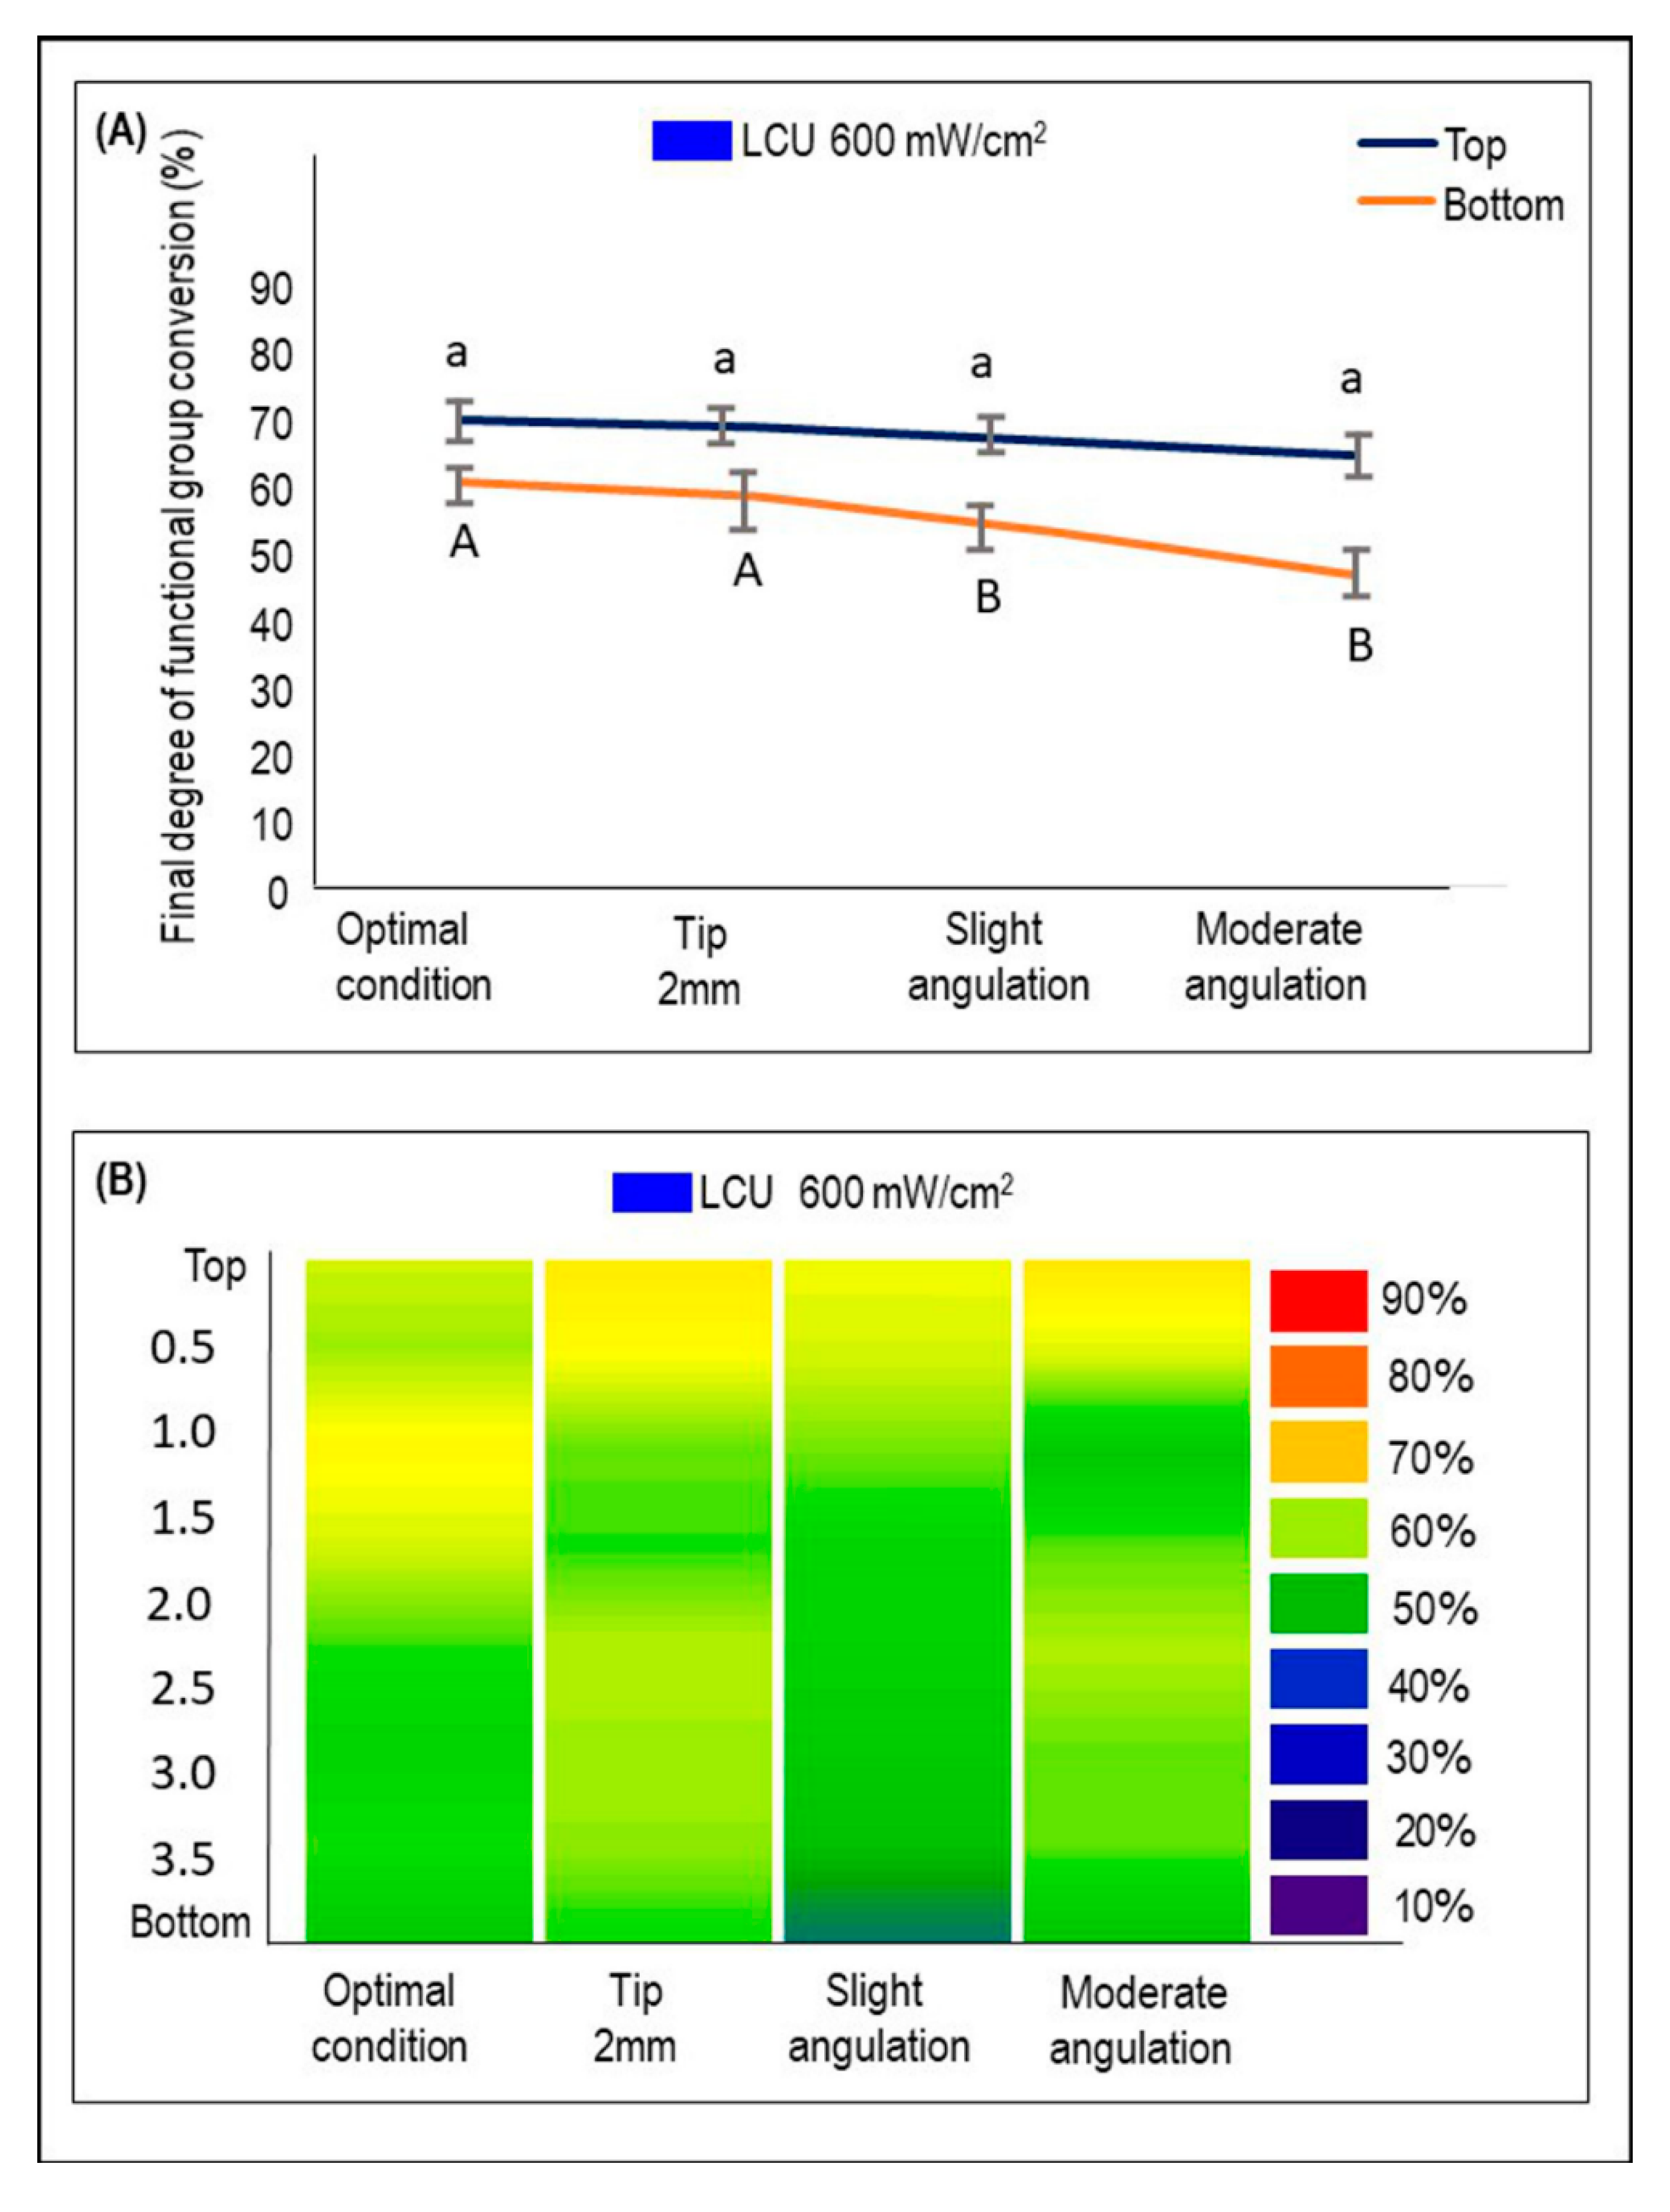
2.3. Degree of Conversion Analysis

Fourier transform infrared (FTIR) spectroscopy was used to assess the conversion level attained by the curing procedures. Bulk-fill samples were protected from additional lighting for 24 h at 37 °C after photoactivation [28]. The cylinders (n = 3) were embedded into epoxy resin and sectioned using a diamond saw (Accutom-5, Struers, Cleveland, OH, USA) to obtain three 0.4 mm thick slices parallel to the long axis of each cylinder. The slices were positioned over the platform of an IR microscope (Nicolet Continuum) coupled with an IR spectrometer (Nicolet 6700, ThermoFisher, Madison, WI, USA). Spectral data were obtained in the near-IR spectral region (NIR—from 4000 to 14,000 cm−1). The spectra data were obtained for each prepared slice corresponding from the top to bottom length of the bulk-fill cylinder. Spectra of the uncured composite were used to calculate the vinyl double bond conversion at each depth using the vinyl overtone peak area at 6165 cm−1 [29]. 2D maps of the degree of conversion as a function of depth were produced.

2.4. Quantification of S. mutans Biofilm on Bulk-Fill Composites

S. mutans (ATCC 700610, UA159; American Type Culture, Manassas, VA, USA) biofilms were initiated over the cured specimens’ bottom side as previously described [27,28,29,30] with some modifications. S. mutans was used as inoculum according to a protocol approved by the local institution.
In summary, 150 µL of S. mutans inoculum in brain heart infusion (BHI, Sigma-Aldrich, St. Louis, MO, USA)–glycerol solution (stored at −80 °C) was spread on Columbia blood agar (BBL, Becton Dickinson, Allschwil, Switzerland) and incubated for over 48 h. S. mutans colonies were resuspended in 5 mL of BHI broth and incubated overnight at 37 °C under the aerobic condition to the mid-log phase (OD600 = 0.9). The cured bulk-fill composite samples (n = 6) were sterilized via ethylene oxide gas and placed in a well of a 24-well plate containing sterile BHI containing 5% sucrose [27]. Next, 120 μL of overnight cultures of S. mutans (108 CFU/mL) were inoculated in each well. The inoculation of each BHI-containing recipient was performed only once on the first day, and the bulk-fill composite samples were transferred to a fresh medium every day for 14 days. Each BHI-containing well was streaked onto a new fresh BHI agar media plated and incubated at 37 °C in an atmosphere of 10% CO2 for 24 h to evaluate the purity.
For biofilm viability assessment, the biofilms formed on the bulk-fill composite samples were collected, serially diluted with 0.9% sodium chloride (NaCl) solution and plated in triplicate on BHI agar. After 48 h at 37 °C in a 10% CO2 atmosphere, representative colonies with typical morphology of S. mutans were counted and expressed as CFU/composite.

2.5. Morphologically Evaluation of S. mutans Biofilm over Bulk-Fill Composites

After the biofilm formation on bulk-fill composites for 14 days, one sample from the control group and another from the moderate angulation condition were prepared for a qualitative analysis via scanning electron microscopy (SEM, Quanta 200, FEI, Hillsboro, OR, USA). First, a fixation and dehydration process was performed with Karnovsky’s fixative and alcoholic solution, sputtering with gold/palladium. Then, the samples were examined at 200× and 10,000× magnification at an accelerating voltage of 20 kV.

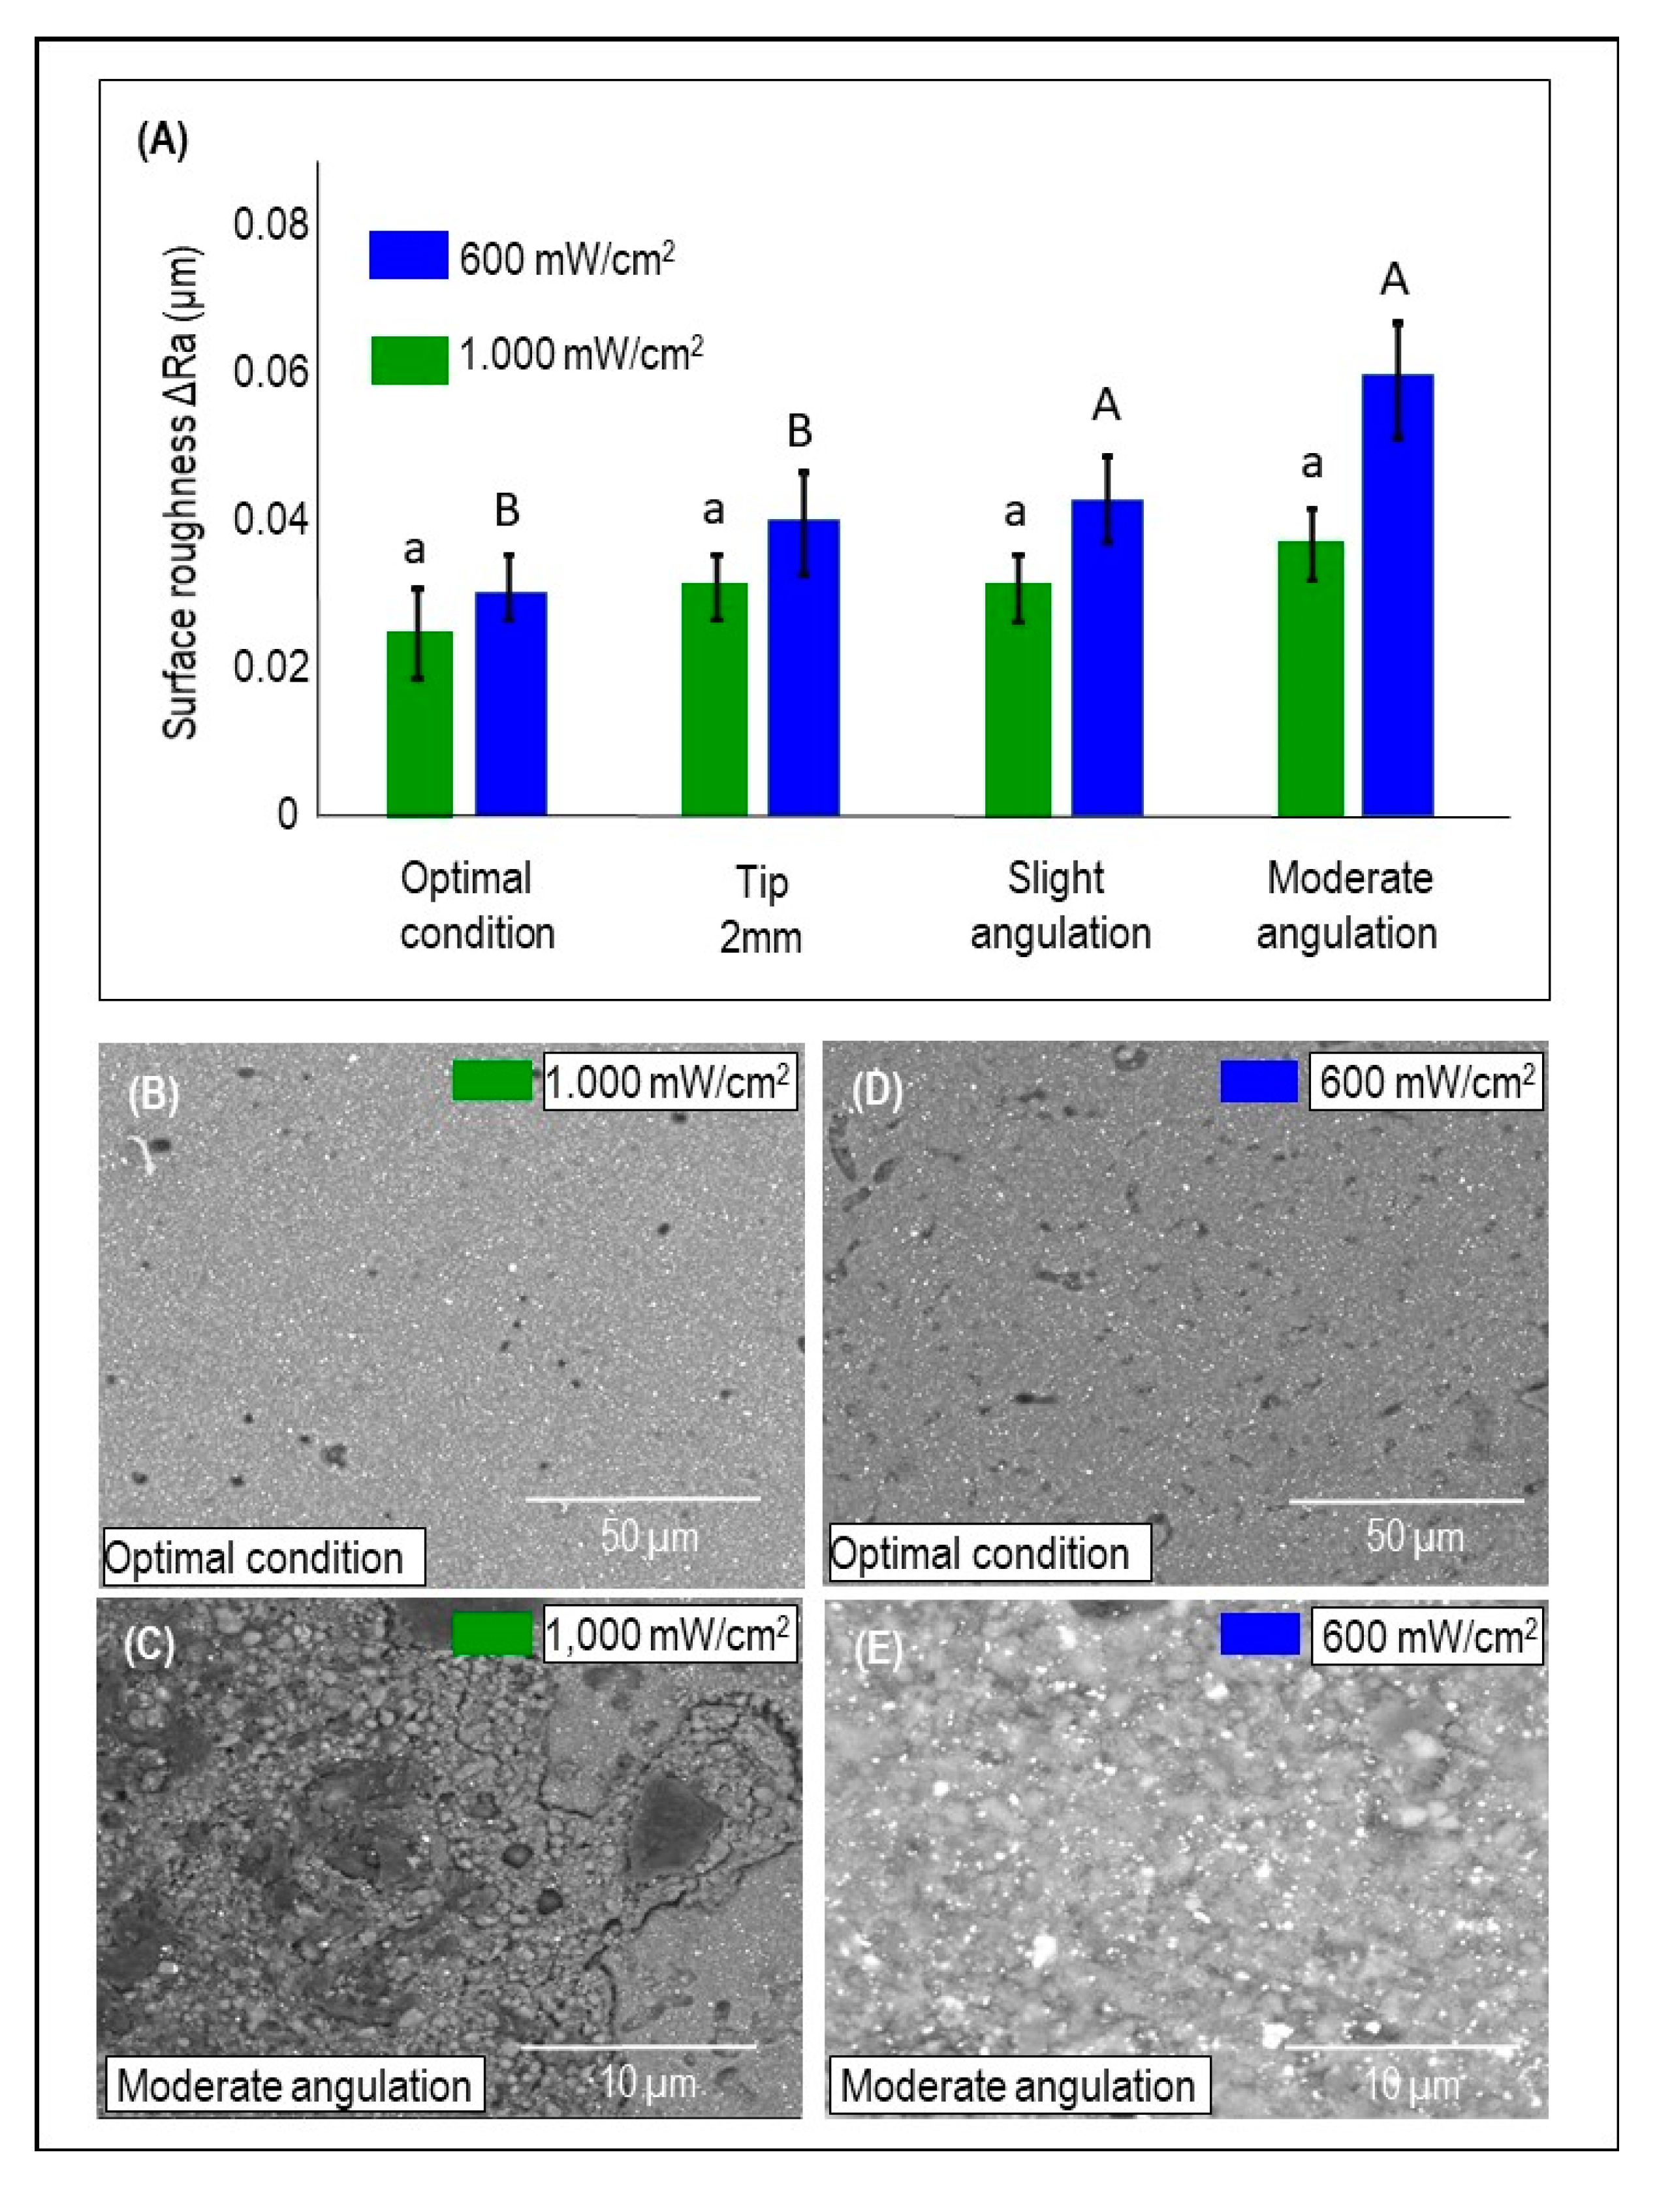
2.6. Surface Roughness of Bulk-Fill Composites after Exposure to S. mutans Biofilm

The surface roughness (Ra, μm) of bulk-fill composites (n = 6) after S. mutans biofilm formation for 14 days was measured. Each sample’s bottom was analyzed for this assay before and after the S. mutans biofilm formation using a surface roughness measurement instrument (Surftest SJ-310, Mitutoyo America, Aurora, IL, USA). Five measurements of each bulk-fill sample were performed using the stylus tip (5 µm) at a constant speed of 0.5 mm/s, a force of 4 mN, with a 0.25-mm cutoff value, and 1.5-mm tracing length [27]. Ra (ΔRa) variation was calculated by measuring the difference between the final and initial Ra.

2.7. Morphologically Evaluation of Bulk-Fill Composites Surface after Exposure to S. mutans Biofilm

After the exposure to S. mutans biofilm, one sample from the control group and another from the moderate angulation condition were prepared for a qualitative analysis of their surface via SEM (Quanta 200, FEI, Hillsboro, OR, USA). The samples were coated via sputtering with gold/palladium and analyzed with a magnification of 200× and 10,000× at an accelerating voltage of 20 kV.

2.8. Statistical Analysis

Statistical evaluations were performed with Sigma Plot (Sigma Plot 12.0; SYSTAT). The Shapiro–Wilk test was applied to verify if the data were normally distributed. Results were compared using two-way analysis of variance (ANOVA) and Tukey’s test (α = 0.05). A linear Pearson correlation assessed the correlations between RE and the outcomes of each test.

3. Results

Figure 2 shows the RE values for LCU1000 (Figure 2A) and LCU600 (Figure 2B). In general, LCU1000 revealed a higher and significant RE value (2.02 mW/cm2) than LCU600 in both optimal and underperformed conditions (p < 0.05; power of analysis 100%). In LCU1000, the RE value of the optimal condition was significantly higher than the other underperformed conditions (p < 0.05) (Figure 2A). For LCU600, the RE of optimal condition (0.64 mW/cm2) was not significant (p > 0.05; power of analysis 100%) compared to 2 mm tip displacement (0.54 mW/cm2) and slight angulation (0.48 mW/cm2), but then significant compared to moderate angulation (p < 0.05) (Figure 2B). In Figure 2, the first y-axis represents the RE values, while the second y-axis represents the reduction of RE in the three underperformed conditions compared to the optimal conditions. The dotted line illustrates the decay in RE that reached the sensor in all groups. In LCU1000, the reduction in RE in the underperformed conditions ranges from 37.6 to 74.2% compared to the optimal condition. While in LCU600, the reduction was observed between 15.6 and 45.3%. The influence of the less than optimal light conditions (F = 10.48, p < 0.001) and irradiance output of LCU (F = 10.30, p = 0.0024) on the radiant exposure (RE) were considerable.
Figure 3 demonstrates the DC% at the bottom and the top of the sample when the LCU1000 was used (mean ± sd). In LCU1000, no significant difference was found among the DC% results on the samples’ top when the curing conditions were compared (Figure 3A). However, a significant decrease in DC% at the bottom of the samples was observed when slight and moderate angulations were performed (p < 0.05). The DC% was reduced by around 10% in moderate angulation conditions compared to the optimal condition when the bottom surfaces were examined. In Figure 3B, the heat maps of the average DC% of samples cured with LCU1000 were investigated at different depths from the top surface of each sample to the bottom. Reducing DC% towards the bottom of the specimen is visualized by increasing the cold colors. A trend in dropping the DC% was observed for groups subjected to angulations with a predominance of a green color corresponding to 50–60% of conversion.
Figure 4 demonstrates the DC% at the bottom and the top of the sample when the LCU600 was used (mean ± sd). No significant difference was found among the DC% results on the samples’ top when the curing conditions were compared. The top and the bottom difference was 8 to 11% for the groups subjected to slight and moderate angulations, respectively. When the bottom surfaces of the samples cured with different conditions were examined, the DC% was significantly reduced in the slight and moderate angulation conditions compared to the other groups (p < 0.05). The DC% reduction is represented in Figure 4B. The transition of the colors to dark and light green indicates a decrease in the DC% values. Comparing the heat maps of LCU1000 and LCU600 shows that LCU1000 is associated with a higher DC% than LCU600. Pearson’s correlation coefficient indicated strong correlation between RE and DC% values (r = 0.611; p = 0.0047).
Figure 5A illustrates S. mutans colony-forming units counting expressed by CFU/ composite for both the LCUs output and the four tested conditions (mean ± sd). In LCU1000, RE had no significant effect regarding the CFU of S. mutans except when the LCU tip is moderately angulated (p < 0.05; power of analysis 100%). While in LCU600, the optimal condition RE was associated significantly with less CFU than the other three underperformed conditions (p < 0.05; power of analysis 100%). The Pearson correlation between RE and S. mutans biofilm formation (p = 0.0027; r = −0.49) demonstrated an inverse relationship between the two factors: lowered radiant exposure values were associated with high S. mutans biofilm formation. In addition, moderate angulation of the LCU tip was associated with a significant increase in S. mutans viability (p < 0.05). In Figure 5B–E, representative SEM images demonstrate higher bacterial adhesion and biofilm formation in moderately angulated bulk-fill composite samples than optimal conditions for both LCU1000 and LCU600.
Figure 6A demonstrates the mean and standard deviation of ΔRa values for the light curing conditions using either LCU1000 or LCU600 (mean ± sd). The radiance emittance output (p = 0.0041) and less than optimal light conditions (p = 0.0207) have a statistical effect using two-way ANOVA, although no interaction was observed (p = 0.271). LCU1000 did not show any significant difference concerning ΔRa for all curing conditions, but LCU600 demonstrated a significant difference between the optimal condition and slight and moderate angulation conditions (p < 0.05; power of analysis 100%). In Figure 6B–E, SEM images of the bulk-fill composite surface are illustrated when optimal and moderate angulations were performed using either LCU1000 or LCU600. The most noticeable difference was found when using the radiance emittance output of LCU600 with a moderate angulation (0.062 um). In addition, superficial degradation and exposed fillers resulting from resin matrix loss were observed with moderated angulation (Figure 6C,E).

4. Discussion

In this study, improper polymerization and low DC% of bulk-fill composites are associated with more biofilm growth and increased roughness. Furthermore, these complications were intensified with incorrect light-curing techniques such as tip displacement and improper angulation. Frequently, in vitro studies are performed in optimal conditions where most of the variables are well-controlled. Nevertheless, the clinical setting situation is different, as many clinical variables may complicate the curing procedure.
Variables such as the tooth’s position inside the mouth, the anatomy of the tooth, the position of the placed restoration, and moisture challenges may compromise the RE delivery [11]. Class II cavity preparation represents a clinical situation where the delivery of adequate RE is challenging as cavity walls. Cusp tips may interfere with closer tip placement—consequently, light transmission, especially to the bottom portion of the gingival floor [11]. Additionally, operator-related factors significantly impacted the delivered RE as previously reported [11,14,15] and demonstrated in this study.
Two radiant emittance outputs of approximately 600 or 1000 mW/cm2 [31] delivered by two distinct LCUs were used to conduct the present study. The spectral output of these lights and the beam dispersion with distance and light tip diameters are different. Radii-Cal is a mono-wave LED LCU, while VALO grand is a multi-wave LED LCU with two predominant peaks, in which one has a shoulder extending the emittance wavelength to almost three peaks [32]. The rationale behind their selection for this research was based on using two commonly used LCU under clinical situations by dentists.
For maximum curing, 50% to 60% functional group conversion is expected [11,12]. In a systematic review of 21 studies [31], eleven studies demonstrated acceptable DC% values higher than 50% for bulk-fill composites; eight studies demonstrated material-dependent results, and two studies reported unacceptable bottom/top hardness ratio [33,34]. Most studies reported acceptable DC% when using an LCU that generates ≥1000 mW/cm2, which also was found in our study as the amount of RE delivered to the sensor was higher using LCU1000. It was observed here that under an optimal curing condition, the DC% achieved 70% using the LCU1000. However, when the LCU600 was used, DC% ranged from 50 (bottom) to 70 (top). These results suggest that using an LCU with ≥1000 mW/cm2 radiant emittance is preferable when curing bulk-fill composites. This fact is reinforced by the unacceptable bottom/top hardness ratio and low polymerization using LCU with radiant emittance values of 700 and 800 mW/cm2 [33,34].
The radiant exposure of 16 J/cm2 is often considered the threshold value of radiant energy influx required for maximum curing of a 2-mm increment [35]. This can be delivered by a 20 s exposure to an LCU emitting 600 mW/cm2. The degree of conversion also varies according to material-related factors such as the translucency, and filler content may affect the amount of required energy to achieve acceptable polymerization [11]. Here, the recorded RE reaching the underlying sensor represents the RE energy that reached the bottom layer of bulk-fill composites.
Previous studies indicate that sufficient polymerization could be achieved when a radiant exposure of 0.7–1.5 J/cm2 is delivered to the bottom layer [36,37,38]. When our findings are compared with this range, the results indicate the proper delivery of radiant exposure for polymerization. Note that the optimal condition using LCU1000 achieved a RE of 2.02 J/cm2. The improper simulated curing conditions achieved values between 0.52 and 1.26 J/cm2, compromising the polymerization quality. The use of LCU600 (with 600 mW/cm2) as output greatly reduces the RE values (range values 0.35–0.64 J/cm2) under incorrect curing conditions. Additionally, the low percentage of conversion found for this group may reflect the detrimental effect of using LCU600 with 600 mW/cm2.
S. mutans is recognized as one of the major species related to dental caries. This virulent oral pathogen has acidogenic and aciduric properties and an enhanced ability to attach to surfaces and survive over different substrates [39,40]. Our work demonstrated higher S. mutans biofilm formation over bulk-fill composites cured with underperformed conditions. Moderate angulation demonstrated the more prominent amount of S. mutans biofilm and surface roughness. The discovered detrimental outcome could be related to leached uncured monomers that facilitate bacterial adhesion and penetration through the bulk-fill composites [41]. Several studies emphasized S. mutans biofilm’s role in composite degradation and compromising the integrity and smoothness of the surface [39,40,41,42].
Esterases are essential virulence factors in the pathogenicity and cariogenicity of bacterial species [39]. S. mutans esterase virulence gene can catalyze the uncured monomers, causing further degradation, leading to bacterial colonization at the margin and recurrent caries [43]. LCU600 generally demonstrated more biofilm formation than LCU1000, which could decrease RE value and DC%. The biofilm was maintained for 14 days to allow a mature cariogenic biofilm that resembles the dental caries process in the oral cavity.
Additionally, uncured monomers sub-products are mainly observed within seven days with similar characteristics compared to sub-products released after 30 days [44,45]. The increased Ra values found, especially for moderate angulation conditions, may clinically jeopardize the treatment outcome. Different bulk-fill composites formulations, such as the quantity of inorganic filler and the blend composition, could be interesting to evaluate biofilm accumulation under these photocuring conditions. Moreover, we used a single-specie biofilm model. Although the biofilm was grown for an extended period, a high-challenge multispecies biofilm model may accelerate the bulk-fill composites’ degradation process and surface changes, mainly those receiving lower RE.
This study’s overall outcomes found resonance in our group’s earlier work when Maktabi et al. [27] showed a striking prejudicial effect of radiant emittance of 600 mW/cm2 and incorrect curing techniques biofilm growth over conventional RBCs. In this cited study, similar methodology and assessments were applied, which allows us to draw a comparative profile. The negative influence of low RE on increased S. mutans growth and reduced DC% was shown, as expected, similar to our results. Under the same simulated curing conditions (tip displacement and incorrect angulations), the radiant exposure delivered to a 2-mm increment in conventional RBCs led to RE reduction values varying from 49.4 to 73.5% in relation to the control group. The difference in DC% between the top and the bottom of 2-mm conventional RBCs discs varied from 13 to 21% for 1000 mW/cm2 and 29 to 53% for LCU600.
Here, the curing conditions applied to 4-mm bulk-fill increment showed varied RE from 15.6% to 82.9% compared to the control group. Our results showed a difference in DC% between the top and bottom of the bulk-fill composite ranging from 10 to 20% for 1000 mW/cm2 and 8 to 11% for 600 mW/cm2. This finding is essential to guide an interpretation of different materials under similar conditions. Most importantly, it can suggest that under 600 mW/cm2, the bulk-fill composite has shown more minor variation to the detrimental effects of incorrect curing procedures. In both studies, an increased S. mutans biofilm formation was significant for angulated and distant curing procedures observed via colony-forming unit counting and SEM analysis.
The limitations of this study include the use of only one commercial type of bulk-fill composite. Recently, an investigation was performed with different bulk-fill composites to analyze their roughness, surface free energy, and adhesion of S. mutans or Streptococcus mitis. [46] In this study, the roughness was not different among the four commercially available composites (Sonic Fill-2 (Orange County, CA, USA), Filtek BulkFill (Saint Paul, MN, USA), Admira Fusion X-tra (Cuxhaven, Germany), and Beautifil Bulk Restorative (Shofu, San Marcos, CA, USA)). However, there were significant differences in their contact angle and surface free energy, which the authors reported as a feature that could lead to different microorganisms’ adhesion in an actual clinical situation [46].
Therefore, further studies could reproduce similar experiments using varied LCU tip displacement or angulation and different commercial bulk-fill composites. The variations in material components, amount of filler, and photoinitiators may provide different results from one product to another [8]. Another limitation is the use of a single species biofilm [23]. It is more clinically relevant to use a multispecies biofilm to investigate the effect of biofilm accumulation in bulk-fill composite degradation. It is expected when using such a complex biofilm model that the amount of degradation and surface changes will be higher compared to what was found in this study [24].
The findings here reported are novel, primarily in the context of exploring the bacterial response to varied RE intended to cure bulk-fill composites. Moreover, we spent efforts to understand the potential risks of triggering a cascade of possible events that could compromise restoration’s long-term performance in the oral environment. Thus, dentists should always be attentive to optimizing the curing procedures, especially when using bulk-fill composites in critical situations as deep proximal cavities.

5. Conclusions

Based on our in vitro outcomes, inadequate polymerization of bulk-fill composites could be associated with more biofilm accumulation and surface topography changes. Insufficient polymerization was triggered by poor curing conditions such as LCU tip displacement and angulation, along with the use of LCUs that induce 600 mW/cm2 output.

Author Contributions

H.M., M.S.I., A.A.B. and I.M.G.: contributed to design, acquisition and analysis, data curation, drafted manuscript, and critically revised manuscript. Q.A., F.M.C., H.S. and A.P.P.F.: contributed to conceptualization, design, acquisition, and critically revised manuscript. C.S.P. and M.A.S.M.: contributed to concept and design, acquisition, supervision, contributed to analysis and interpretation, and critically revised manuscript. All authors have read and agreed to the published version of the manuscript.

Funding

This research received no external funding.

Institutional Review Board Statement

Not applicable.

Informed Consent Statement

Not applicable.

Data Availability Statement

The data set generated and analyzed in this study is available upon reasonable request to the corresponding author.

Acknowledgments

This study was supported by a seed grant from the University of Maryland School of Dentistry (MM). We gratefully acknowledge staff of the HS/HSL Innovation Space (University of Maryland Baltimore) for their support in helping us with the design and printing templates.

Conflicts of Interest

The authors declare no conflict of interest.

References

  1. Ferracane, J.L.; Berge, H.X.; Condon, J.R. In vitro aging of dental composites in water—Effect of degree of conversion, filler volume, and filler/matrix coupling. J. Biomed. Mater. Res. 1998, 42, 465–472. [Google Scholar] [CrossRef]
  2. Boaro, L.C.; Gonçalves, F.; Guimarães, T.C.; Ferracane, J.L.; Pfeifer, C.S.; Braga, R.R. Sorption, solubility, shrinkage and mechanical properties of “low-shrinkage” commercial resin composites. Dent. Mater. 2013, 29, 398–404. [Google Scholar] [CrossRef]
  3. El-Damanhoury, H.; Platt, J. Polymerization shrinkage stress kinetics and related properties of bulk-fill resin composites. Oper. Dent. 2014, 39, 374–382. [Google Scholar] [CrossRef] [PubMed]
  4. Oliveira, L.R.S.; Braga, S.S.L.; Bicalho, A.A.; Ribeiro, M.T.H.; Price, R.B.; Soares, C.J. Molar cusp deformation evaluated by micro-ct and enamel crack formation to compare incremental and bulk-filling techniques. J. Dent. 2018, 74, 71–78. [Google Scholar] [CrossRef]
  5. de Oliveira Correia, A.M.; Tribst, J.P.M.; de Souza Matos, F.; Platt, J.A.; Caneppele, T.M.F.; Borges, A.L.S. Polymerization shrinkage stresses in different restorative techniques for non-carious cervical lesions. J. Dent. 2018, 76, 68–74. [Google Scholar] [CrossRef] [Green Version]
  6. Chesterman, J.; Jowett, A.; Gallacher, A.; Nixon, P. Bulk-fill resin-based composite restorative materials: A review. Br. Dent. J. 2017, 222, 337–344. [Google Scholar] [CrossRef] [PubMed]
  7. Lazarchik, D.A.; Hammond, B.D.; Sikes, C.L.; Looney, S.W.; Rueggeberg, F.A. Hardness comparison of bulk-filled/transtooth and incremental-filled/occlusally irradiated composite resins. J. Prosthet. Dent. 2007, 98, 129–140. [Google Scholar] [CrossRef]
  8. Van Ende, A.; De Munck, J.; Lise, D.P.; Van Meerbeek, B. Bulk-fill composites: A review of the current literature. J. Adhes. Dent. 2017, 19, 95–109. [Google Scholar] [CrossRef] [PubMed] [Green Version]
  9. Flury, S.; Hayoz, S.; Peutzfeldt, A.; Hüsler, J.; Lussi, A. Depth of cure of resin composites: Is the ISO 4049 method suitable for bulk fill materials? Dent. Mater. 2012, 28, 521–528. [Google Scholar] [CrossRef] [PubMed]
  10. Ilie, N.; Watts, D.C. Outcomes of ultra-fast (3 s) photo-cure in a RAFT-modified resin-composite. Dent. Mater. 2020, 36, 570–579. [Google Scholar] [CrossRef] [PubMed]
  11. Maktabi, H.; Balhaddad, A.A.; Alkhubaizi, Q.; Strassler, H.; Melo, M.A.S. Factors influencing success of radiant exposure in light-curing posterior dental composite in the clinical setting. Am. J. Dent. 2018, 31, 320–328. [Google Scholar]
  12. Palin, W.M.; Leprince, J.G.; Hadis, M.A. Shining a light on high volume photocurable materials. Dent. Mater. 2018, 34, 695–710. [Google Scholar] [CrossRef] [Green Version]
  13. Leprince, J.G.; Leveque, P.; Nysten, B.; Gallez, B.; Devaux, J.; Leloup, G. New insight into the “depth of cure” of dimethacrylate-based dental composites. Dent. Mater. 2012, 28, 512–520. [Google Scholar] [CrossRef] [PubMed]
  14. Price, R.B.; Ferracane, J.L.; Shortall, A.C. Light-curing units: A review of what we need to know. J. Dent. Res. 2015, 94, 1179–1186. [Google Scholar] [CrossRef]
  15. AlShaafi, M.M. Factors affecting polymerization of resin-based composites: A literature review. Saudi Dent. J. 2017, 29, 48–58. [Google Scholar] [CrossRef]
  16. Shimokawa, C.; Sullivan, B.; Turbino, M.L.; Soares, C.J.; Price, R.B. Influence of emission spectrum and irradiance on light curing of resin-based composites. Oper. Dent. 2017, 42, 537–547. [Google Scholar] [CrossRef]
  17. Mitwalli, H.; Alsahafi, R.; Balhaddad, A.A.; Weir, M.D.; Xu, H.H.K.; Melo, M.A.S. Emerging contact-killing antibacterial strategies for developing anti-biofilm dental polymeric restorative materials. Bioengineering 2020, 7, 83. [Google Scholar] [CrossRef]
  18. Li, X.; Pongprueksa, P.; Van Meerbeek, B.; De Munck, J. Curing profile of bulk-fill resin-based composites. J. Dent. 2015, 43, 664–672. [Google Scholar] [CrossRef] [PubMed]
  19. Shimokawa, C.A.K.; Turbino, M.L.; Giannini, M.; Braga, R.R.; Price, R.B. Effect of light curing units on the polymerization of bulk fill resin-based composites. Dent. Mater. 2018, 34, 1211–1221. [Google Scholar] [CrossRef] [PubMed]
  20. Shimokawa, C.; Turbino, M.L.; Giannini, M.; Braga, R.R.; Price, R.B. Effect of curing light and exposure time on the polymerization of bulk-fill resin-based composites in molar teeth. Oper. Dent. 2020, 45, E141–E155. [Google Scholar] [CrossRef] [PubMed]
  21. Betancourt, D.E.; Baldion, P.A.; Castellanos, J.E. Resin-dentin bonding interface: Mechanisms of degradation and strategies for stabilization of the hybrid layer. Int. J. Biomater. 2019, 2019, 5268342. [Google Scholar] [CrossRef]
  22. Balhaddad, A.A.; Kansara, A.A.; Hidan, D.; Weir, M.D.; Xu, H.H.K.; Melo, M.A.S. Toward dental caries: Exploring nanoparticle-based platforms and calcium phosphate compounds for dental restorative materials. Bioact. Mater. 2019, 4, 43–55. [Google Scholar] [CrossRef]
  23. Ferracane, J.L. Models of caries formation around dental composite restorations. J. Dent. Res. 2017, 96, 364–371. [Google Scholar] [CrossRef] [Green Version]
  24. Kusuma Yulianto, H.D.; Rinastiti, M.; Cune, M.S.; de Haan-Visser, W.; Atema-Smit, J.; Busscher, H.J.; van der Mei, H.C. Biofilm composition and composite degradation during intra-oral wear. Dent. Mater. 2019, 35, 740–750. [Google Scholar] [CrossRef] [PubMed]
  25. Balhaddad, A.A.; Garcia, I.; Collares, F.; Felix, C.M.; Ganesh, N.; Alkabashi, Q.; Massei, W.; Strassler, H.; Melo, M.A. Assessment of the radiant emittance of damaged/contaminated dental light-curing tips by spectrophotometric methods. Restor. Dent. Endod. 2020, 45, e55. [Google Scholar] [CrossRef]
  26. Ibrahim, M.S.; Garcia, I.M.; Kensara, A.; Balhaddad, A.A.; Collares, F.M.; Williams, M.A.; Ibrahim, A.S.; Lin, N.J.; Weir, M.D.; Xu, H.H.K.; et al. How we are assessing the developing antibacterial resin-based dental materials? A scoping review. J. Dent. 2020, 99, 103369. [Google Scholar] [CrossRef]
  27. Maktabi, H.; Ibrahim, M.; Alkhubaizi, Q.; Weir, M.; Xu, H.; Strassler, H.; Fugolin, A.P.P.; Pfeifer, C.S.; Melo, M.A.S. Underperforming light curing procedures trigger detrimental irradiance-dependent biofilm response on incrementally placed dental composites. J. Dent. 2019, 88, 103110. [Google Scholar] [CrossRef]
  28. Rahim, T.N.A.T.; Mohamad, D.; Md Akil, H.; Ab Rahman, I. Water sorption characteristics of restorative dental composites immersed in acidic drinks. Dent. Mater. 2012, 28, e63–e70. [Google Scholar] [CrossRef]
  29. Stansbury, J.W.; Dickens, S.H. Determination of double bond conversion in dental resins by near infrared spectroscopy. Dent. Mater. 2001, 17, 71–79. [Google Scholar] [CrossRef]
  30. Ibrahim, M.S.; Ibrahim, A.S.; Balhaddad, A.A.; Weir, M.D.; Lin, N.J.; Tay, F.R.; Oates, T.W.; Xu, H.H.K.; Melo, M.A.S. A Novel dental sealant containing dimethylaminohexadecyl methacrylate suppresses the cariogenic pathogenicity of Streptococcus mutans biofilms. Int. J. Mol. Sci. 2019, 20, 3491. [Google Scholar] [CrossRef] [Green Version]
  31. Lima, R.B.W.; Troconis, C.C.M.; Moreno, M.B.P.; Murillo-Gómez, F.; De Goes, M.F. Depth of cure of bulk fill resin composites: A systematic review. J. Esthet. Restor. Dent. 2018, 30, 492–501. [Google Scholar] [CrossRef] [PubMed]
  32. André, C.B.; Nima, G.; Sebold, M.; Giannini, M.; Price, R.B. Stability of the light output, oral cavity tip accessibility in posterior region and emission spectrum of light-curing units. Oper. Dent. 2018, 43, 398–407. [Google Scholar] [CrossRef] [PubMed]
  33. Garcia, D.; Yaman, P.; Dennison, J.; Neiva, G. Polymerization shrinkage and depth of cure of bulk fill flowable composite resins. Oper. Dent. 2014, 39, 441–448. [Google Scholar] [CrossRef] [PubMed]
  34. Yap, A.U.J.; Pandya, M.; Toh, W.S. Depth of cure of contemporary bulk-fill resin-based composites. Dent. Mater. J. 2016, 35, 503–510. [Google Scholar] [CrossRef] [Green Version]
  35. Samaha, S.; Bhatt, S.; Finkelman, M.; Papathanasiou, A.; Perry, R.; Strassler, H.; Kugel, G.; Garcia-Godoy, F.; Price, R. Effect of instruction, light curing unit, and location in the mouth on the energy delivered to simulated restorations. Am. J. Dent. 2017, 30, 343–349. [Google Scholar]
  36. Al-Zain, A.O.; Eckert, G.J.; Lukic, H.; Megremis, S.J.; Platt, J.A. Degree of conversion and cross-link density within a resin-matrix composite. J. Biomed. Mater. Res. Part B Appl. Biomater. 2018, 106, 1496–1504. [Google Scholar] [CrossRef]
  37. Al-Zain, A.O.; Eckert, G.J.; Platt, J.A. The influence of distance on radiant exposure and degree of conversion using different light-emitting-diode curing units. Oper. Dent. 2019, 44, E133–E144. [Google Scholar] [CrossRef]
  38. Bucuta, S.; Ilie, N. Light transmittance and micro-mechanical properties of bulk fill vs. conventional resin based composites. Clin. Oral Investig. 2014, 18, 1991–2000. [Google Scholar] [CrossRef]
  39. Takahashi, Y.; Imazato, S.; Russell, R.R.B.; Noiri, Y.; Ebisu, S. Influence of resin monomers on growth of oral streptococci. J. Dent. Res. 2004, 83, 302–306. [Google Scholar] [CrossRef]
  40. Drummond, J.L. Degradation, fatigue, and failure of resin dental composite materials. J. Dent. Res. 2008, 87, 710–719. [Google Scholar] [CrossRef] [Green Version]
  41. Lin, N.J.; Keeler, C.; Kraigsley, A.M.; Ye, J.; Lin-Gibson, S. Effect of dental monomers and initiators on Streptococcus Mutans oral biofilms. Dent. Mater. 2018, 34, 776–785. [Google Scholar] [CrossRef]
  42. Beyth, N.; Bahir, R.; Matalon, S.; Domb, A.J.; Weiss, E.I. Streptococcus mutans biofilm changes surface-topography of resin composites. Dent. Mater. 2008, 24, 732–736. [Google Scholar] [CrossRef]
  43. Huang, B.; Sadeghinejad, L.; Adebayo, O.I.A.; Ma, D.; Xiao, Y.; Siqueira, W.L.; Cvitkovitch, D.G.; Finer, Y. Gene expression and protein synthesis of esterase from Streptococcus mutans are affected by biodegradation by-product from methacrylate resin composites and adhesives. Acta Biomater. 2018, 81, 158–168. [Google Scholar] [CrossRef]
  44. Price, R.B.; Shortall, A.C.; Palin, W.M. Contemporary issues in light curing. Oper. Dent. 2014, 39, 4–14. [Google Scholar] [CrossRef] [PubMed] [Green Version]
  45. Germscheid, W.; de Gorre, L.G.; Sullivan, B.; O’Neill, C.; Price, R.B.; Labrie, D. Post-curing in dental resin-based composites. Dent. Mater. 2018, 34, 1367–1377. [Google Scholar] [CrossRef] [PubMed]
  46. Bilgili, D.; Dündar, A.; Barutçugil, Ç.; Tayfun, D.; Özyurt, Ö.K. Surface properties and bacterial adhesion of bulk-fill composite resins. J. Dent. 2020, 95, 103317. [Google Scholar] [CrossRef] [PubMed]
Figure 1. Schematic representation showing the most clinical conditions during the light-curing procedure, which was simulated in this experiment. The 4-mm increment was placed similar to that one placed in the proximal box of a Class II preparation. Then, the following simulated conditions: (1) optimal condition (no angulation or tip displacement), (2) tip-displacement (2 mm), (3) light tip angulation (α = 20°) and (4) light tip angulation (α = 35°) were performed, and the RE values were recorded.
Dentistry 09 00083 g001
Figure 2. RE values that reached the sensor and the percentage of RE reduction in the underperformed conditions compared to optimal condition (mean ± sd; n = 6). (A) RE values and the percentage of RE reduction using LCU1000 with an output of 1000 mW/cm2. (B) RE values and the percentage of RE reduction using LCU600 with an output of 600 mW/cm2. On the first y-axis, the barplot demonstrates radiant exposure (RE) expressed in J/cm2. On the second y-axis, the barplot demonstrates the percentage of RE reduction. The dotted line illustrates the reduced RE for all groups concerning RE delivered to the sensor by applying the LCU directly on the sensor. Values with different letters are significantly different from each other (p < 0.05).
Dentistry 09 00083 g002
Figure 3. The %DC using LCU1000 with an output of 1000 mW/cm2 at the top and bottom of BF composites cured optimally or following the underperformed conditions (mean ± sd; n = 3). (A) The %DC values at the top and bottom of each condition. Lower case letters compare the %DC at the top of the specimen, while capital case letters compare the %DC at the bottom. Dissimilar letters are significantly different from each other (p < 0.05). (B) The %DC is measured at different depths from top to bottom and visualized by the heat maps. The color bar (right) illustrates the visual representation of the %DC corresponding to the colors seen.
Dentistry 09 00083 g003
Figure 4. The %DC using LCU600 with an output of 600 mW/cm2 at the top and bottom of BF composites cured optimally or following the underperformed conditions (mean ± sd; n = 3). (A) The %DC values at the top and bottom of each condition. Lower case letters compare the %DC at the top of the specimen, while capital case letters compare the %DC at the bottom. Dissimilar letters are significantly different from each other (p < 0.05). (B) The %DC is measured at different depths from top to bottom and visualized by the heat maps. The color bar (right) illustrates the visual representation of the %DC corresponding to the colors seen.
Dentistry 09 00083 g004
Figure 5. The quantitative and qualitative analysis of the S. mutans biofilm grown over the bulk-fill (BF) composites cured in different conditions. (A) S. mutans colony forming units (CFU) growth over the BF composites for each LCU output and each light-curing condition (mean ± sd; n = 6). (BE) Representative SEM images showing bacterial adhesion and biofilm formation on the bottom surfaces of composite cylinders for LCU1000 (B,C) and LCU600 (D,E) under optimal and moderate angulation conditions. Note arrows point to the S. mutans colonies. Capital letters compare LCU600, while lower case letters compare LCU1000. Dissimilar letters are significantly different from each other (p < 0.05).
Dentistry 09 00083 g005
Figure 6. The topography changes of the bulk-fill (BF) composites cured in different conditions. (A) The mean and standard deviation of ΔRa values considering the underperformed light curing conditions and the two-radiance emittance output (mean ± sd; n = 6). Capital letters compare LCU600, while lower case letters compare LCU1000. Dissimilar letters are significantly different from each other (p < 0.05). (BE) Representative SEM images of the BF composite surface under control and moderate angulation following the output of 1000 mW/cm2 (B,C) and LCU600 (D,E).
Dentistry 09 00083 g006
Publisher’s Note: MDPI stays neutral with regard to jurisdictional claims in published maps and institutional affiliations.

