Diagnostic Approaches to Adult-Type Diffuse Glial Tumors: Comparative Literature and Clinical Practice Study

 , and
, and 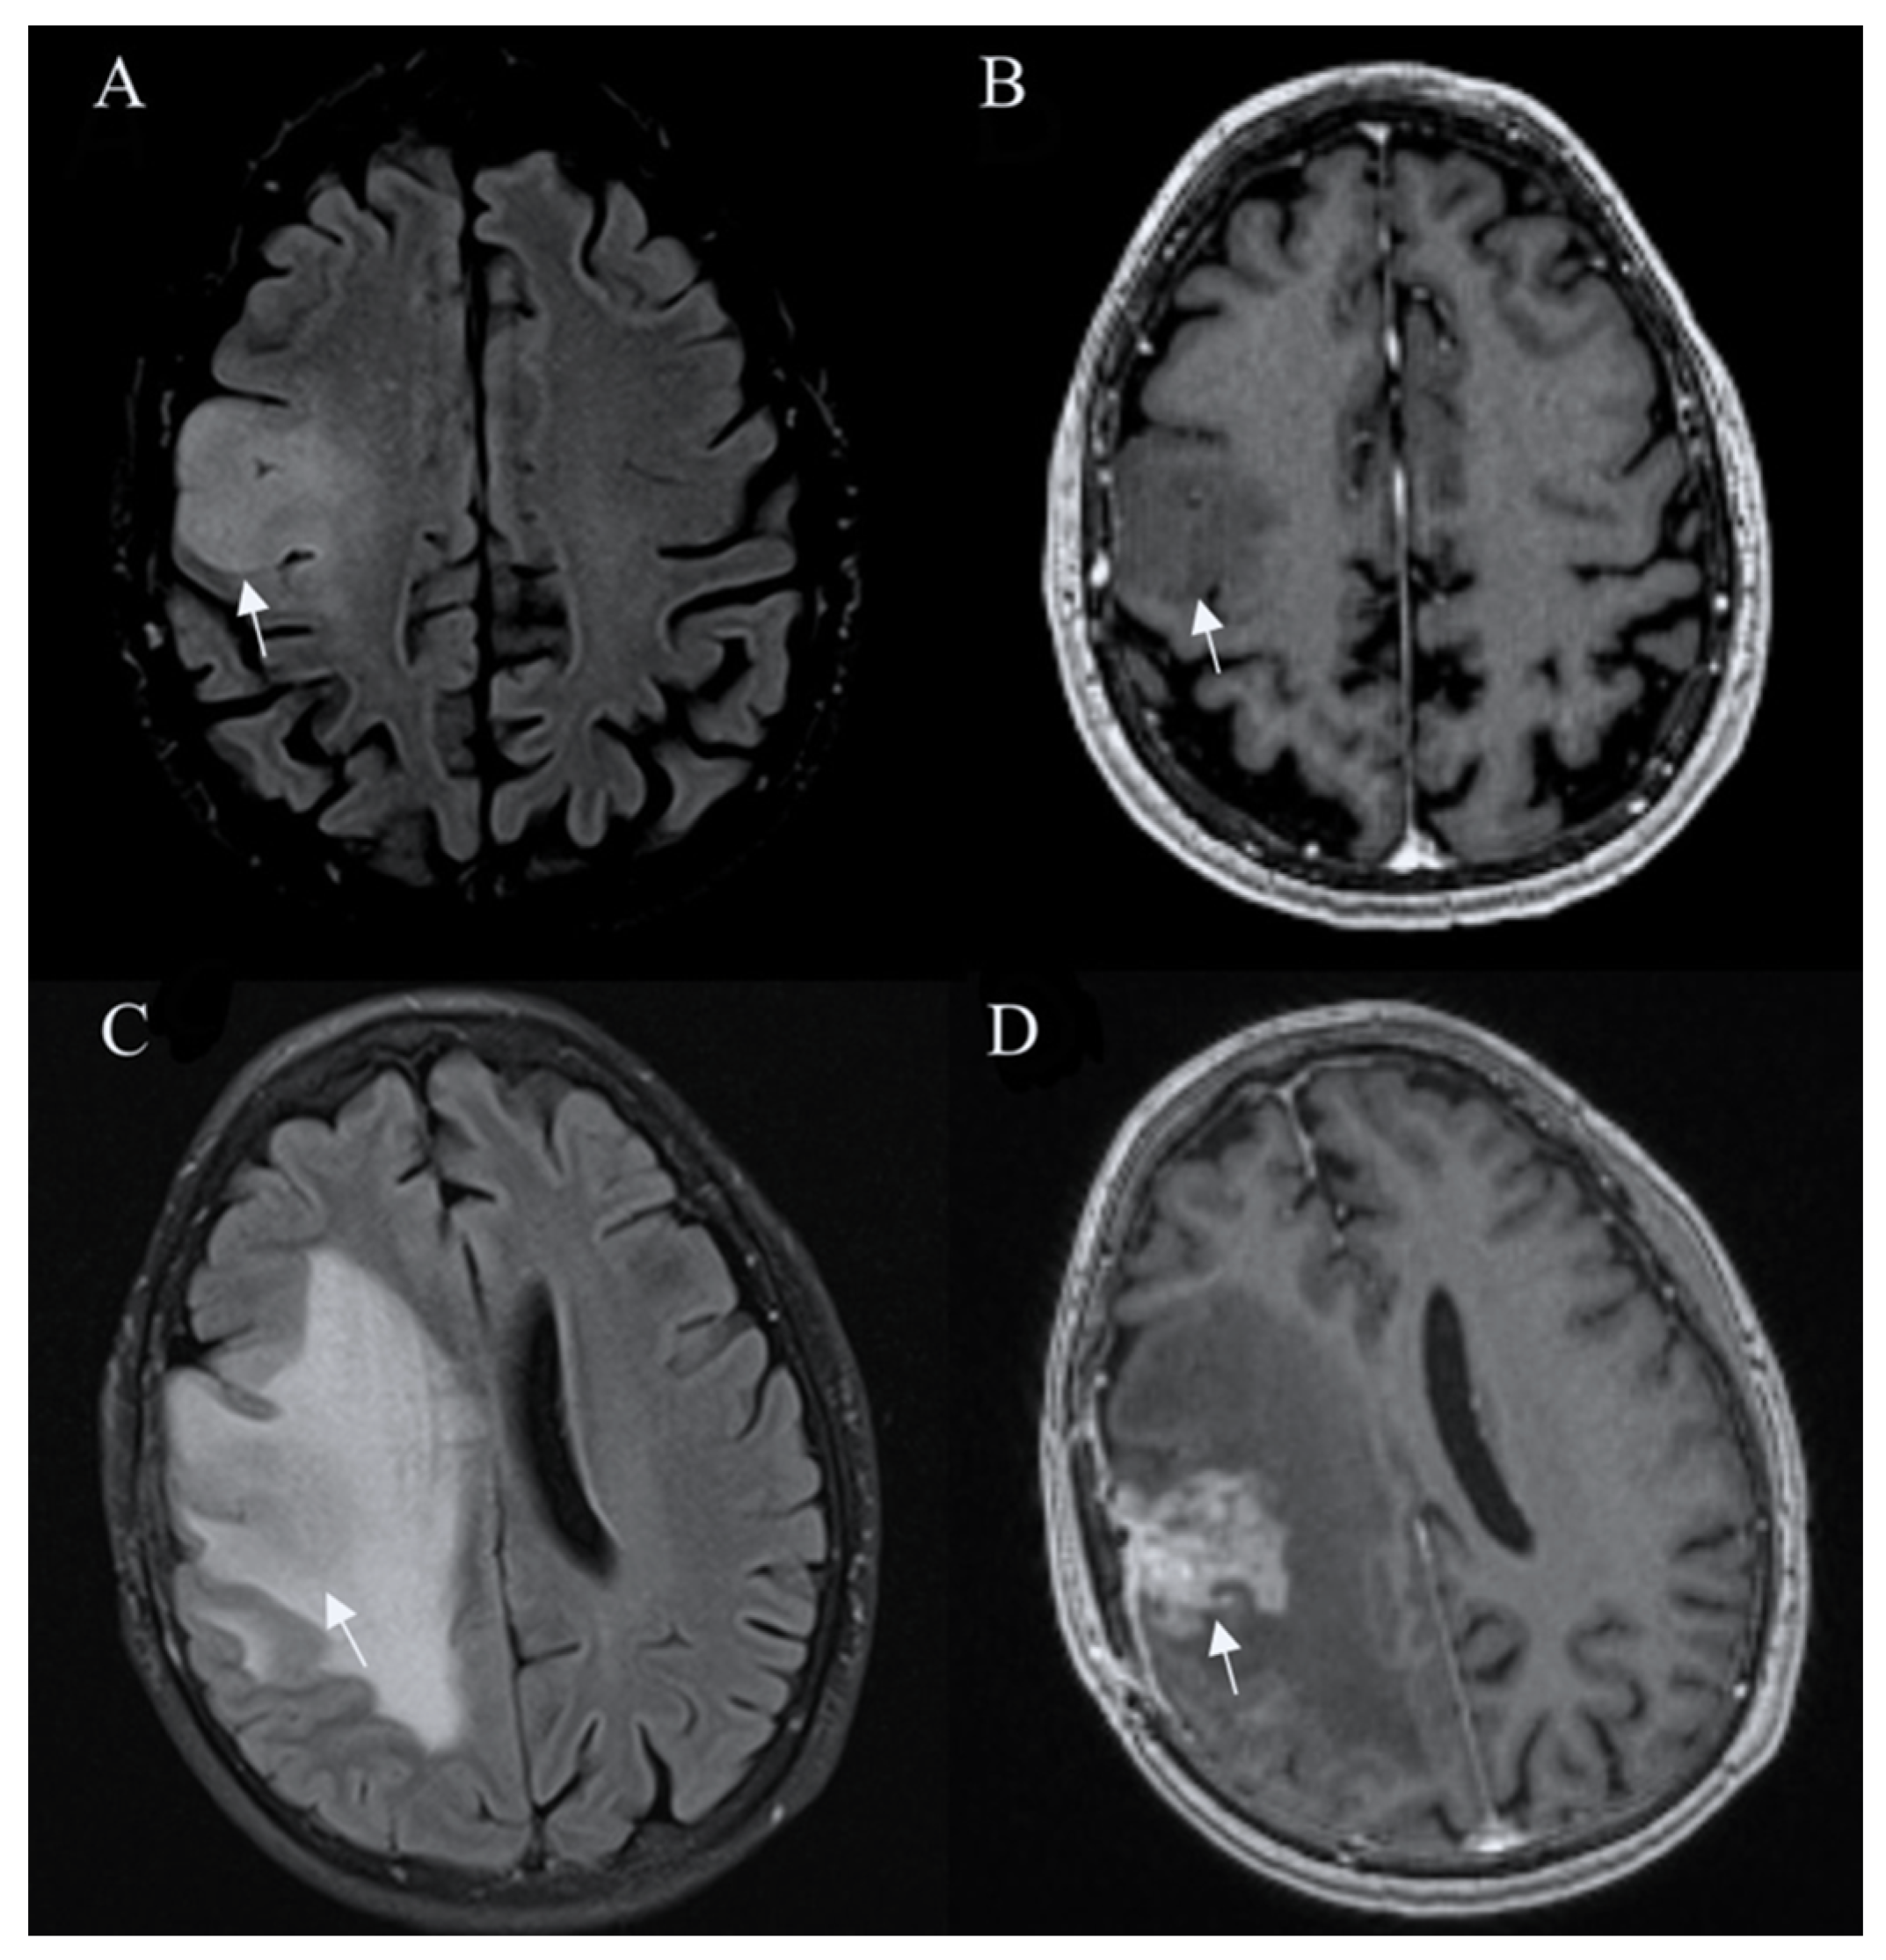
Abstract
:1. Introduction
2. Biomolecular Diagnostics
2.1. Isocitrate Dehydrogenase (IDH)
2.2. 1p19q Codeletion
2.3. MGMT Promoter
3. Imaging Techniques for the Guidance of Glioma Diagnostic
3.1. Computed Tomography
3.2. MRI
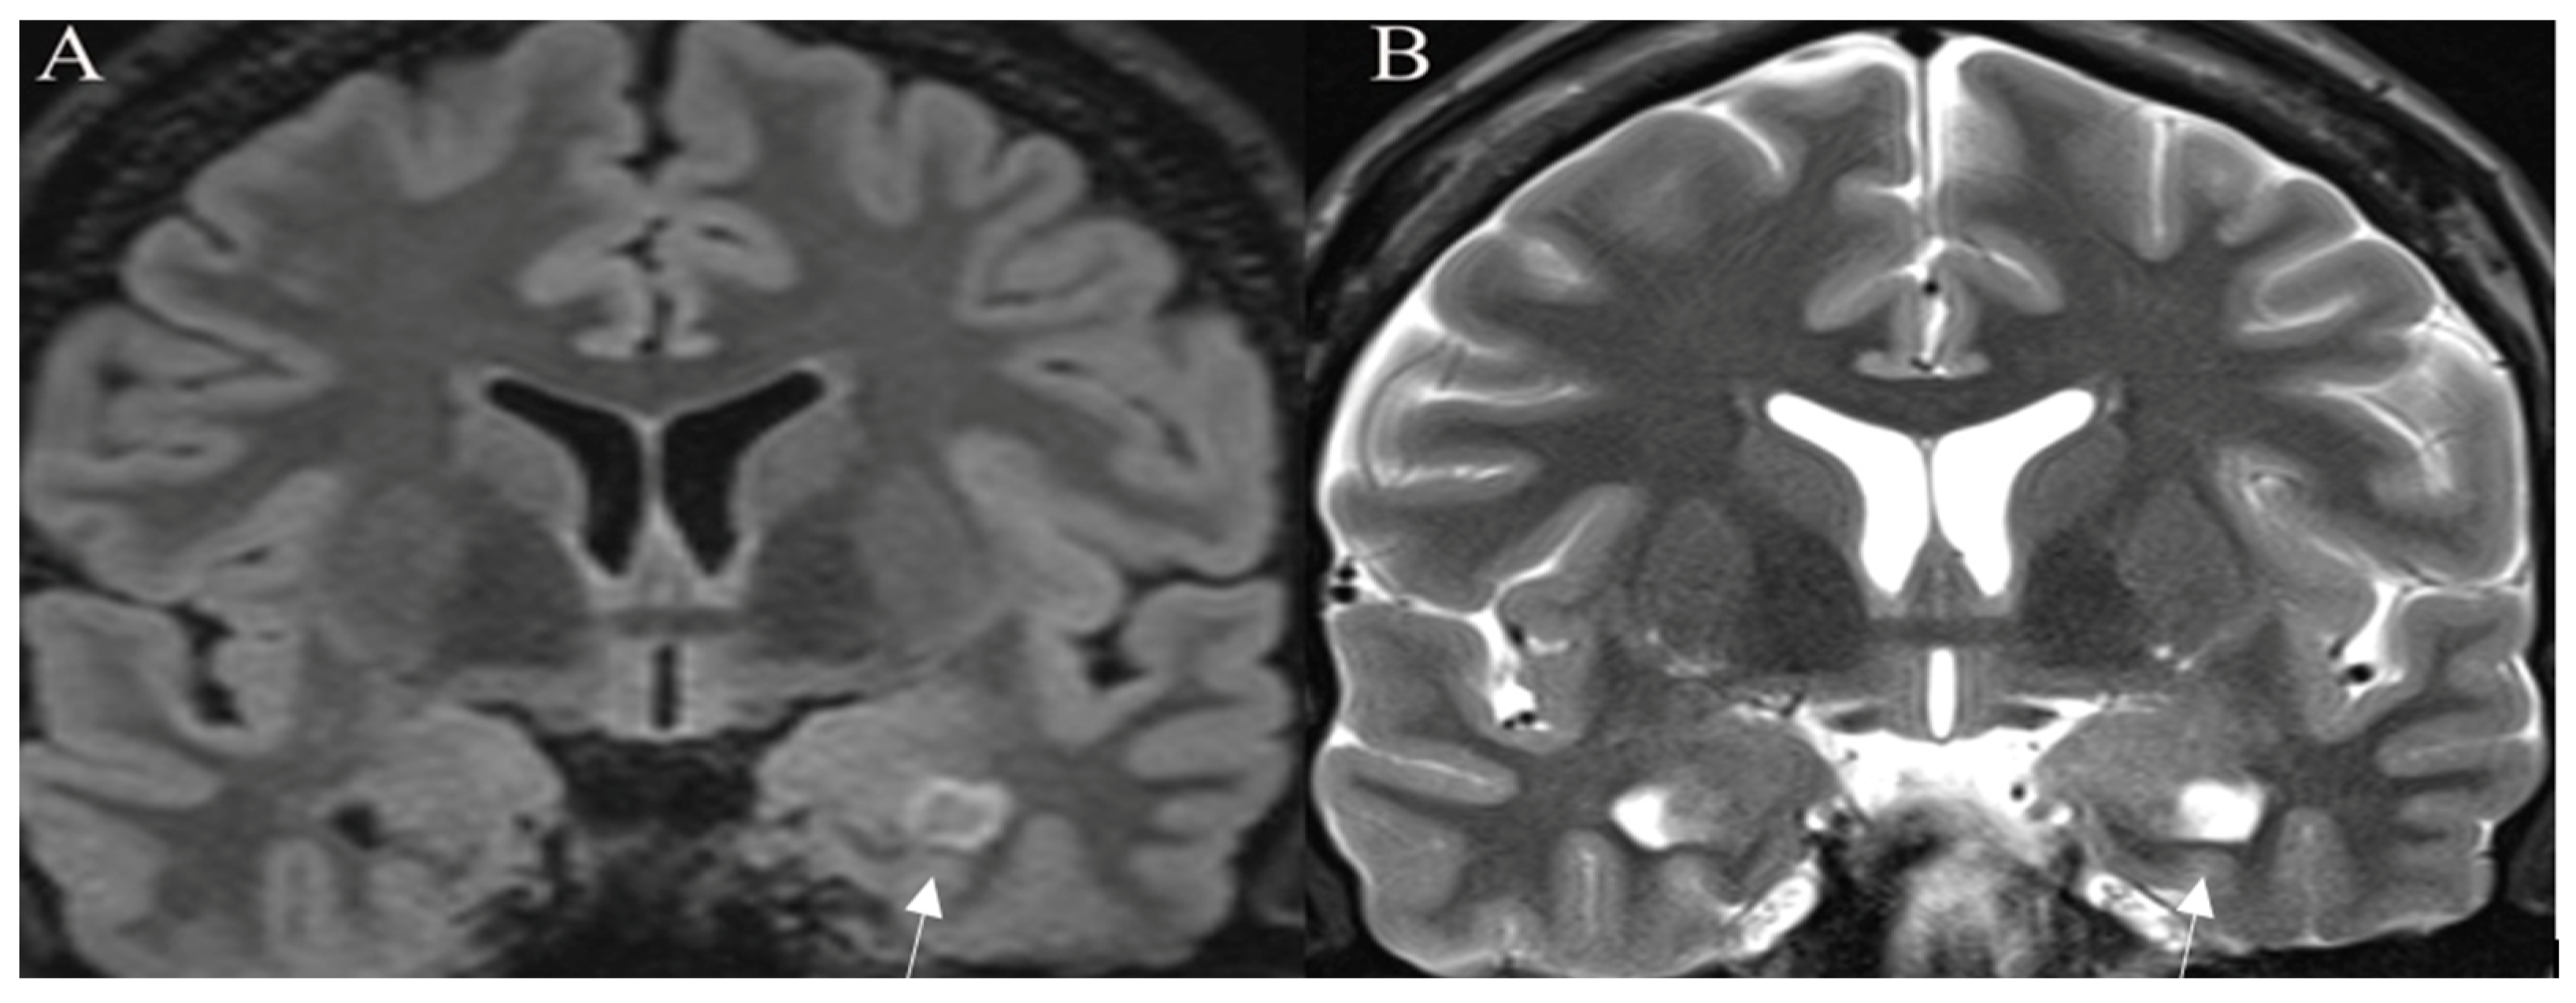
Standard Imaging Sequences
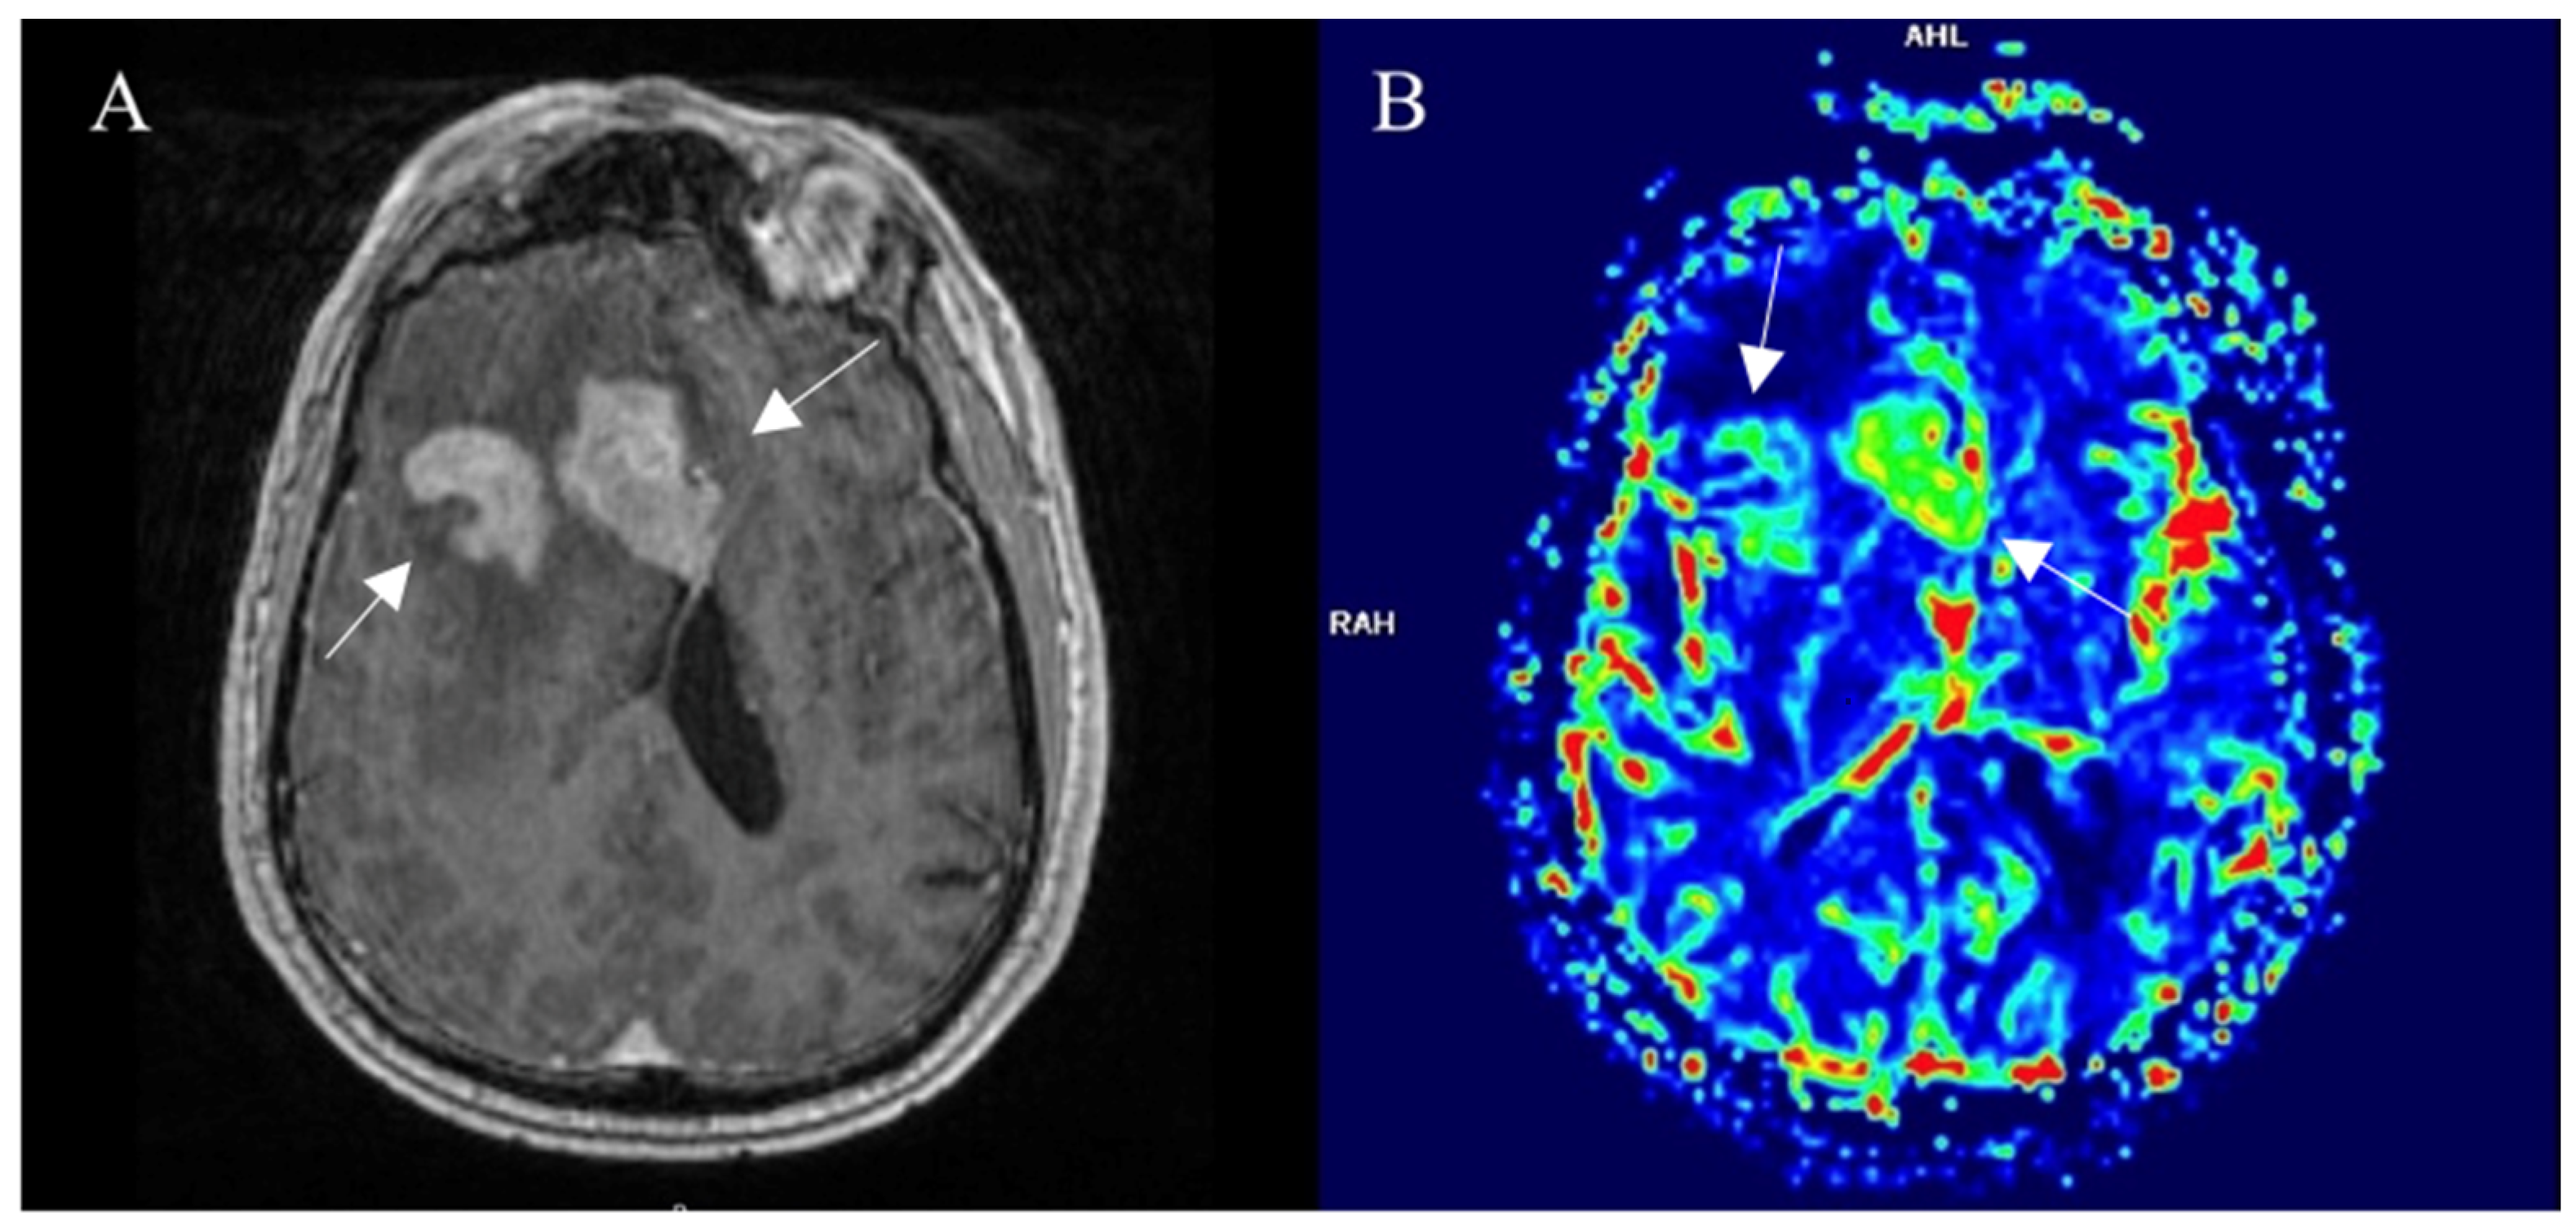
3.3. Perfusion-Based Imaging
3.3.1. Dynamic Susceptibility Contrast
3.3.2. Dynamic Contrast Enhancement
3.3.3. Arterial Spin Labelling
3.4. Advanced MR Imaging
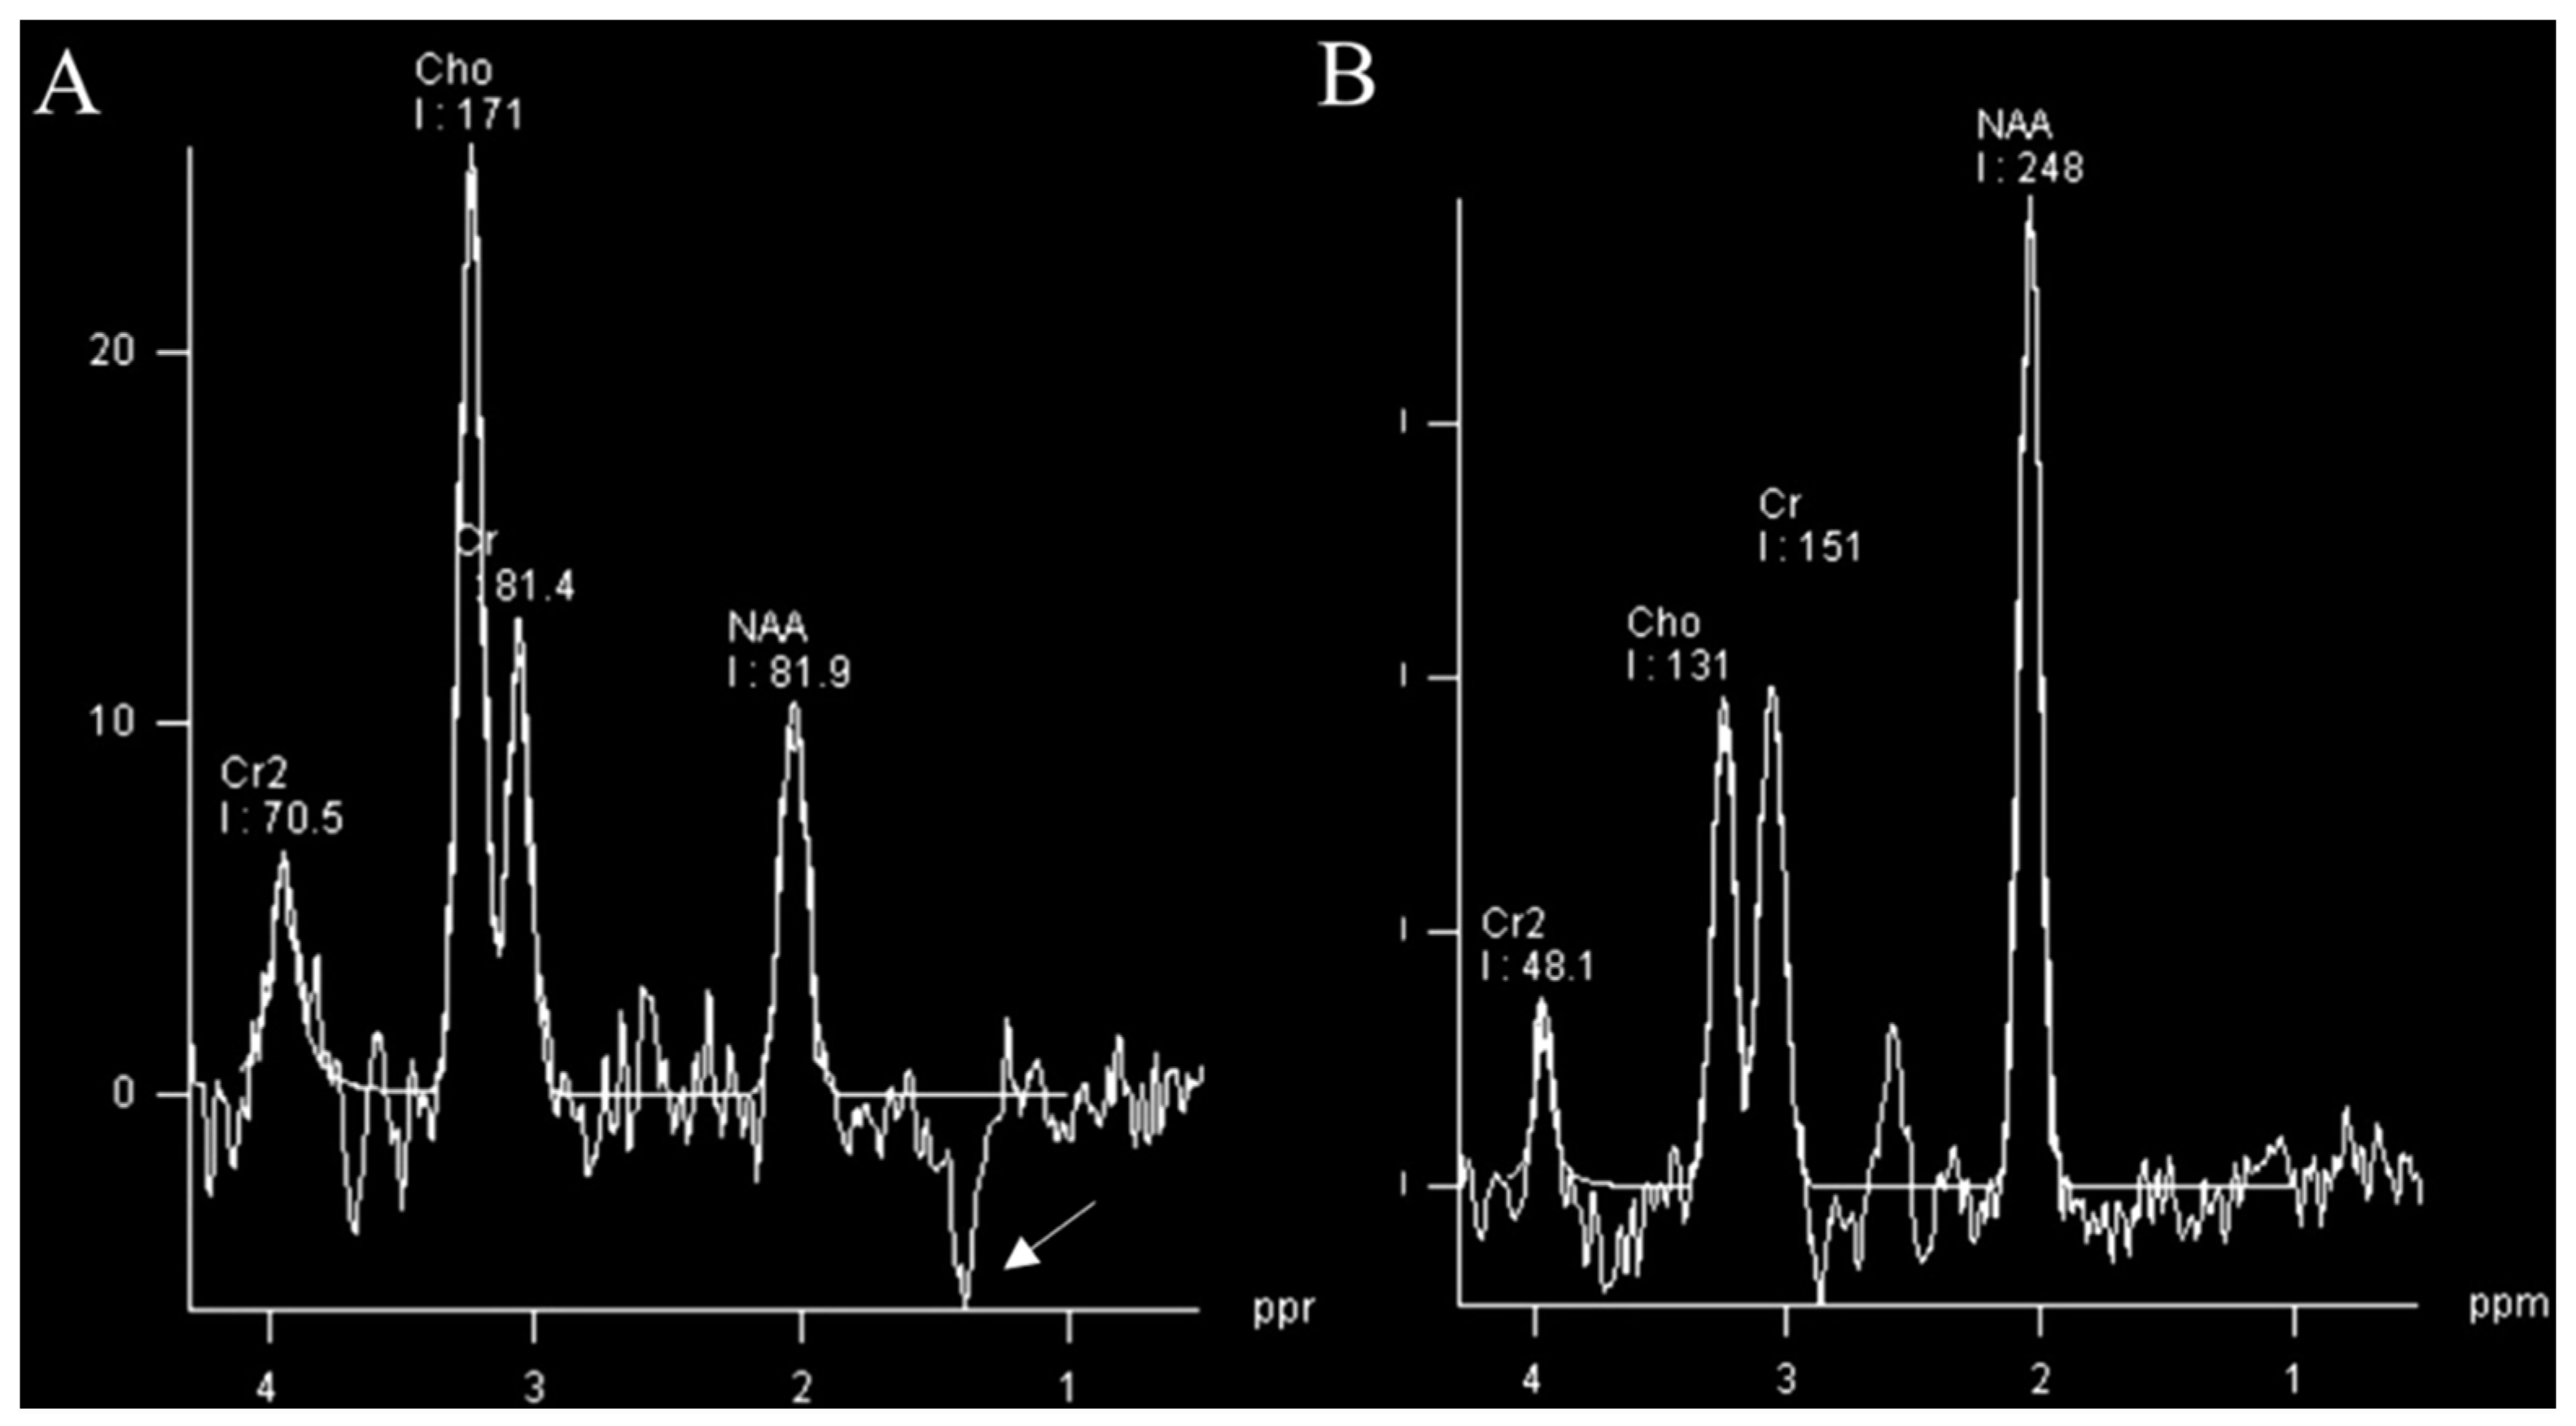
3.4.1. Spectroscopy
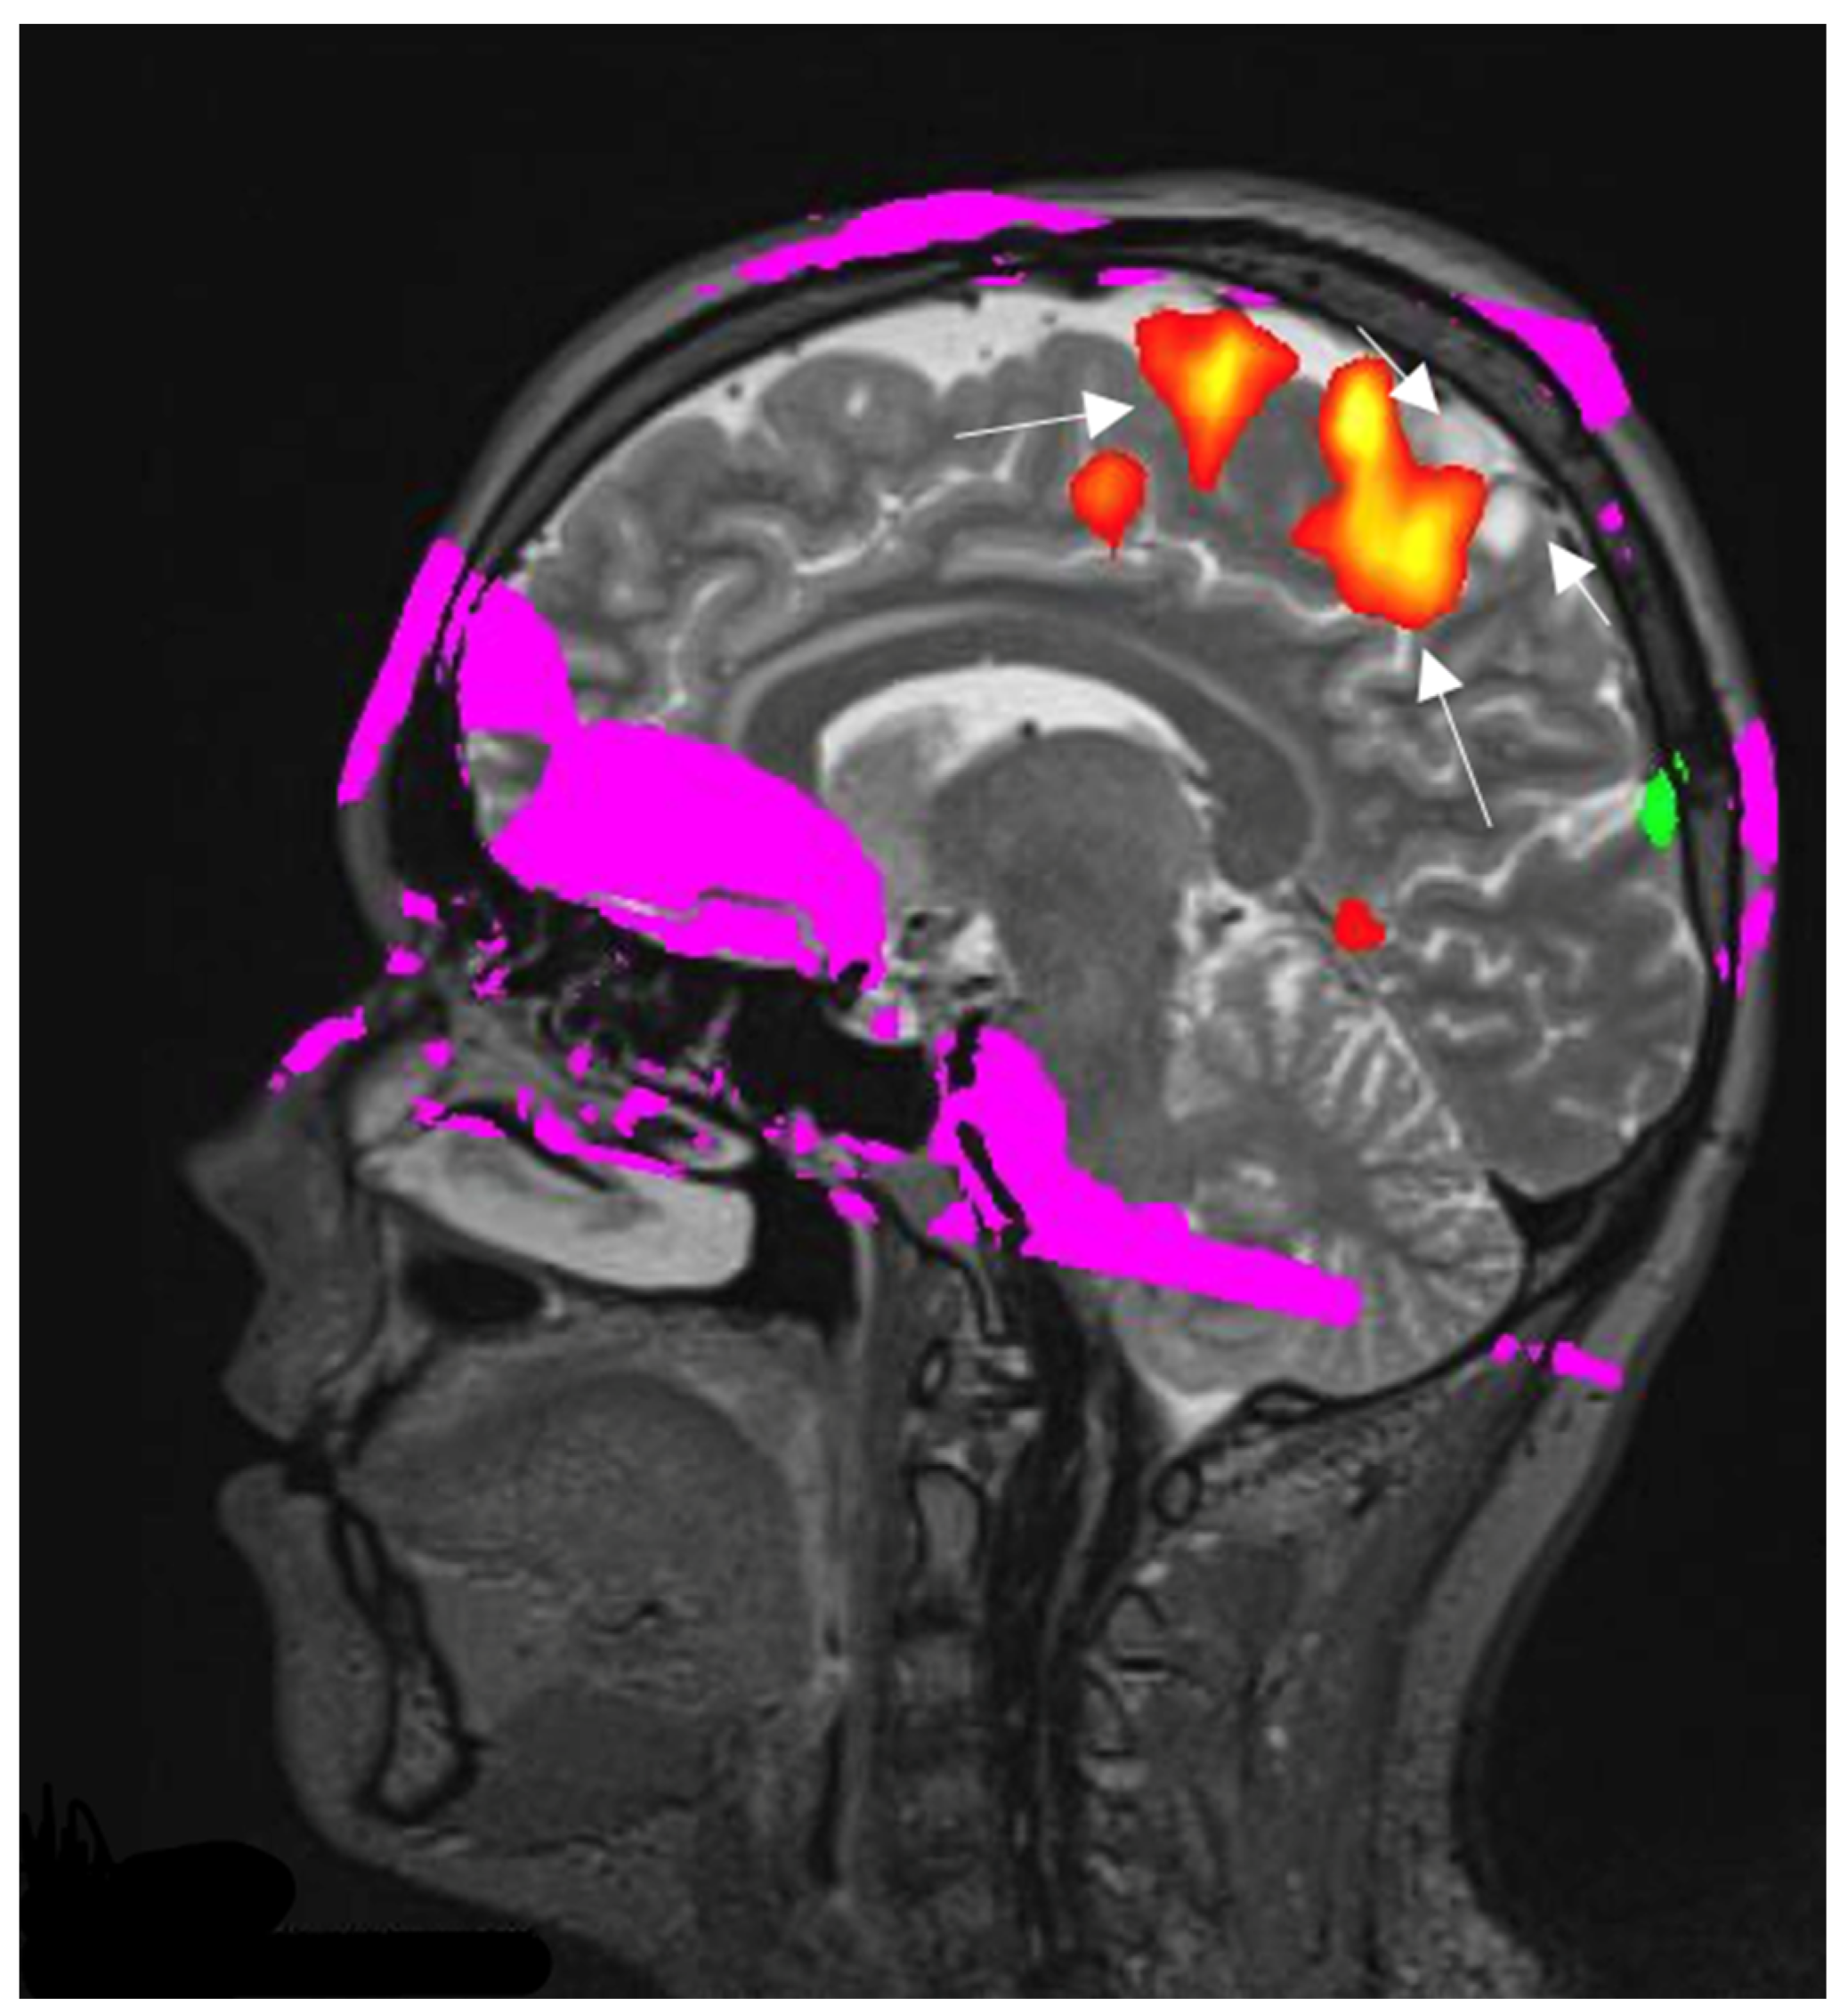
3.4.2. fMRI
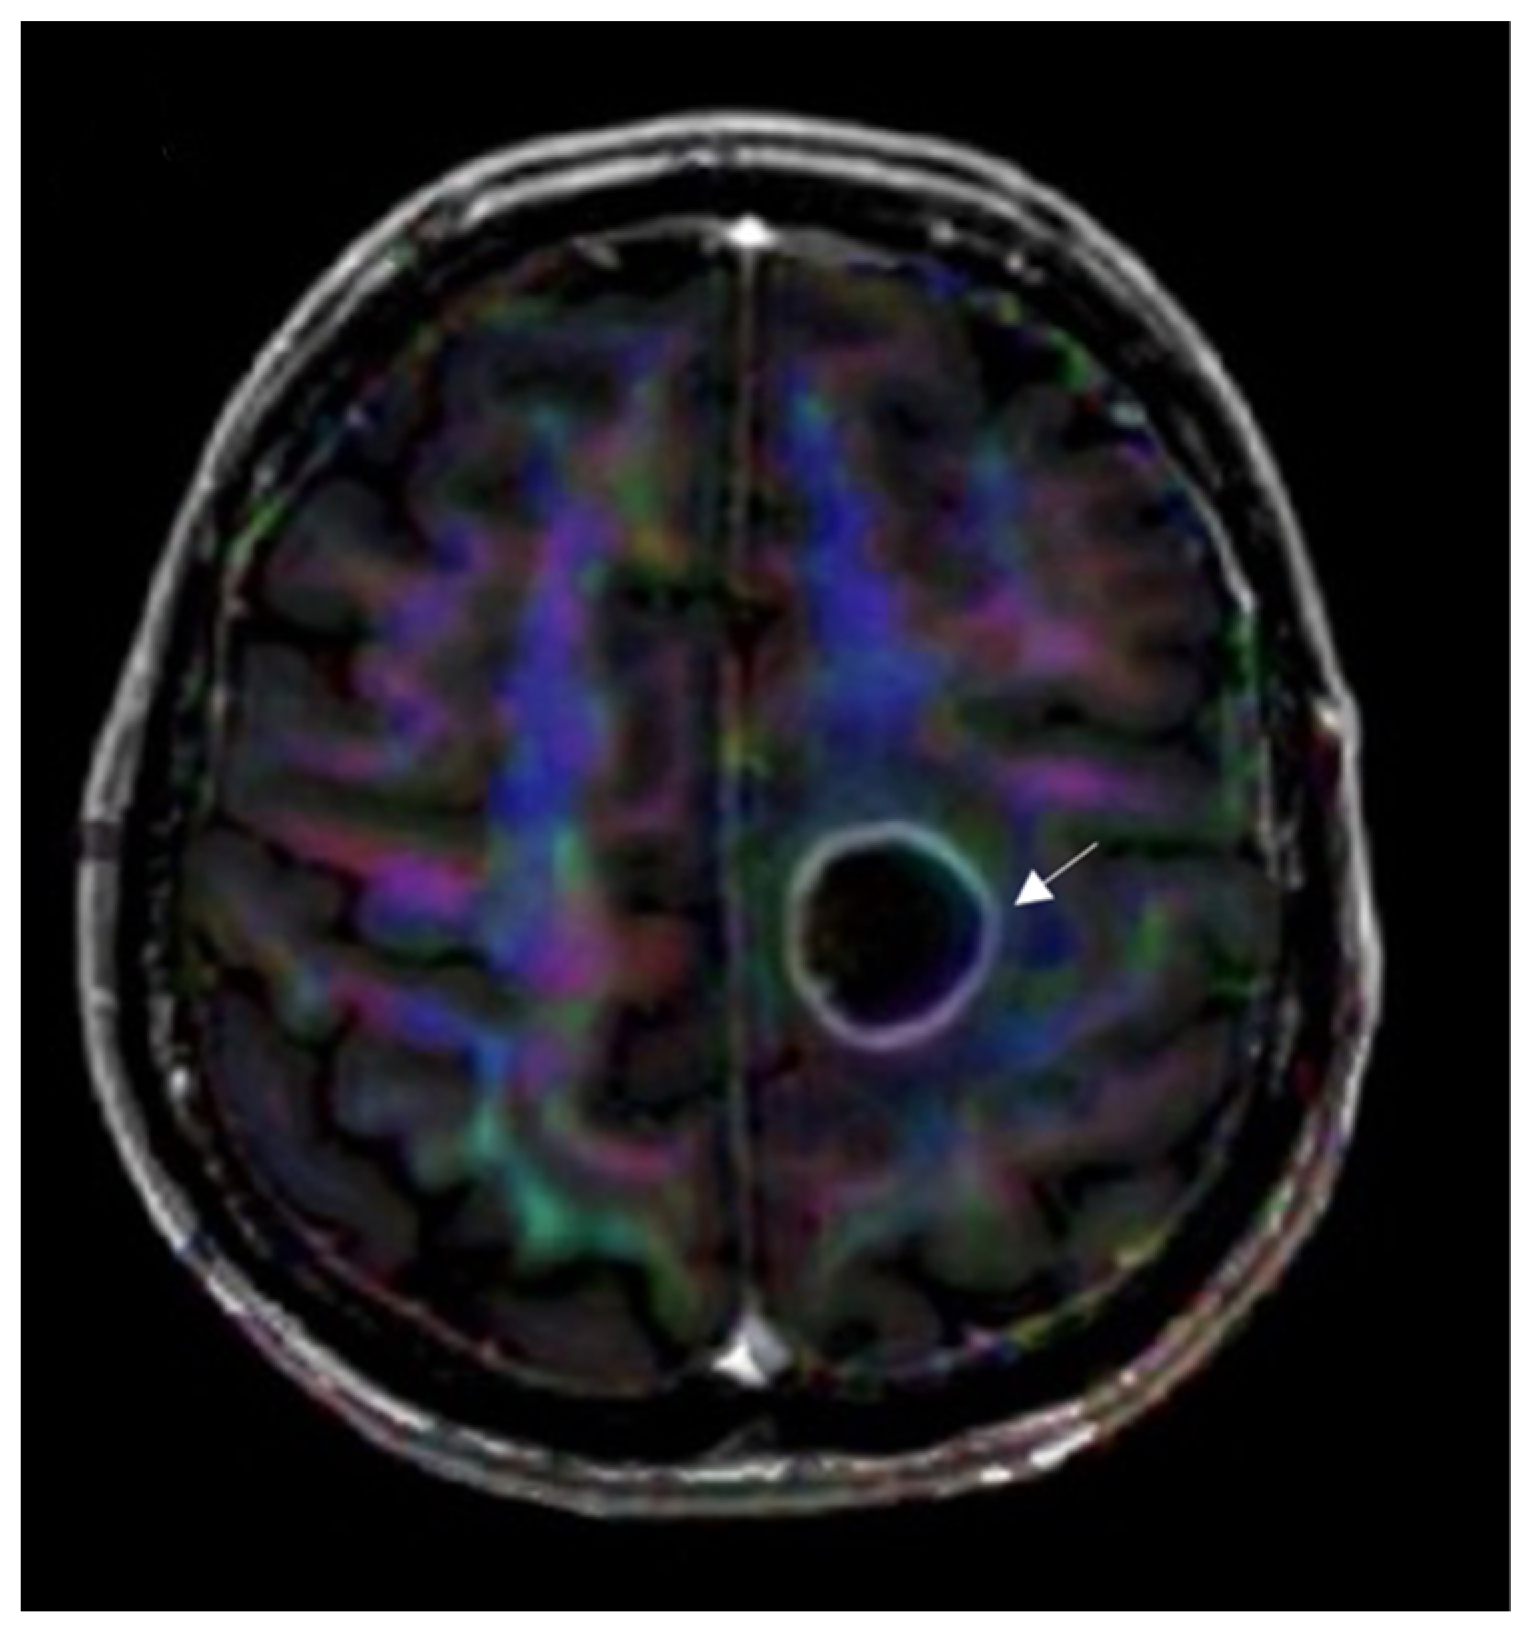
3.4.3. Diffusion Tensor Imaging
3.5. Nuclear Medicine Imaging
3.5.1. Positron Emission Tomography
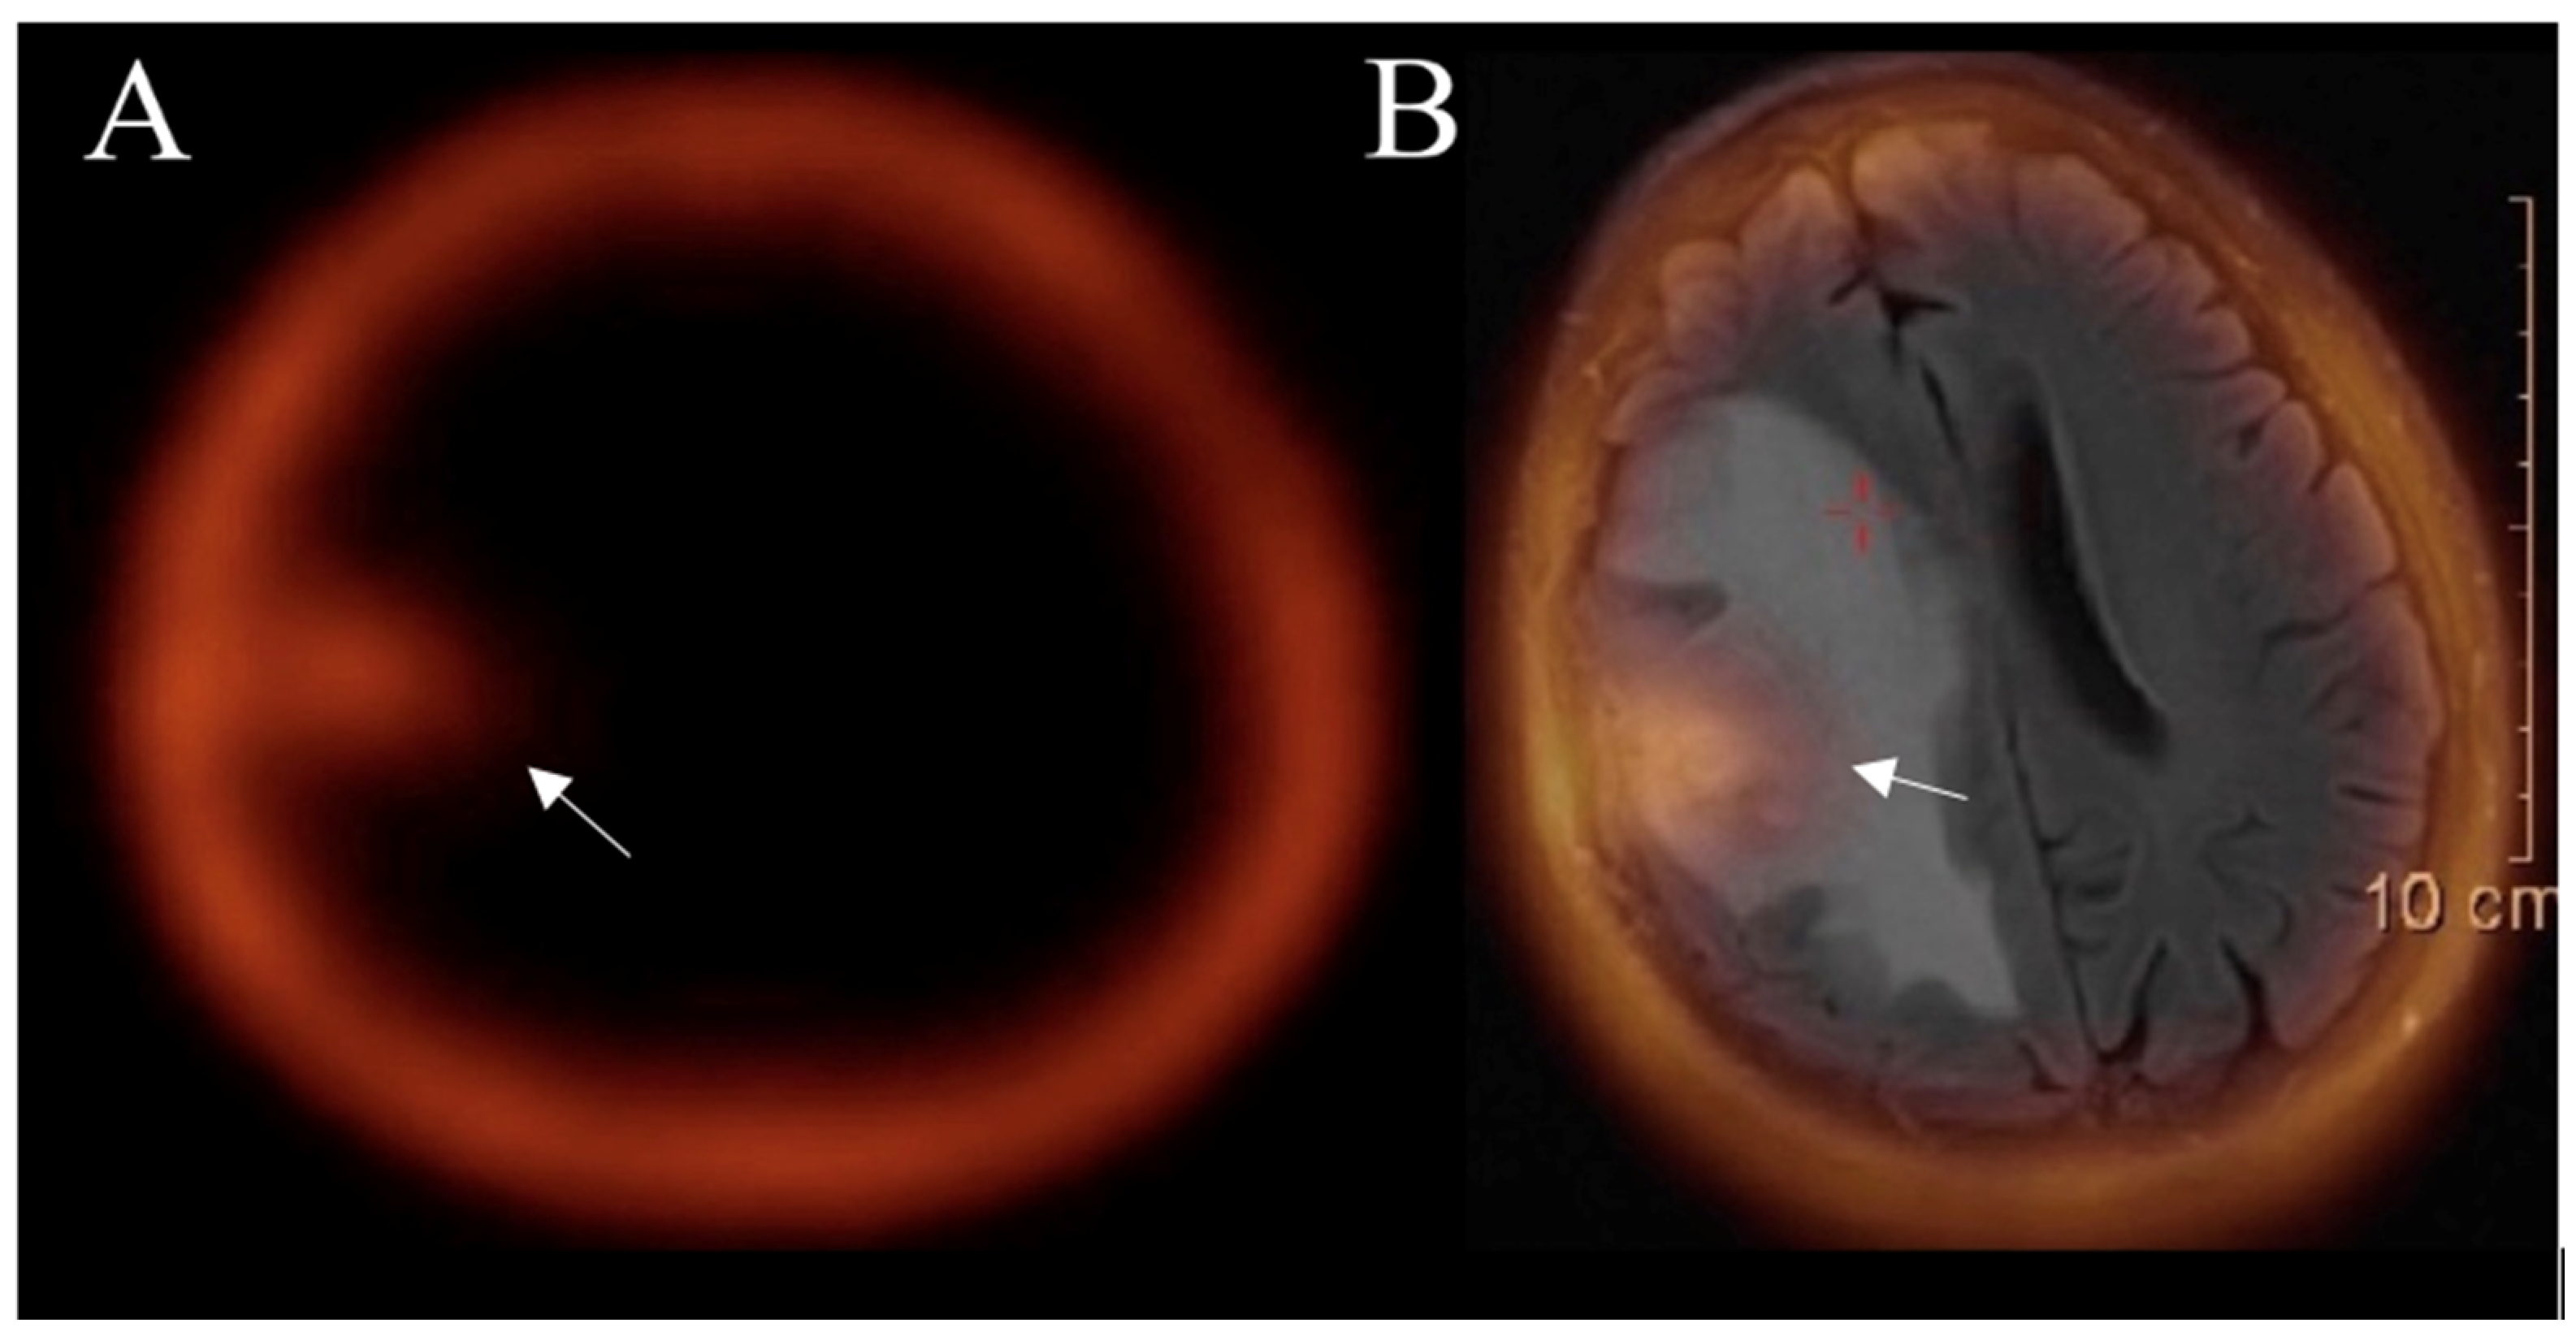
3.5.2. SPECT
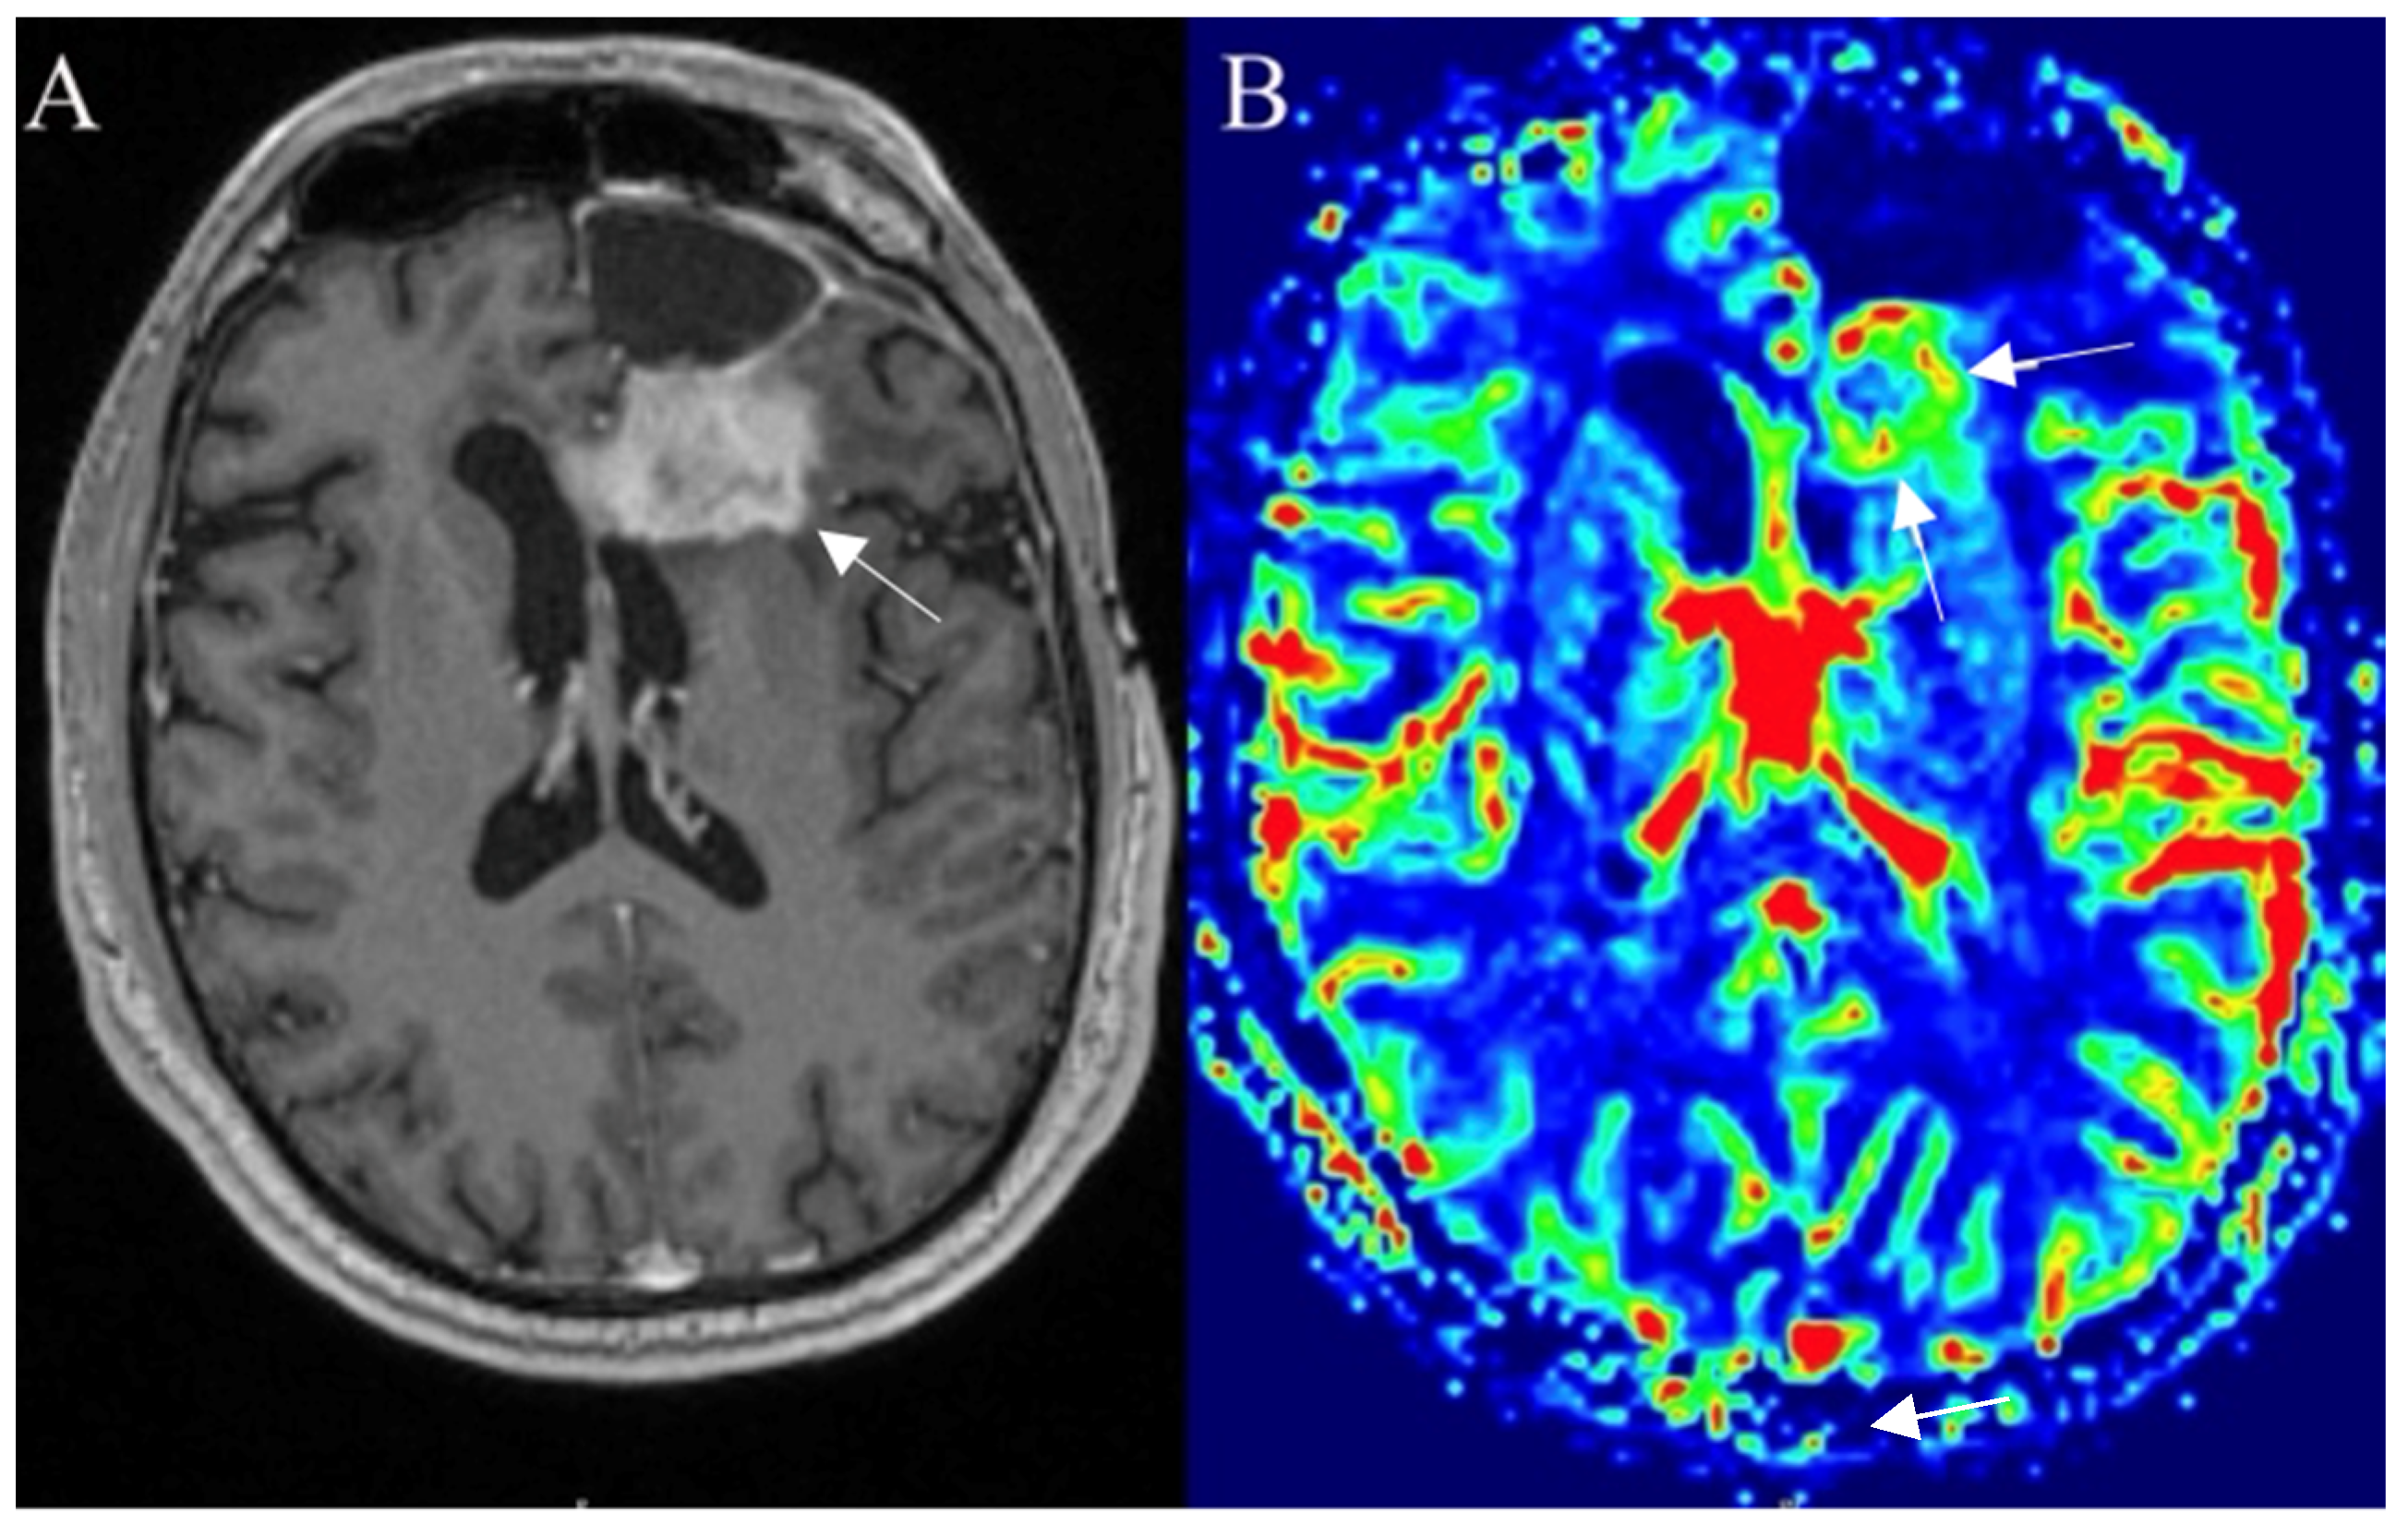
3.6. Posttreatment Imaging
3.6.1. True Progression
3.6.2. Pseudoprogression
3.6.3. Pseudoresponse
3.6.4. Radiation Necrosis
3.6.5. Imaging after Immunotherapy
4. Conclusions
Author Contributions
Funding
Institutional Review Board Statement
Informed Consent Statement
Data Availability Statement
Conflicts of Interest
References
- Wesseling, P.; Capper, D. WHO 2016 Classification of gliomas. Neuropathol. Appl. Neurobiol. 2018, 44, 139–150. [Google Scholar] [CrossRef] [PubMed]
- Sanson, M.; Marie, Y.; Paris, S.; Idbaih, A.; Laffaire, J.; Ducray, F.; El Hallani, S.; Boisselier, B.; Mokhtari, K.; Hoang-Xuan, K.; et al. Isocitrate dehydrogenase 1 codon 132 mutation is an important prognostic biomarker in gliomas. J. Clin. Oncol. 2009, 27, 4150–4154. [Google Scholar] [CrossRef]
- Louis, D.N.; Perry, A.; Wesseling, P.; Brat, D.J.; Cree, I.A.; Figarella-Branger, D.; Hawkins, C.; Ng, H.K.; Pfister, S.M.; Reifenberger, G.; et al. The 2021 WHO Classification of Tumors of the Central Nervous System: A summary. Neuro-Oncology 2021, 23, 1231–1251. [Google Scholar] [CrossRef]
- Wirsching, H.G.; Galanis, E.; Weller, M. Glioblastoma. Handb. Clin. Neurol. 2016, 134, 381–397. [Google Scholar] [CrossRef] [PubMed]
- Molenaar, R.J.; Verbaan, D.; Lamba, S.; Zanon, C.; Jeuken, J.W.; Boots-Sprenger, S.H.; Wesseling, P.; Hulsebos, T.J.; Troost, D.; van Tilborg, A.A.; et al. The combination of IDH1 mutations and MGMT methylation status predicts survival in glioblastoma better than either IDH1 or MGMT alone. Neuro-Oncology 2014, 16, 1263–1273. [Google Scholar] [CrossRef] [PubMed]
- Lv, S.; Teugels, E.; Sadones, J.; De Brakeleer, S.; Duerinck, J.; Du Four, S.; Michotte, A.; De Grève, J.; Neyns, B. Correlation of EGFR, IDH1 and PTEN status with the outcome of patients with recurrent glioblastoma treated in a phase II clinical trial with the EGFR-blocking monoclonal antibody cetuximab. Int. J. Oncol. 2012, 41, 1029–1035. [Google Scholar] [CrossRef]
- Cheng, H.B.; Yue, W.; Xie, C.; Zhang, R.Y.; Hu, S.S.; Wang, Z. IDH1 mutation is associated with improved overall survival in patients with glioblastoma: A meta-analysis. Tumor Biol. 2013, 34, 3555–3559. [Google Scholar] [CrossRef]
- Carrillo, J.A.; Lai, A.; Nghiemphu, P.L.; Kim, H.J.; Phillips, H.S.; Kharbanda, S.; Moftakhar, P.; Lalaezari, S.; Yong, W.; Ellingson, B.M.; et al. Relationship between tumor enhancement, edema, IDH1 mutational status, MGMT promoter methylation, and survival in glioblastoma. AJNR Am. J. Neuroradiol. 2012, 33, 1349–1355. [Google Scholar] [CrossRef] [PubMed]
- Wang, K.; Wang, Y.; Fan, X.; Wang, J.; Li, G.; Ma, J.; Ma, J.; Jiang, T.; Dai, J. Radiological features combined with IDH1 status for predicting the survival outcome of glioblastoma patients. Neuro-Oncology 2016, 18, 589–597. [Google Scholar] [CrossRef]
- Lacroix, M.; Abi-Said, D.; Fourney, D.R.; Gokaslan, Z.L.; Shi, W.; DeMonte, F.; Lang, F.F.; McCutcheon, I.E.; Hassenbusch, S.J.; Holland, E.; et al. A multivariate analysis of 416 patients with glioblastoma multiforme: Prognosis, extent of resection, and survival. J. Neurosurg. 2001, 95, 190–198. [Google Scholar] [CrossRef]
- Pope, W.B.; Sayre, J.; Perlina, A.; Villablanca, J.P.; Mischel, P.S.; Cloughesy, T.F. MR imaging correlates of survival in patients with high-grade gliomas. AJNR Am. J. Neuroradiol. 2005, 26, 2466–2474. [Google Scholar] [PubMed]
- Jafri, N.F.; Clarke, J.L.; Weinberg, V.; Barani, I.J.; Cha, S. Relationship of glioblastoma multiforme to the subventricular zone is associated with survival. Neuro-Oncology 2013, 15, 91–96. [Google Scholar] [CrossRef] [PubMed]
- Kappadakunnel, M.; Eskin, A.; Dong, J.; Nelson, S.F.; Mischel, P.S.; Liau, L.M.; Ngheimphu, P.; Lai, A.; Cloughesy, T.F.; Goldin, J.; et al. Stem cell associated gene expression in glioblastoma multiforme: Relationship to survival and the subventricular zone. J. Neurooncol. 2010, 96, 359–367. [Google Scholar] [CrossRef] [PubMed]
- Pallini, R.; Ricci-Vitiani, L.; Banna, G.L.; Signore, M.; Lombardi, D.; Todaro, M.; Stassi, G.; Martini, M.; Maira, G.; Larocca, L.M.; et al. Cancer stem cell analysis, and clinical outcome in patients with glioblastoma multiforme. Clin. Cancer Res. 2008, 14, 8205–8212. [Google Scholar] [CrossRef]
- Hu, H.; Wang, Z.; Liu, Y.; Zhang, C.; Li, M.; Zhang, W.; Wang, K.; Cai, J.; Cheng, W.; Huang, H.; et al. Genome-wide transcriptional analyses of Chinese patients reveal cell migration is attenuated in IDH1-mutant glioblastomas. Cancer Lett. 2015, 357, 566–574. [Google Scholar] [CrossRef]
- Yan, W.; Zhang, W.; You, G.; Bao, Z.; Wang, Y. Correlation of IDH1 Mutation with Clinicopathologic Factors and Prognosis in Primary Glioblastoma: A Report of 118 Patients from China. PLoS ONE 2012, 7, e30339. [Google Scholar] [CrossRef]
- Pope, W.B.; Chen, J.H.; Dong, J.; Carlson, M.R.; Perlina, A.; Cloughesy, T.F.; Liau, L.M.; Mischel, P.S.; Nghiemphu, P.; Lai, A.; et al. Relationship between gene expression and enhancement in glioblastoma multiforme: Exploratory DNA microarray analysis. Radiology 2008, 249, 268–277. [Google Scholar] [CrossRef]
- Lasocki, A.; Gaillard, F.; Tacey, M.; Drummond, K.; Stuckey, S. Morphologic patterns of noncontrast-enhancing tumor in glioblastoma correlate with IDH1 mutation status and patient survival. J. Clin. Neurosci. 2018, 47, 168–173. [Google Scholar] [CrossRef]
- Cairncross, G.; Wang, M.; Shaw, E.; Jenkins, R.; Brachman, D.; Buckner, J.; Fink, K.; Souhami, L.; Laperriere, N.; Curran, W.; et al. Phase III trial of chemoradiotherapy for anaplastic oligodendroglioma: Long-term results of RTOG 9402. J. Clin. Oncol. 2013, 20, 337–343. [Google Scholar] [CrossRef]
- van den Bent, M.J.; Brandes, A.A.; Taphoorn, M.J.; Kros, J.M.; Kouwenhoven, M.C.; Delattre, J.Y.; Bernsen, H.J.; Frenay, M.; Tijssen, C.C.; Grisold, W.; et al. Adjuvant procarbazine, lomustine, and vincristine chemotherapy in newly diagnosed anaplastic oligodendroglioma: Long-term follow-up of EORTC brain tumor group study 26,951. J. Clin. Oncol. 2013, 31, 344–350. [Google Scholar] [CrossRef]
- Weller, M.; van den Bent, M.; Hopkins, K.; Tonn, J.C.; Stupp, R.; Falini, A.; Cohen-Jonathan-Moyal, E.; Frappaz, D.; Henriksson, R.; Balana, C.; et al. EANO guideline for the diagnosis and treatment of anaplastic gliomas and glioblastoma. Lancet Oncol. 2014, 15, 395–403. [Google Scholar] [CrossRef] [PubMed]
- Malmström, A.; Grønberg, B.H.; Marosi, C.; Stupp, R.; Frappaz, D.; Schultz, H.; Abacioglu, U.; Tavelin, B.; Lhermitte, B.; Hegi, M.E.; et al. Temozolomide versus standard 6-week radiotherapy versus hypofractionated radiotherapy in patients older than 60 years with glioblastoma: The Nordic randomised, phase 3 trial. Lancet Oncol. 2012, 13, 916–926. [Google Scholar] [CrossRef] [PubMed]
- Wick, W.; Gorlia, T.; Van Den Bent, J.M.; Vecht, J.C.; Steuve, J.; Platten, M.; Brandes, A.A.; Kosch, M.A.; Hegi, M.E.; Lhermitte, B.; et al. Radiation therapy and concurrent plus adjuvant temsirolimus (CCI-779) versus chemoradiation with temozolomide in newly diagnosed glioblastoma without methylation of the MGMT gene promoter. J. Clin. Oncol. 2014, 32, 2003. [Google Scholar] [CrossRef]
- Weller, M.; Stupp, R.; Reifenberger, G.; Brandes, A.A.; van den Bent, M.J.; Wick, W.; Hegi, M.E. MGMT promoter methylation in malignant gliomas: Ready for personalized medicine? Nat. Rev. Neurol. 2010, 6, 39–51. [Google Scholar] [CrossRef] [PubMed]
- Jung, T.Y.; Jung, S. Early neuroimaging findings of glioblastoma mimicking non-neoplastic cerebral lesion. Neurol. Med. Chir. 2007, 47, 424–427. [Google Scholar] [CrossRef]
- Ostrom, Q.T.; Gittleman, H.; de Blank, P.M.; Finlay, J.L.; Gurney, J.G.; McKean-Cowdin, R.; Stearns, D.S.; Wolff, J.E.; Liu, M.; Wolinsky, Y.; et al. American Brain Tumor Association Adolescent and Young Adult Primary Brain and Central Nervous System Tumors Diagnosed in the United States in 2008–2012. Neuro-Oncology 2016, 18, 1–50. [Google Scholar] [CrossRef]
- Young, G.S. Advanced MRI of adult brain tumors. Neurol. Clin. 2007, 25, 947–973. [Google Scholar] [CrossRef]
- Price, S.J.; Gillard, J.H. Imaging biomarkers of brain tumor margin and tumor invasion. Br. J. Radiol. 2011, 84, 159–167. [Google Scholar] [CrossRef]
- Cha, S. Update on brain tumor imaging: From anatomy to physiology. AJNR Am. J. Neuroradiol. 2006, 27, 475–487. [Google Scholar]
- Stancheva, G.; Goranova, T.; Laleva, M.; Kamenova, M.; Mitkova, A.; Velinov, N.; Poptodorov, G.; Mitev, V.; Kaneva, R.; Gabrovsky, N. IDH1/IDH2 but Not TP53 Mutations Predict Prognosis in Bulgarian Glioblastoma Patients. BioMed Res. Int. 2014, 2014, 654727. [Google Scholar] [CrossRef]
- Ostrom, Q.T.; Gittleman, H.; Truitt, G.; Boscia, A.; Kruchko, C.; Barnholtz-Sloan, J.S. CBTRUS Statistical Report: Primary Brain and Other Central Nervous System Tumors Diagnosed in the United States in 2011–2015. Neuro-Oncology 2018, 20, 1–86. [Google Scholar] [CrossRef] [PubMed]
- Tan, A.C.; Ashley, D.M.; López, G.Y.; Malinzak, M.; Friedman, H.S.; Khasraw, M. Management of glioblastoma: State of the art and future directions. CA A Cancer J. Clin. 2020, 4, 299–312. [Google Scholar] [CrossRef] [PubMed]
- Suh, C.H.; Kim, H.S.; Jung, S.C.; Choi, C.G.; Kim, S.J. Clinically Relevant Imaging Features for MGMT Promoter Methylation in Multiple Glioblastoma Studies: A Systematic Review and Meta-Analysis. Am. J. Neuroradiol. 2018, 39, 1439–1445. [Google Scholar] [PubMed]
- Lasocki, A.; Gaillard, F.; Tacey, M.; Drummond, K.; Stuckey, S. Incidence, and prognostic significance of non-enhancing cortical signal abnormality in glioblastoma. J. Med. Imaging Radiat. Oncol. 2016, 60, 66–73. [Google Scholar] [CrossRef]
- Ohgaki, H.; Kleihues, P. The definition of primary and secondary glioblastoma. Clin. Cancer Res. 2013, 19, 764–772. [Google Scholar] [CrossRef] [PubMed]
- McGehee, B.E.; Pollock, J.M.; Maldjian, J.A. Brain perfusion imaging: How does it work and what should I use? J. Magn. Reson. Imaging 2012, 36, 1257–1272. [Google Scholar] [CrossRef] [PubMed]
- Kelm, Z.S.; Korfiatis, P.D.; Lingineni, R.K.; Daniels, J.R.; Buckner, J.C.; Lachance, D.H.; Parney, I.F.; Carter, R.E.; Erickson, B.J. Variability and accuracy of different software packages for dynamic susceptibility contrast magnetic resonance imaging for distinguishing glioblastoma progression from pseudoprogression. J. Med. Imaging 2015, 2, 1–26. [Google Scholar] [CrossRef]
- Kim, R.; Choi, S.H.; Yun, T.J.; Lee, S.T.; Park, C.K.; Kim, T.M.; Kim, J.H.; Park, S.W.; Sohn, C.H.; Park, S.H.; et al. Prognosis prediction of non-enhancing T2 high signal intensity lesions in glioblastoma patients after standard treatment: Application of dynamic contrast-enhanced MR imaging. Eur. Radiol. 2017, 27, 1176–1185. [Google Scholar] [CrossRef]
- van Dijken, B.R.J.; van Laar, P.J.; Smits, M.; Dankbaar, J.W.; Enting, R.H.; van der Hoorn, A. Perfusion MRI in treatment evaluation of glioblastomas: Clinical relevance of current and future techniques. J. Magn. Reson. Imaging 2019, 49, 11–22. [Google Scholar] [CrossRef]
- Patel, P.; Baradaran, H.; Delgado, D.; Askin, G.; Christos, P.; John Tsiouris, A.; Gupta, A. MR perfusion-weighted imaging in the evaluation of high-grade gliomas after treatment: A systematic review and meta-analysis. Neuro-Oncology 2017, 19, 118–127. [Google Scholar] [CrossRef]
- Heo, Y.J.; Kim, H.S.; Park, J.E.; Choi, C.G.; Kim, S.J. Uninterpretable Dynamic Susceptibility Contrast-Enhanced Perfusion MR Images in Patients with Post-Treatment Glioblastomas: Cross-Validation of Alternative Imaging Options. PLoS ONE 2015, 10, e0136380. [Google Scholar] [CrossRef] [PubMed]
- Telischak, N.A.; Detre, J.A.; Zaharchuk, G. Arterial spin labeling MRI: Clinical applications in the brain. J. Magn. Reson. Imaging 2015, 41, 1165–1180. [Google Scholar] [CrossRef] [PubMed]
- Thust, S.C.; Heiland, S.; Falini, A.; Jäger, H.R.; Waldman, A.D.; Sundgren, P.C.; Godi, C.; Katsaros, V.K.; Ramos, A.; Bargallo, N.; et al. Glioma imaging in Europe: A survey of 220 centres and recommendations for best clinical practice. Eur. Radiol. 2018, 28, 3306–3317. [Google Scholar] [CrossRef]
- Pirzkall, A.; McKnight, T.R.; Graves, E.E.; Carol, M.P.; Sneed, P.K.; Wara, W.W.; Nelson, S.J.; Verhey, L.J.; Larson, D.A. MR-spectroscopy guided target delineation for high-grade gliomas. Int. J. Radiat. Oncol. Biol. Phys. 2001, 50, 915–928. [Google Scholar] [CrossRef] [PubMed]
- Graves, E.E.; Nelson, S.J.; Vigneron, D.B.; Verhey, L.; McDermott, M.; Larson, D.; Chang, S.; Prados, M.D.; Dillon, W.P. Serial proton MR spectroscopic imaging of recurrent malignant gliomas after gamma knife radiosurgery. Am. J. Neuroradiol. 2001, 22, 613–624. [Google Scholar]
- Horská, A.; Barker, P.B. Imaging of brain tumors: MR spectroscopy and metabolic imaging. Neuroimaging Clin. N. Am. 2010, 20, 293–310. [Google Scholar] [CrossRef]
- Bulik, M.; Jancalek, R.; Vanicek, J.; Skoch, A.; Mechl, M. Potential of MR spectroscopy for assessment of glioma grading. Clin. Neurol. Neurosurg. 2013, 2, 146–153. [Google Scholar] [CrossRef]
- Al-Okaili, R.N.; Krejza, J.; Wang, S.; Woo, J.H.; Melhem, E.R. Advanced MR Imaging Techniques in the Diagnosis of Intraaxial Brain Tumors in Adults. Radiographics 2006, 26, 173–189. [Google Scholar] [CrossRef]
- Goryawala, M.; Saraf-Lavi, E.; Nagornaya, N.; Heros, D.; Komotar, R.; Maudsley, A.A. The Association between Whole-Brain MR Spectroscopy and IDH Mutation Status in Gliomas. J. Neuroimaging 2020, 30, 58–64. [Google Scholar] [CrossRef]
- Zhang, J.; Zhuang, D.X.; Yao, C.J.; Lin, C.P.; Wang, T.L.; Qin, Z.Y.; Wu, J.S. Metabolic approach for tumor delineation in glioma surgery: 3D MR spectroscopy image-guided resection. J. Neurosurg. 2016, 124, 1585–1593. [Google Scholar] [CrossRef]
- Chamberland, M.; Bernier, M.; Fortin, D.; Whittingstall, K.; Descoteaux, M. 3D interactive tractography-informed resting-state fMRI connectivity. Front. Neurosci. 2015, 9, 275. [Google Scholar] [CrossRef] [PubMed]
- Aquino, D.; Gioppo, A.; Finocchiaro, G.; Bruzzone, M.G.; Cuccarini, V. MRI in Glioma Immunotherapy: Evidence, Pitfalls, and Perspectives. J. Immunol. Res. 2017, 4, 813–821. [Google Scholar] [CrossRef]
- Caras, A.; Mugge, L.; Miller, W.K.; Mansour, T.R.; Schroeder, J.; Medhkour, A. Usefulness and Impact of Intraoperative Imaging for Glioma Resection on Patient Outcome and Extent of Resection: A Systematic Review and Meta-Analysis. World Neurosurg. 2020, 134, 98–110. [Google Scholar] [CrossRef]
- Sanai, N.; Polley, M.Y.; McDermott, M.W.; Parsa, A.T.; Berger, M.S. An extent of resection threshold for newly diagnosed glioblastomas. J. Neurosurg. 2011, 115, 3–8. [Google Scholar] [CrossRef]
- Abhinav, K.; Yeh, F.C.; Mansouri, A.; Zadeh, G.; Fernandez-Miranda, J.C. High-definition fiber tractography for the evaluation of perilesional white matter tracts in high-grade glioma surgery. Neuro-Oncology 2015, 17, 1199–1209. [Google Scholar] [CrossRef] [PubMed]
- Bucci, M.; Mandelli, M.L.; Berman, J.I.; Amirbekian, B.; Nguyen, C.; Berger, M.S.; Henry, R.G. Quantifying diffusion MRI tractography of the corticospinal tract in brain tumors with deterministic and probabilistic methods. Neuroimage Clin. 2013, 3, 361–368. [Google Scholar] [CrossRef] [PubMed]
- Essayed, W.I.; Zhang, F.; Unadkat, P.; Cosgrove, G.R.; Golby, A.J.; O’Donnell, L.J. White matter tractography for neurosurgical planning: A topography-based review of the current state of the art. Neuroimage Clin. 2017, 15, 659–672. [Google Scholar] [CrossRef]
- Pujol, S.; Wells, W.; Pierpaoli, C.; Brun, C.; Gee, J.; Cheng, G.; Vemuri, B.; Commowick, O.; Prima, S.; Stamm, A.; et al. The DTI Challenge: Toward Standardized Evaluation of Diffusion Tensor Imaging Tractography for Neurosurgery. J. Neuroimaging 2015, 25, 875–882. [Google Scholar] [CrossRef]
- Galldiks, N.; Rapp, M.; Stoffels, G.; Dunkl, V.; Sabel, M.; Langen, K.J. Earlier diagnosis of progressive disease during bevacizumab treatment using O-(2-18F-fluorethyl)-L-tyrosine positron emission tomography in comparison with magnetic resonance imaging. Mol. Imaging 2013, 12, 273–276. [Google Scholar] [CrossRef]
- Zinnhardt, B.; Roncaroli, F.; Foray, C. Imaging of the glioma microenvironment by TSPO PET. Eur. J. Nucl. Med. Mol. Imaging 2021, 49, 174–185. [Google Scholar] [CrossRef]
- Alexiou, G.A.; Zikou, A.; Tsiouris, S. Comparison of diffusion tensor, dynamic susceptibility contrast MRI and (99m) Tc-Tetrofosmin brain SPECT for the detection of recurrent high-grade glioma. Magn. Reson. Imaging 2014, 32, 854–859. [Google Scholar] [CrossRef] [PubMed]
- Arora, G.; Sharma, P.; Sharma, A. 99mTc-Methionine hybrid SPECT/CT for detection of recurrent glioma: Comparison with 18F-FDG PET/CT and contrast-enhanced MRI. Clin. Nucl. Med. 2018, 43, 132–138. [Google Scholar] [CrossRef] [PubMed]
- Zhang, H.; Ma, L.; Wu, C.; Xu, B.N. Performance of SPECT in the differential diagnosis of glioma recurrence from radiation necrosis. J. Clin. Neurosci. 2015, 22, 229–237. [Google Scholar] [CrossRef] [PubMed]
- Ellingson, B.M.; Chung, C.; Pope, W.B. Pseudoprogression, radionecrosis, inflammation or true tumor progression? challenges associated with glioblastoma response assessment in an evolving therapeutic landscape. J. Neurooncol. 2017, 134, 495–504. [Google Scholar] [CrossRef]
- Chukwueke, U.N.; Wen, P.Y. Use of the Response Assessment in Neuro-Oncology (RANO) criteria in clinical trials and clinical practice. CNS Oncol. 2019, 8, 28–30. [Google Scholar] [CrossRef]
- Broen, M.P.G.; Smits, M.; Wijnenga, M.M.J.; Dubbink, H.J.; Anten, M.H.M.E.; Schijns, O.E.M.G.; Beckervordersandforth, J.; Postma, A.A.; van den Bent, M.J. The T2-FLAIR mismatch sign as an imaging marker for non-enhancing IDH-mutant, 1p/19q-intact lower-grade glioma: A validation study. Neuro-Oncology 2018, 20, 1393–1399. [Google Scholar] [CrossRef]
- Nasseri, M.; Gahramanov, S.; Netto, J.P.; Fu, R.; Muldoon, L.L.; Varallyay, C.; Hamilton, B.E.; Neuwelt, E.A. Evaluation of pseudoprogression in patients with glioblastoma multiforme using dynamic magnetic resonance imaging with ferumoxytol calls RANO criteria into question. Neuro-Oncology 2014, 16, 1146–1154. [Google Scholar] [CrossRef]
- Bulik, M.; Kazda, T.; Slampa, P.; Jancalek, R. The Diagnostic Ability of Follow-Up Imaging Biomarkers after Treatment of Glioblastoma in the Temozolomide Era: Implications from Proton MR Spectroscopy and Apparent Diffusion Coefficient Mapping. Biomed Res. Int. 2015, 1, 42–51. [Google Scholar] [CrossRef]
- Batchala, P.P.; Muttikkal, T.J.E.; Donahue, J.H.; Patrie, J.T.; Schiff, D.; Fadul, C.E.; Mrachek, E.K.; Lopes, M.B.; Jain, R.; Patel, S.H. Neuroimaging-Based Classification Algorithm for Predicting 1p/19q-Codeletion Status in IDH-Mutant Lower Grade Gliomas. AJNR Am. J. Neuroradiol. 2019, 40, 426–432. [Google Scholar] [CrossRef]
- Wang, N.; Jain, R.K.; Batchelor, T.T. New Directions in Anti-Angiogenic Therapy for Glioblastoma. Neurotherapeutics 2017, 14, 321–332. [Google Scholar] [CrossRef]
- Batchelor, T.T.; Sorensen, A.G.; di Tomaso, E.; Zhang, W.T.; Duda, D.G.; Cohen, K.S.; Kozak, K.R.; Cahill, D.P.; Chen, P.J.; Zhu, M.; et al. AZD2171, a pan-VEGF receptor tyrosine kinase inhibitor, normalizes tumor vasculature and alleviates edema in glioblastoma patients. Cancer Cell 2007, 11, 83–95. [Google Scholar] [CrossRef] [PubMed]
- Boxerman, J.L.; Zhang, Z.; Safriel, Y.; Rogg, J.M.; Wolf, R.L.; Mohan, S.; Marques, H.; Sorensen, A.G.; Gilbert, M.R.; Barboriak, D.P. Prognostic value of contrast enhancement and FLAIR for survival in newly diagnosed glioblastoma treated with and without bevacizumab: Results from ACRIN 6686. Neuro-Oncology 2018, 20, 1400–1410. [Google Scholar] [CrossRef] [PubMed]
- Hilario, A.; Sepulveda, J.M.; Hernandez-Lain, A.; Salvador, E.; Koren, L.; Manneh, R.; Ruano, Y.; Perez-Nuñez, A.; Lagares, A.; Ramos, A. Leakage decrease detected by dynamic susceptibility-weighted contrast-enhanced perfusion MRI predicts survival in recurrent Glioblastoma treated with bevacizumab. Clin. Transl. Oncol. 2017, 19, 51–57. [Google Scholar] [CrossRef] [PubMed]
- Auer, T.A.; Breit, H.C.; Marini, F.; Renovanz, M.; Ringel, F.; Sommer, C.J.; Brockmann, M.A.; Tanyildizi, Y. Evaluation of the apparent diffusion coefficient in patients with recurrent glioblastoma under treatment with bevacizumab with radiographic pseudoresponse. J. Neuroradiol. 2019, 46, 36–43. [Google Scholar] [CrossRef]
- Ellingson, B.M.; Gerstner, E.R.; Smits, M.; Huang, R.Y.; Colen, R.; Abrey, L.E.; Aftab, D.T.; Schwab, G.M.; Hessel, C.; Harris, R.J.; et al. Diffusion MRI Phenotypes Predict Overall Survival Benefit from Anti-VEGF Monotherapy in Recurrent Glioblastoma: Converging Evidence from Phase II Trials. Clin. Cancer Res. 2017, 23, 5745–5756. [Google Scholar] [CrossRef]
- Seeger, A.; Braun, C.; Skardelly, M.; Paulsen, F.; Schittenhelm, J.; Ernemann, U.; Bisdas, S. Comparison of three different MR perfusion techniques and MR spectroscopy for multiparametric assessment in distinguishing recurrent high-grade gliomas from stable disease. Acad. Radiol. 2013, 20, 1557–1565. [Google Scholar] [CrossRef]
- Delgado-López, P.D.; Corrales-García, E.M. Survival in glioblastoma: A review on the impact of treatment modalities. Clin. Transl. Oncol. 2016, 18, 1062–1071. [Google Scholar] [CrossRef]
- Melguizo-Gavilanes, I.; Bruner, J.M.; Guha-Thakurta, N.; Hess, K.R.; Puduvalli, V.K. Characterization of pseudoprogression in patients with glioblastoma: Is histology the gold standard? J. Neurooncol. 2015, 123, 141–150. [Google Scholar] [CrossRef]
- Rahmathulla, G.; Marko, N.F.; Weil, R.J. Cerebral radiation necrosis: A review of the pathobiology, diagnosis, and management considerations. J. Clin. Neurosci. 2013, 20, 485–502. [Google Scholar] [CrossRef] [PubMed]
- Kumar, A.J.; Leeds, N.E.; Fuller, G.N.; Van Tassel, P.; Maor, M.H.; Sawaya, R.E.; Levin, V.A. Malignant gliomas: MR imaging spectrum of radiation therapy- and chemotherapy-induced necrosis of the brain after treatment. Radiology 2000, 217, 377–384. [Google Scholar] [CrossRef]
- Reddy, K.; Westerly, D.; Chen, C. MRI patterns of T1 enhancing radiation necrosis versus tumor recurrence in high-grade gliomas. J. Med. Imaging Radiat. Oncol. 2013, 57, 349–355. [Google Scholar] [CrossRef] [PubMed]
- Ryken, T.C.; Aygun, N.; Morris, J.; Schweizer, M.; Nair, R.; Spracklen, C.; Kalkanis, S.N.; Olson, J.J. The role of imaging in the management of progressive glioblastoma: A systematic review and evidence-based clinical practice guideline. J. Neuro-Oncol. 2014, 118, 435–460. [Google Scholar] [CrossRef] [PubMed]
- Ballas, Z.K. The 2018 Nobel Prize in Physiology or Medicine: An exemplar of the bench to bedside in Immunology. J. Allergy Clin. Immunol. 2018, 142, 1752–1753. [Google Scholar] [CrossRef] [PubMed]
- Vrabec, M.; Van Cauter, S.; Himmelreich, U.; Van Gool, S.W.; Sunaert, S.; De Vleeschouwer, S.; Suput, D.; Demaerel, P. MR perfusion and diffusion imaging in the follow-up of recurrent glioblastoma treated with dendritic cell immunotherapy: A pilot study. Neuroradiology 2011, 53, 721–731. [Google Scholar] [CrossRef]
- Qin, L.; Li, X.; Stroiney, A.; Qu, J.; Helgager, J.; Reardon, D.A.; Young, G.S. Advanced MRI assessment to predict benefit of anti-programmed cell death 1 protein immunotherapy response in patients with recurrent glioblastoma. Neuroradiology 2017, 59, 135–145. [Google Scholar] [CrossRef]
- Pellegatta, S.; Eoli, M.; Frigerio, S.; Antozzi, C.; Bruzzone, M.G.; Cantini, G.; Nava, S.; Anghileri, E.; Cuppini, L.; Cuccarini, V.; et al. The natural killer cell response and tumor debulking are associated with prolonged survival in recurrent glioblastoma patients receiving dendritic cells loaded with autologous tumor lysates. Oncoimmunology 2013, 2, 163–168. [Google Scholar] [CrossRef]
- McDonald, R.J.; McDonald, J.S.; Kallmes, D.F.; Jentoft, M.E.; Murray, D.L.; Thielen, K.R.; Williamson, E.E.; Eckel, L.J. Intracranial Gadolinium Deposition after Contrast-enhanced MR Imaging. Radiology 2015, 275, 772–782. [Google Scholar] [CrossRef]
- Xia, Q.; Liu, Y.; Lu, Y.; Cao, S.; Zhang, H.; Ma, S. A modified damage index probability imaging algorithm based on delay-and-sum imaging for synthesizing time-reversed Lamb waves. J. Vibroengineering 2019, 21, 2140–2147. [Google Scholar] [CrossRef]


Disclaimer/Publisher’s Note: The statements, opinions and data contained in all publications are solely those of the individual author(s) and contributor(s) and not of MDPI and/or the editor(s). MDPI and/or the editor(s) disclaim responsibility for any injury to people or property resulting from any ideas, methods, instructions or products referred to in the content. |
© 2023 by the authors. Licensee MDPI, Basel, Switzerland. This article is an open access article distributed under the terms and conditions of the Creative Commons Attribution (CC BY) license (https://creativecommons.org/licenses/by/4.0/).
Share and Cite
Veikutis, V.; Brazdziunas, M.; Keleras, E.; Basevicius, A.; Grib, A.; Skaudickas, D.; Lukosevicius, S. Diagnostic Approaches to Adult-Type Diffuse Glial Tumors: Comparative Literature and Clinical Practice Study. Curr. Oncol. 2023, 30, 7818-7835. https://doi.org/10.3390/curroncol30090568
Veikutis V, Brazdziunas M, Keleras E, Basevicius A, Grib A, Skaudickas D, Lukosevicius S. Diagnostic Approaches to Adult-Type Diffuse Glial Tumors: Comparative Literature and Clinical Practice Study. Current Oncology. 2023; 30(9):7818-7835. https://doi.org/10.3390/curroncol30090568
Chicago/Turabian StyleVeikutis, Vincentas, Mindaugas Brazdziunas, Evaldas Keleras, Algidas Basevicius, Andrei Grib, Darijus Skaudickas, and Saulius Lukosevicius. 2023. "Diagnostic Approaches to Adult-Type Diffuse Glial Tumors: Comparative Literature and Clinical Practice Study" Current Oncology 30, no. 9: 7818-7835. https://doi.org/10.3390/curroncol30090568