Lossy Mode Resonance-Based Glucose Sensor with High-κ Dielectric Film


1
Electronic Engineering Department, Ming Chung University, Taoyuan 33348, Taiwan
2
Biotechnology Department, Ming Chung University, Taoyuan 33348, Taiwan
*
Authors to whom correspondence should be addressed.
Crystals 2019, 9(9), 450; https://doi.org/10.3390/cryst9090450
Submission received: 27 June 2019
/
Revised: 15 August 2019
/
Accepted: 27 August 2019
/
Published: 29 August 2019
(This article belongs to the Section Inorganic Crystalline Materials)
Abstract
:In the past, high-κ dielectrics gained much attention because of the constant demand for increasingly smaller semiconductors. At the same time, in the field of optical sensing, high-κ dielectrics are key materials. This study presents the experimental investigations on a lossy mode resonance-based optical planar waveguide (LMROPW) sensor coated with a high-κdielectric of an indium tin oxide (ITO) layer. Two types of sensing structures were fabricated by coating (i) only a single-layer ITO (or bared LMROPW) and (ii) an ITO layer with glucose probes onto the optical planar waveguide (or boronic LMROPW) to detect glucose molecules. The sensing characteristics of these two types of sensors toward the surrounding analyte were determined using different concentrations of glucose solutions. It was found that the bared LMROPW sensor is only suitable for a higher concentration of glucose; the boronic LMROPW sensor with glucose probes on ITO could be applied to a lower-concentration solution to monitor glucose adsorption onto the sensing surface. Furthermore, with the advantages of a simple structure, easy alignment, and suitable production, the LMROPW sensor with a high-κ dielectric surface could be applied in clinical testing and diagnostics.
1. Introduction
Silicon dioxide (SiO2) has been widely used as a gate oxide material for the past few decades. It is well known that metal-oxide-semiconductor field-effect transistors (MOSFETs) with 100 nm gate lengths require a thinner SiO2 gate oxide. Device condensation for chip density and performance improvements ticks off the problems of the gate leakage current and standby-power consumption [1,2,3]. The tunneling current increases and the power dissipation becomes higher as the SiO2 gate oxide gets thinner. As transistors have decreased in size, the thickness of the silicon dioxide gate dielectric layer has decreased for the purpose of increasing the gate capacitance and raising the device performance. As the SiO2 thickness is reduced, leakage currents due to the tunneling effect drastically increase and this causes high power consumption and reduces device reliability [3]. Other materials are needed to replace the SiO2 as the gate oxide to the increased gate capacitance without the associated leakage effects. Therefore, high dielectric constant (so-called high-κ) materials have attracted much attention as an alternative to conventional SiO2 gate dielectrics in the semiconductor industry. High-κ films may effectively provide a similar capacitance with a physically larger thickness to reduce the gate leakage current [3]. High-κ materials have been widely studied and the HfO2, Lu2O3, TiO2, Y2O3, ZrO2, Ta2O5, Al2O3, and La2O3 are studied nowadays to substitute the SiO2 [4]. It is indisputable that the semiconductor field has given a great development momentum for high-κ materials, but in addition to the use of semiconductor MOS devices, high-κ film materials have begun to be used at the same time in new applications in optoelectronic products and biomedical optical sensing in recent years.
Indium tin oxide (ITO) is a well known compound with the solution of indium oxide (In2O3) and tin oxide (SnO2) at a ratio of about 9:1 (wt). If conductivity is large enough, the thermal emittance is low, which opens applications to the thermal insulation of windows, prevention of radiative cooling, etc. Initially, the application of the ITO films was primarily to diminish heat losses from lamps. Glass coated with ITO is widely used in modern fenestration technology for providing thermal insulation [5]. Advances in fenestration achieve electrochromic ‘smart windows’ that provide indoor comfort with energy efficiency. By varying the tin concentration and substrate temperature of the ITO films, a high electrical conductivity and wide spectrum of visible transmittance could be obtained. A resistivity ρ of ~1 × 10⁻⁴ Ω cm is often regarded as the electrical characteristic for an optimized ITO film [5]. The lower electrical resistivity for an ITO sample after postannealing is contributed by a high carrier concentration and mobility, where improved surface morphological characteristics help in increasing the optical transmittance and reducing the electrical resistivity of the ITO thin films [6]. The optical band gap was found to vary from 3.29 to 3.41 eV with the increasing substrate temperature during deposition of the ITO thin film [7]. The optical transmittance and band gap also varied with the annealing process. The high transmittance (over 95%) and large band gap (3.93 eV) were obtained at temperatures of 250 and 500 °C for 1 h in an open-air atmosphere [8]. ITO is a transparent and colorless thin film. Due to the distinguished characteristics of the ITO electrodes, such as excellent optical transparency, high conductivity, and very stable electrochemical properties, the ITO thin film is one of the most popular thin films and widely used as a transparent material in the field of many electro-optical devices, such as flat-panel displays, touch panels, optical sensors [9,10], and biosensors [11].
High-κ materials are mostly used as insulating layers, especially in the field of semiconductors. In general, most ITO applications play the role of the conductor material, such as conductive electrodes on LCDs or touch panels. However, in optics, ITO is a material with a dielectric material for optical waveguides rather than a conductor for electrical driving. Lightwaves are high-frequency electromagnetic waves. Therefore, in the field of optics, even metal conductors have a dielectric constant with a complex form [12]. For example, the dielectric constant of gold and copper are −10.92 + 1.49i and −14.67 + 0.72i at the wavelength of 633 nm, respectively [13]. The dielectric constant of metal has a large negative real part, while the dielectric constant of the ITO has a large positive real part (3.24 + 0.01i at a wavelength of 633 nm [14]), which is also the condition for the lossy mode resonance (LMR) arising. The application of metal as a dielectric material was mainly presented in the surface plasmon resonance (SPR) [14,15], while the application of the ITO as a dielectric layer had been investigated mainly in the LMR, such as in refractive index sensors [16] or monitoring devices [9,17]. In this work, the ITO was used as a dielectric layer rather than a conductive material, which had been discussed and modeled in [15]. Over the last few decades, high-κ dielectric metal oxide thin film-coated optical sensors have been a high-interest topic. The development of biomaterials, adsorption, immobilization, and fabrication methods on the surface brought new vitality into this field [18,19,20,21]. According to the previous literature, metal oxide thin-film overlays fabricated onto the core of optical fibers can produce selective optical-power absorption at certain wavelengths, also known as resonances [22,23]. The LMR sensor, a wavelength-based detection system, was explored in 1993 by Marciniack [5] and, in that publication, the LMRs were explained as a coupling between optical waveguide modes and the lossy mode of a semiconductor-clad waveguide. When light propagating through the optical waveguide incidents at the semiconducting metal oxide clad waveguide interface, the mobility of the charge carriers in the metal oxide layer changes. This, in turn, changes the conductivity of the lossy material, which is related to its permittivity. Relative permittivity is also commonly known as the dielectric constant. In the optical concept, modes guiding through the optical waveguide become lossy in the region of the waveguide with semiconducting metal oxide cladding, and a resonance condition occurs. In fact, LMRs occur when the real part of the cladding permittivity is positive and higher in magnitude than both its own imaginary part and the real-part permittivity of surroundings. LMR generation with absorbing thin films was analyzed with an electromagnetic theory [24]. The metal oxide materials that were used are ZnO, TiO2, In2O3, SnO2, and ITO [25,26,27,28,29].
Compared with prism-based LMR sensors, optical fiber-based LMR sensors are less costly, more portable, and more convenient to use; moreover, that provides online remote detection of refractive-index variations of the bulk medium due to the implemented optical-fiber network. So, in recent decades, a great number of works about LMR sensors based on optical fibers have been published [19,26,30,31,32,33,34,35,36,37]. However, optical fiber-based LMR sensors are frangible and not easy to handle during cleaning procedures, coating processes, and surface modification for special target detection. Moreover, in order to enhance sensor sensitivity, the side-polishing method or the chemical-etching technique for the removal of a portion of the cladding and silica-fiber core was often used. However, such side-polished structures of silica fiber and manufacturing processes of cleaning and thin-film coating are not conducive to future mass production. Therefore, it is urgent to improve the practicality for advanced applications and development of LMR sensors in the future.
Diabetes mellitus is a serious disease severely affecting several hundred million people in the world. It is important to monitor the glucose concentration for adjusting medical treatment and keeping normal blood glucose levels to slow the progression of long-term complications associated with diabetes. Many glucose sensors based on the fluorescence signal transmission and electrochemical signal transduction have been reported [38,39]. There is an increasing interest to develop glucose biosensors in the point-of-care testing. Recently, an optical-fiber glucose sensor based on the surface plasmon resonance (SPR) has been reported [40,41]. The sensor, with a self-assembled p-mercaptophenylboronic acid (PMBA) monolayer on Au-coated optical fibers for glucose detection, was used to measure a significant shift in the SPR wavelength. The response for glucose was thus enhanced with Au nanoparticles modified with 2-aminoethanethiol (AET) and PMBA [41]. In addition, the SPR sensor with a glucose enzyme was very sensitive and unique to the glucose concentration, and other constituents did not interfere with it. The glucose measurement has also been carried out with the enzyme glucose oxidase being immobilized over silicon using the gel-entrapment method [42]. However, from the point of view of cost of expensive noble metals such as gold, many other materials must be used in order to generate SPRs. As for optical performance, SPRs can only be observed for transverse magnetic (TM) polarizations, so the utilization of an optical polarizer cannot be avoided. In addition to the mechanical strength, the diameter of the silica fiber is almost within 500 μm; thus, it is not convenient to handle the fiber during device fabrication. As mentioned above, optical fiber-based SPR glucose sensors are very fragile and costly. Accordingly, the fiber-type SPR biosensor is not suitable for mass production and commercialization.
In this paper, the simple structure and low cost of the LMROPW sensor with ITO-coated glass are proposed for glucose detection, with the advantages of convenience for surface modification, easy alignment for LMR spectrum investigation, and appropriate for mass production and commercialization. Optical planar waveguides are waveguides with planar geometry that guide light only in one dimension. They are often fabricated in the form of a thin transparent film with an increased refractive index on some substrate. In general, waveguides were made of dielectric materials with a greater refractive index of the guiding layer than those of the two bounding media. This condition is necessary to achieve total internal reflections at the layer interfaces that are responsible for confined propagation. Here, for the LMROPW sensor, the planar waveguide layer was the glass slab; one bounding medium was the air and the other was the ITO thin film covered with a sampling solution. Since the ITO deposition has been widely used as a mature coating technology in the fabrication of transparent conductive thin films, here we made use of ITO as the high-κ dielectric material for the LMR sensor. Another aim of this work was to confirm the suitability of the LMROPW to perform in two types of glucose sensors. To reach this goal, a glass with the ITO thin film was fabricated, and is called a bared LMROPW sensor. The other type, called a boronic LMROPW sensor, was modified with boronic glucose probes onto the ITO surface. Finally, these sensors were characterized in terms of sensitivity and the dynamic LMR wavelength shift according to the glucose concentration. Further, to the researchers’ best knowledge, no study has been published on combining the advantages of LMR and OPW to evaluate a glucose sensor.
2. Materials and Experiments
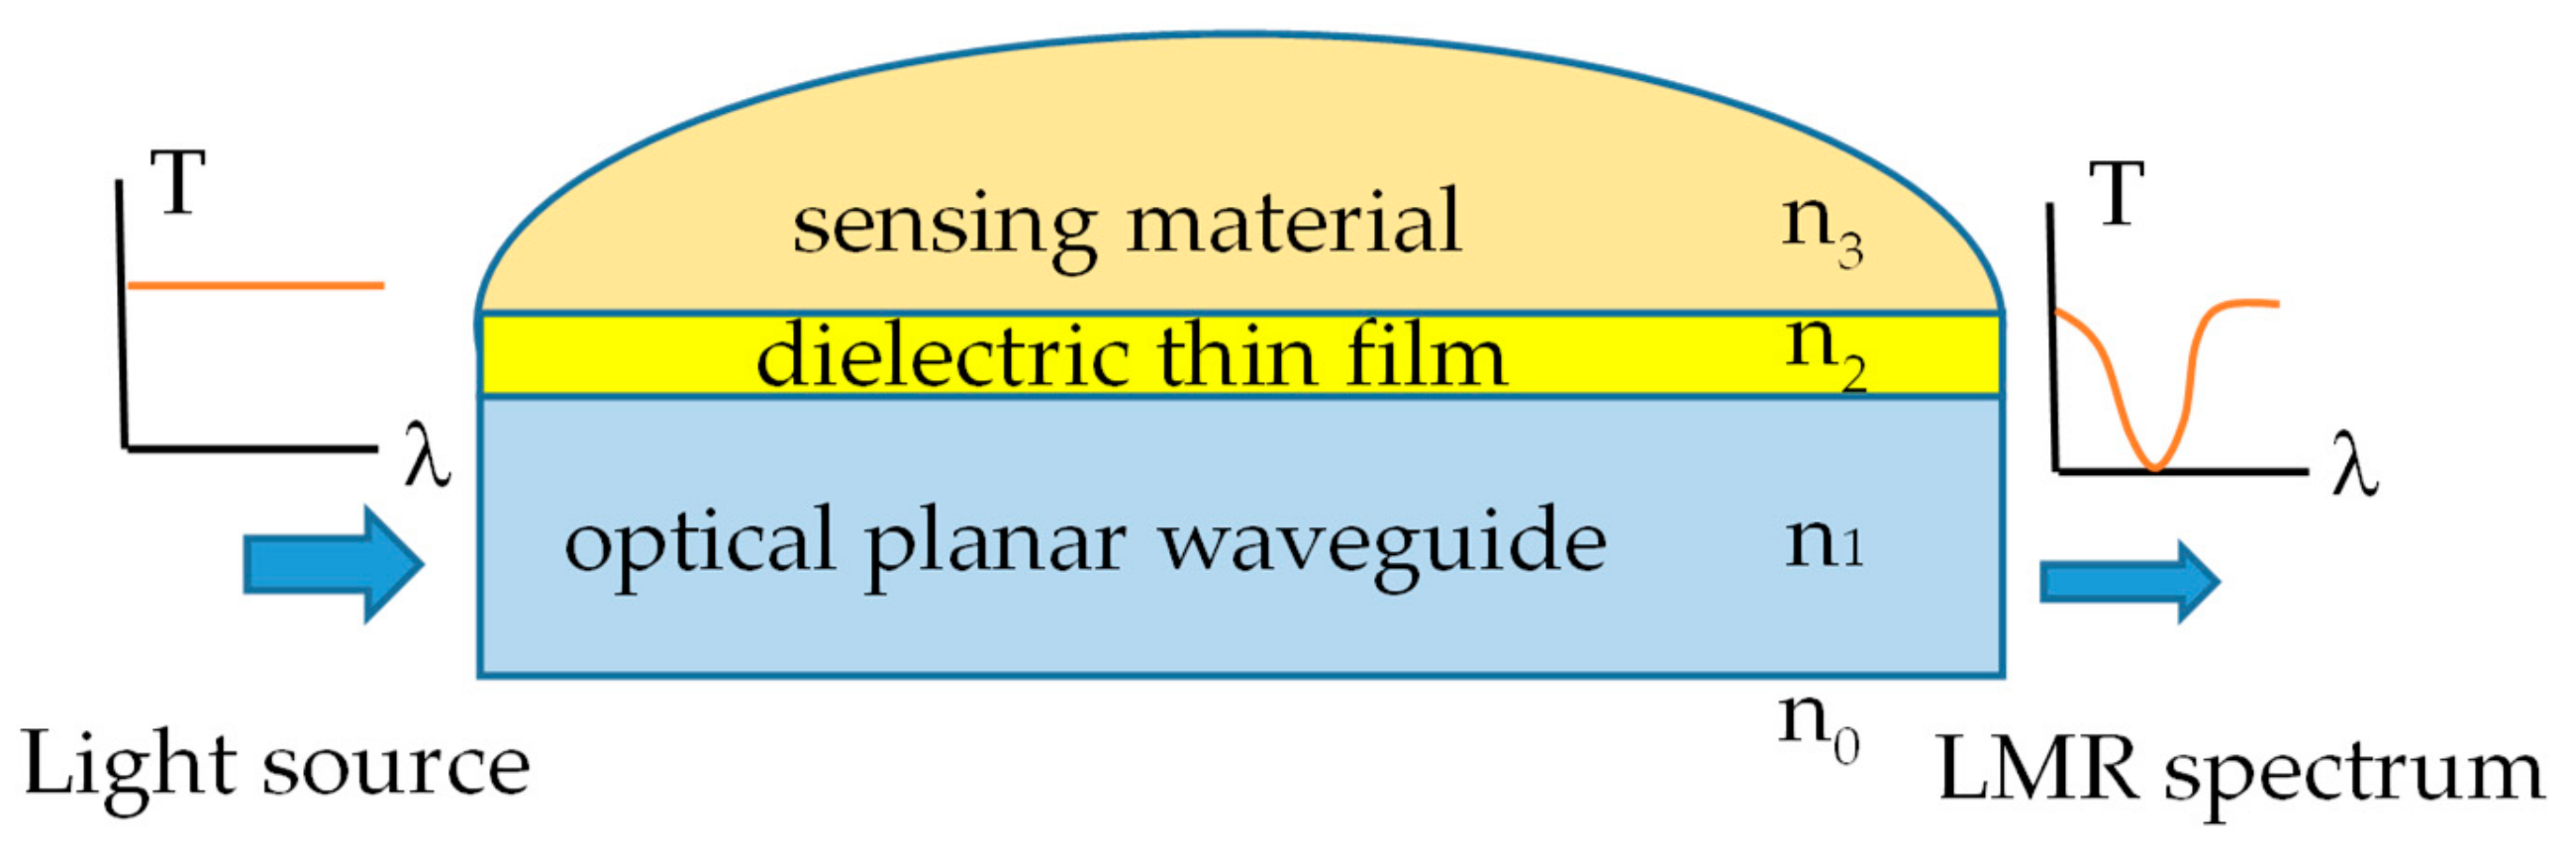
The LMROPW sensor could be regarded as a three-layer structure, which is an optical planar waveguide layer, a metal oxide dielectric thin-film layer, and a sensing material layer with the refractive index of n1, n2, and n3, respectively, as shown in Figure 1. The surrounding medium is the air with refractive index n0. Permittivity or dielectric in a vacuum is ε0, and the optical dielectric constant, also regarded as a dynamic dielectric constant, is εr. The term high-κ dielectric refers to a material with a highly static dielectric constant κ compared to silica. In view of the classical relation between dielectric and optical coefficients, the dynamic dielectric constant should be close to the square of the optical refractive index (i.e., εr = n2) [3]. It is worthy of note that the dynamic dielectric constant is generally a function of wavelength. Consequently, the dynamic dielectric constant at high frequency or the optical dielectric constant should be described with the dispersion model. In general, the refractive index relative to the dynamic dielectric constant is used for optics; the static dielectric constant is used in electronics at low frequency.
The metal oxide LMR-supporting layer was made of ITO. The most widely used expression for modeling ITO is the Drude model, where the dynamic dielectric constant of ITO is written as [14]
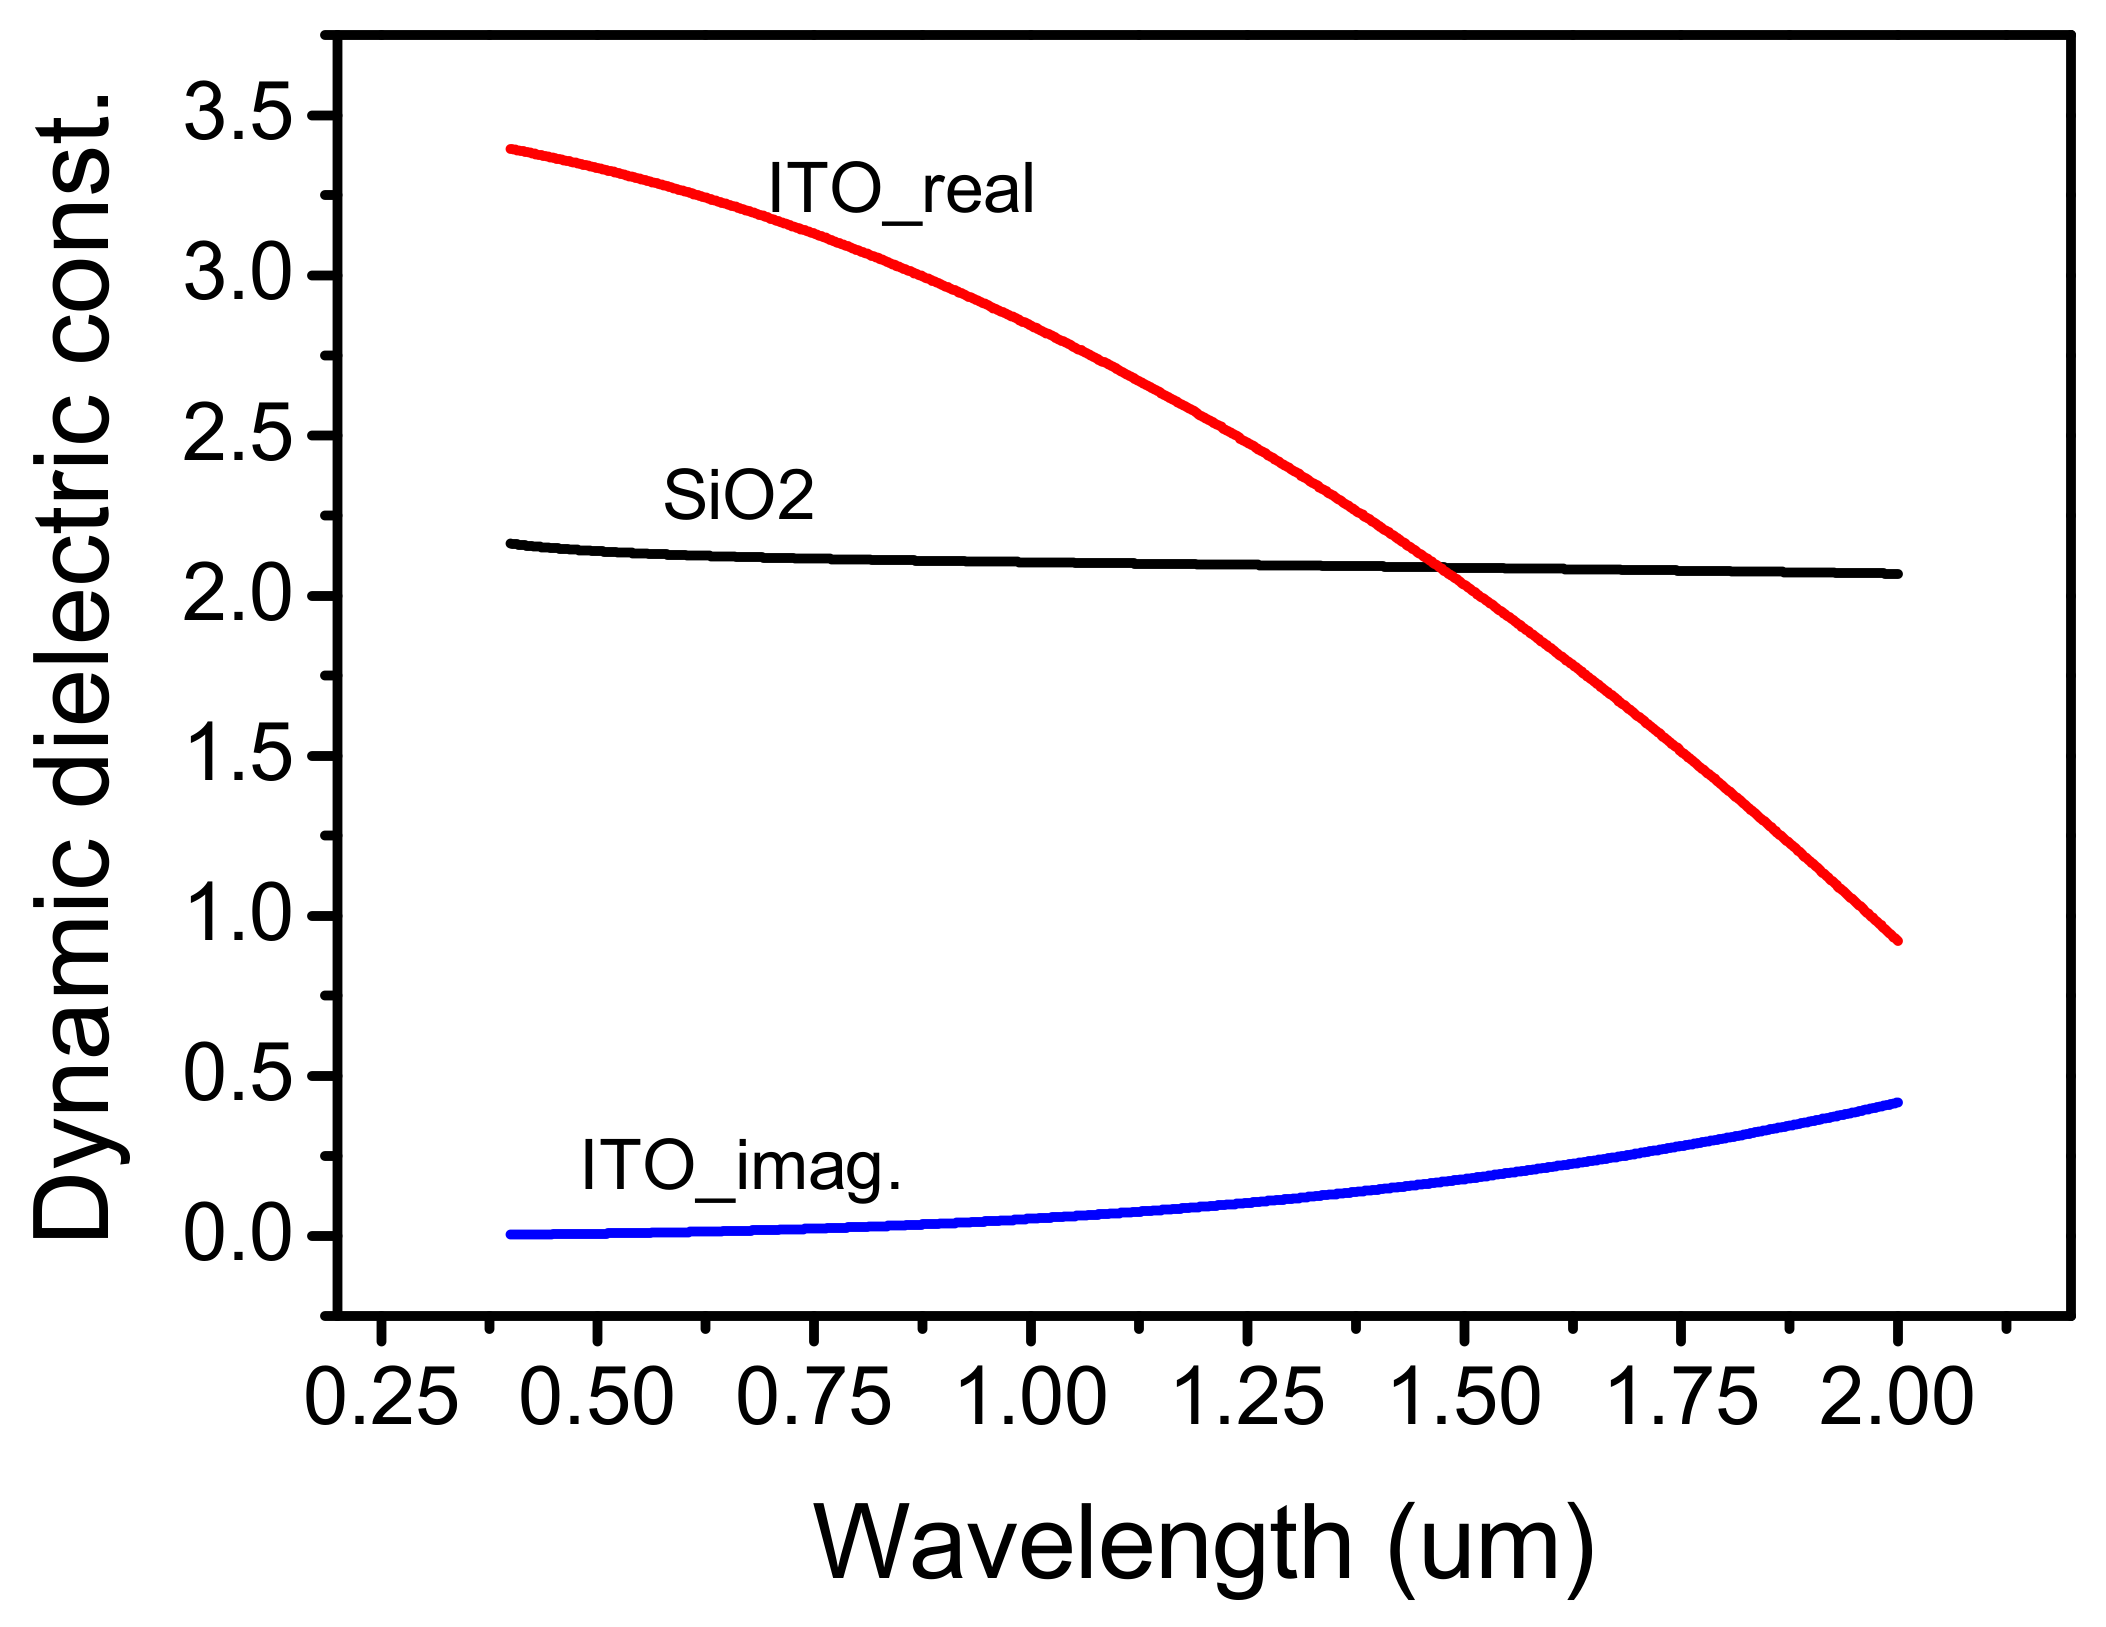
here, λp and λc are the plasma wavelength and collision wavelength, respectively, where λp = 0.5649 μm and λc = 11.121 μm for ITO, respectively. The dynamic dielectric constant of silica () varies with the wavelength according to the Sellmeier dispersion relation as [14]
where λ is the wavelength in μm, and a1, a2, a3, b1, b2, and b3 are Sellmeier coefficients. The values of these coefficients are given as a1 = 0.6961663, a2 = 0.4079426, a3 = 0.8974794, b1 = 0.0684043 μm, b2 = 0.1162414 μm, and b3 = 9.896161 μm [14]. Based on the model of Expressions (1) and (2), the dispersion curves of dielectric constants are shown in Figure 2. In general, the refractive index of waveguide n1 is greater than those of the two bounding media (i.e., n1 > n0, n2, n3). This condition is necessary to achieve total internal reflections at the layer interfaces that are responsible for the confined propagation. However, the light propagation in absorbing materials can be described using a complex-valued refractive index. The imaginary part then handles attenuation, while the real part accounts for refraction. For the case of LMR, the refractive index n2 of the metal oxide is a complex number with a real part larger than n1 and a small imaginary part. The metal oxide layer is very thin. The reflection of the lightwave at the interface of n1 and n2 was greatly reduced under the condition of the specific wave vector, which is related to the incident angle and wavelength, and the transmittance of the lightwave from the n1 to the n2 layer will be greatly increased. As a result, light energy enters the metal oxide layer from the waveguide layer, thus forming a lossy mode. The number of modes increases as the metal oxide layer becomes thicker. In the case of the n2 layer being metal, reflection from these metal surfaces is extremely high (almost 100%), especially at the grazing incidence (θ ≅ 90°), because of the large extinction coefficient (imaginary part) and the small real part of n2. In fact, if n2 is a pure imaginary number, the wave propagation in a layer of n2 is always evanescent. However, if the metal layer is thin enough, the tail energy of the evanescent field enters the sensing area (n3). When the sensing material changes slightly, it highly affects the evanescent field. Under the situation of the TM light being incident at a specific angle at a certain wavelength, the free electrons of the metal resonate with the wave vector of the incident light to give rise to the SPR occurrence. According to Figure 2, it may be noted that an ITO with a large imaginary part and a small real part at longer wavelengths is provided with the dielectric properties of metal oxide. So, both the SPR and the LMR phenomenon can be generated with an ITO thin film layer [43]. It is also the reason why ITO is widely applied in biosensors. The real dielectric part of ITO, which is responsible for the wavelength shift of LMR, is obviously higher than silica for the shorter wavelength, from 0.4 to 1.5 μm, as shown in Figure 2. The imaginary part, which accounts for the depth of the LMR [24], is much less than silica. Although the dielectric constant of silica is about 3.9 for capacitor applications at low frequencies, it drops to about 2.2 at the visible range or at high frequencies; the dielectric constant of ITO is 3.2, which is about 1.5 times higher than that of silica. This multiple becomes even larger when the frequency is higher or the wavelength is shorter.
The experimental aspects of this work, such as the purchase of reagents, the fabrication of the sensing device, and the characterization setup and procedure are also explained in this section.
2.1. Reagents
We purchased a 4-carboxyphenyl boronic acid, 3-isocyanatopropyl triethoxysilane (iPTOES), acetone, and toluene from Sigma-Aldrich Chemical Co. (St. Louis, MO, USA). Ammonium hydroxide (28%), hydrogen peroxide (33%), ethanol (>99.5%), and potassium hydroxide (KOH) were obtained from Huaho Chemical Co. (Taoyuan, Taiwan). All chemicals were analytical grade and used in the study without purification. The aqueous solutions were prepared with ultrapure water (> 18.2 MΩ- cm) from the Milli-Q system (Burlington, MA, USA).
2.2. ITO-Deposited Glass Sheets
Before sputtering, all the Corning Gorilla glass sheets with 0.7 mm thickness were precleaned with acetone using purity wipes. The glass sheets were used as the substrate in a sputter coating process; IZOVAC Co. (Minsk, Russian) supplied the equipment, with a partial argon pressure of 9 × 10⁻² mbar and intensity of 150 mA. The resulting station had a gas system based on 2 MFC (Ar and O2). The base vacuum before the process started was 5 × 10⁻³ Pa. The automatic mass-production process consisted of vacuuming and heating procedures. The entire process took about 18 min, where the ITO sputtering time was about 30 s and the temperature was maintained at 330 to 360 °C. The ITO target, composed of 90% In2O3 and 10% SnO2 with a purity of 3 to 4 N, was purchased from Summit-Tech. Co. Ltd (Zhubei, Hsinchu, Taiwan). After sputtering, all the ITO glass sheets were cut into 30 × 30 mm squared sizes. The thickness of the ITO film was obtained at about 100 nm with an optical interferometer instrument.
2.3. Surface Modification
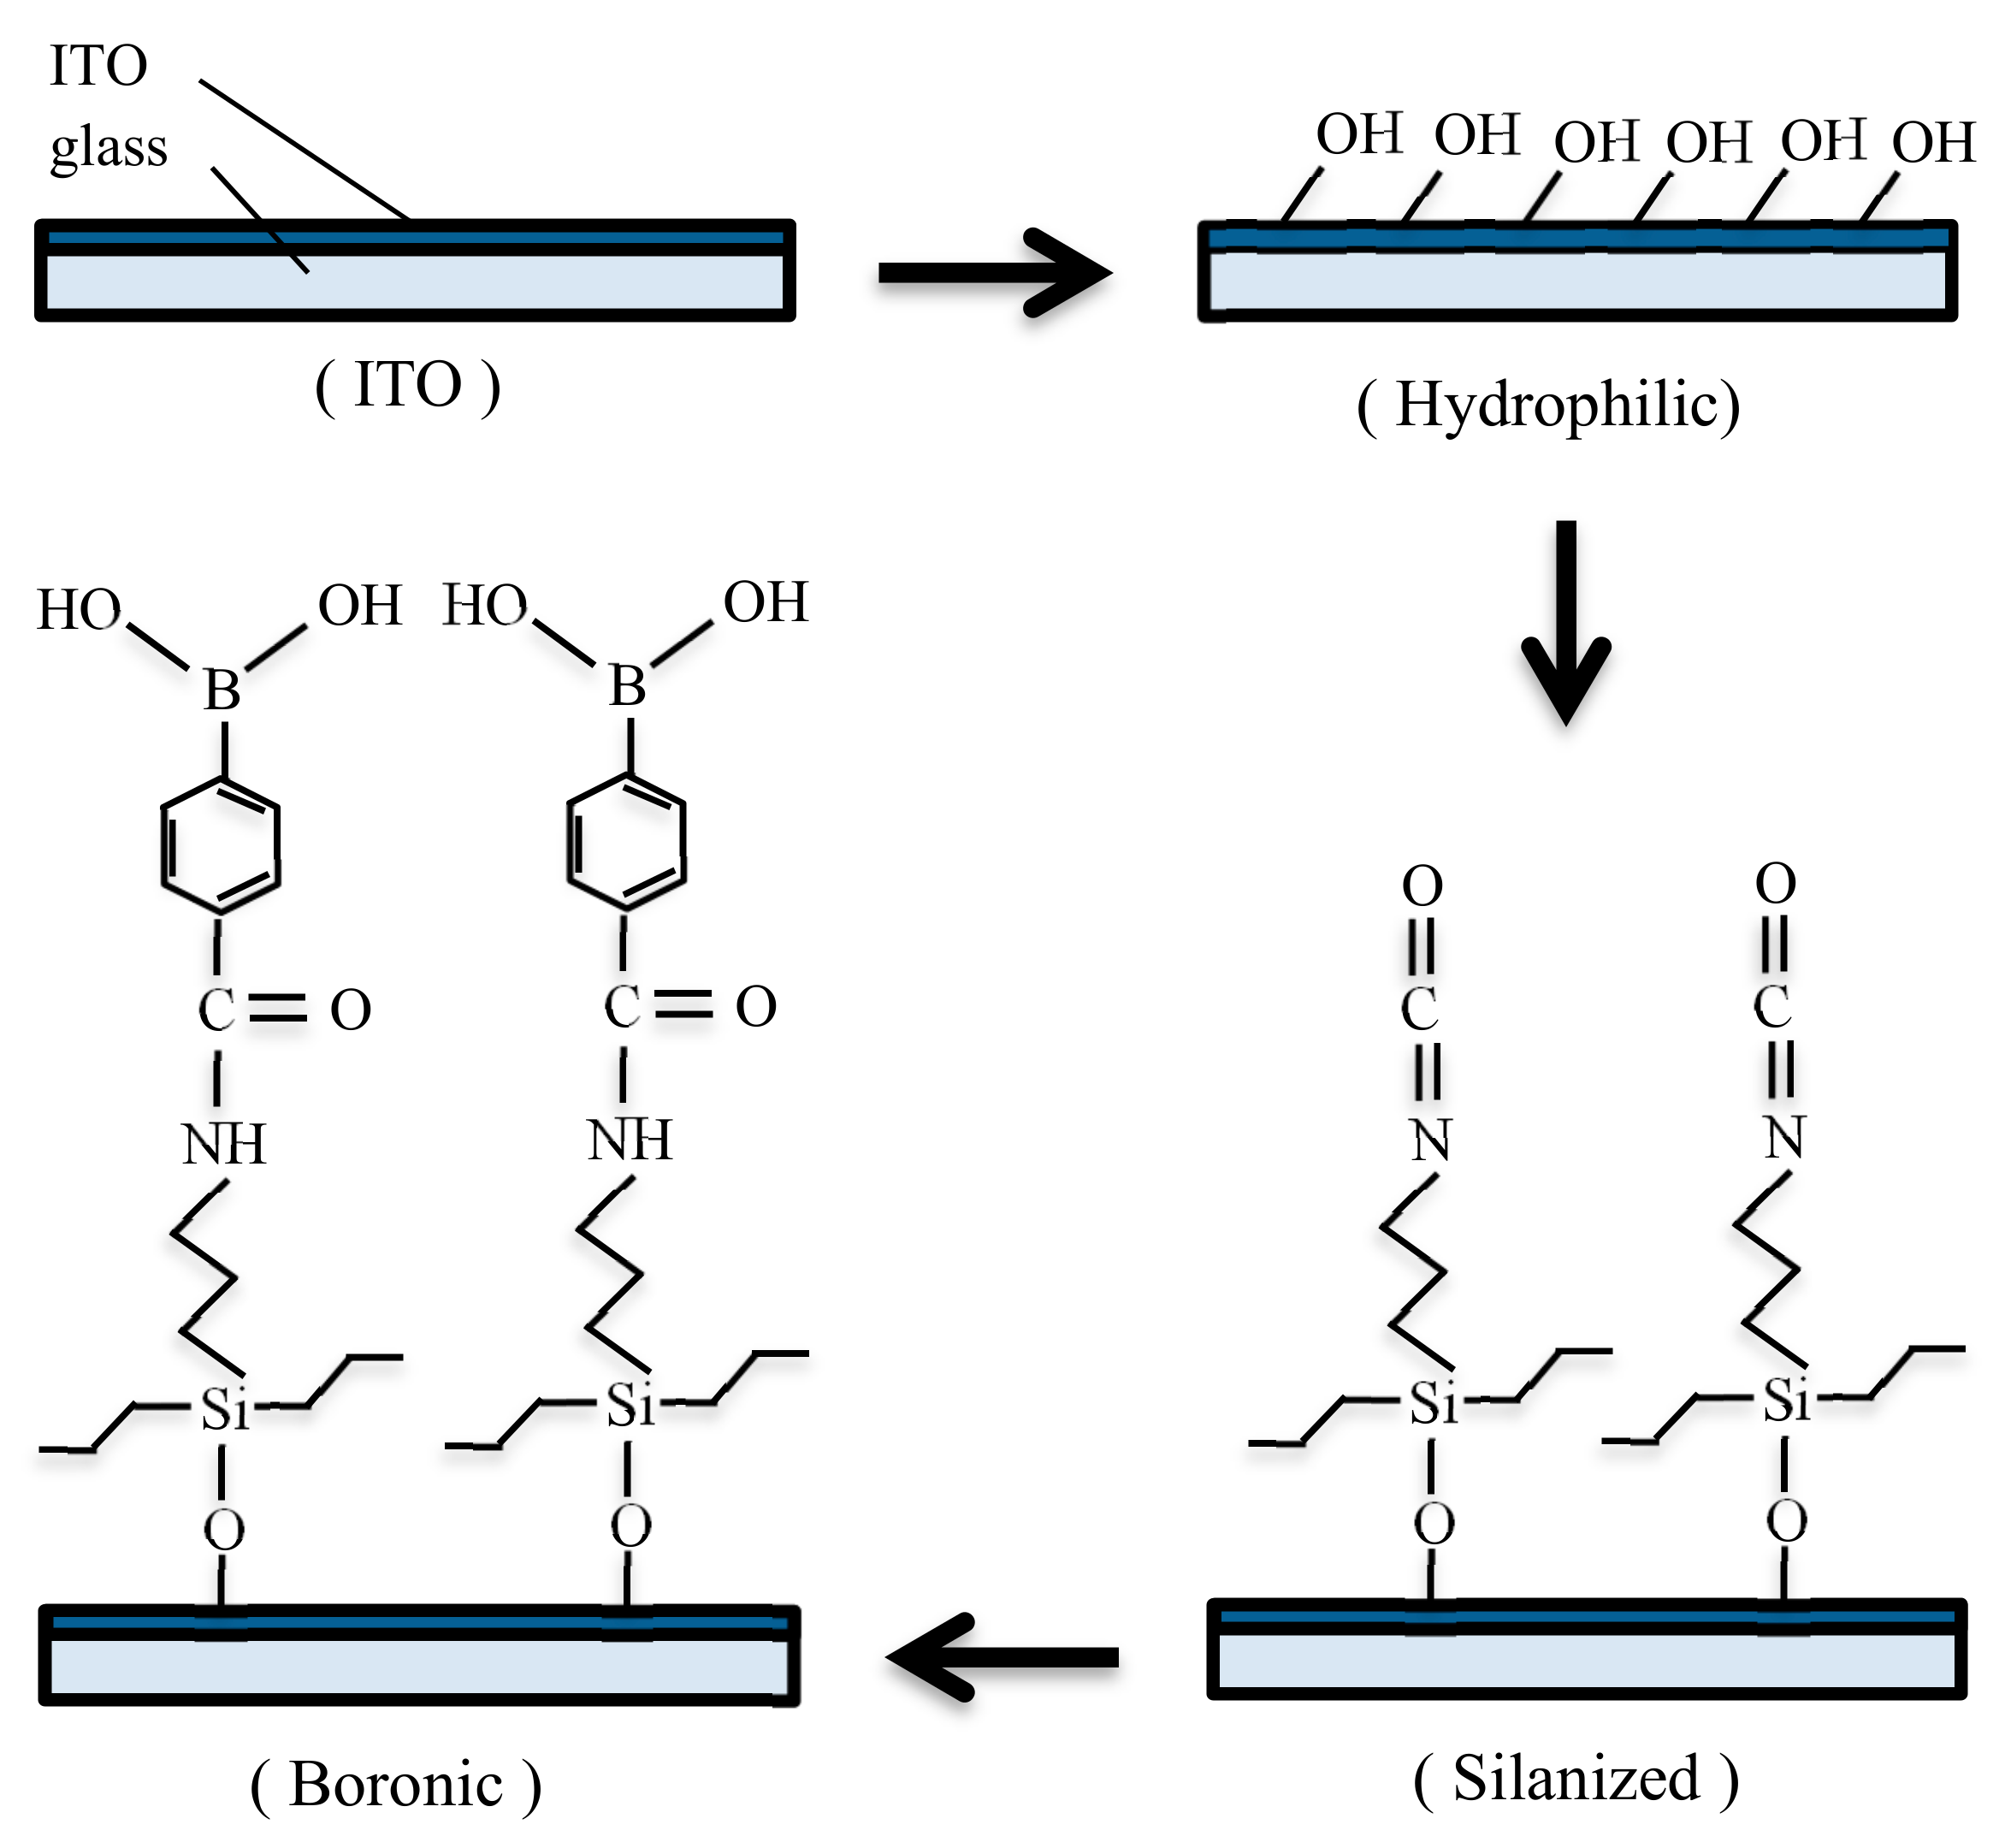
The schematic diagram of surface-modification processing for the glucose immobilization on the LMROPW sensor is shown in Figure 3. The surface modification of the ITO glass for the glucose immobilization was referenced in [44]. At first, the ITO glass was immersed in a 5 M aqueous potassium hydroxide solution for 1 h, washed with ultrapure water, and blown dry to remove grease. Each ITO glass was placed in an individual vial in which an RCA mixture of H2O:H2O2:NH4OH, (20:4:1, v/v) was added and sonicated for 30 mi at 60 °C in order to remove insoluble organic contaminants and further activate the surface by creating a greater density of hydroxyl groups. The iPTEOS monolayer, as a spacer for probe immobilization, was formed by immersing the freshly cleaned substrates in a prepared 1% solution of iPTEOS dissolved in anhydrous toluene overnight at 25 °C. Subsequently, substrates were washed with pure toluene and ethanol three times to remove the unreactivated chemicals from the ITO surface. The spacer molecule-modified ITO surfaces were dried under a stream of air. Then, the modified ITO surfaces were immersed in a 0.075 M aqueous solution of the 4-carboxybenzeneboronic acid and heated to 70 °C for 6 h. The carboxyl group of the 4-carboxybenzeneboronic acid was the reactive moiety to facilitate the bonding with the isocyanate moiety of spacer molecules that could be regarded as the probe for glucose.
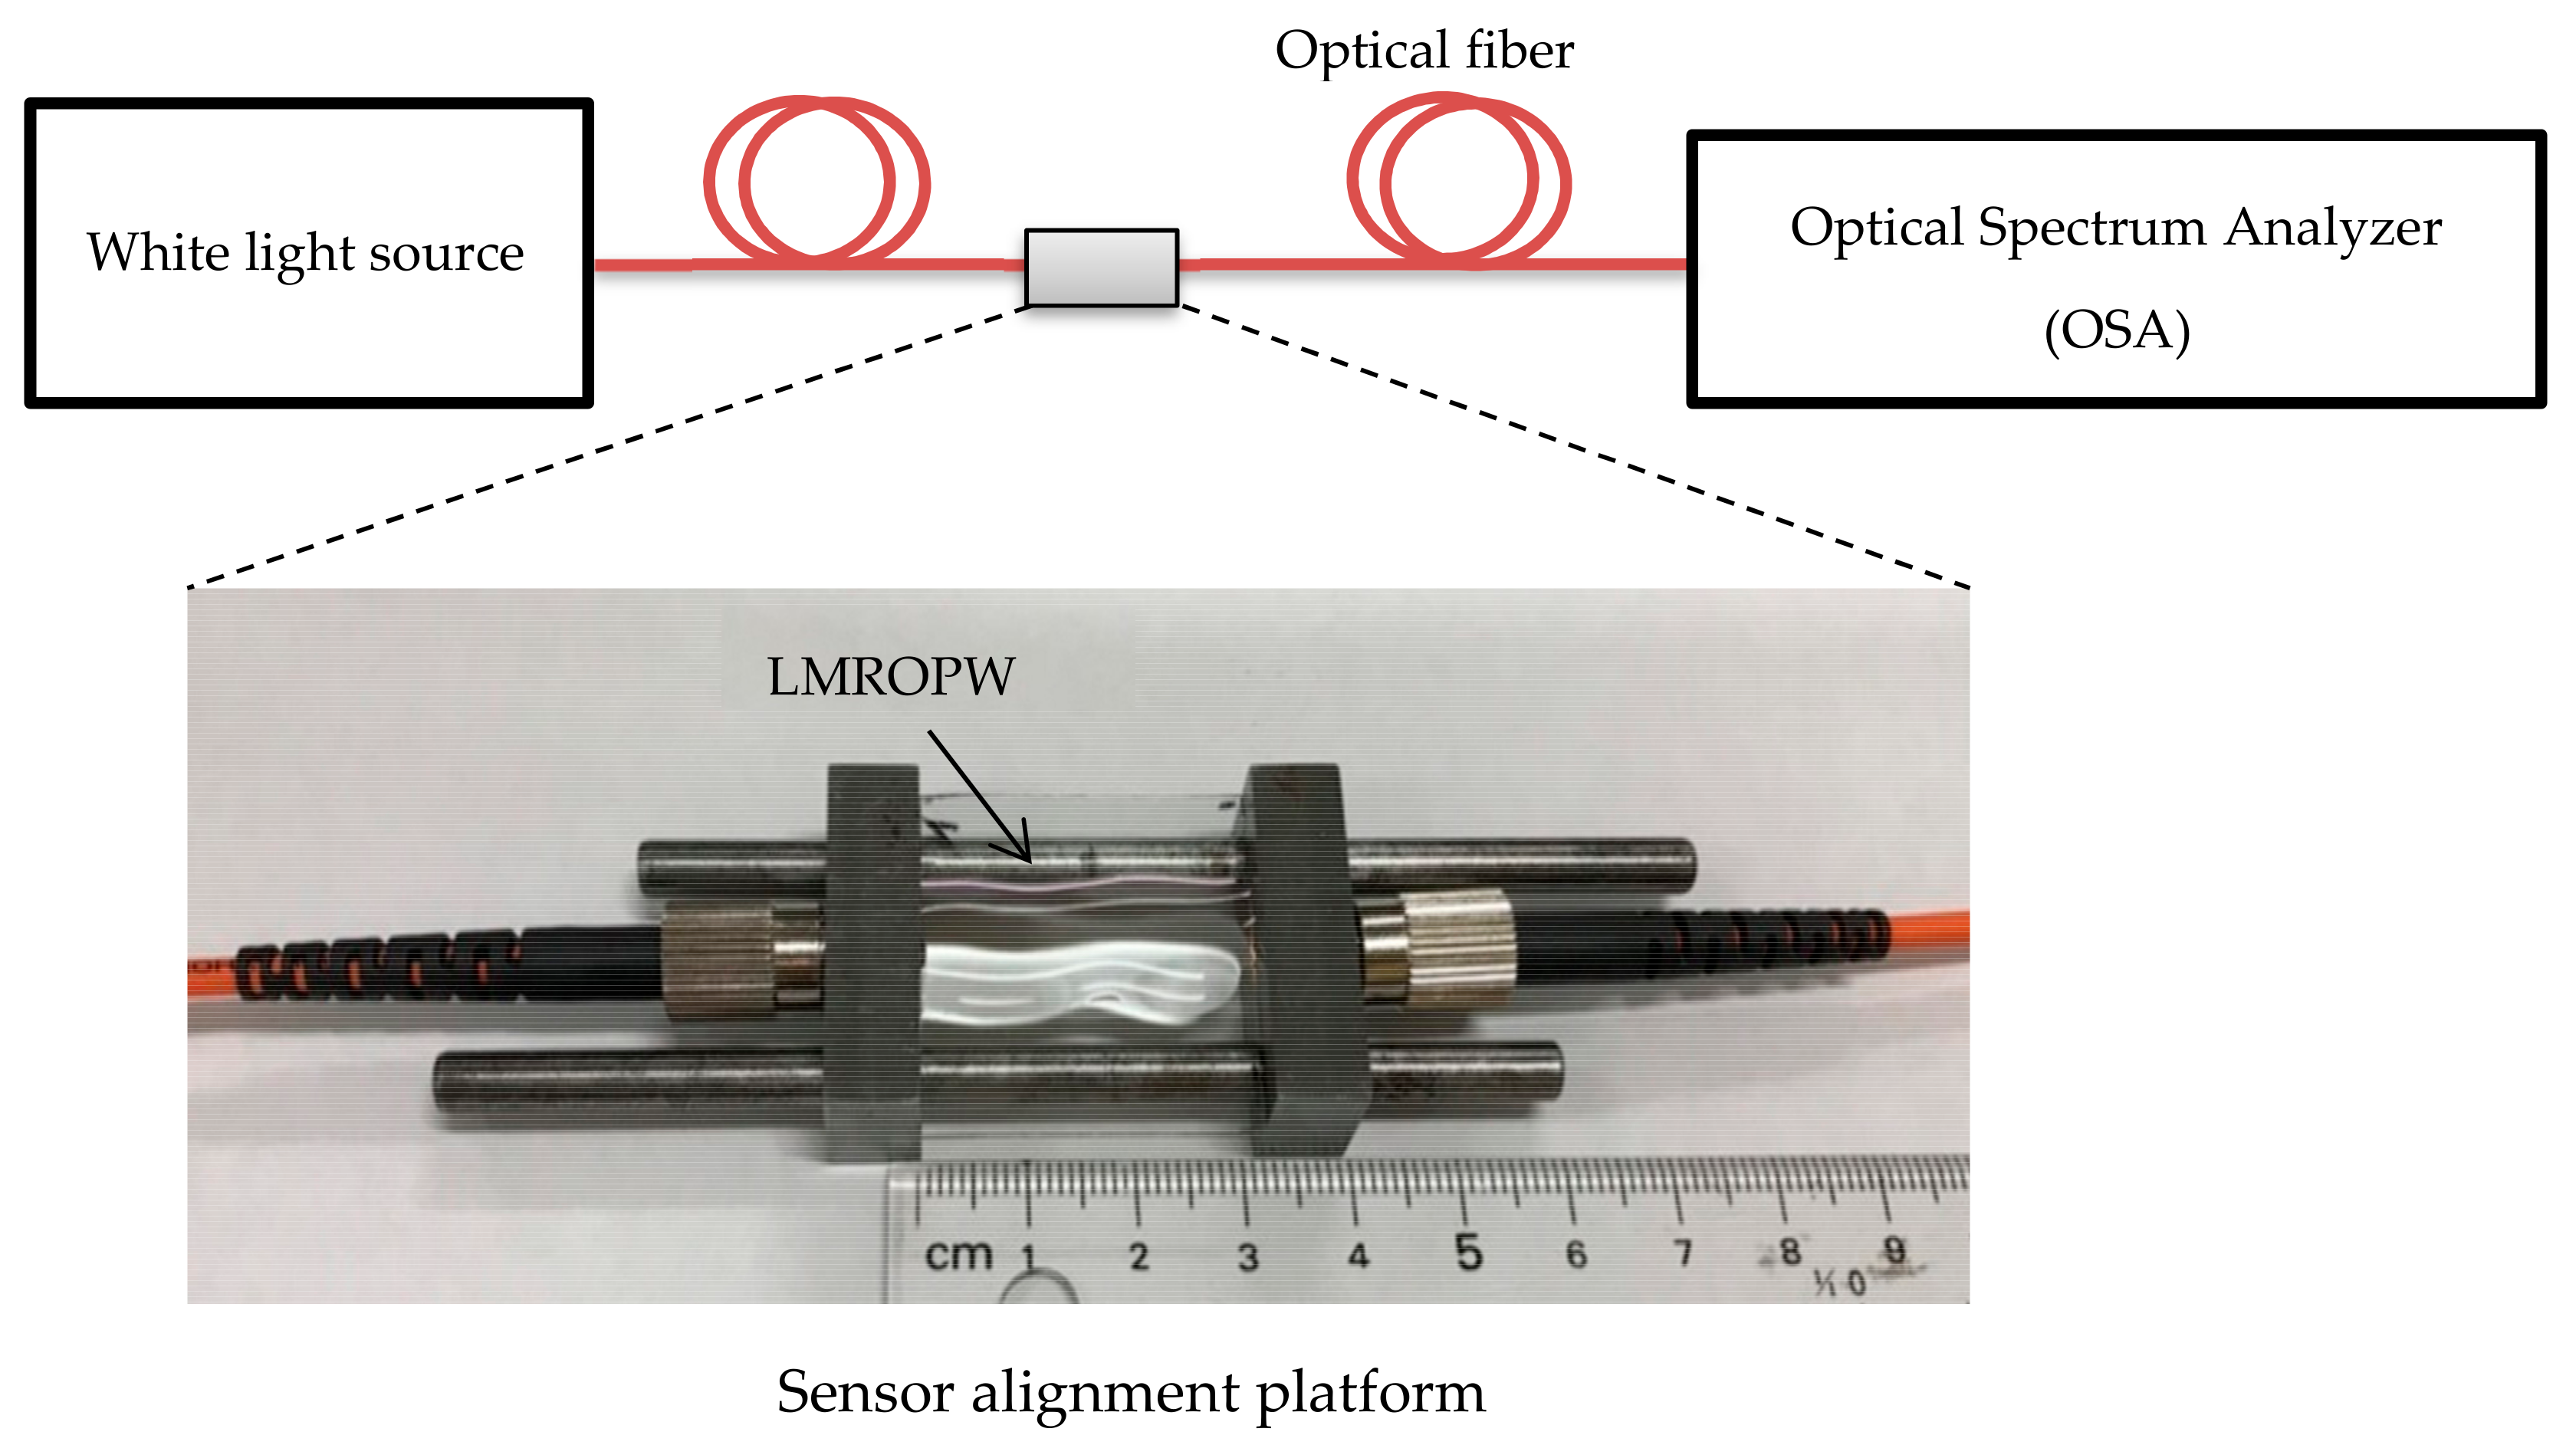
The experiment measurement setup consisted of a halogen white light source (AQ4303B, Ando Electric Co., Ota-ku, Tokyo, Japan), an optical spectrum analyzer (OSA, AQ6315A Ando Electric Co., Ota-ku, Tokyo, Japan), and an LMRPOW glucose sensor. A schematic giving the details of the experiment setup and the photograph of the LMROPW sensor held with the alignment bulk platform is shown in Figure 4. For the purpose of easy self-alignment, the bulk platform was designed in advance to fit all components, and the optical axis was along the center of the LMROPW. With two iron cylinders as a pair of slide bars, the LMROPW sensor could be placed on top of the cylinders. Two iron blocks slid through the two cylinders and clamped the sensor tightly. Each of the iron blocks had a socket for the optic-fiber connector. An optical-fiber patchcord with an FC connector from the light source was inserted into the hole at the left-hand side of the platform, and another optical fiber patchcord was inserted into the right-hand side, which linked to the OSA. Since the diameter of the optic-fiber patchcord was 0.4 mm and the LMROPW thickness was 0.7 mm, the coupling should be modeling with geometrical optics, where the coupling efficiency was calculated by the overlap area of the two waveguides. The optical power at the receiver side was about 100 μW, which was much higher than the power coupling with a single-mode optical fiber of 8 μm core diameter or a multimode optical fiber of 62.5 μm core diameter. So, in the case of a large waveguide, the roughness of the waveguide edges should have no obvious effect during coupling. The glucose solutions used to characterize the LMROPW sensor were prepared by adjusting the concentration of glucose in pure water.
3. Results and Discussion
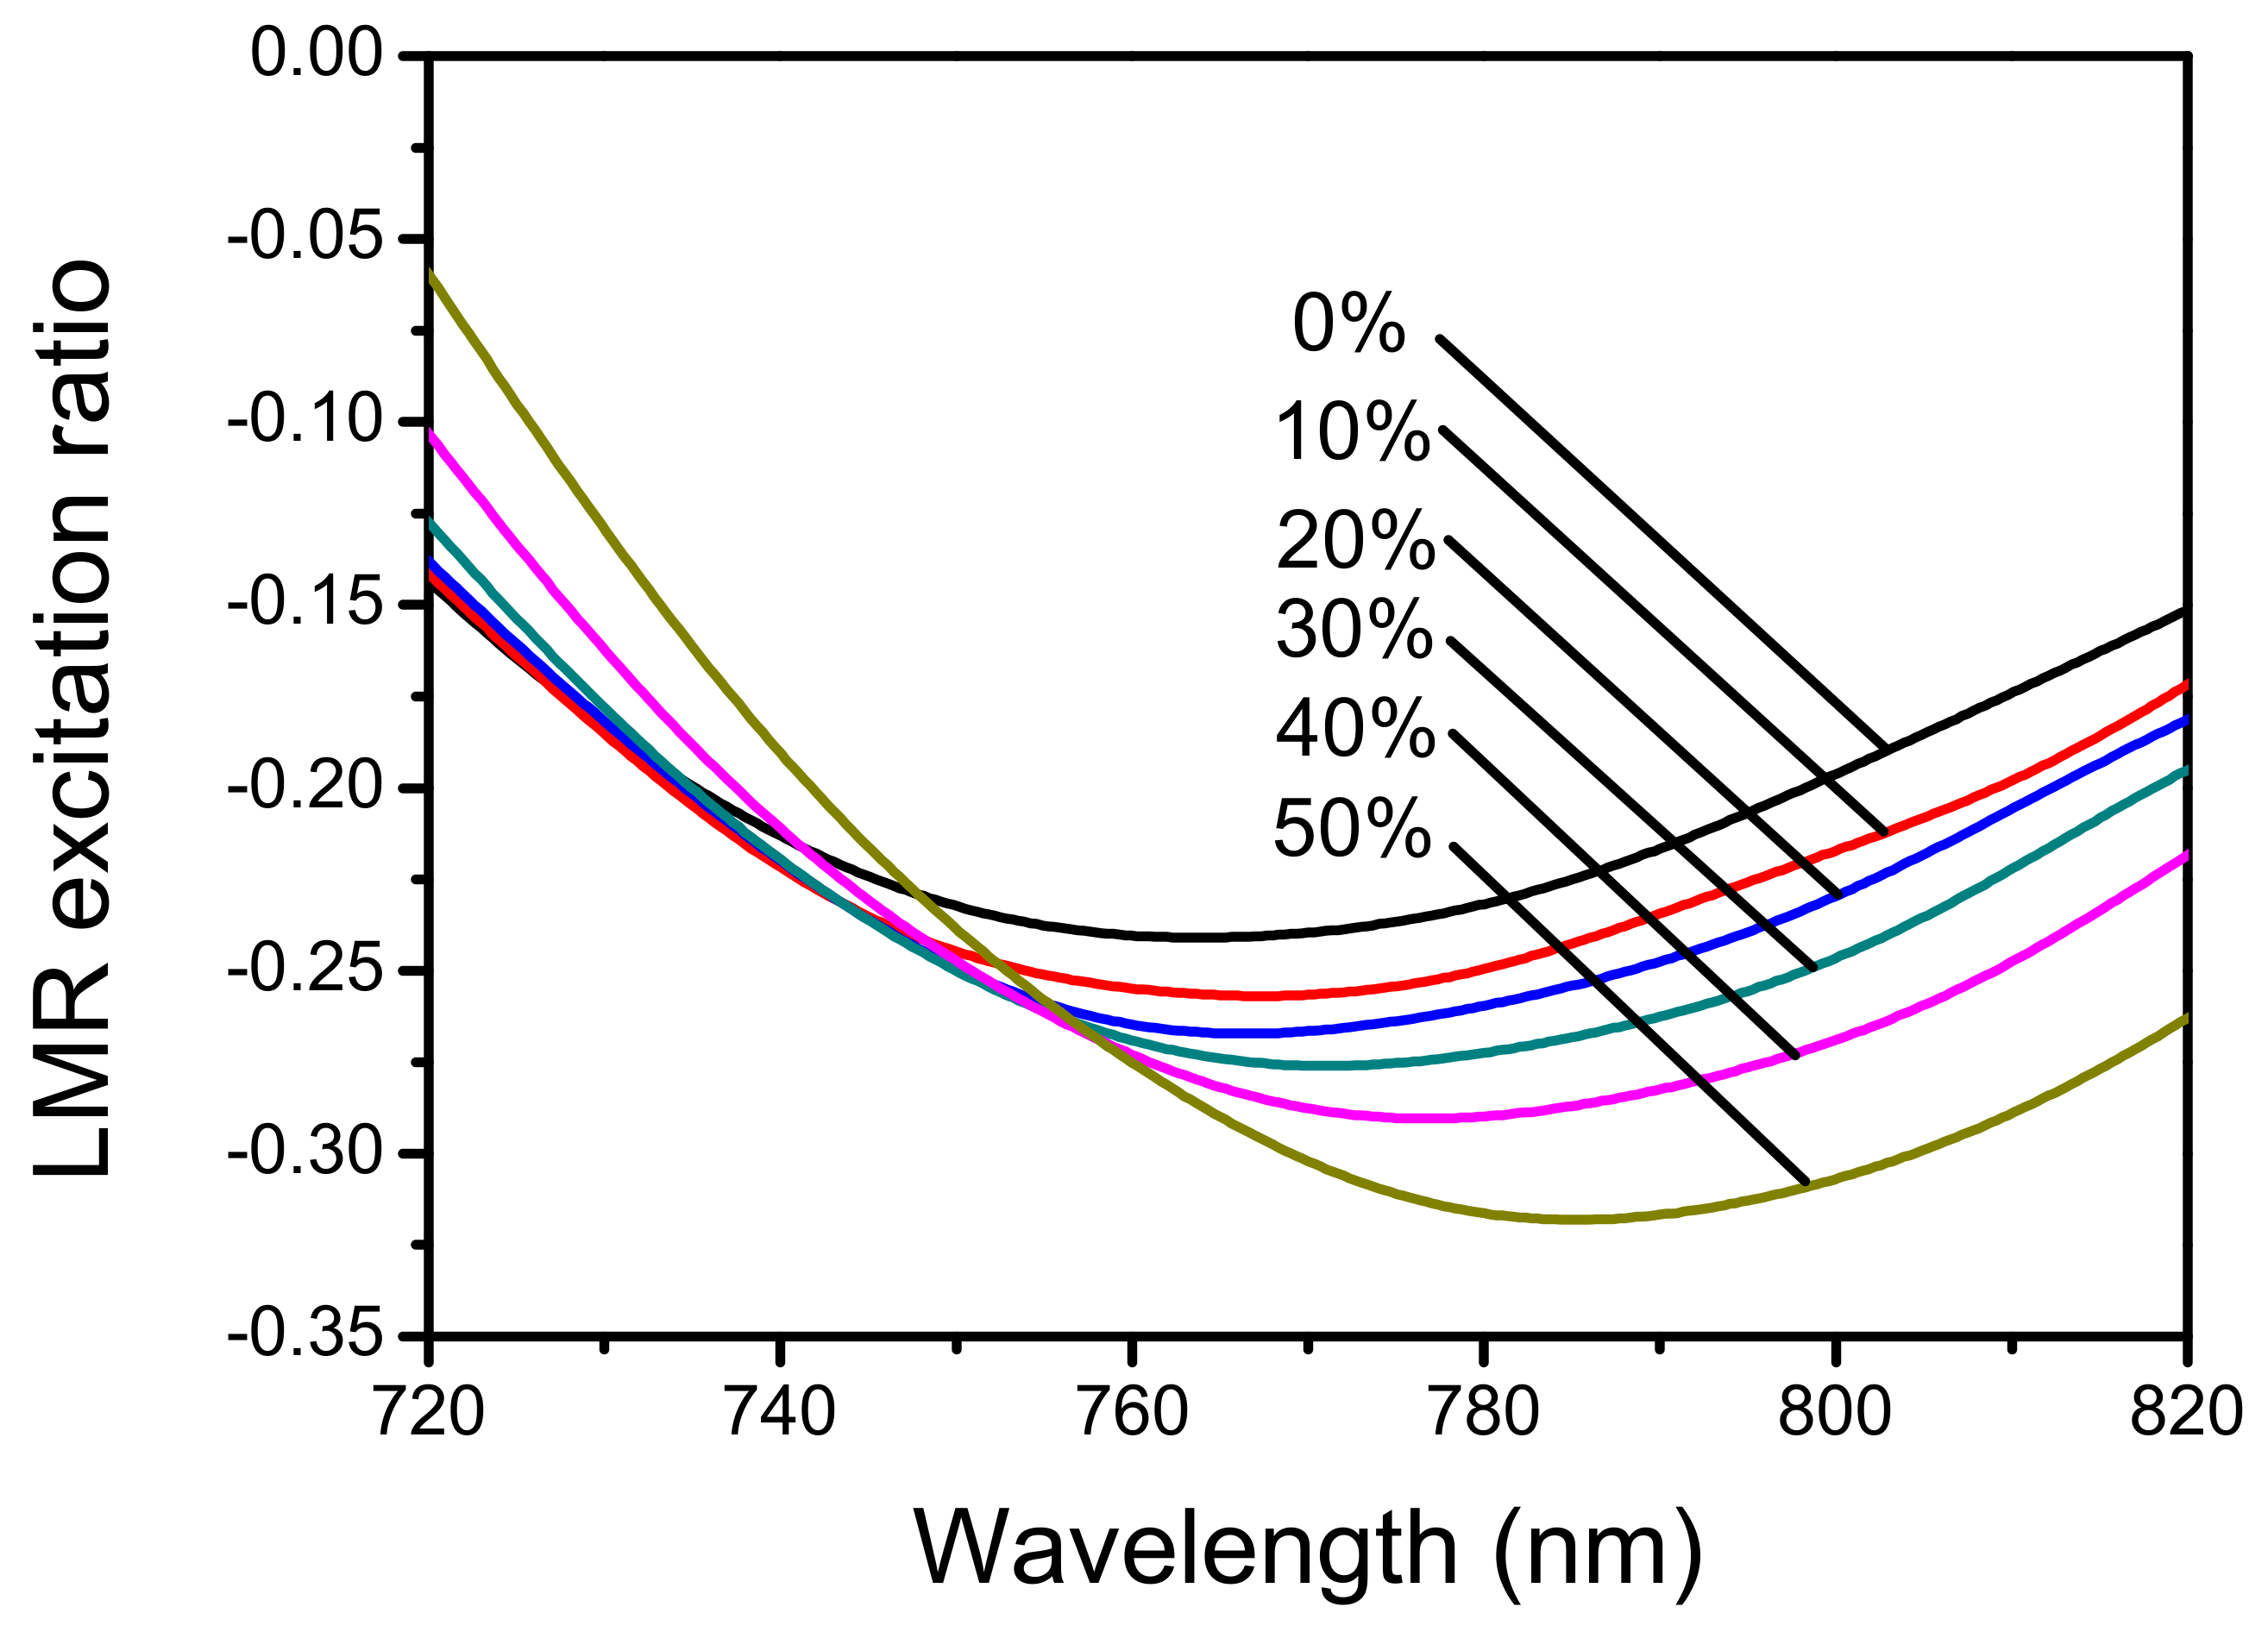
To experimentally verify that ITO acts as an LMR active material, we fabricated the LMROPW sensor by coating the 100 nm ITO layer onto the bare glass substrate, as discussed in the Materials and Experiments section. We mounted the LMROPW sensor in the experiment setup, allowed the white light from the halogen lamp to enter from one end of the fiber, and started recording the transmission spectra from the output end. The spectrum curves obtained for each solution were normalized to the initial power so that we could determine the resonance wavelength for each solution of different concentrations. For the LMR excitation measurement, we first recorded the spectrum without any liquid but the air surrounding the sensing region as a reference spectrum at 25 °C. Then, we introduced drops of the glucose solution on the sensing region without disturbing the sensor and preserved the spectral curves. A similar procedure was repeated for different concentrations of glucose solutions. The LMR signal represented an accumulated spectrum for all modes propagating in the sensor. In order to recognize the LMR excitation efficiency, we normalized the excitation power to the initial power at every wavelength, the ratio defined as Equation (3):
where Pair(λ) and Psol.(λ) are the transmitted power in the air, and in the condition of solution drops, respectively. The numerator Psol.(λ) − Pair(λ) means that the transmitted-power decreases among all the propagating wavelengths, which could also be regarded as an excitation power; the denominator Pair (λ) is the initial transmitted power in the air. The LMR excitation ratio was measured as shown in Figure 5 where LMR occurred at the deep wavelength, and the LMR excitation efficiency was from about 20% to 35%. For the high-glucose-concentration test, the bared LMROPW sensor without surface modification was dropped with different glucose solutions from 0% to 50% in steps of 10%, and the LMR excitation ratio spectra according to the glucose concentration are shown in Figure 5. It was observed that, upon changing the solution concentration, the excitation ratio dip corresponding to a particular LMR wavelength also changed. The LMRs could be excited with ITO in the near-infrared region to longer wavelengths as the concentration of the glucose solution increased. The shift of LMR wavelengths was 23 nm for the surrounding solution from 0% to 50%. The respective refractive indices (RIs) of the glucose solutions were measured using an ATOAGO hand-held refractometer R5000 with an accuracy of ±10−4 RI units (RIU). At first, we placed the refractometer in a place where there was enough light. Next, we dropped the solution onto the prisms, and the RI could be read at the boundary of dark and bright regions by fine adjustment. The RIs measured were 1.3333, 1.3432, 1.3539, 1.3616, 1.3707, and 1.3789, which corresponded to the glucose in the water solutions at concentrations of: 0%, 10%, 20%, 30%, 40%, and 50%, respectively.
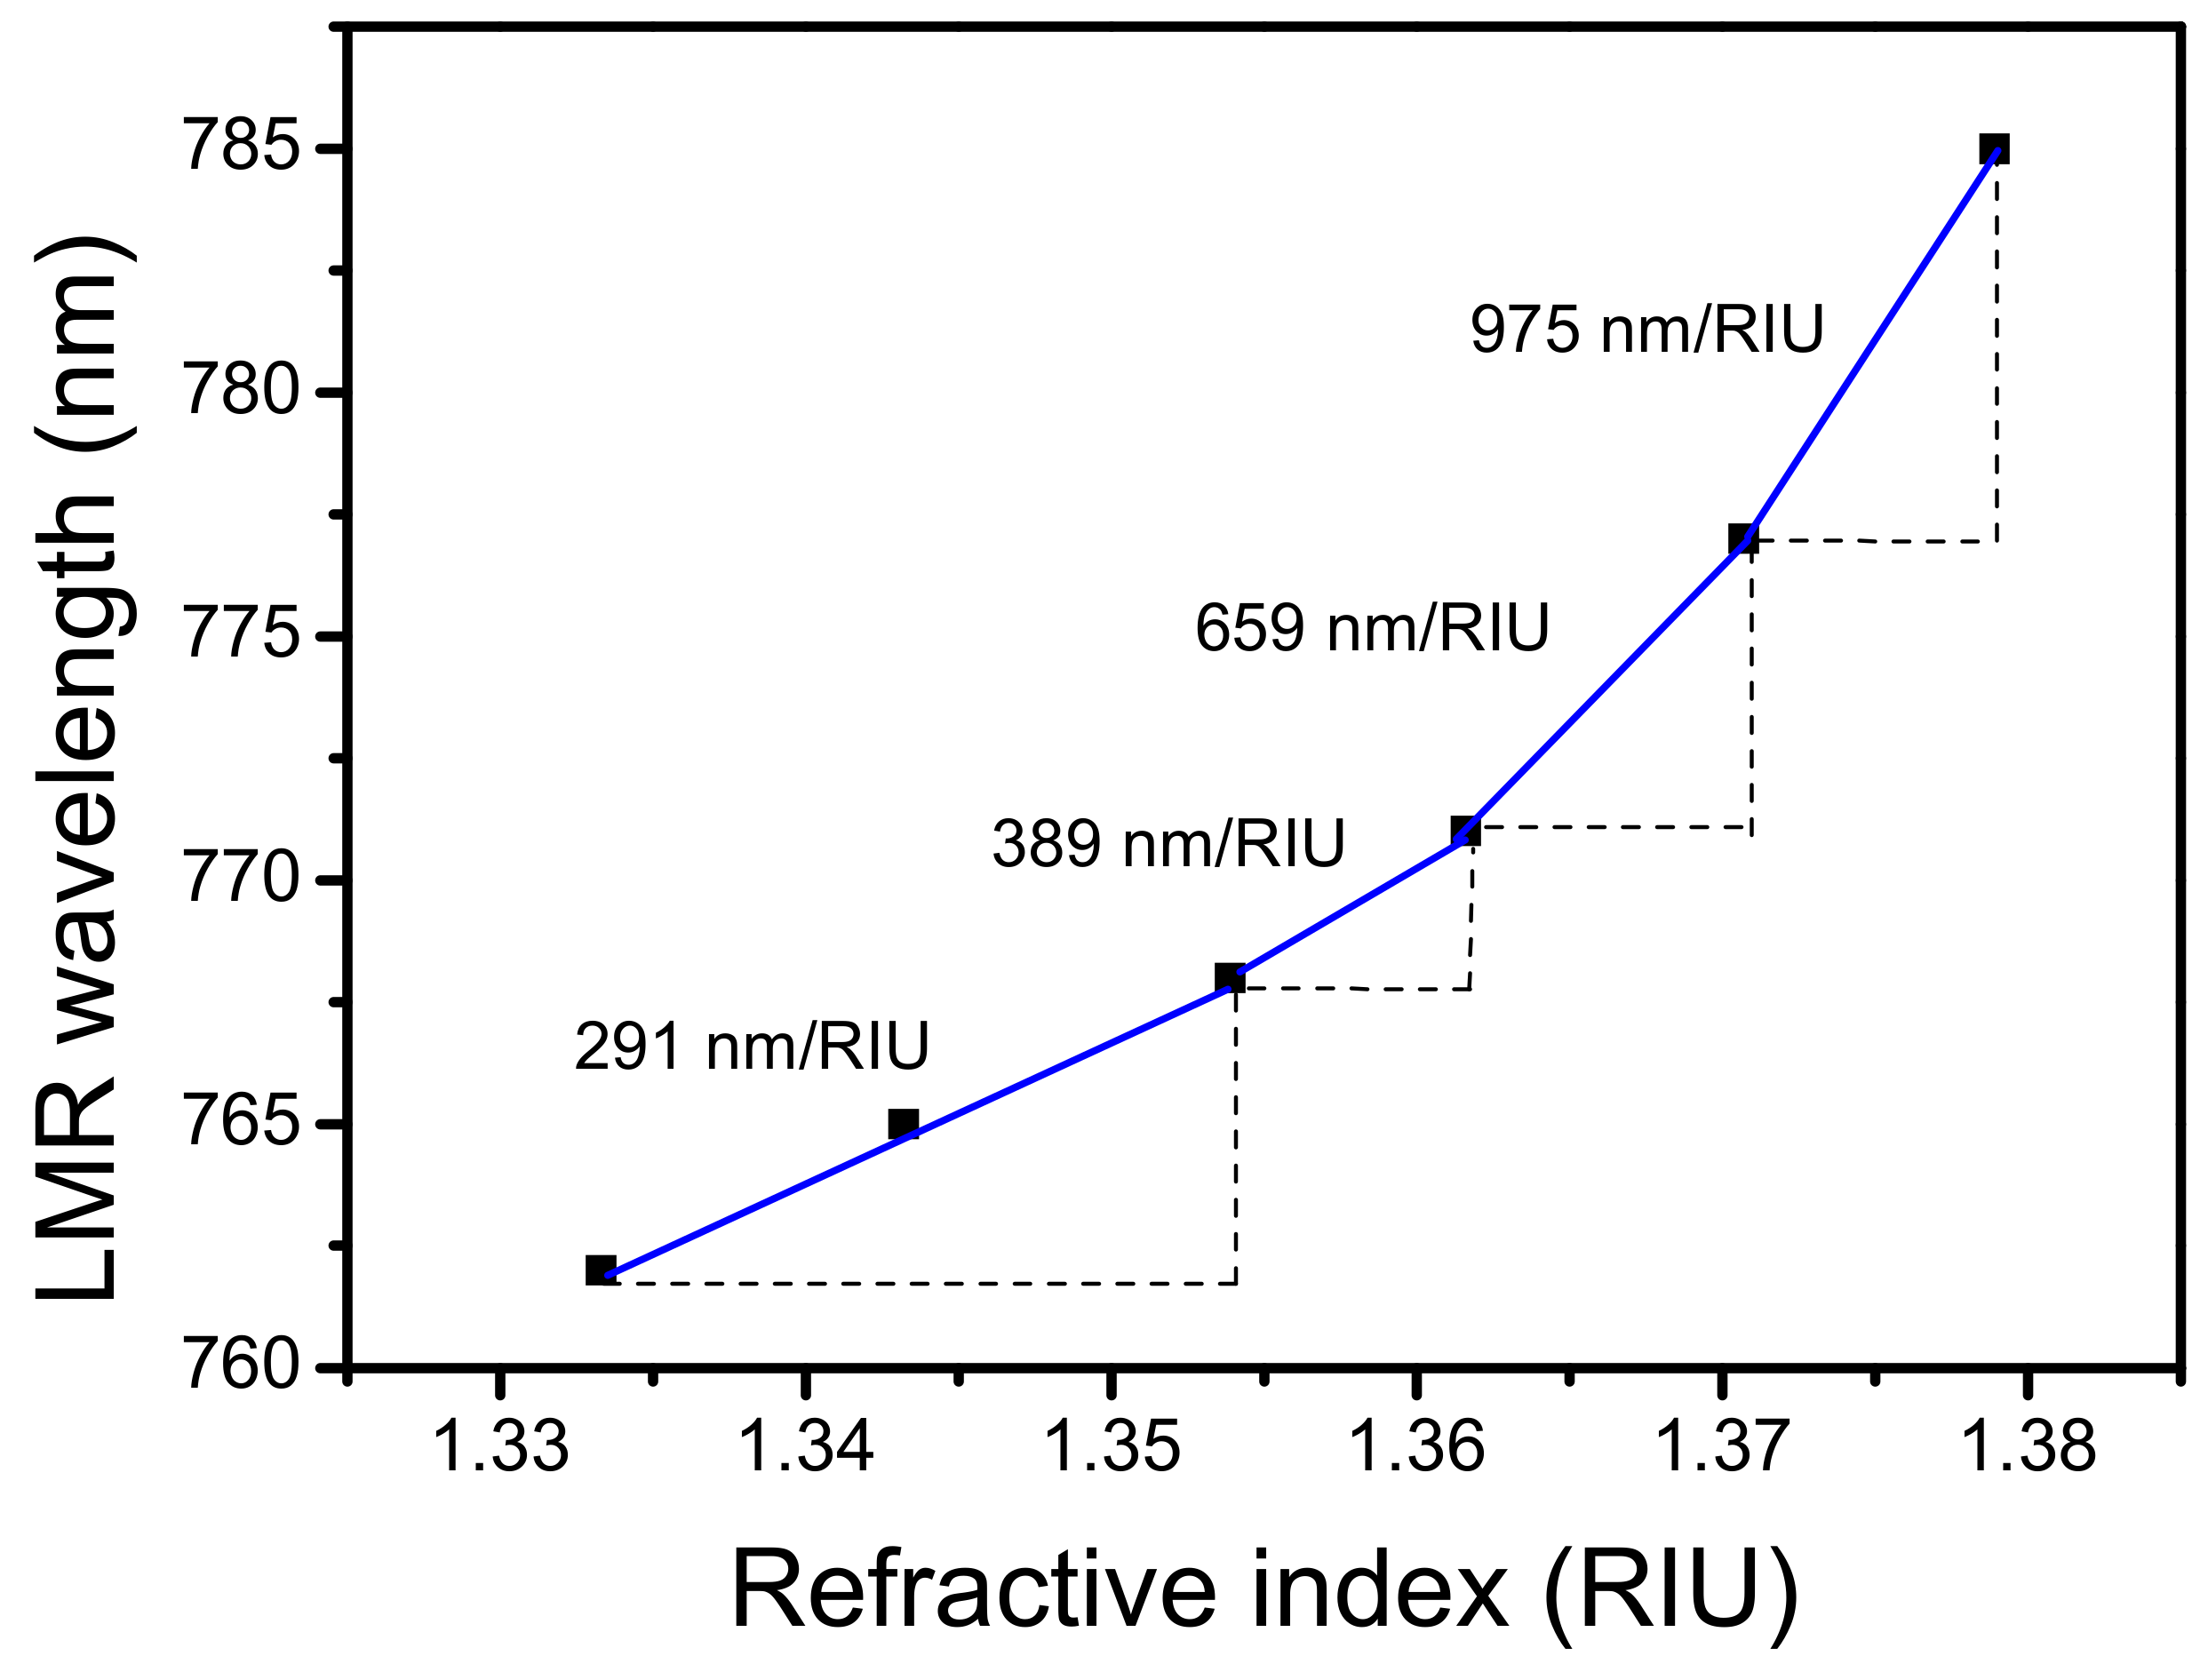
Sensitivity is an important characteristic of the sensor evaluation. These wavelength shifts were converted into changes in the bulk index of the glucose-solution refraction. Sensitivity is defined as the ratio of the LMR wavelength change to the RI change. In the experiment, sensitivity was calculated to be 291 and 389 nm/RIU for the lower external RI, and approached 975 nm/RIU for the higher external RI, as shown in Figure 6. Compared to ITO-based optical fiber refractometers, the sensitivity of the LMR sensor has been reported as 2953 and 1617 nm per RIU for an ITO thickness of 115 and 220 nm, respectively [22]. Further, by modifying the shape of the optical fiber to a D-shaped fiber, sensitivity was enhanced up to 6009 nm/RIU, and a maximum sensitivity of 8742 nm/RIU was demonstrated in the same work for the RI region from 1.365 to 1.380, with the ITO layer thickness of 170 nm [45]. In the case of the ZnO thin film, the performance analysis of the LMR sensor was reported, and sensitivity was experimentally found to be around 760 nm/RIU at an RI of 1.433 [35]. Compared with those optical-fiber-type LMR sensors, our sensitivity was a little lower than some of them. However, it is worthy to mention that the LMROPW we proposed here is a simple and robust structure with the advantages of a low-cost material and ease of mass-production; significantly, it is also beneficial to the subsequent surface-modification process.
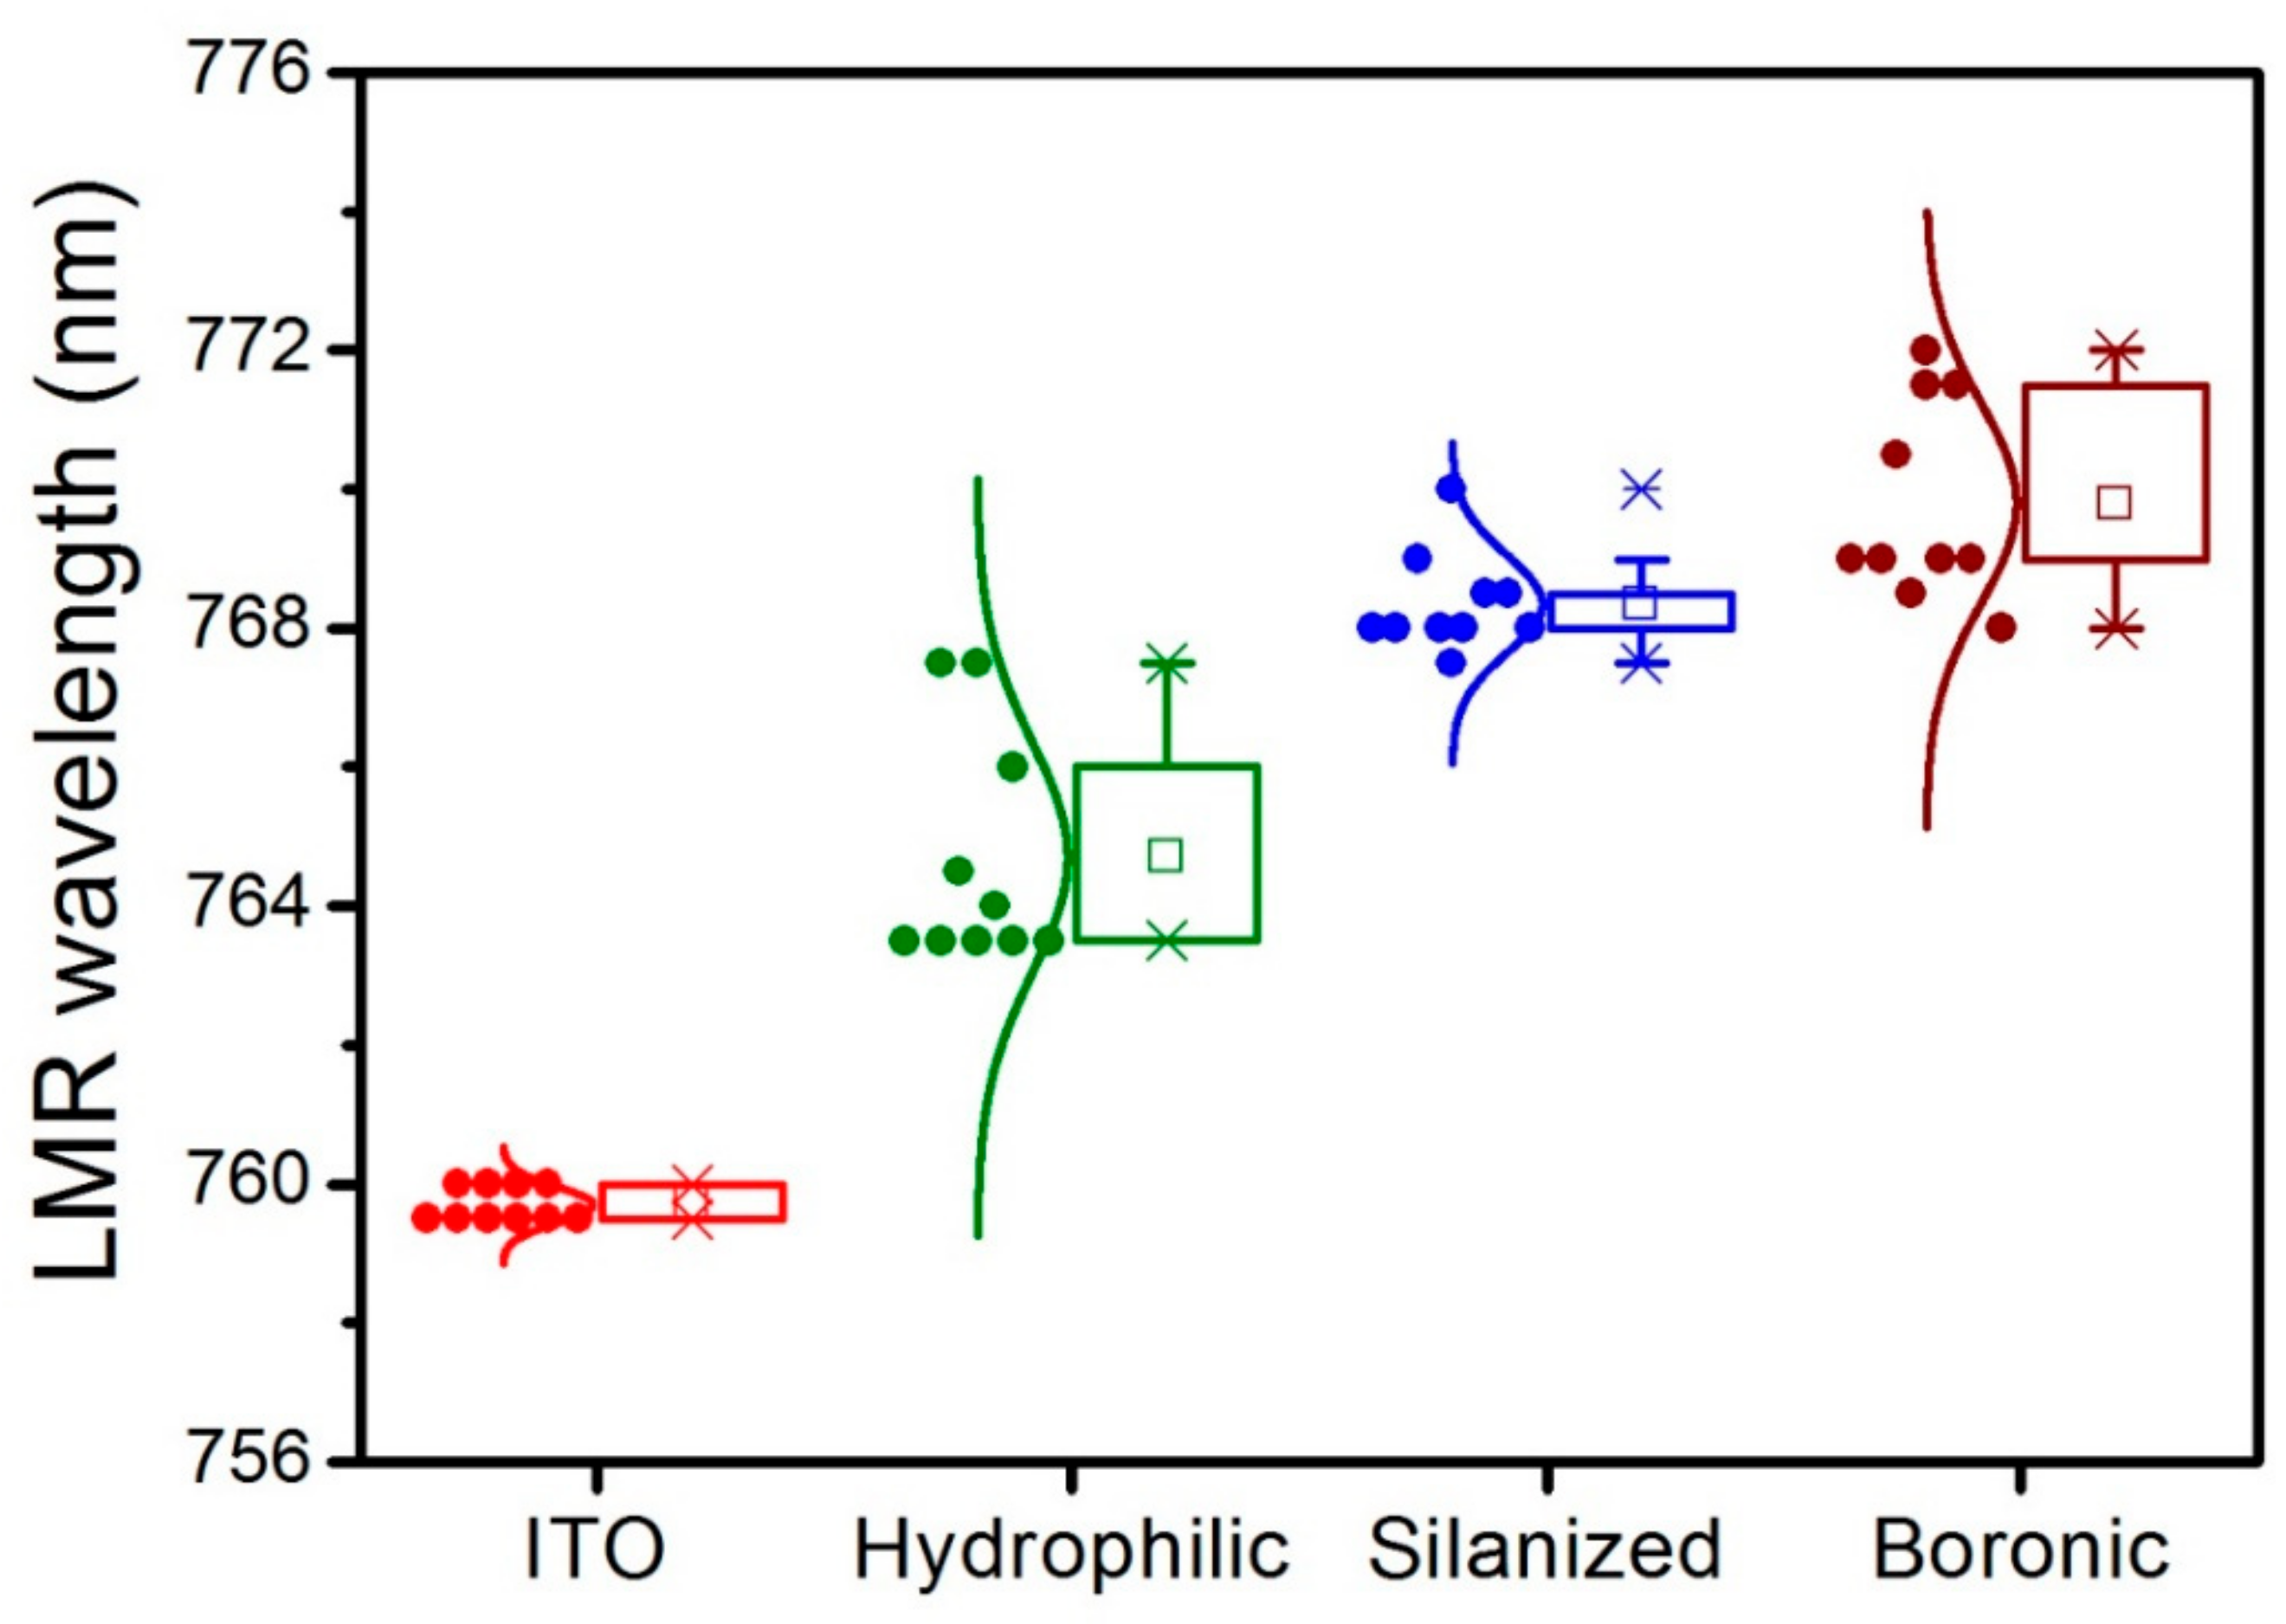
In order to realize the influence of surface modification on the LMR spectra during processing, the statistics box diagram for surface modification of the bared ITO, hydrophilic, silanized, and boronic surfaces with pure water dropping is shown in Figure 7, where every step was measured 10 times. A box plot was constructed from five values, minimum value, first quartile, average, third quartile, and maximum value, for the four types of modification processing. Initially, the LMR wavelength showed a minor alteration of 1 nm for the bared ITO. Then, the data-distribution variation made it become about 4 nm. This is because the surface of the modified ITO was not uniform and was uneven during chemical processing. The average LMR wavelengths for the four steps of surface modification were 759.7, 764.7, 768.4, and 769.8 nm, respectively. The increase in the LMR wavelength occurred due to the increase in RIs on the ITO surface and the increase in the thickness of the dielectric thin-film layer. This implies that the LMR wavelength shifted to a longer spectrum as more substance stacked onto the ITO surface, and the total variation from 759.7 to 769.8 nm was 10.1 nm. These results show the physicochemical properties of modified surfaces dominating the interfacial dielectric constant during LMR, hence the shift in the LMR wavelength toward the red side.
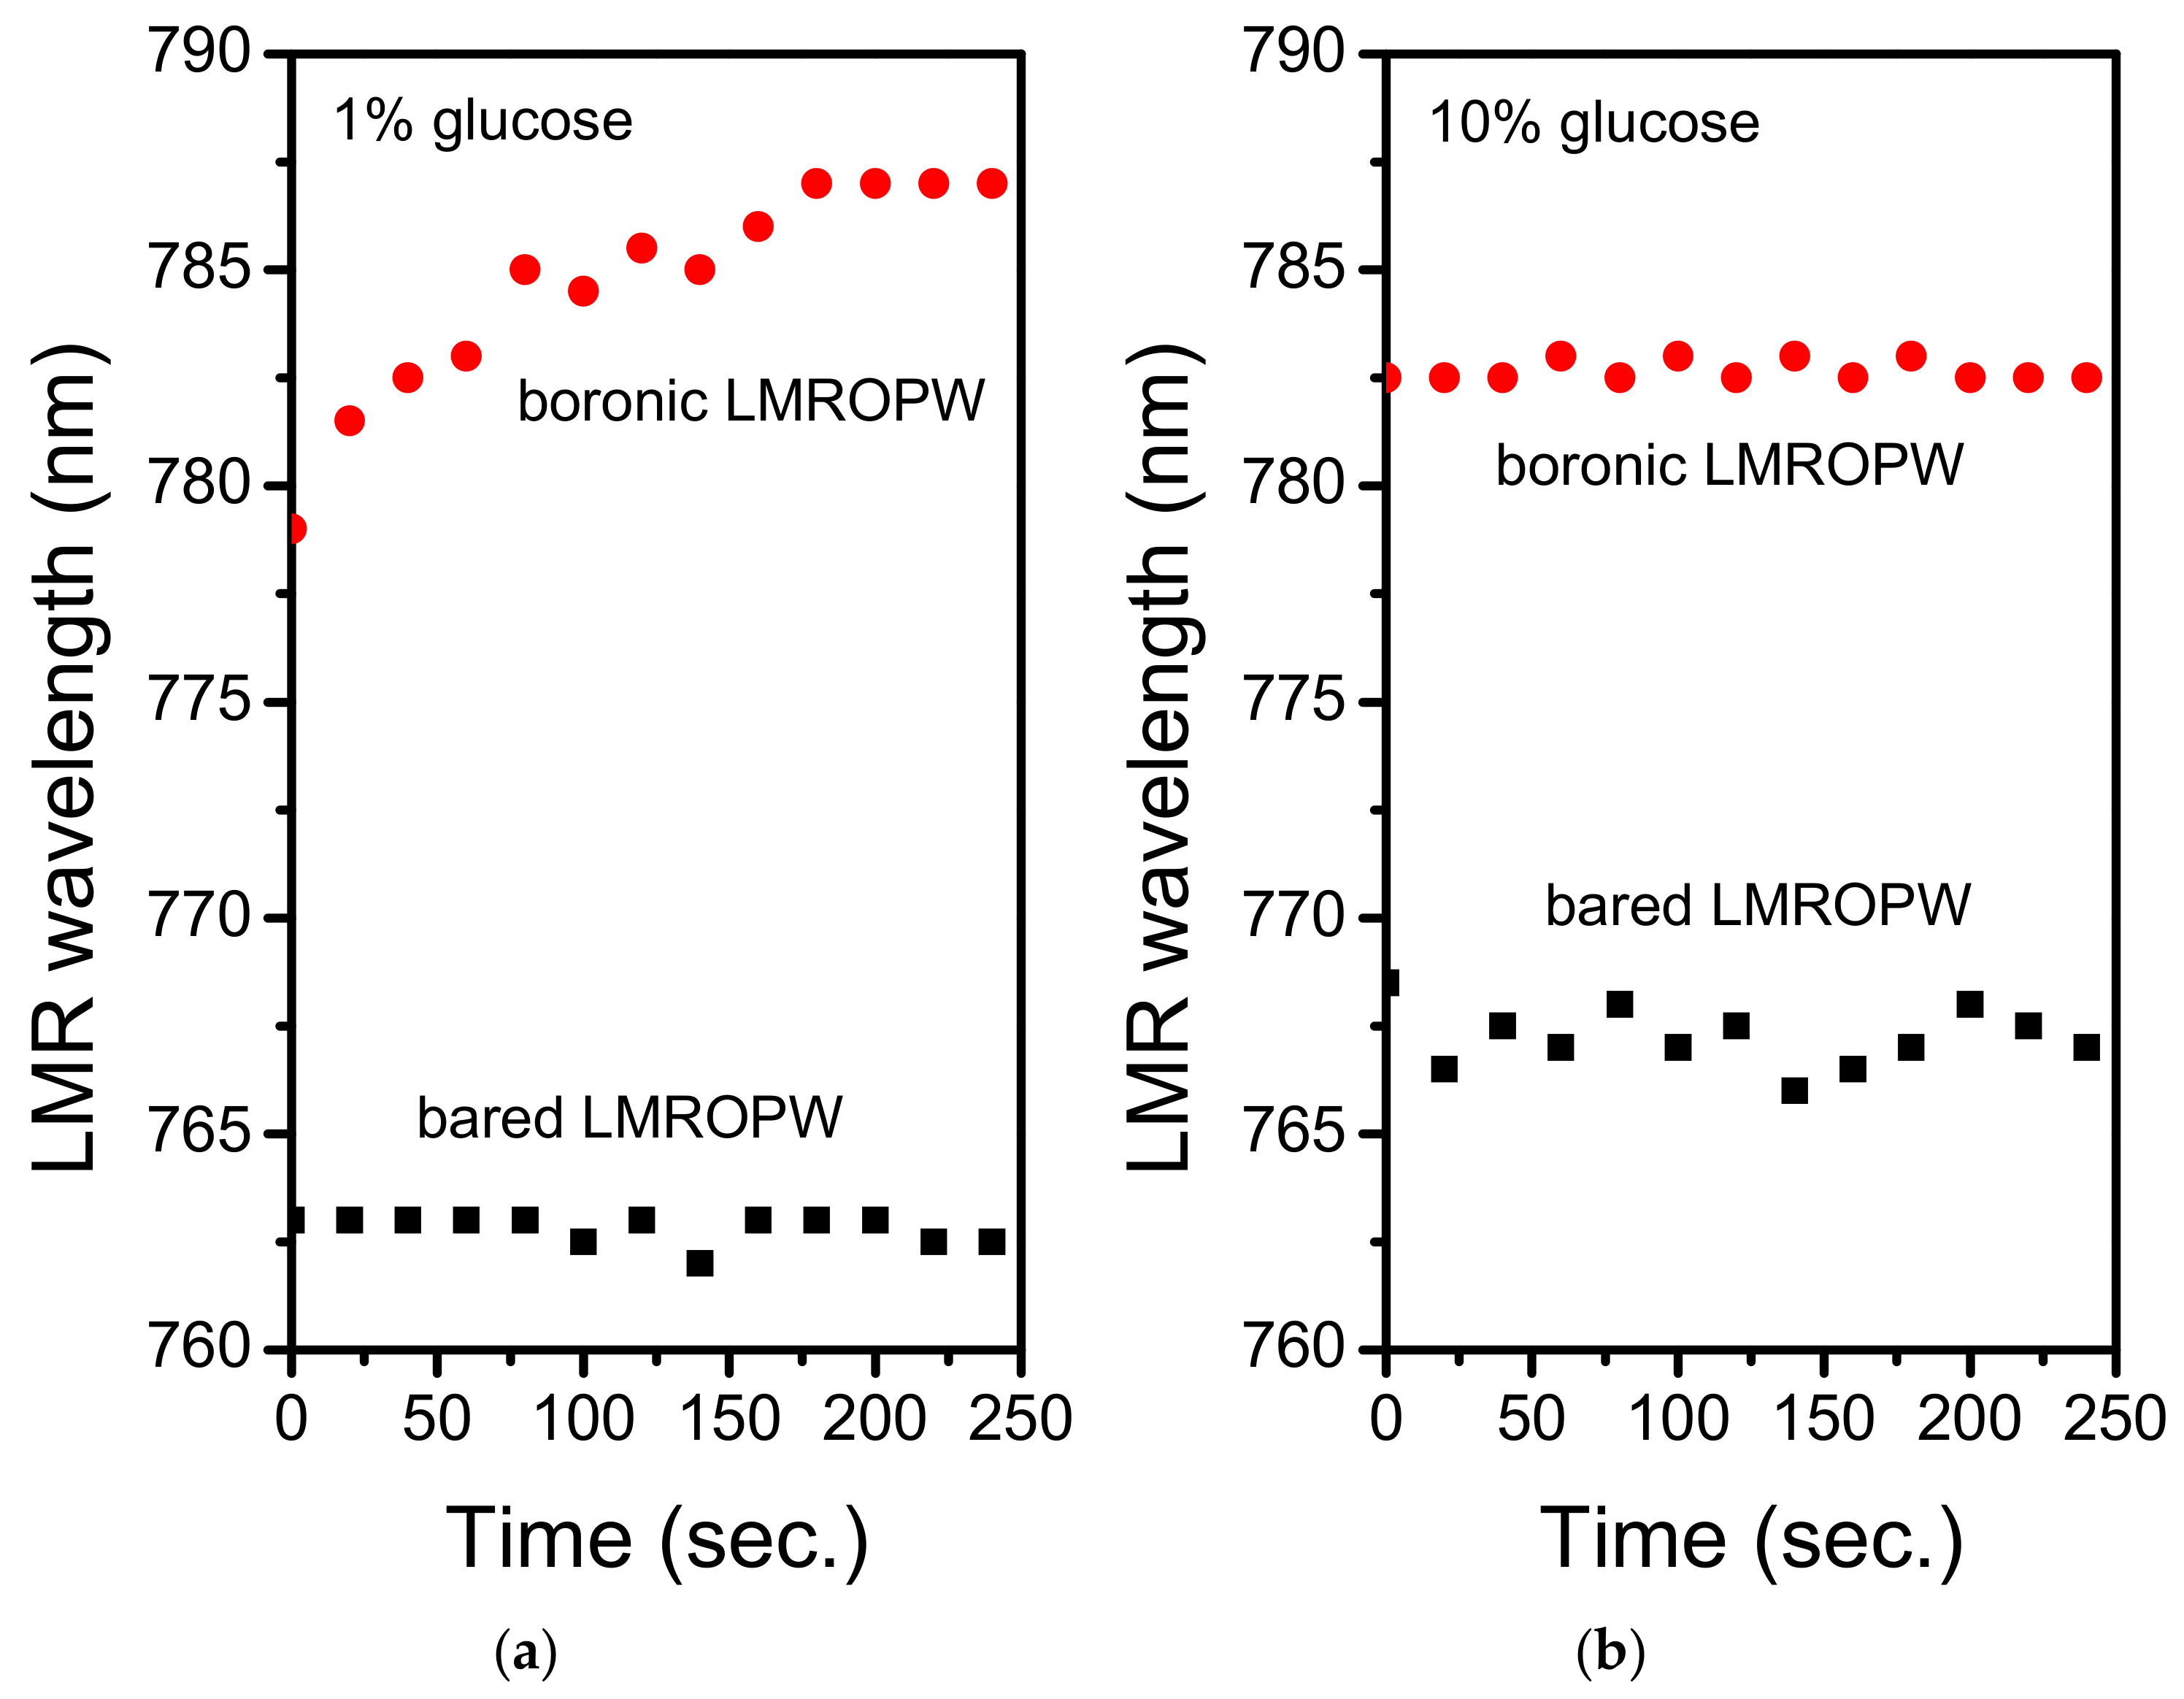
In order to find the dependence of the LMR wavelength on the reaction time, a low-concentration glucose solution of 1% was dropped on both the bared LMROPW sensor, which means the ITO without the surface modification, and the boronic LMROPW sensor, which indicates the ITO with the surface modification; spectra variations were measured at an interval of 20 s, as shown in Figure 8a. For the boronic LMROPW sensor, the LMR wavelength shifted 8 nm from 779.0 to 787.0 nm in 180 s, and then remained stable. Since the variation of the LMR wavelength was time-dependent, this indicated that glucose was being adsorbed on the sensing surface within 180 s, and maintained saturation at about 787 nm after 180 s. The boronic ITO surface could also be regarded as many probes bonding onto the ITO surface to adsorb the glucose molecule. Saturation occurred because of the limited amount of the glucose probe on the ITO surface. The operating range of the sensor could be increased using the increased amount of the glucose probe on the ITO surface. However, the probe quantity could be increased only up to a certain limit or the probe could not be bonded onto the surface. A kinetic observation demonstrated that the adsorption of the glucose molecule dominated the interfacial dielectric property with LMR. To verify whether the shift in the LMR wavelength occurred due to the adsorption reaction, we performed control experiments, using only bared without modification. The LMR wavelengths determined from their LMR spectra are also shown in Figure 8a. It may be noted that no appreciable shift in the resonance wavelength was obtained for the bared LMROPW and LMR wavelength kept stable at about 762 nm for all 240 s. This implies that the shift in the LMR wavelength was solely due to the adsorption resulting in the change in the refractive index of the sensing layer for the boronic LMROPW. These observations from Figure 8a confirm that the observed change in LMR wavelength was due to the reaction of the glucose with the boronic surface.
However, in the case of the 10% glucose solution test, LMR wavelengths remained at 762 nm for the bared LMROPW sensor and at 782 nm for the boronic LMROPW sensor, as shown in Figure 8b, where the LMR wavelength did not gradually increase. This is due to the fact that, for the 10% high concentration of the glucose solution, the RI was measured to be 1.3432, which was obviously higher than that of the 1% glucose solution, with an RI of about 1.3333.
As a kinetic opinion, the glucose adsorption onto the surface of the boronic LMROPW is a sensitive mechanism at a low concentration of the aqueous glucose. However, the mechanism of the glucose recognition would be inert if the bulk solution was more hydrophobic than the boronic surface. Glucose molecules could competitively capture the hydrates from the sensor surface [46]. Thus, the boronic sensor surface would demonstrate a stronger hydrogen-bond interaction to attract the glucose molecules.. Consequently, an external bulk RI became the domain mechanism for the LMR wavelength shift, although adsorption also occurred at the same time.
4. Conclusions
We proposed two types of LMROPW sensing technology with a high-κ dielectric film to detect different concentrations of the glucose solution. One was the bared LMROPW sensor, which is suitable for high-concentration glucose solutions of above 10%, and a sensitivity of 975 nm/RIU was achieved. The other was the boronic LMROPW sensor, which could be applied to low-concentration glucose solutions (1%) to monitor the glucose adsorption onto a material surface. The LMR wavelength increased from 779.0 to 787.0 nm in 180 s and then stayed stable. It is worthy to note that the LMROPW we proposed could also be bonded with other bioprobes for the field of biomedical sensing, especially for low concentrations of the analyte solution. Further, with the advantages of a simple structure for the dielectric film deposition and surface modification, easy alignment for the LMR spectrum investigation, and being appropriate for mass-production, LMROPW sensors could be utilized to detect toxins to achieve better quality control for the total analysis system (µ-TAS) used in clinic diagnostics, biomedical research, drug discovery, food industries, security, and defense. It could be possible to enhance the LMR signal by adding some nanoparticles onto the sensing layer in the future. In addition, the use of thinner glass waveguides could increase the up-and-down reflection times as light passes through the sensing region. As a result, it is possible to enhance the LMR signal as well as improve the sensitivity of an LMROPW sensor.
Author Contributions
Conceptualization and investigation, Y.-C.L.; Methodology and validation, L.-Y.C.; Writing—original draft preparation, Y.-C.L.; Writing—review and editing, F.-C.C.; Project administration, Y.-C.L.
Funding
The authors would like to thank the Ministry of Science and Technology for the financial support under contracts MOST 106-2221-E-130-011.
Acknowledgments
The authors would like to thank Acute Touch Technology Co., Ltd for providing the coating technology. The authors also acknowledge the assistance from Bo-Yu Lin in conducting the experiment.
Conflicts of Interest
The authors declare no conflict of interest.The funders had no role in the design of the study; in the collection, analyses, or interpretation of data; in the writing of the manuscript, or in the decision to publish the results.
References
- Lo, S.-H.; Buchanan, D.; Taur, Y.; Wang, W. Quantum-mechanical modeling of electron tunneling current from the inversion layer of ultra-thin-oxide nMOSFET’s. IEEE Electron. Device Lett. 1997, 18, 209–211. [Google Scholar] [CrossRef]
- Chiu, F.-C. A Review on Conduction Mechanisms in Dielectric Films. Adv. Mater. Sci. Eng. 2014, 2014, 1–18. [Google Scholar] [CrossRef] [Green Version]
- Chiu, F.-C.; Lai, C.-M. Optical and electrical characterizations of cerium oxide thin films. J. Phys. D Appl. Phys. 2010, 43, 75104. [Google Scholar] [CrossRef]
- Shvets, V.A.; Kruchinin, V.N.; Gritsenko, V.A. Dispersion of the refractive index in high-k dielectrics. Opt. Spectrosc. 2017, 123, 728–732. [Google Scholar] [CrossRef]
- Granqvist, C.; Hultåker, A. Transparent and conducting ITO films: New developments and applications. Thin Solid Films 2002, 411, 1–5. [Google Scholar] [CrossRef]
- Ali, A.H.; Hassan, Z.; Shuhaimi, A. Enhancement of optical transmittance and electrical resistivity of post-annealed ITO thin films RF sputtered on Si. Appl. Surf. Sci. 2018, 443, 544–547. [Google Scholar] [CrossRef]
- George, J.; Menon, C. Electrical and optical properties of electron beam evaporated ITO thin films. Surf. Coat. Technol. 2000, 132, 45–48. [Google Scholar] [CrossRef]
- Goncalves, G.; Elangovan, E.; Barquinha, P.; Pereira, L.; Martins, R.; Fortunato, E. Influence of post-annealing temperature on the properties exhibited by ITO, IZO and GZO thin films. Thin Solid Films 2007, 515, 8562–8566. [Google Scholar] [CrossRef]
- Smietana, M.; Sobaszek, M.; Michalak, B.; Niedzialkowski, P.; Bialobrzeska, W.; Koba, M.; Sezemsky, P.; Stranak, V.; Karczewski, J.; Ossowski, T.; et al. Optical Monitoring of Electrochemical Processes With ITO-Based Lossy-Mode Resonance Optical Fiber Sensor Applied as an Electrode. J. Light. Technol. 2018, 36, 954–960. [Google Scholar] [CrossRef]
- Zamarreño, C.; Hernaez, M.; Del Villar, I.; Matias, I.R.; Arregui, F.J.; Zamarreño, C. Tunable humidity sensor based on ITO-coated optical fiber. Sens. Actuators B Chem. 2010, 146, 414–417. [Google Scholar] [CrossRef]
- Khan, M.Z.H. Effect of ITO surface properties on SAM modification: A review toward biosensor application. Cogent Eng. 2016, 3, 1170097. [Google Scholar] [CrossRef]
- Ordal, M.A.; Long, L.L.; Bell, R.J.; Bell, S.E.; Bell, R.R.; Alexander, R.W.; Ward, C.A. Optical Properties of the Metals Al, Co, Cu, Au, Fe, Pb, Ni, Pd, Pt, Ag, Ti, and W in the Infrared and Far Infrared. Appl. Opt. 1983, 22, 1099–1119. [Google Scholar] [CrossRef] [PubMed]
- Mitsushio, M.; Miyashita, K.; Higo, M. Sensor properties and surface characterization of the metal-deposited SPR optical fiber sensors with Au, Ag, Cu, and Al. Sens. Actuators A Phys. 2006, 125, 296–303. [Google Scholar] [CrossRef]
- Shah, K.; Sharma, N.K.; Sajal, V. SPR based fiber optic sensor with bi layers of indium tin oxide and platinum: A theoretical evaluation. Optik 2017, 135, 50–56. [Google Scholar] [CrossRef]
- Nasirifar, R.; Danaie, M.; Dideban, A. Dual channel optical fiber refractive index sensor based on surface plasmon resonance. Optik 2019, 186, 194–204. [Google Scholar] [CrossRef]
- Nidhi, P.; John, J. Theoretical Modeling of Lossy Mode Resonance Based Refractive Index Sensors with Ito/Tio 2 Bilayers. Appl. Opt. 2014, 53, 3241–3246. [Google Scholar]
- Sobaszek, M.; Dominik, M.; Burnat, D.; Bogdanowicz, R.; Stranak, V.; Sezemsky, P.; Śmietana, M. Optical Monitoring of Thin Film Electro-Polymerization on Surface of Ito-Coated Lossy-Mode Resonance Sensor. In Proceedings of the Paper Presented at the 2017 25th Optical Fiber Sensors Conference (OFS), Jeju, Korea, 24–28 April 2017. [Google Scholar]
- Mandal, S.; Manasreh, M.O. An in-vitro optical sensor designed to estimate glycated hemoglobin levels. Sensors 2018, 18, 1084. [Google Scholar] [CrossRef]
- Zubiate, P.; Zamarreño, C.; Sanchez, P.; Matias, I.R.; Arregui, F.J. High sensitive and selective C-reactive protein detection by means of lossy mode resonance based optical fiber devices. Biosens. Bioelectron. 2017, 93, 176–181. [Google Scholar] [CrossRef]
- Usha, S.P.; Shrivastav, A.M.; Gupta, B.D. Silver nanoparticle noduled ZnO nanowedge fetched novel FO-LMR based H2O2 biosensor: A twin regime sensor for in-vivo applications and H2O2 generation analysis from polyphenolic daily devouring beverages. Sens. Actuators B Chem. 2017, 241, 129–145. [Google Scholar] [CrossRef]
- Tiwari, D.; Mullaney, K.; Korposh, S.; James, S.W.; Lee, S.-W.; Tatam, R.P. An ammonia sensor based on Lossy Mode Resonances on a tapered optical fibre coated with porphyrin-incorporated titanium dioxide. Sens. Actuators B Chem. 2017, 242, 645–652. [Google Scholar] [CrossRef] [Green Version]
- Del Villar, I.; Zamarreno, C.; Hernaez, M.; Arregui, F.J.; Matias, I.R. Lossy Mode Resonance Generation With Indium-Tin-Oxide-Coated Optical Fibers for Sensing Applications. J. Light. Technol. 2010, 28, 111–117. [Google Scholar] [CrossRef]
- Marks, R.; Novoa, A.; Konry, T.; Krais, R.; Cosnier, S. Indium tin oxide-coated optical fiber tips for affinity electropolymerization. Mater. Sci. Eng. C 2002, 21, 189–194. [Google Scholar] [CrossRef]
- Del Villar, I.; Hernaez, M.; Zamarreño, C.R.; Sánchez, P.; Fernández-Valdivielso, C.; Arregui, F.J.; Matias, I.R. Design rules for lossy mode resonance based sensors. Appl. Opt. 2012, 51, 4298. [Google Scholar] [CrossRef] [PubMed]
- Socorro, A.B.; Del Villar, I.; Corres, J.M.; Arregui, F.J.; Matias, I.R. Fiber-Optic Immunosensor Based on Lossy Mode Resonances Induced by Indium Tin Oxide Thin-Films. In 2016 IEEE SENSORS; IEEE: Piscataway, NJ, USA, 2016; Volume 3. [Google Scholar]
- Usha, S.P.; Gupta, B.D. Urinary P-Cresol Diagnosis Using Nanocomposite of Zno/Mos2 and Molecular Imprinted Polymer on Optical Fiber Based Lossy Mode Resonance Sensor. Biosens. Bioelectron. 2018, 101, 135–145. [Google Scholar] [CrossRef] [PubMed]
- Hernaez, M.; Del Villar, I.; Zamarreño, C.R.; Arregui, F.J.; Matías, I.R. Optical fiber refractometers based on lossy mode resonances supported by TiO_2 coatings. Appl. Opt. 2010, 49, 3980. [Google Scholar] [CrossRef] [PubMed]
- Arregui, F.J.; Del Villar, I.; Zamarreño, C.R.; Zubiate, P.; Matias, I.R. Giant sensitivity of optical fiber sensors by means of lossy mode resonance. Sens. Actuators B Chem. 2016, 232, 660–665. [Google Scholar] [CrossRef] [Green Version]
- Del Villar, I.; Zamarreño, C.R.; Sanchez, P.; Hernaez, M.; Valdivielso, C.F.; Arregui, F.J.; Matias, I.R.; Zamarreño, C. Generation of lossy mode resonances by deposition of high-refractive-index coatings on uncladded multimode optical fibers. J. Opt. 2010, 12, 95503. [Google Scholar] [CrossRef]
- Verma, R.K.; Joy, A.; Sharma, N. Vikas Performance study of surface plasmon resonance and lossy mode resonance based fiber optic sensors utilizing silver and indium oxide layers: An experimental investigation. Opt. Laser Technol. 2019, 112, 420–425. [Google Scholar] [CrossRef]
- Ozcariz, A.; Piña-Azamar, D.A.; Zamarreño, C.R.; Dominguez, R.; Arregui, F.J. Aluminum doped zinc oxide (AZO) coated optical fiber LMR refractometers—An experimental demonstration. Sens. Actuators B Chem. 2019, 281, 698–704. [Google Scholar] [CrossRef]
- Hernaez, M.; Acevedo, B.; Mayes, A.G.; Melendi-Espina, S. High-performance optical fiber humidity sensor based on lossy mode resonance using a nanostructured polyethylenimine and graphene oxide coating. Sens. Actuators B Chem. 2019, 286, 408–414. [Google Scholar] [CrossRef] [Green Version]
- Wang, Q.; Zhao, W.-M. A comprehensive review of lossy mode resonance-based fiber optic sensors. Opt. Lasers Eng. 2018, 100, 47–60. [Google Scholar] [CrossRef]
- Kosiel, K.; Koba, M.; Masiewicz, M.; Smietana, M. Tailoring properties of lossy-mode resonance optical fiber sensors with atomic layer deposition technique. Opt. Laser Technol. 2018, 102, 213–221. [Google Scholar] [CrossRef]
- Usha, S.P.; Gupta, B.D. Performance analysis of zinc oxide-implemented lossy mode resonance-based optical fiber refractive index sensor utilizing thin film/nanostructure. Appl. Opt. 2017, 56, 5716. [Google Scholar] [CrossRef] [PubMed]
- Zubiate, P.; Zamarreño, C.R.; Del Villar, I.; Matias, I.R.; Arregui, F.J. Tunable optical fiber pH sensors based on TE and TM Lossy Mode Resonances (LMRs). Sens. Actuators B Chem. 2016, 231, 484–490. [Google Scholar] [CrossRef]
- Paliwal, N.; John, J. Theoretical modeling and investigations of AZO coated LMR based fiber optic tapered tip sensor utilizing an additional TiO2 layer for sensitivity enhancement. Sens. Actuators B Chem. 2017, 238, 1–8. [Google Scholar] [CrossRef]
- Zaidi, S.A.; Shin, J.H. Recent developments in nanostructure based electrochemical glucose sensors. Talanta 2016, 149, 30–42. [Google Scholar] [CrossRef] [PubMed]
- He, F.; Tang, Y.; Yu, M.; Wang, S.; Li, Y.; Zhu, D. Fluorescence-Amplifying Detection of Hydrogen Peroxide with Cationic Conjugated Polymers, and Its Application to Glucose Sensing. Adv. Funct. Mater. 2006, 16, 91–94. [Google Scholar] [CrossRef]
- Lidiya, A.E.; Raja, R.V.J.; Pham, V.D.; Ngo, Q.M.; Vigneswaran, D. Detecting hemoglobin content blood glucose using surface plasmon resonance in D-shaped photonic crystal fiber. Opt. Fiber Technol. 2019, 50, 132–138. [Google Scholar] [CrossRef]
- Yuan, H.; Ji, W.; Chu, S.; Qian, S.; Wang, F.; Masson, J.-F.; Han, X.; Peng, W. Fiber-optic surface plasmon resonance glucose sensor enhanced with phenylboronic acid modified Au nanoparticles. Biosens. Bioelectron. 2018, 117, 637–643. [Google Scholar] [CrossRef]
- Singh, S.; Gupta, B.D. Fabrication and characterization of a surface plasmon resonance based fiber optic sensor using gel entrapment technique for the detection of low glucose concentration. Sens. Actuators B Chem. 2013, 177, 589–595. [Google Scholar] [CrossRef]
- Del Villar, I.; Zamarreño, C.; Hernaez, M.; Sanchez, P.; Arregui, F.J.; Matias, I.R. Generation of Surface Plasmon Resonance and Lossy Mode Resonance by thermal treatment of ITO thin-films. Opt. Laser Technol. 2015, 69, 1–7. [Google Scholar] [CrossRef] [Green Version]
- Özmen, M.; Can, K.; Ersoz, M. Immobilization of albumin on indium-tin oxide (ITO) surface via isocyanate linkage. J. Electroanal. Chem. 2009, 633, 228–234. [Google Scholar] [CrossRef]
- Zubiate, P.; Zamarreño, C.R.; Del Villar, I.; Matias, I.R.; Arregui, F. High sensitive refractometers based on lossy mode resonances (LMRs) supported by ITO coated D-shaped optical fibers. Opt. Express 2015, 23, 8045–8050. [Google Scholar] [CrossRef] [PubMed] [Green Version]
- Liu, J.-T.; Chen, L.-Y.; Shih, M.-C.; Chang, Y.; Chen, W.-Y. The investigation of recognition interaction between phenylboronate monolayer and glycated hemoglobin using surface plasmon resonance. Anal. Biochem. 2008, 375, 90–96. [Google Scholar] [CrossRef] [PubMed]
Figure 1.
Three-layer structure for lossy mode resonance-based optical planar waveguide (LMROPW) sensor.
Figure 1.
Three-layer structure for lossy mode resonance-based optical planar waveguide (LMROPW) sensor.

Figure 2.
Dynamic dielectric constant dispersion curves of indium tin oxide (ITO) and silicon dioxide (SiO2).
Figure 2.
Dynamic dielectric constant dispersion curves of indium tin oxide (ITO) and silicon dioxide (SiO2).

Figure 3.
Surface modification for glucose immobilization.

Figure 4.
Measurement setup of the LMROPW sensor held with the alignment platform.

Figure 5.
Spectral response of the LMR excitation ratio with the bared LMROPW for the concentration of the glucose solution from 0% to 50%.
Figure 5.
Spectral response of the LMR excitation ratio with the bared LMROPW for the concentration of the glucose solution from 0% to 50%.

Figure 6.
Lossy mode resonance (LMR) wavelength compared to the refractive index (RI) of the glucose solution and sensitivity.
Figure 6.
Lossy mode resonance (LMR) wavelength compared to the refractive index (RI) of the glucose solution and sensitivity.

Figure 7.
Statistics diagram of the LMR wavelength for four-status surface modification.

Figure 8.
Time courses of the LMR wavelength variation for (a) 1% glucose solution and (b) 10% glucose solution dropped on the bared LMROPW sensor and on the boronic LMROPW sensor.
Figure 8.
Time courses of the LMR wavelength variation for (a) 1% glucose solution and (b) 10% glucose solution dropped on the bared LMROPW sensor and on the boronic LMROPW sensor.

© 2019 by the authors. Licensee MDPI, Basel, Switzerland. This article is an open access article distributed under the terms and conditions of the Creative Commons Attribution (CC BY) license (http://creativecommons.org/licenses/by/4.0/).
Share and Cite
MDPI and ACS Style
Lin, Y.-C.; Chen, L.-Y.; Chiu, F.-C. Lossy Mode Resonance-Based Glucose Sensor with High-κ Dielectric Film. Crystals 2019, 9, 450. https://doi.org/10.3390/cryst9090450
AMA Style
Lin Y-C, Chen L-Y, Chiu F-C. Lossy Mode Resonance-Based Glucose Sensor with High-κ Dielectric Film. Crystals. 2019; 9(9):450. https://doi.org/10.3390/cryst9090450
Chicago/Turabian StyleLin, Yu-Cheng, Liang-Yu Chen, and Fu-Chien Chiu. 2019. "Lossy Mode Resonance-Based Glucose Sensor with High-κ Dielectric Film" Crystals 9, no. 9: 450. https://doi.org/10.3390/cryst9090450
Note that from the first issue of 2016, this journal uses article numbers instead of page numbers. See further details here.