Comparison of the Mesomorphic Behaviour of 1:1 and 1:2 Mixtures of Charged Gay-Berne GB(4.4,20.0,1,1) and Lennard-Jones Particles


1
Department of Chemical Sciences of the University of Padova, via Marzolo, 1, I-35131 Padova, Italy
2
Department of Chemistry, Osaka Sangyo University, Daito, Osaka 574-8530, Japan
3
CNR Institute on Membrane Technology, Unit of Padova, via Marzolo, 1, I-35131 Padova, Italy
*
Authors to whom correspondence should be addressed.
Crystals 2018, 8(10), 371; https://doi.org/10.3390/cryst8100371
Submission received: 1 September 2018
/
Revised: 18 September 2018
/
Accepted: 19 September 2018
/
Published: 20 September 2018
(This article belongs to the Special Issue Ionic Liquid Crystals)
Abstract
:We present a Molecular Dynamics study of mixtures of charged Gay-Berne (GB) ellipsoids and spherical Lennard-Jones (LJ) particles as models of ionic liquids and ionic liquid crystals. The GB system is highly anisotropic (GB(4.4,20.0,1,1)) and we observe a rich mesomorphism, with ionic nematic and smectic phases in addition to the isotropic mixed phase and crystalline phases with honeycomb structure. The systems have been investigated by analyzing the orientational and translational order parameters, as well as radial distribution functions. We have directly compared 1:1 mixtures, where the GB and LJ particles have a charge equal in magnitude and opposite in sign, and 1:2 mixtures where the number of LJ particles is twice as large compared to the GB and their charge half in magnitude. The results highlight the role of the long-range isotropic electrostatic interaction compared to the short-range van der Waals anisotropic contribution, and the effect of the stoichiometry on the stability of ionic mesophases.
1. Introduction
Ionic liquid crystals (ILC) are interesting materials composed of ions, as are their analogues ionic liquids (IL), and exhibiting thermotropic mesomorphism as non-ionic liquid crystals (LC). A comprehensive review on this subject has been published [1] where the synthesis and technological applications of ILCs have been thoroughly discussed. ILCs are normally composed by organic nitrogen cations, like imidazolium [2], pyridinium [3,4], bipyridinium (also known as viologens) [5,6,7,8], guanidinium [9,10,11,12], pyrrolidinium [13], to mention the most common ones, and inorganic anions like halides, tetrafluoroborate, hexafluorophosphate, bis(trifluoromethanesulfonyl)imide (also known as bistriflimide, or Tf2N−). A remarkable feature of ILCs is that almost all known compounds exhibit a smectic A, or even a more ordered-like smectic B and T, type of LC phase. Very few examples of an ionic nematic phase have been reported in the literature [14,15,16]. The reason of this behavior can be traced back to the structure of the cations: this is usually formed by a charged moiety and a relatively long alkyl chain and these two parts tend to micro-segregate, therefore promoting the formation of layered, that is smectic, phases instead of isotropic phases. In fact, such micro-segregation is well-known also to affect the structure of the isotropic phase of ILs [17]: Systems with relatively short alkyl chains do not form ILC phases, nonetheless a non-homogeneous structure of the isotropic phase of the IL has been observed first from MD simulations [18,19,20] and later confirmed experimentally [21]. A detailed discussion about the structure and properties of ILs can be found in the literature [22]. The relationship between the micro-segregation in the isotropic phase of ILs and the emergence of ionic LC phases has been the subject of both theoretical [23], computational [24,25] and experimental works [26,27,28]. In particular, Nelyubina et al. [29] found a correlation between the ratio of cation/anion volumes and the minimum chain length of 1-alky-3-methylimidazolium salts for which an ionic LC phase is observed: the larger the anion, the longer the alkyl chain needs to be in order for the compound to exhibit an ILC phase. However, one of the main issues related to ILC structure, that is the lack of a stable, and with a wide temperature range of existence, ionic nematic phase, is still an open question. Interestingly, in [1] the authors also stressed the lack of systematic computational and theoretical investigations of ILCs that would help to establish a set of structure-properties relationships in order to guide the synthesis of compounds potentially able to display an ionic nematic phase. Recent fully atomistic simulations have been focused on the popular methylimidazolium salts [30,31].
In this article we are continuing our investigation of the phase diagram of mixtures of charged ellipsoidal Gay-Berne (GB) particles and spherical Lennard-Jones (LJ) particles as models of ILCs. A preliminary account concerning 1:1 mixtures of particles with opposite charges, +q* (the asterisk indicates scaled quantities, see below) for the GB and −q* for the LJ, and using the parameterization of the GB particles proposed by Bates and Luckhurst [32], was reported recently [33]. A more extensive investigation of the phase diagram of 1:1 mixtures using the GB parameterization of Berardi et al. has been also published [34]. Here, for the first time, we will compare the results obtained for 1:1 mixtures and 1:2 mixtures (still using the parameterization of Bates and Luckhurst), that is systems where the GB particles bear a positive +2q* charge while the LJ particles, twice in number, bear a charge of −q*. Hereafter, the systems will be identified simply by the value of q* and the stoichiometry of the mixture. By keeping all other interaction parameters fixed, we will compare three different packing fractions (η* = 0.371, η* = 0.428 and η* = 0.514) thus highlighting and singling out which is the effect of the stoichiometry on the stability of ionic liquid crystal phases.
2. Materials and Methods
Simulations were run with the LAMMPS software (version 28/09/2016) package [35]. We used cubic boxes with periodic boundary conditions in the NVT (constant number of particles, volume and temperature) ensemble with 5488 particles (2744 GB and 2744 LJ) for the 1:1 mixtures and 5184 particles (1728 GB and 3456 LJ) for the 1:2 mixtures. We tested the box size effect by running a set of simulations for the 1:1 system at a packing fraction of 0.514 (one of the packing fractions studied, see below) and no charge with a box of 10,832 particles and the results of the energy vs scaled temperature showed negligible differences with the system of 5488 particles. Moreover, box size effects were also extensively tested in [34] and we observed negligible effects for a number of particles larger than 4000. At least 500,000 time steps have been used for equilibration, followed by 500,000 time steps of production runs; longer equilibration were run close to the transition points.
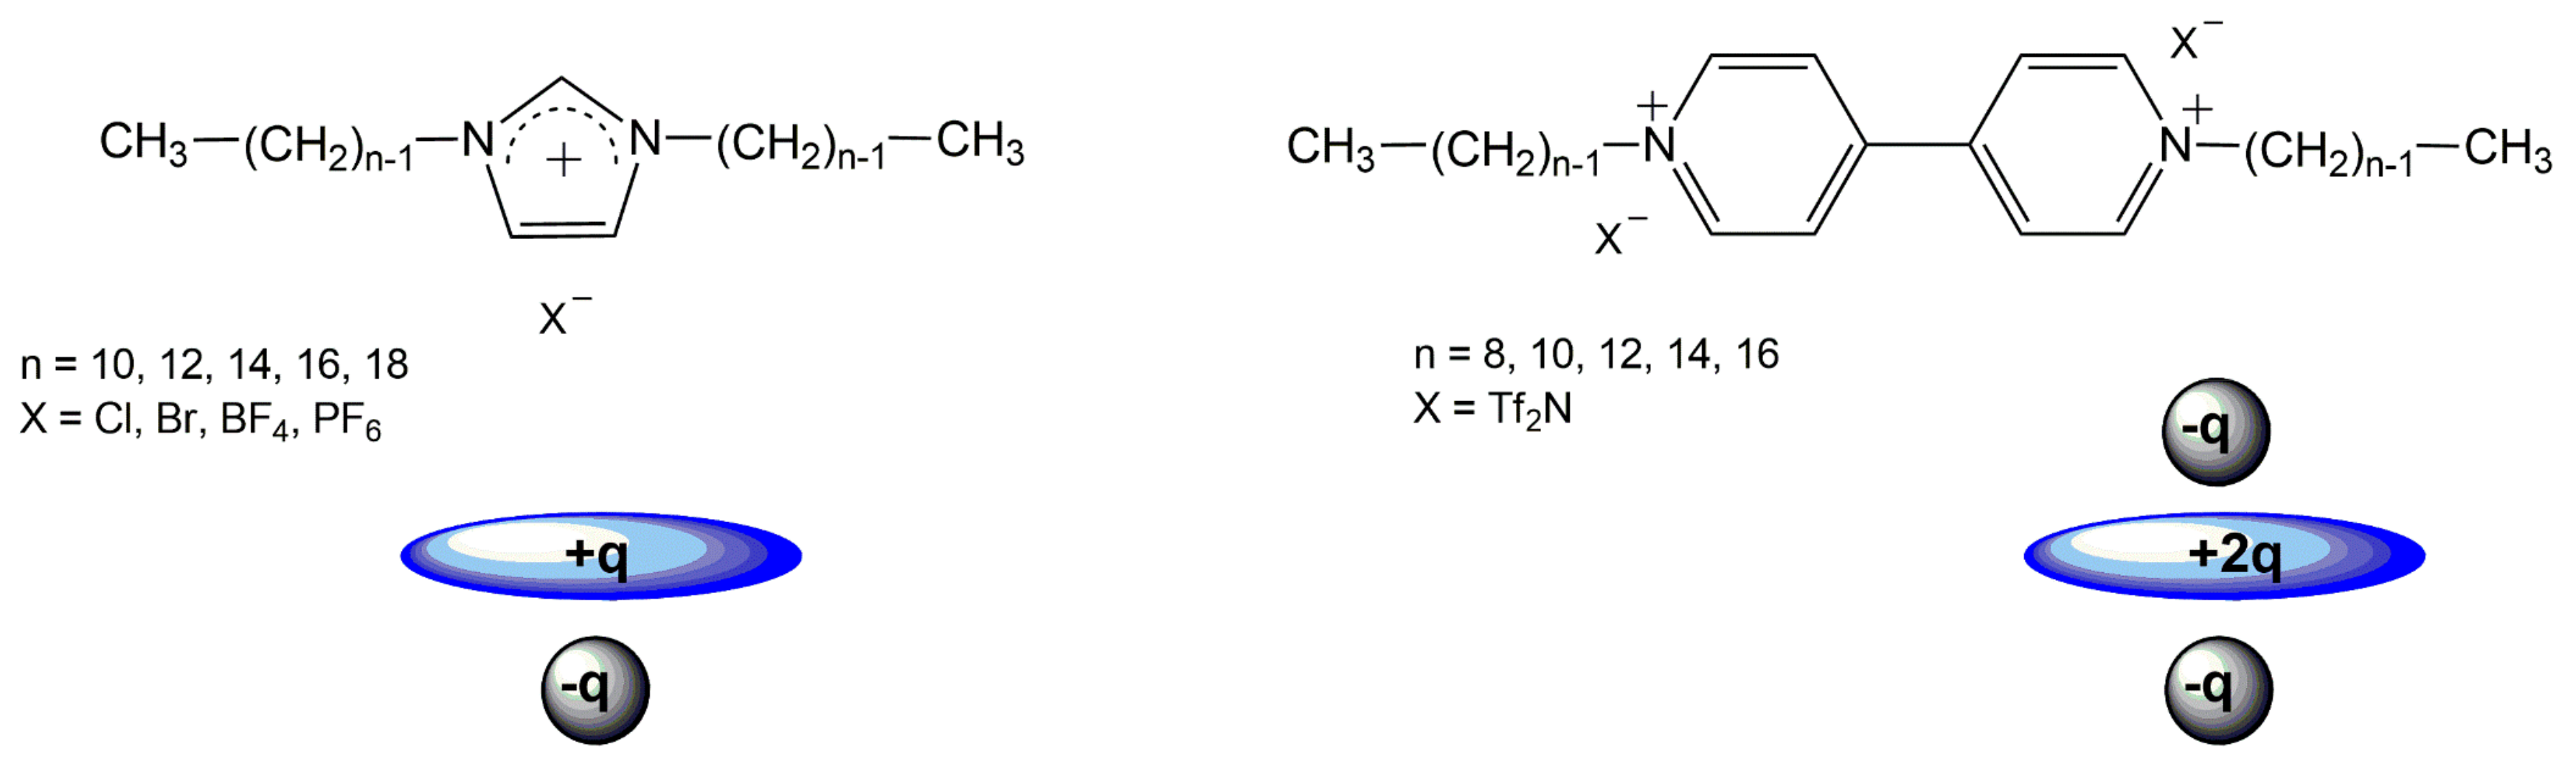
The type of Gay-Berne potential selected for our simulations is that one proposed by Bates and Luckhurst [32]. This choice is dictated by the fact that such parameterization, compared to the parameterization of Berardi et al. [41], has a larger length to breadth ratio (4.4 instead of 3) and a larger side-by-side to end-to-end ratio of the interaction potential (20.0 instead of 5.0). For these reasons we expect it to be closer to very elongated molecules, such as the imidazolium and especially the viologens in Figure 1, with alkyl chains of several carbon atoms. It is worth mentioning that the relatively long and flexible alkyl chains of the real systems are not included in the model potential; however, this limitation is the same as encountered when the pure GB potential is used as a model to describe non-ionic liquid crystals, for example cyanobiphenyls, that very often have an alkyl chain of several carbon atoms. Nonetheless, the lack of alkyl chains in the GB potential has not limited its application to the study of LCs. The GB potential is shown in Equation (1): it is essentially a Lennard-Jones potential with a constant distance and well depth between the particles that depends on the relative orientations of the two ellipsoids, ui and uj, and the orientation of the vector connecting their center of mass, rij [42].
The parameters σ0 and ε0 are used to scale the distance and the energy, respectively, for all interactions, which are the GB-GB, the LJ-LJ and the mixed GB-LJ interactions. The LJ potential used for the sphere interaction, in fact, can be seen as the spherical limit of the GB potential in Equation (1) that can be obtained by setting ε(ui,uj,rij) = 1 and σ0(ui,uj,rij) = σ0. The mixed potential is based on the interaction potential between two biaxial particles as implemented in the software package LAMMPS [35] based on the theoretical derivation of [43,44]. Since we are interested in understanding the effect of the stoichiometry on the stability of ionic mesophases we keep all other interaction parameters fixed (except the charge). Throughout the manuscript we will make use of scaled quantities, defined with respect to the distance and interaction scaling parameters of the GB potential as follows:
The two initial boxes were prepared as follows: the initial 1:1 box was obtained by first creating a unit cell of size r* = 5 containing an ion pair (one GB and one LJ particles) manually placed inside at random position and orientation, avoiding overlap; then the unit cell was replicated 14 times along x, y and z direction of the box, thus 14 × 14 × 14 = 2744 ion pairs = 5488 particles. For the initial 1:2 box the same unit cell was filled with one GB and two LJ particles and then replicated 12 times along x, y and z, thus 12 × 12 × 12 = 1728 ion triplets = 5184 particles. The boxes were first equilibrated for 1000 t-steps at this very low density and T* = 8.0 to completely randomize positions and orientations, then the box size and particle positions were rescaled at the desired packing fraction at the same relatively high temperature of T* = 8.0. The obtained configurations were used as starting points for the cooling runs where the box at each temperature was equilibrated starting from the box obtained at the previous run at higher temperature. Cooling runs were then followed by heating runs to check for possible hysteresis.
Electrostatic interactions were handled using the particle-particle particle-mesh solver [45] setting a precision of 10−6 on the calculated forces. The cut-off for the short-range interaction was set to 10 scaled units and the temperature was controlled by a Nose-Hoover thermostat [46].
The results of the MD simulations will be analyzed by calculating the orientational order parameter of the GB particles, , where the brackets indicate an ensemble average over the GB particles only. θ is the angle between the director of the phase and the long axis of the GB particle. In addition to the orientational order, we also calculate the translational order parameter as , where d* is the scaled layer thickness of the smectic phase. The calculation of follows the procedure of [32]. In the evaluation of 〈τ〉 we considered an average value among the 10 last configurations of the cooling run. In the snapshots, obtained with the software package QMGA [47], GB particles are colour-coded based on the orientation with respect to the director.
3. Results
We will present a direct comparison of the phase behavior of the two mixtures, with 1:1 and 1:2 stoichiometry. In order to correctly compare the systems, we set the scaled packing fraction, η*, to the same value, thus the number densities differ, as indicated in Table 1.
3.1. Comparison of 1:1 and 1:2 Stoichiometry for a Packing Fraction 0.371
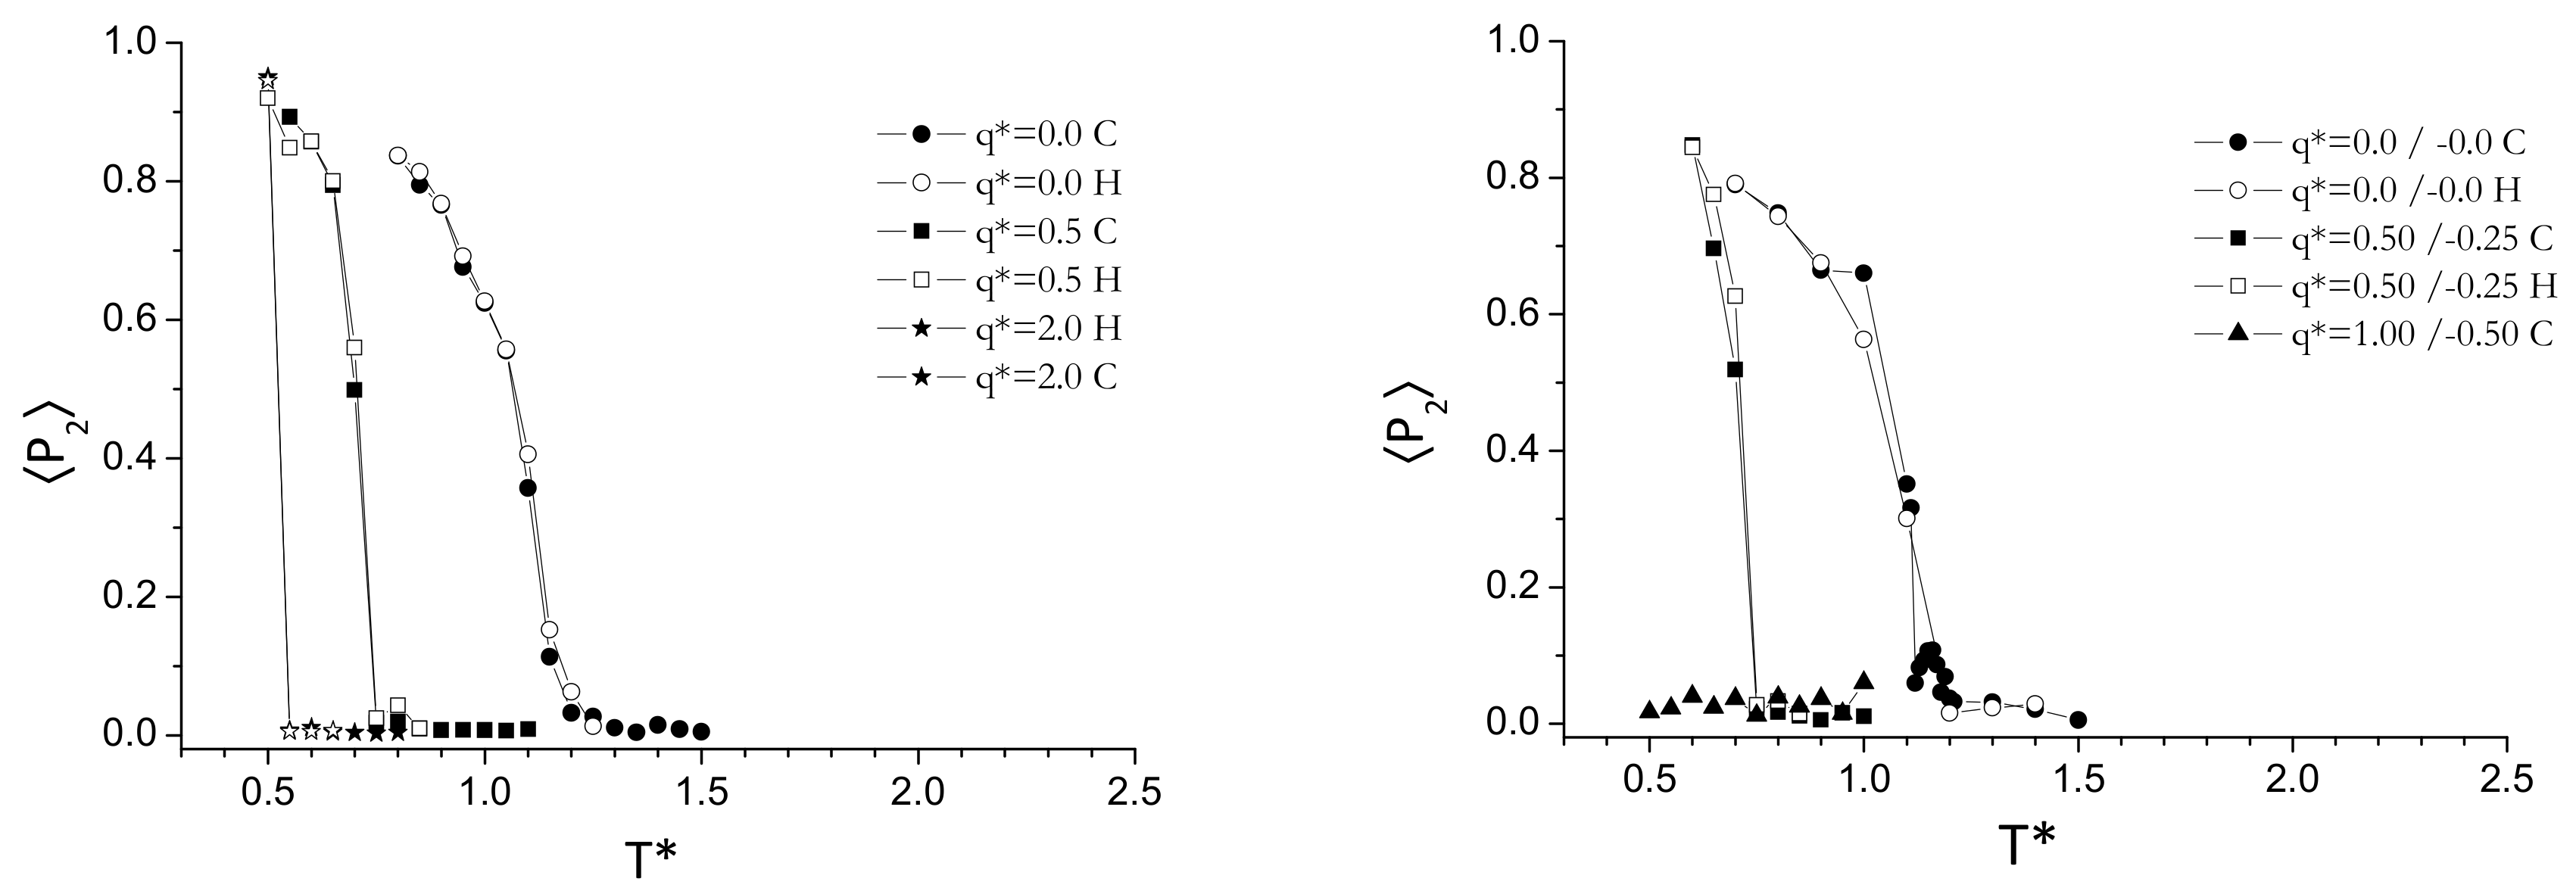
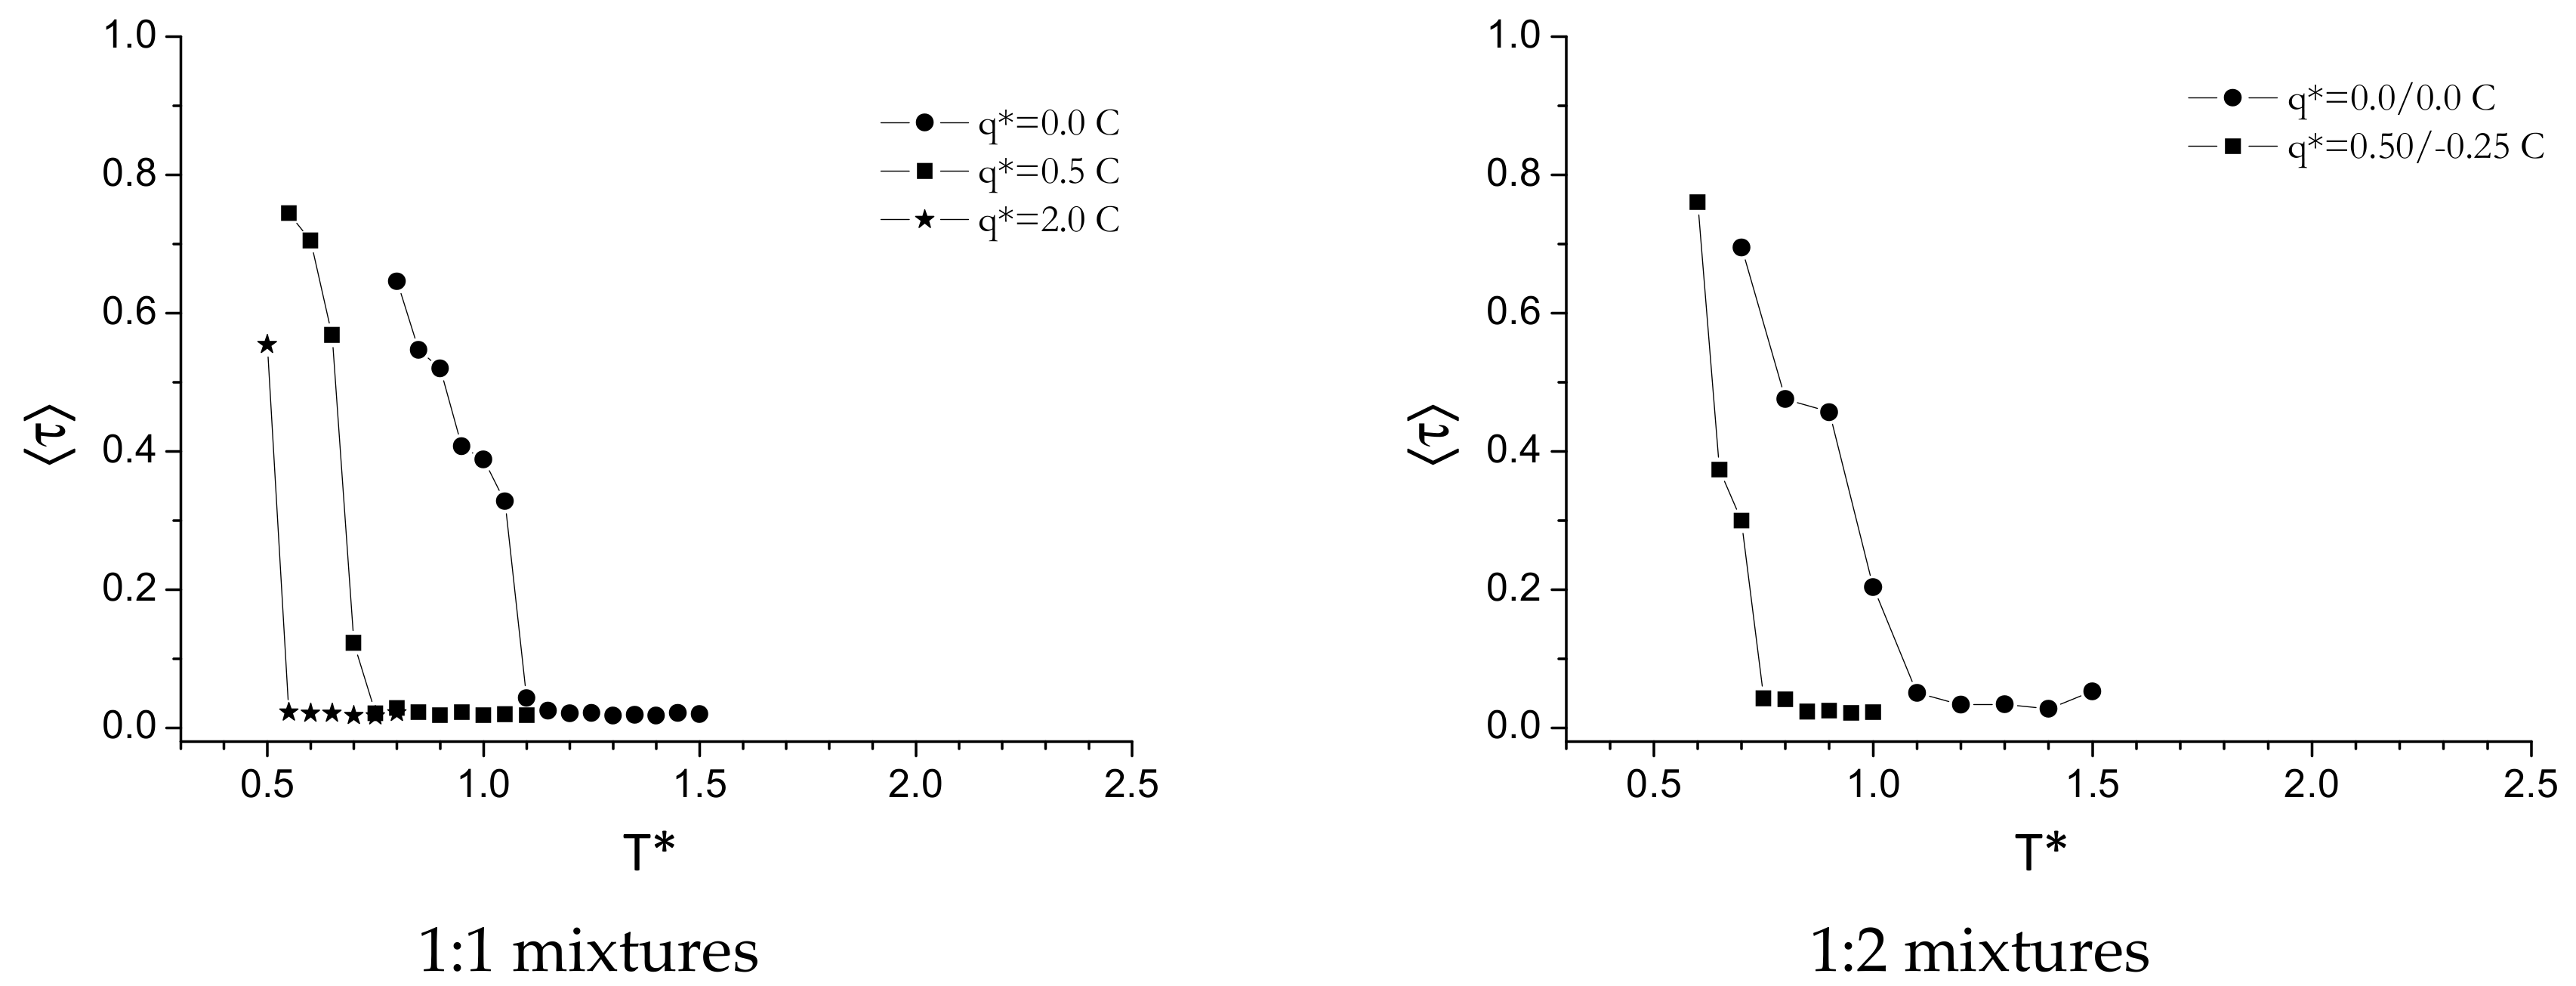
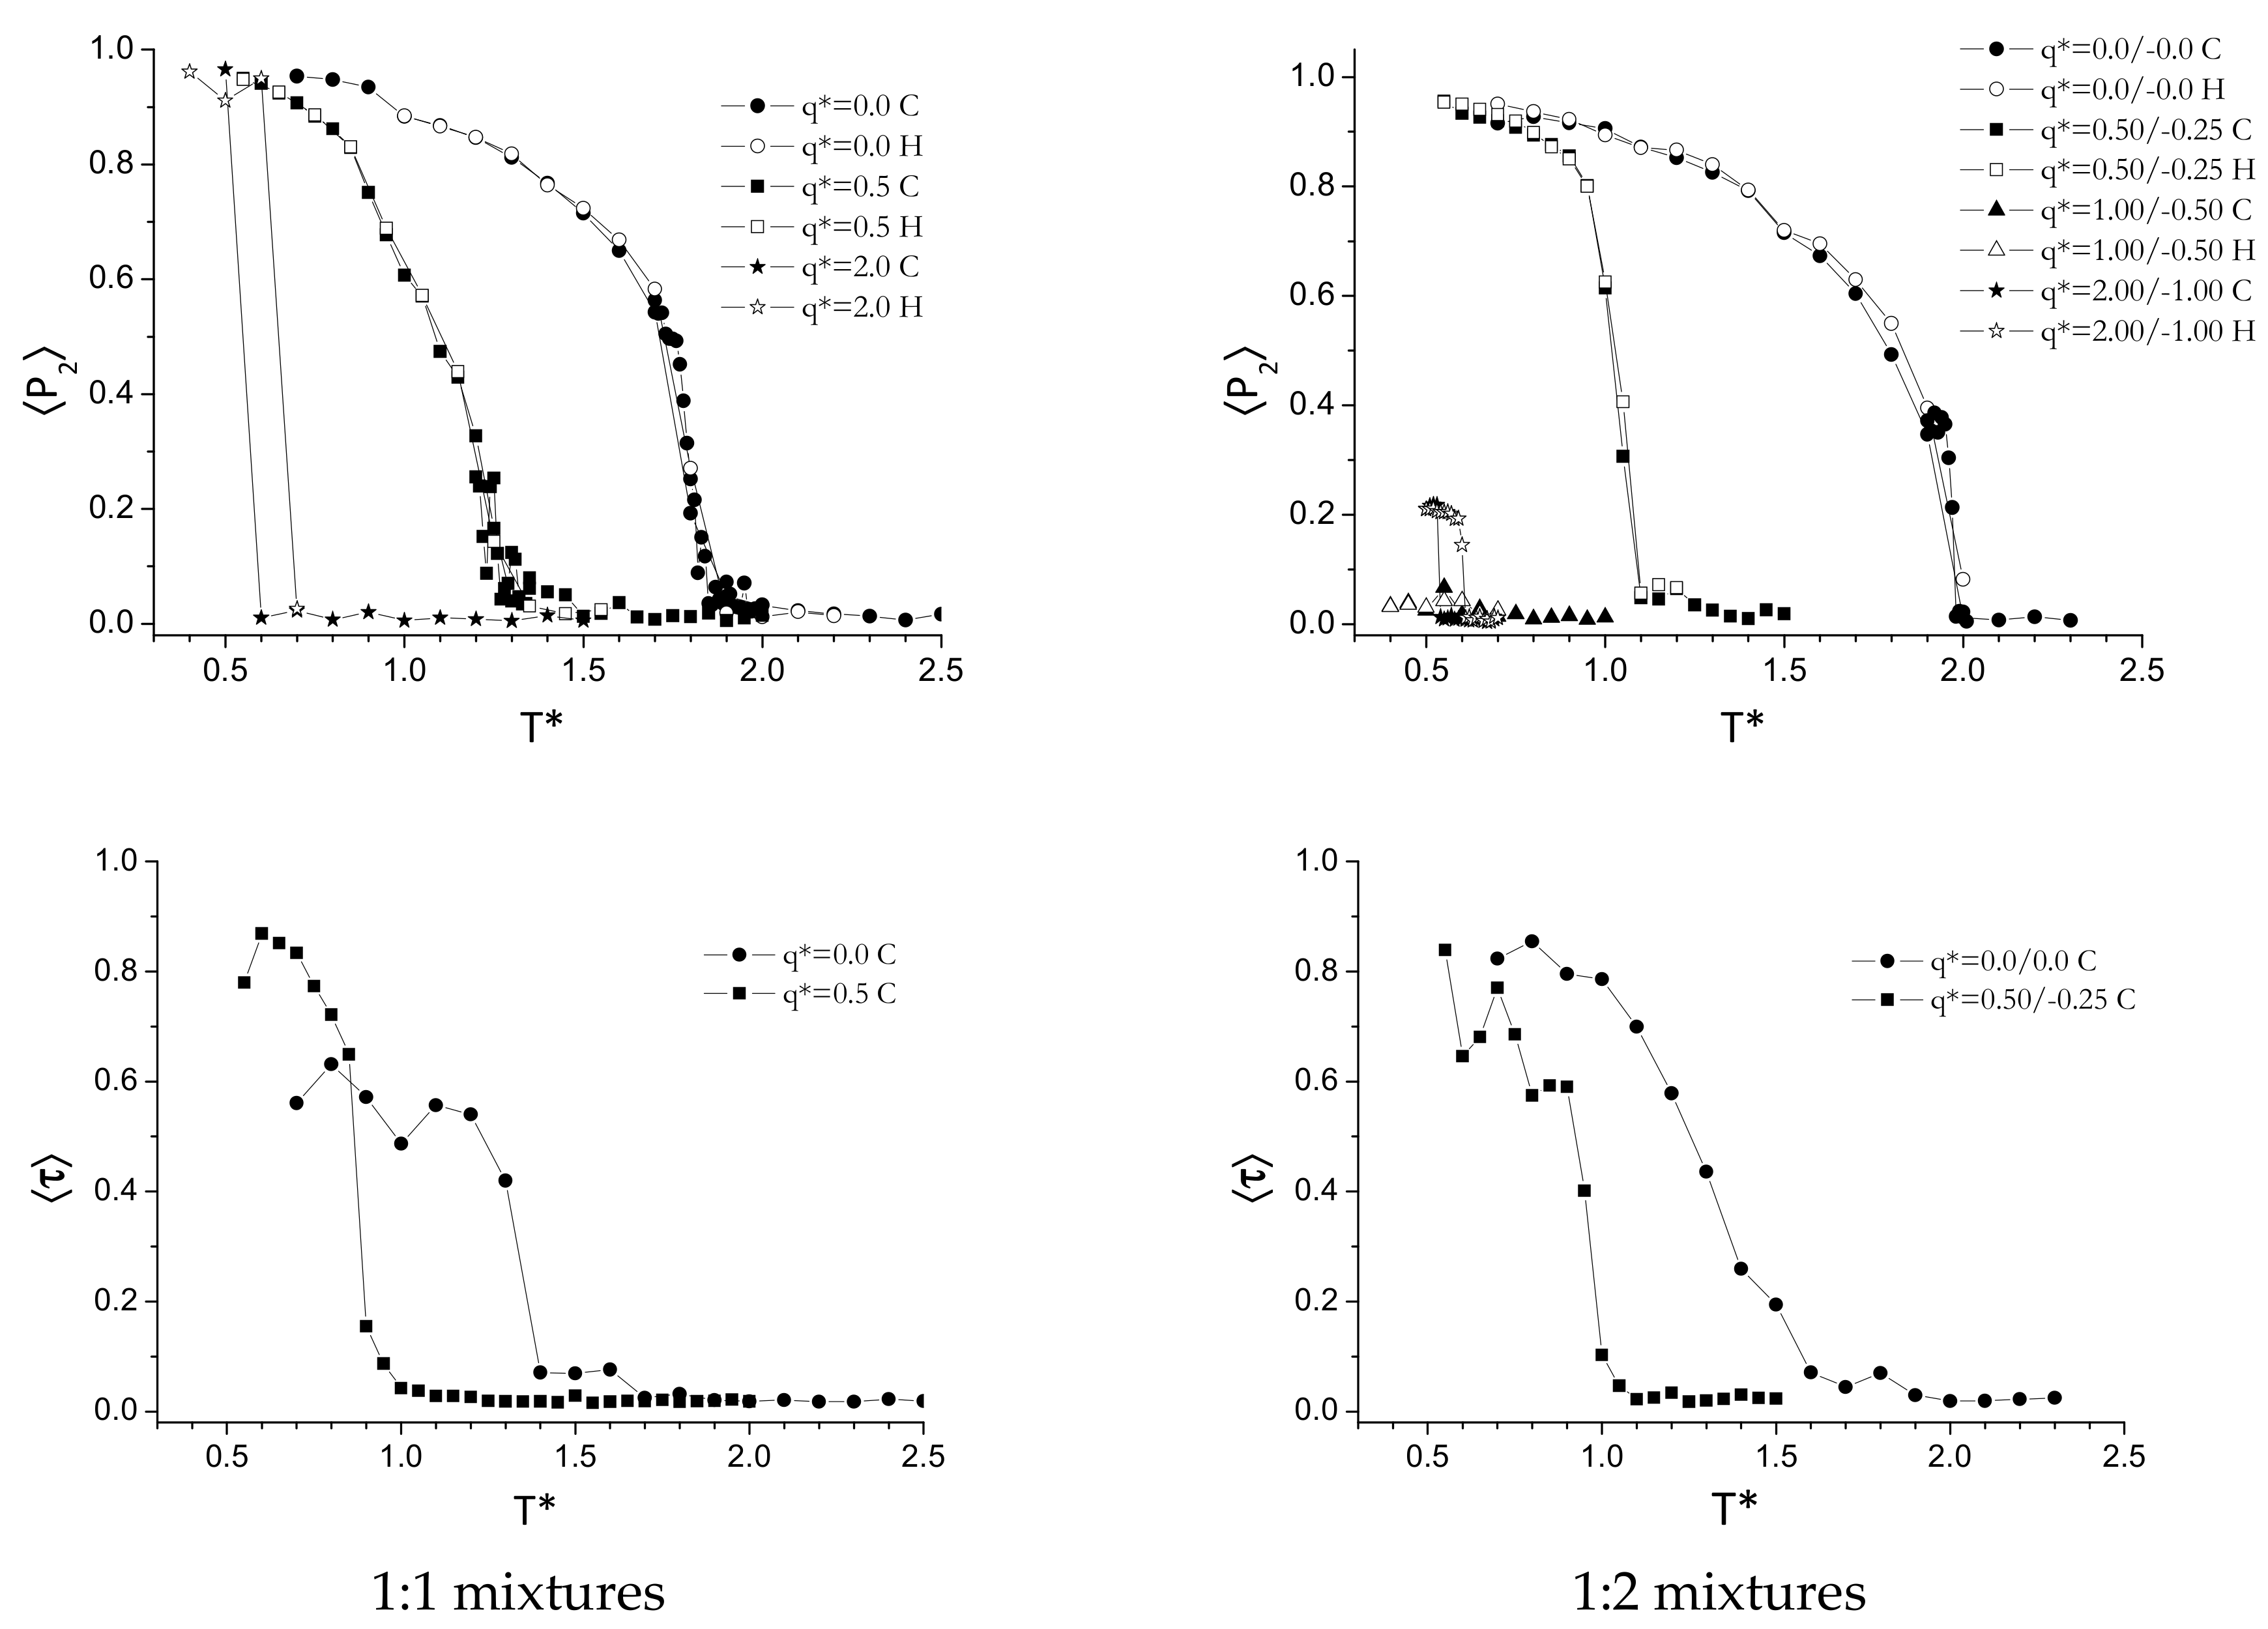
In Figure 2 we report the dependence of the orientational order parameter 〈P2〉 and the translational order parameter 〈τ〉 on the scaled temperature T* for systems with different scaled charges q*. We recall here that a given value of q* means charges of +q* and −q* for GB and LJ, respectively, for the 1:1 mixture; while it means +2q* and −q* for GB and LJ, respectively, for the 1:2 mixture. Thus, for clarity, we will use, hereafter, the explicit indication of both charges for the GB:LJ mixtures, as qGB*/−qLJ*. So, for example, a value of q* = 1.00/−0.50 would indicate a 1:2 GB:LJ mixture with qGB* = +1.00 and qLJ* = −0.50; while a notation of q* = 0.50/−0.50 would represent a 1:1 mixture with qGB* = +0.50 and qLJ* = −0.50.
For the non-charged systems, q* = 0.0/0.0, we observe a similar behavior for both stoichiometries: there is a discontinuity in the orientational order parameter are at T* = 1.15 and T* = 1.10 for the 1:1 and 1:2 mixtures, respectively, while the translational order parameter remains zero until the temperature is lowered down to T* = 1.05 and T* = 1.00, for the 1:1 and 1:2 mixtures, respectively. Therefore, we can conclude that a narrow range of ionic nematic phase is present, with a temperature range of about 0.1 scaled unit, and a thermal range slightly at lower temperature for the 1:2 stoichiometry. Then, below T* = 1.05 and T* = 1.00, a smectic phase is formed.
However, as we can expect for a mixture of non-charged particles of very different shape, a phase separation occurs. This phenomenon has been studied by several authors, e.g., for mixtures of hard rod-core particles [48] and soft and non-charged GB/LJ mixtures [49]. The observed phase separation can be traced back to entropy effects related with the excluded volume and is generally stronger the more the particle’s shapes and volumes differ.
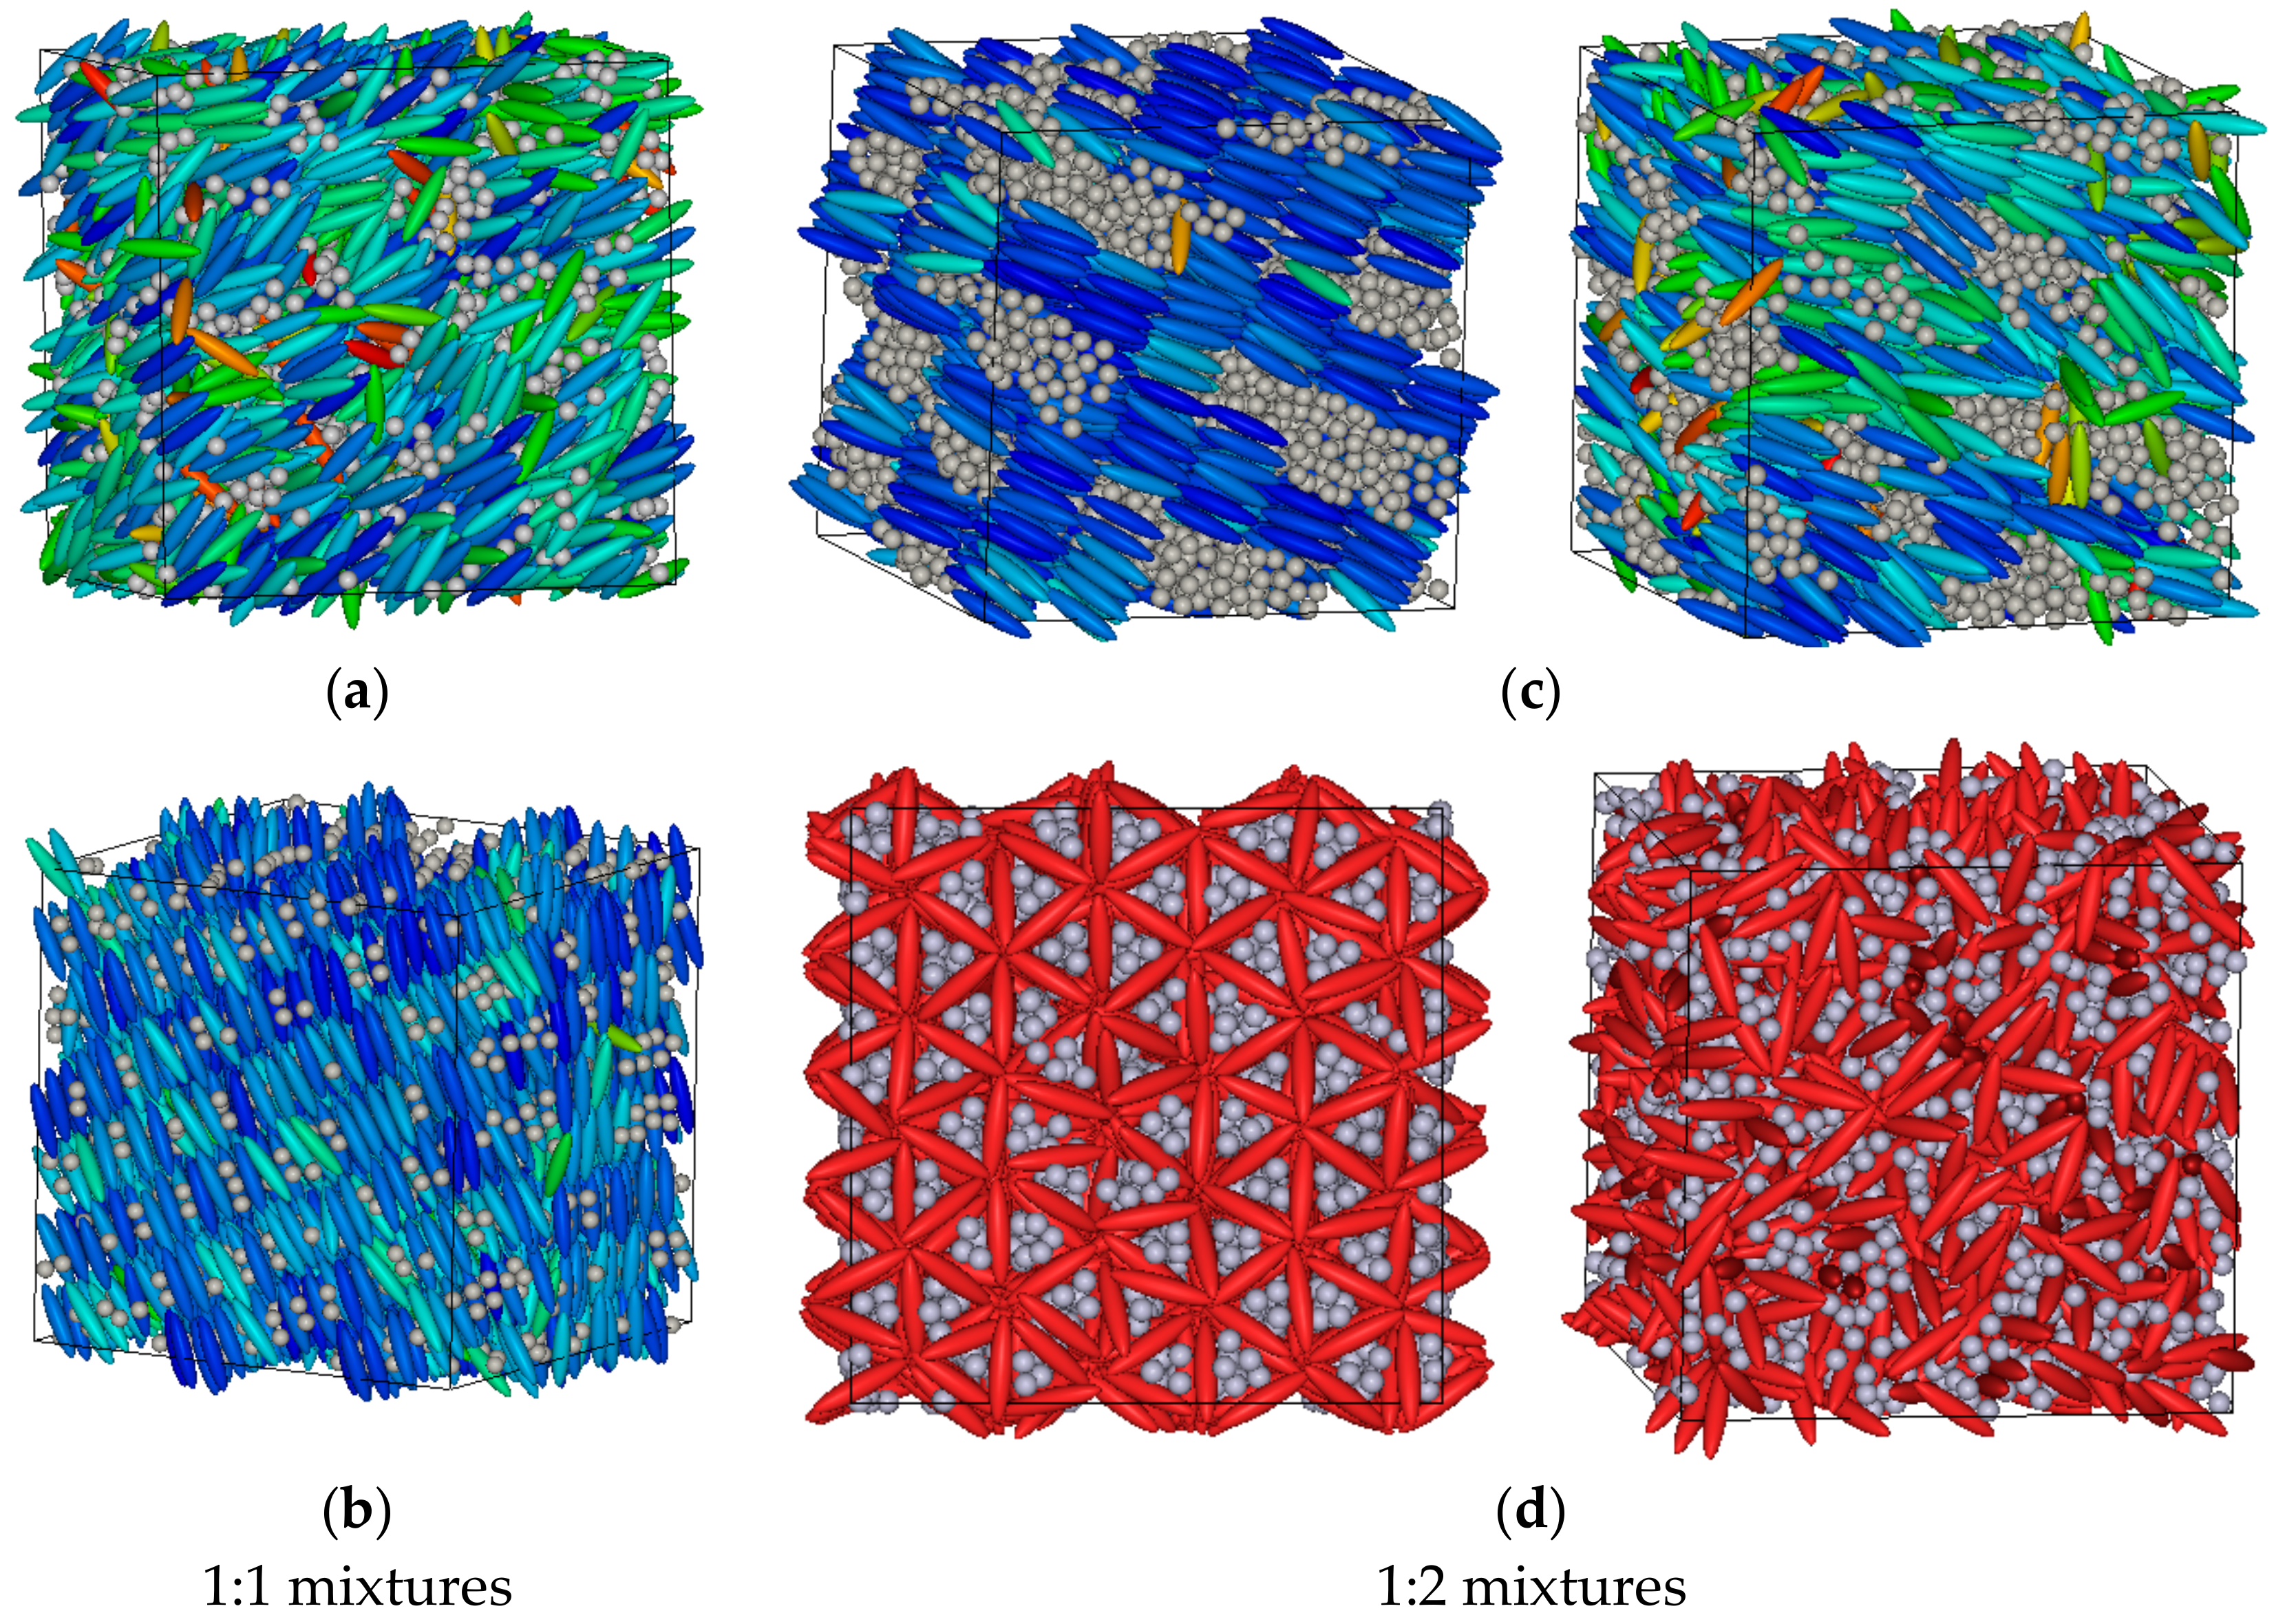
Such phase separation can be clearly seen in the snapshots reported in Figure 3. Interestingly, for the 1:2 mixture, the phase separation occurs before the transition of the GB particles into a LC phase, see Figure 3c, left snapshot.
A more interesting phase behavior is observed once the charge is switched on. First, we observe a general decrease of the phase-transition temperatures, and the larger the charge the lower is the temperature where the isotropic mixed state undergoes a transition to a more ordered phase. For a charge q* = 0.50/−0.50 (1:1) and q* = 0.50/−0.25 (1:2) the transition from isotropic to a LC phase with an incipient smectic ordering (since 〈τ〉 = 0.1) is at about T* = 0.70, in both cases (1:1 and 1:2 mixtures), with an overall increase of the stability of the isotropic mixed phase of about ΔT* = 0.40, with respect of the non-charge case. Inspection of the values of 〈P2〉 and 〈τ〉 reveals that at the first point, on cooling the temperature, where 〈P2〉 ≠ 0 we also have 〈τ〉 ≠ 0, meaning that the phase formed is of smectic type and a nematic phase may exist only in a temperature range smaller than 0.05, the step in the temperature used during the heating and cooling runs. Snapshots of the simulations boxes can be seen in Figure 3.
For a charge q* = 1.0/−1.0 (1:1) we observe again a single transition from the isotropic mixed phase to the smectic phase for the 1:1 stoichiometry. The transition temperature is now much lower, at T* = 0.50; in contrast the 1:2 stoichiometric mixture does not exhibit any mesophase for q* = 2.0/−1.0 (1:2) and the system remains isotropic and mixed until the lowest temperature investigated, that is T* = 0.50, where a transition to a highly ordered smectic phase is observed. Therefore, increasing the charge leads to a destabilization of the ionic LC phases, as already observed for a different GB/LJ system with a 1:1 stoichiometry [34].
3.2. Comparison of 1:1 and 1:2 Stoichiometry for a Packing Fraction 0.428
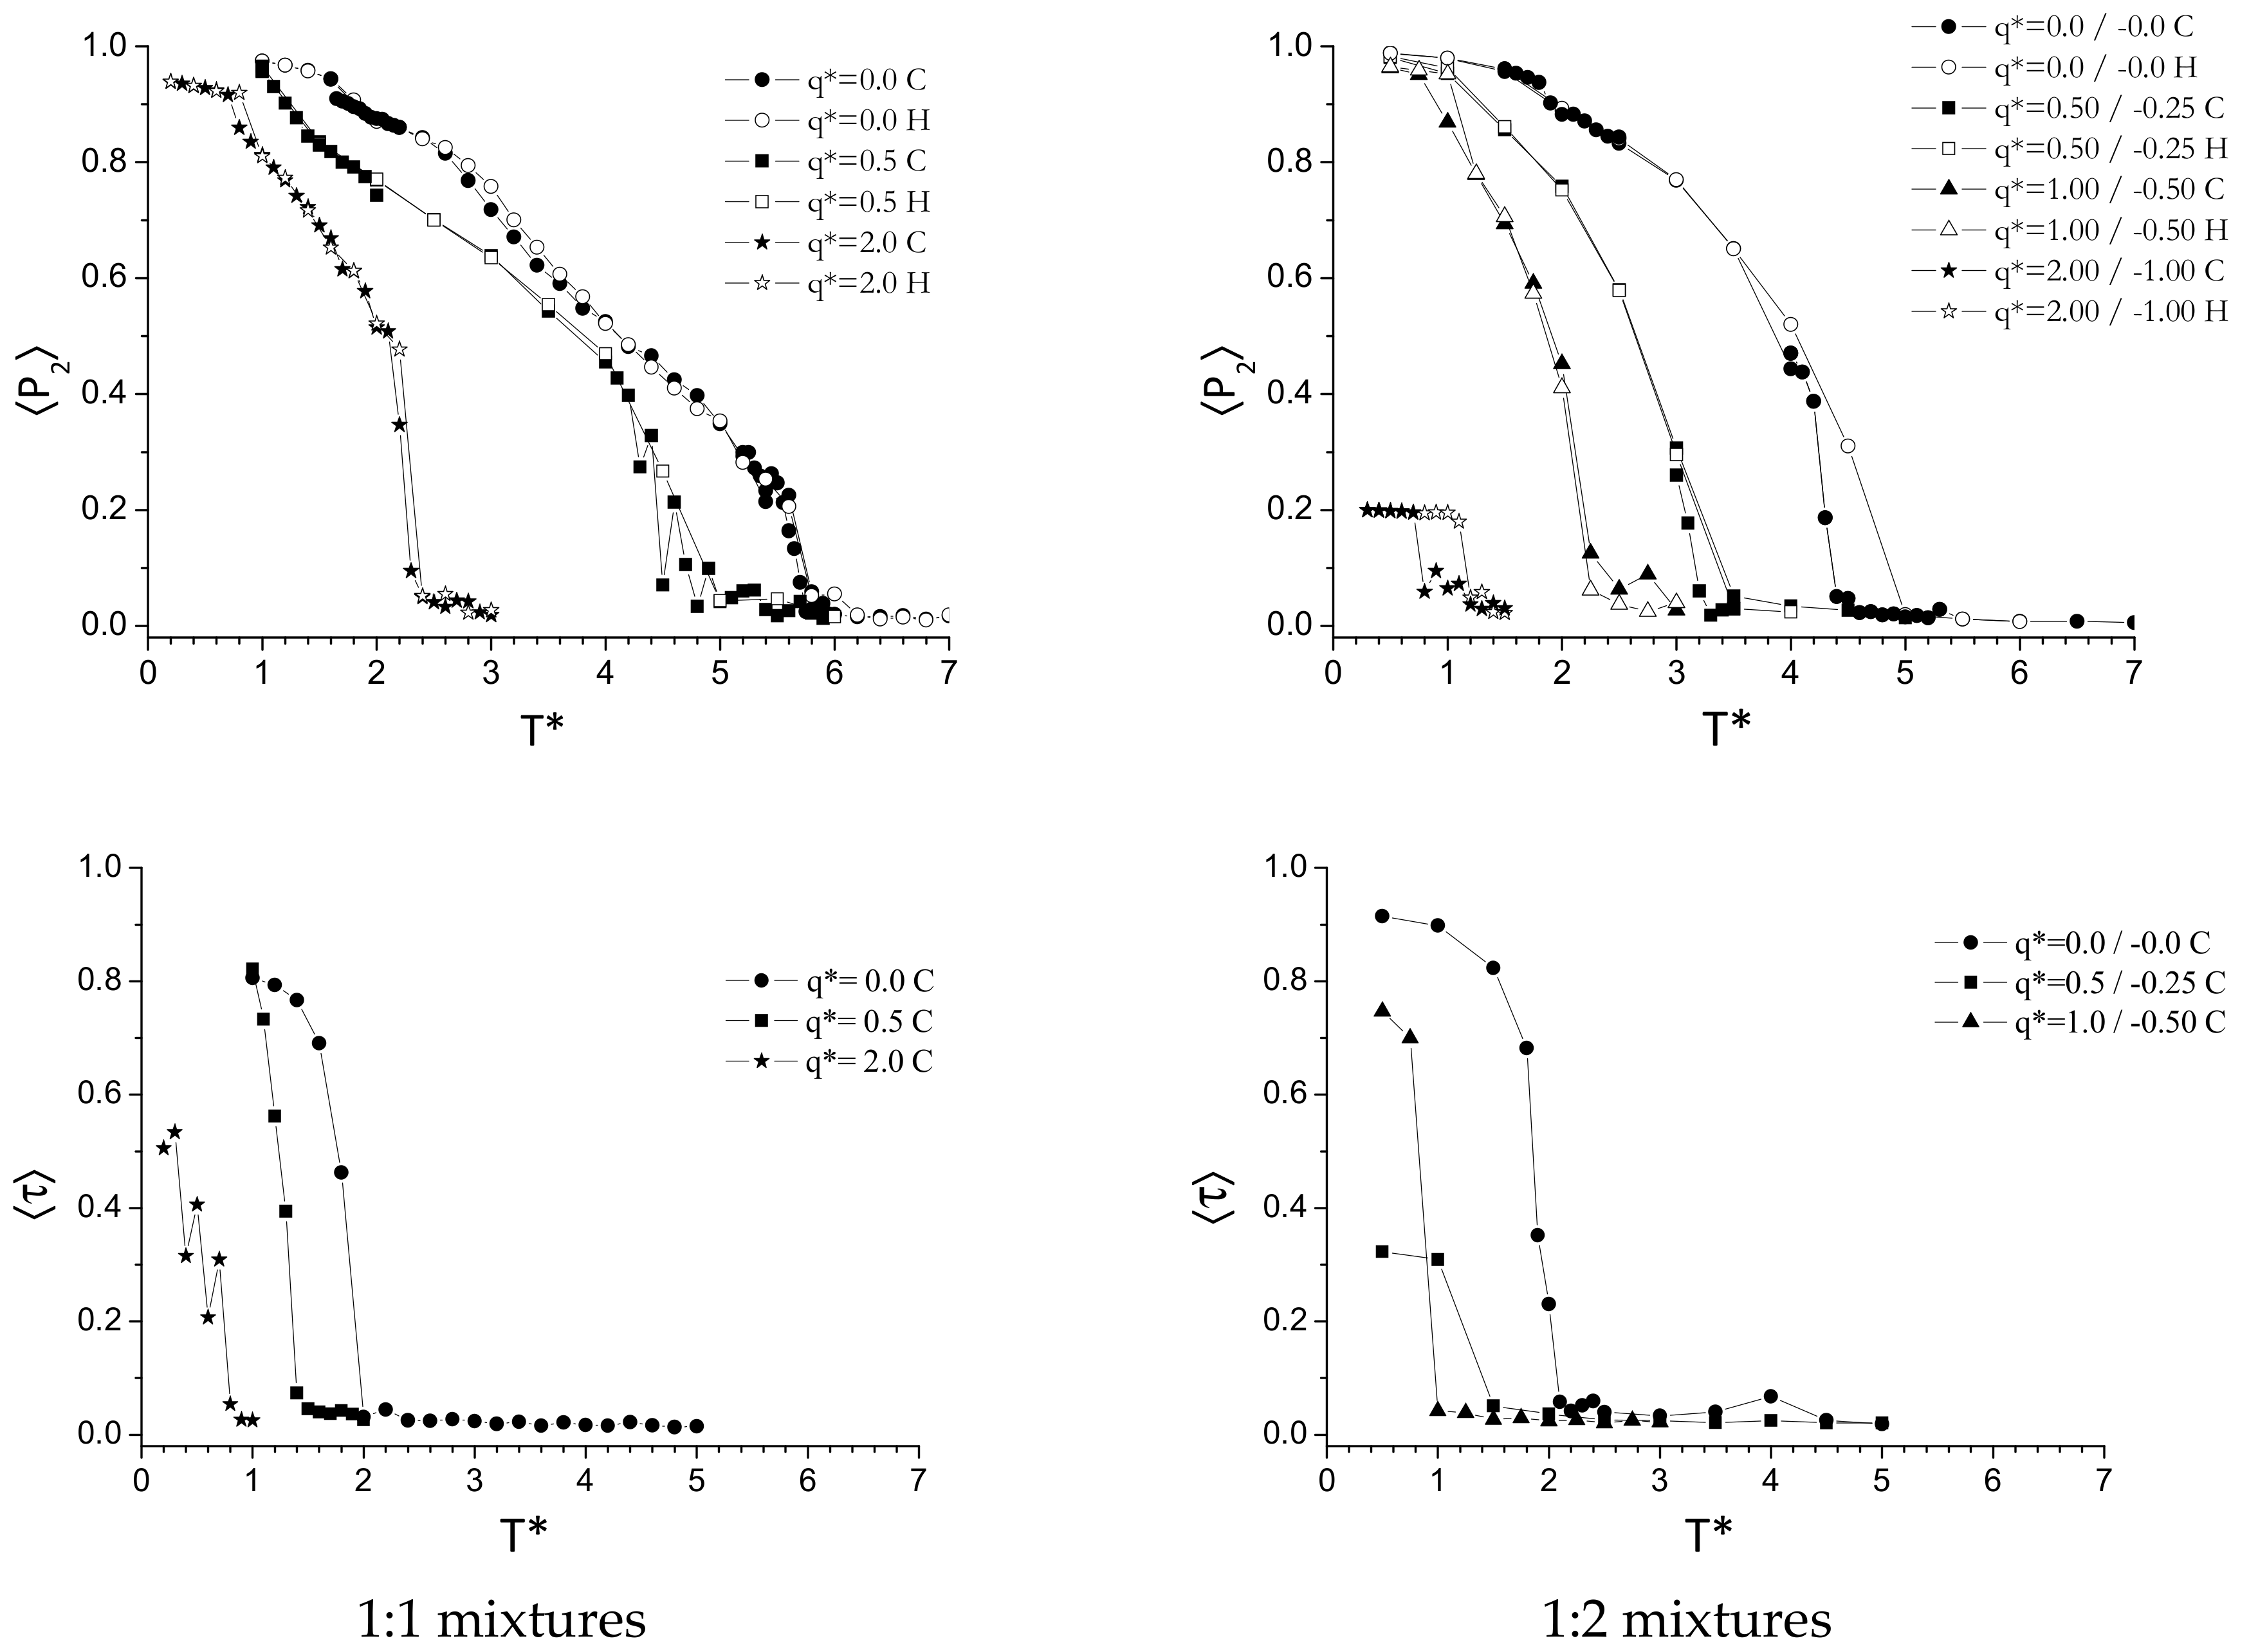
In Figure 4 we show the orientational and translational order parameters for the two mixtures with 1:1 and 1:2 GB:LJ stoichiometry at a packing fraction η* = 0.428.
As we can see, increasing the density of the systems destabilize the isotropic mixed phase. For the non-charged system, the first transition on cooling down the temperature occurs at T* = 1.80 and T* = 2.0, for the 1:1 and 1:2 mixtures, respectively. Such a transition is accompanied by a phase separation with a phase composed by GB particles in the LC phase and isotropic LJ particles. The thermal range of stability of such bi-phasic system is rather large since the translational order parameter becomes different from zero only at T* around 1.4 for both systems.
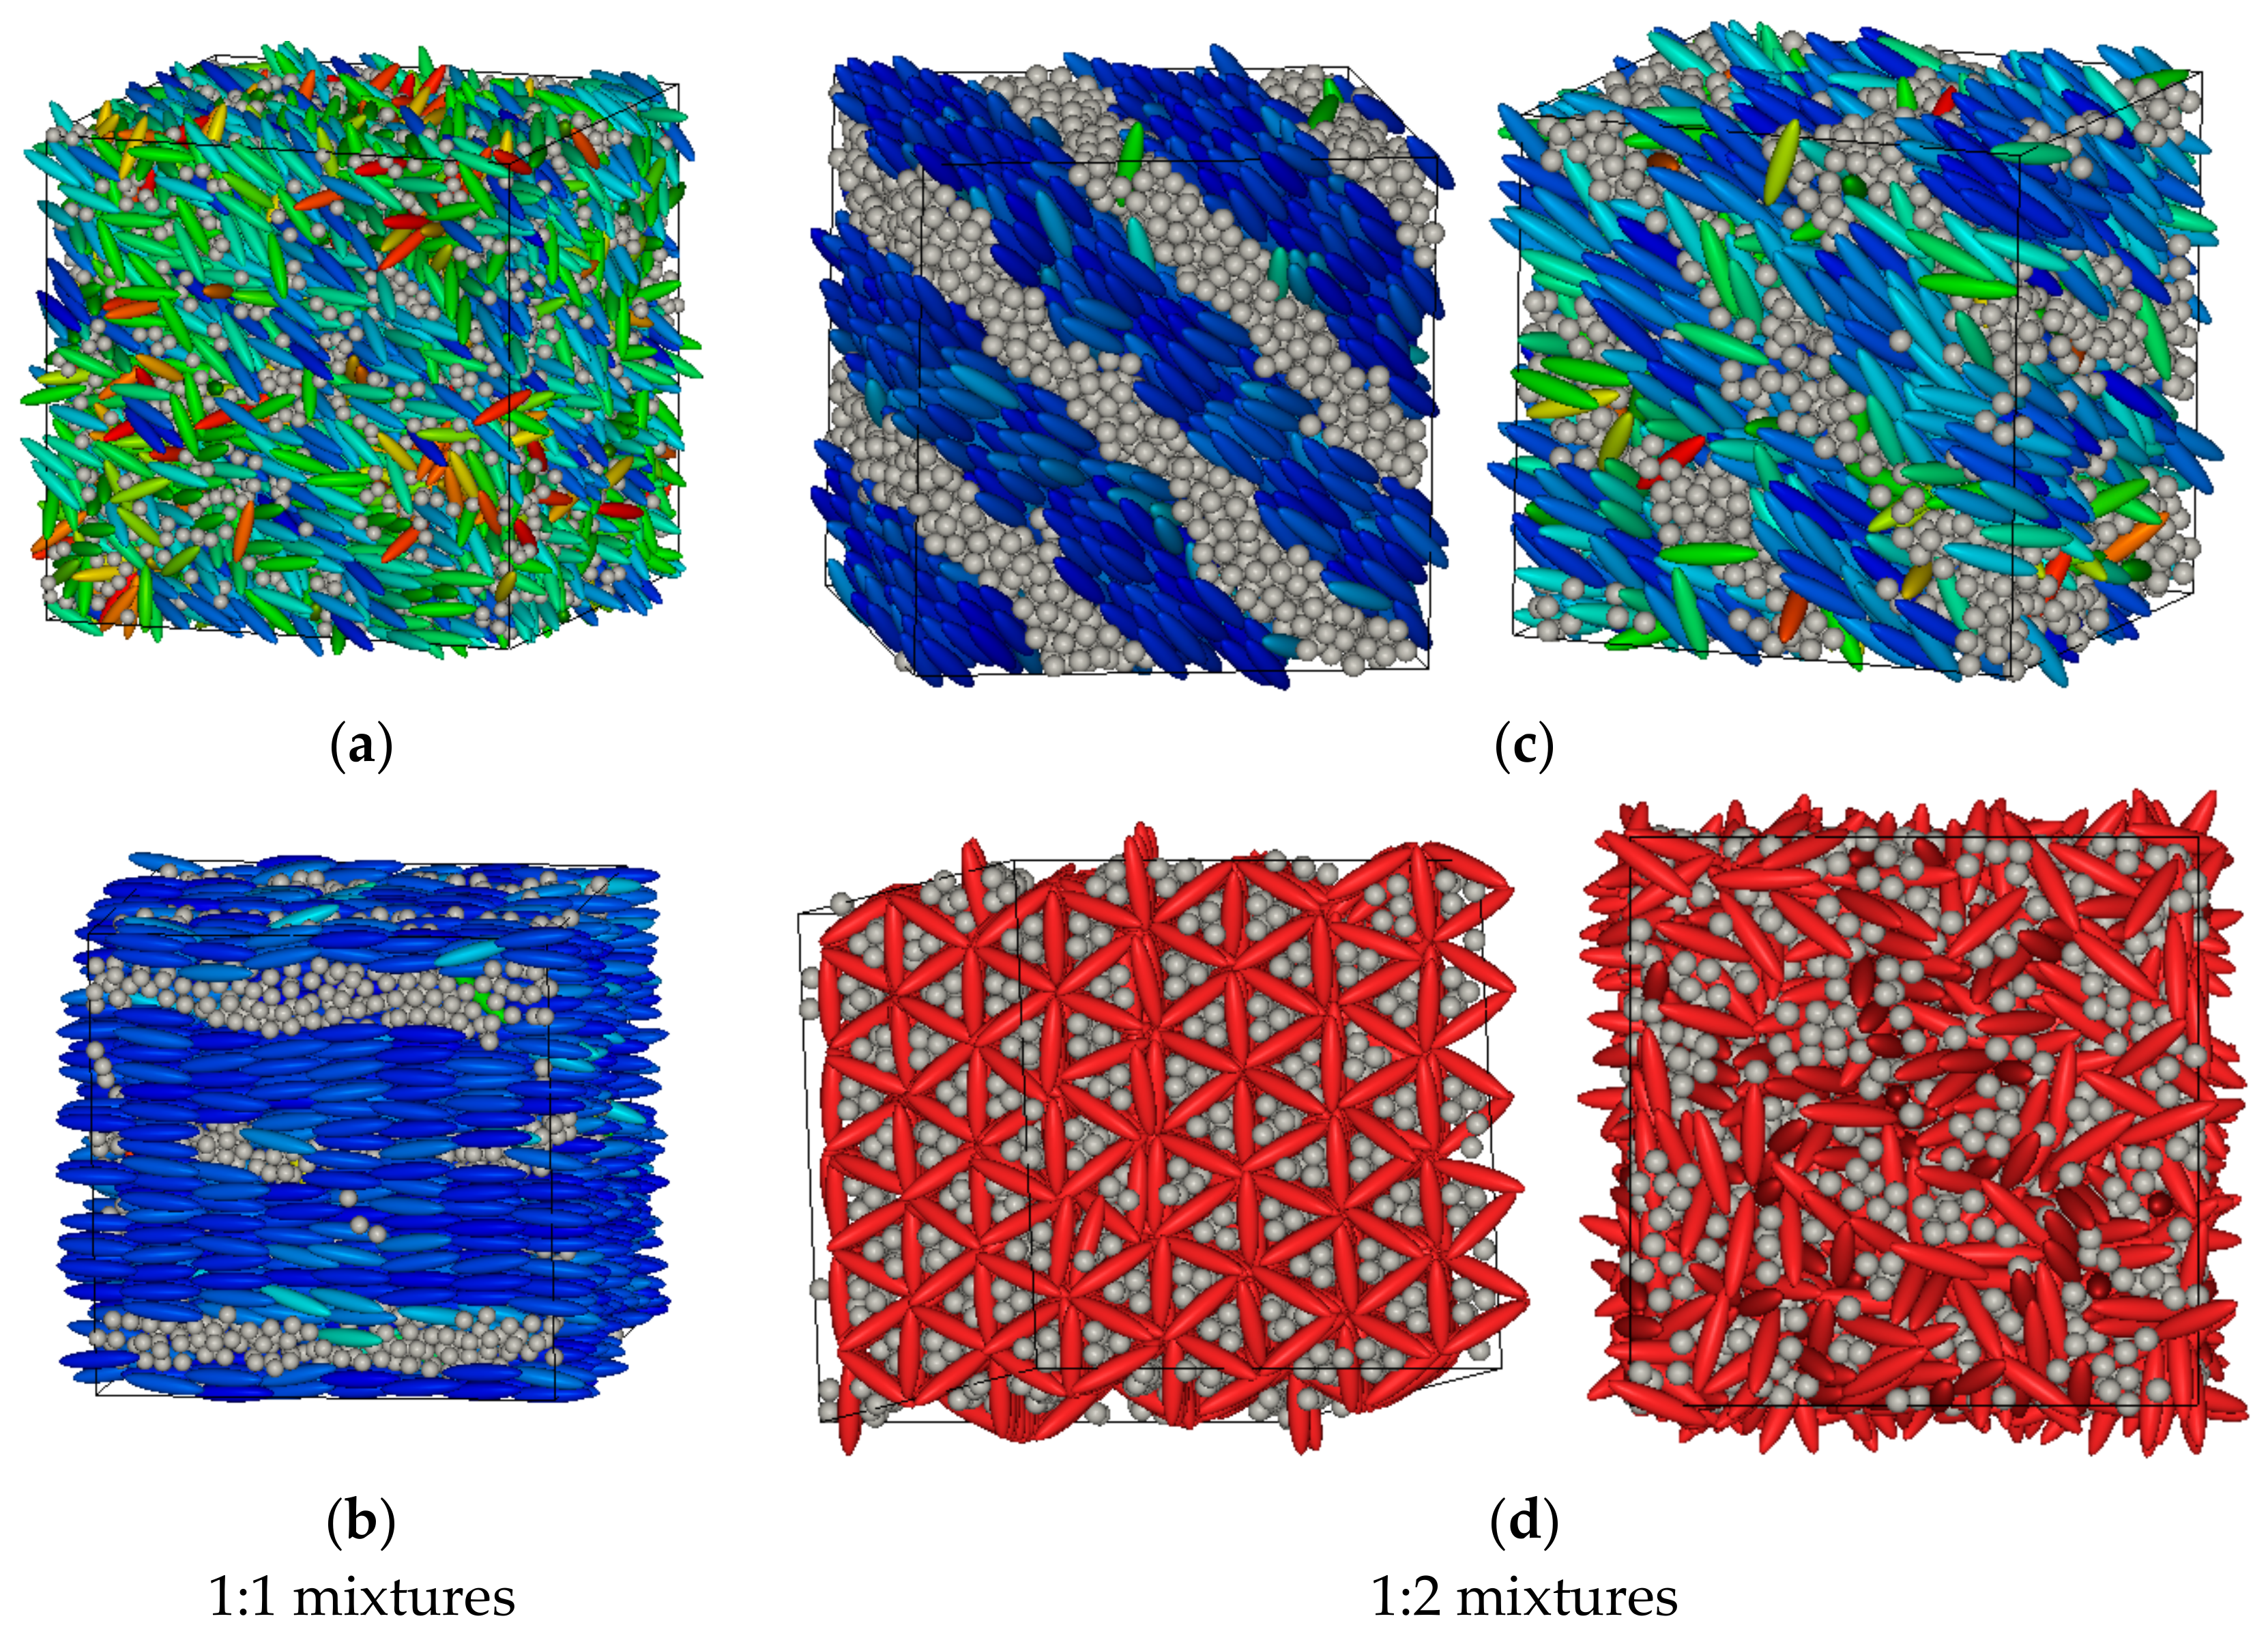
As already observed for the previous less-dense system, the presence of opposite charges again increases the stability of the isotropic mixed phase by opposing the phase separation. For a charge q* = 0.50/−0.50 (1:1) and q* = 0.50/−0.25 (1:2) the transition of the system from an isotropic into a nematic phase is about T* = 1.3 and T* = 1.1 for the 1:1 and 1:2 mixtures, respectively. Moreover, while the 1:1 mixture has a non-negligible thermal range of existence of the nematic phase (ca. ΔT* ≈ 0.4), the 1:2 systems almost immediately goes into a smectic phase. For larger charges, we did not observe a clear ILC phase, rather a direct transition into a crystal lattice of GB particles as shown in Figure 5d. As we can see the GB particles arrange in triangular channel, or nanotubes whose walls are made by a side-by-side packing of the ellipsoids. The inside of the nanotubes is filled with an ordered distribution of LJ particles. The nano-channels are arranged into a honeycomb structure.
3.3. Comparison of 1:1 and 1:2 Stoichiometry for a Packing Fraction 0.514
In Figure 6 we show the orientational and translational order parameters for the mixtures at the packing fraction of 0.514.
As we can see, following the trend already observed, increasing the packing fraction leads to a stabilization of the ordered phases and a destabilization of the isotropic mixture. In particular, for the non-charged 1:1 system a nematic phase of the GB particles is found between about T* = 2.0 and T* = 5.9, although as for the previous cases, the transition is concomitant with a phase separation. In contrast, for a scaled charge q* = 0.50/−0.50 we observe a homogeneous ionic nematic phase in the range between T* = 1.4 and T* = 4.8. A relatively wide range of ionic nematic phase is also observed for the higher charge of q* = 2.00/−2.00, extending from T* = 0.9 to T* = 2.4.
Comparing these results with those obtained from the 1:2 mixture we note a significant destabilization of the LC phase in favour of a mixed isotropic phase. For the non-charged 1:2 system the first transition, on cooling down the temperature, occurs around T* = 4.5 (we note some hysteresis), that is 1.4 units of scaled temperature lower than the corresponding 1:1 mixture. Also, the charged systems exhibit much lower transition temperatures: for example, both the 1:2 mixtures with charge q* = 0.50/−0.25 and q* = 1.00/−0.50 have a transition from the isotropic into the ionic nematic phase at T* = 3.2 and T* = 2.2, respectively, much below the value of T* = 4.8 of the 1:1 mixture with charge 0.50/−0.50. Finally, as noted already for the lower packing fraction of 0.428, the 1:2 mixture, when the charge is above a certain value does not exhibit any LC phase, rather a crystalline structure where the GB particles form channels of a hexagonal structure hosting the spherical LJ particles.
We mention here that very similar aggregation patterns as found in Figure 7c have been recently observed experimentally in mixtures of oppositely charged colloidal particles [50,51]. In that case, the formation of alternating layers of positive and negative particles was obtained by imposing an oscillating electric field. In Figure 7d, the GB particles also arrange in triangular channels, or nanotubes, by a side-by-side packing of the ellipsoids. The inside of the nanotubes is filled with a few LJ particles. The nano-channels are arranged into a honeycomb structure similarly to the system with η* = 0.428.
4. Discussion
In Table 2 we report a summary of the phases and transition temperatures obtained by the combined observation of the orientational and translational order parameters,
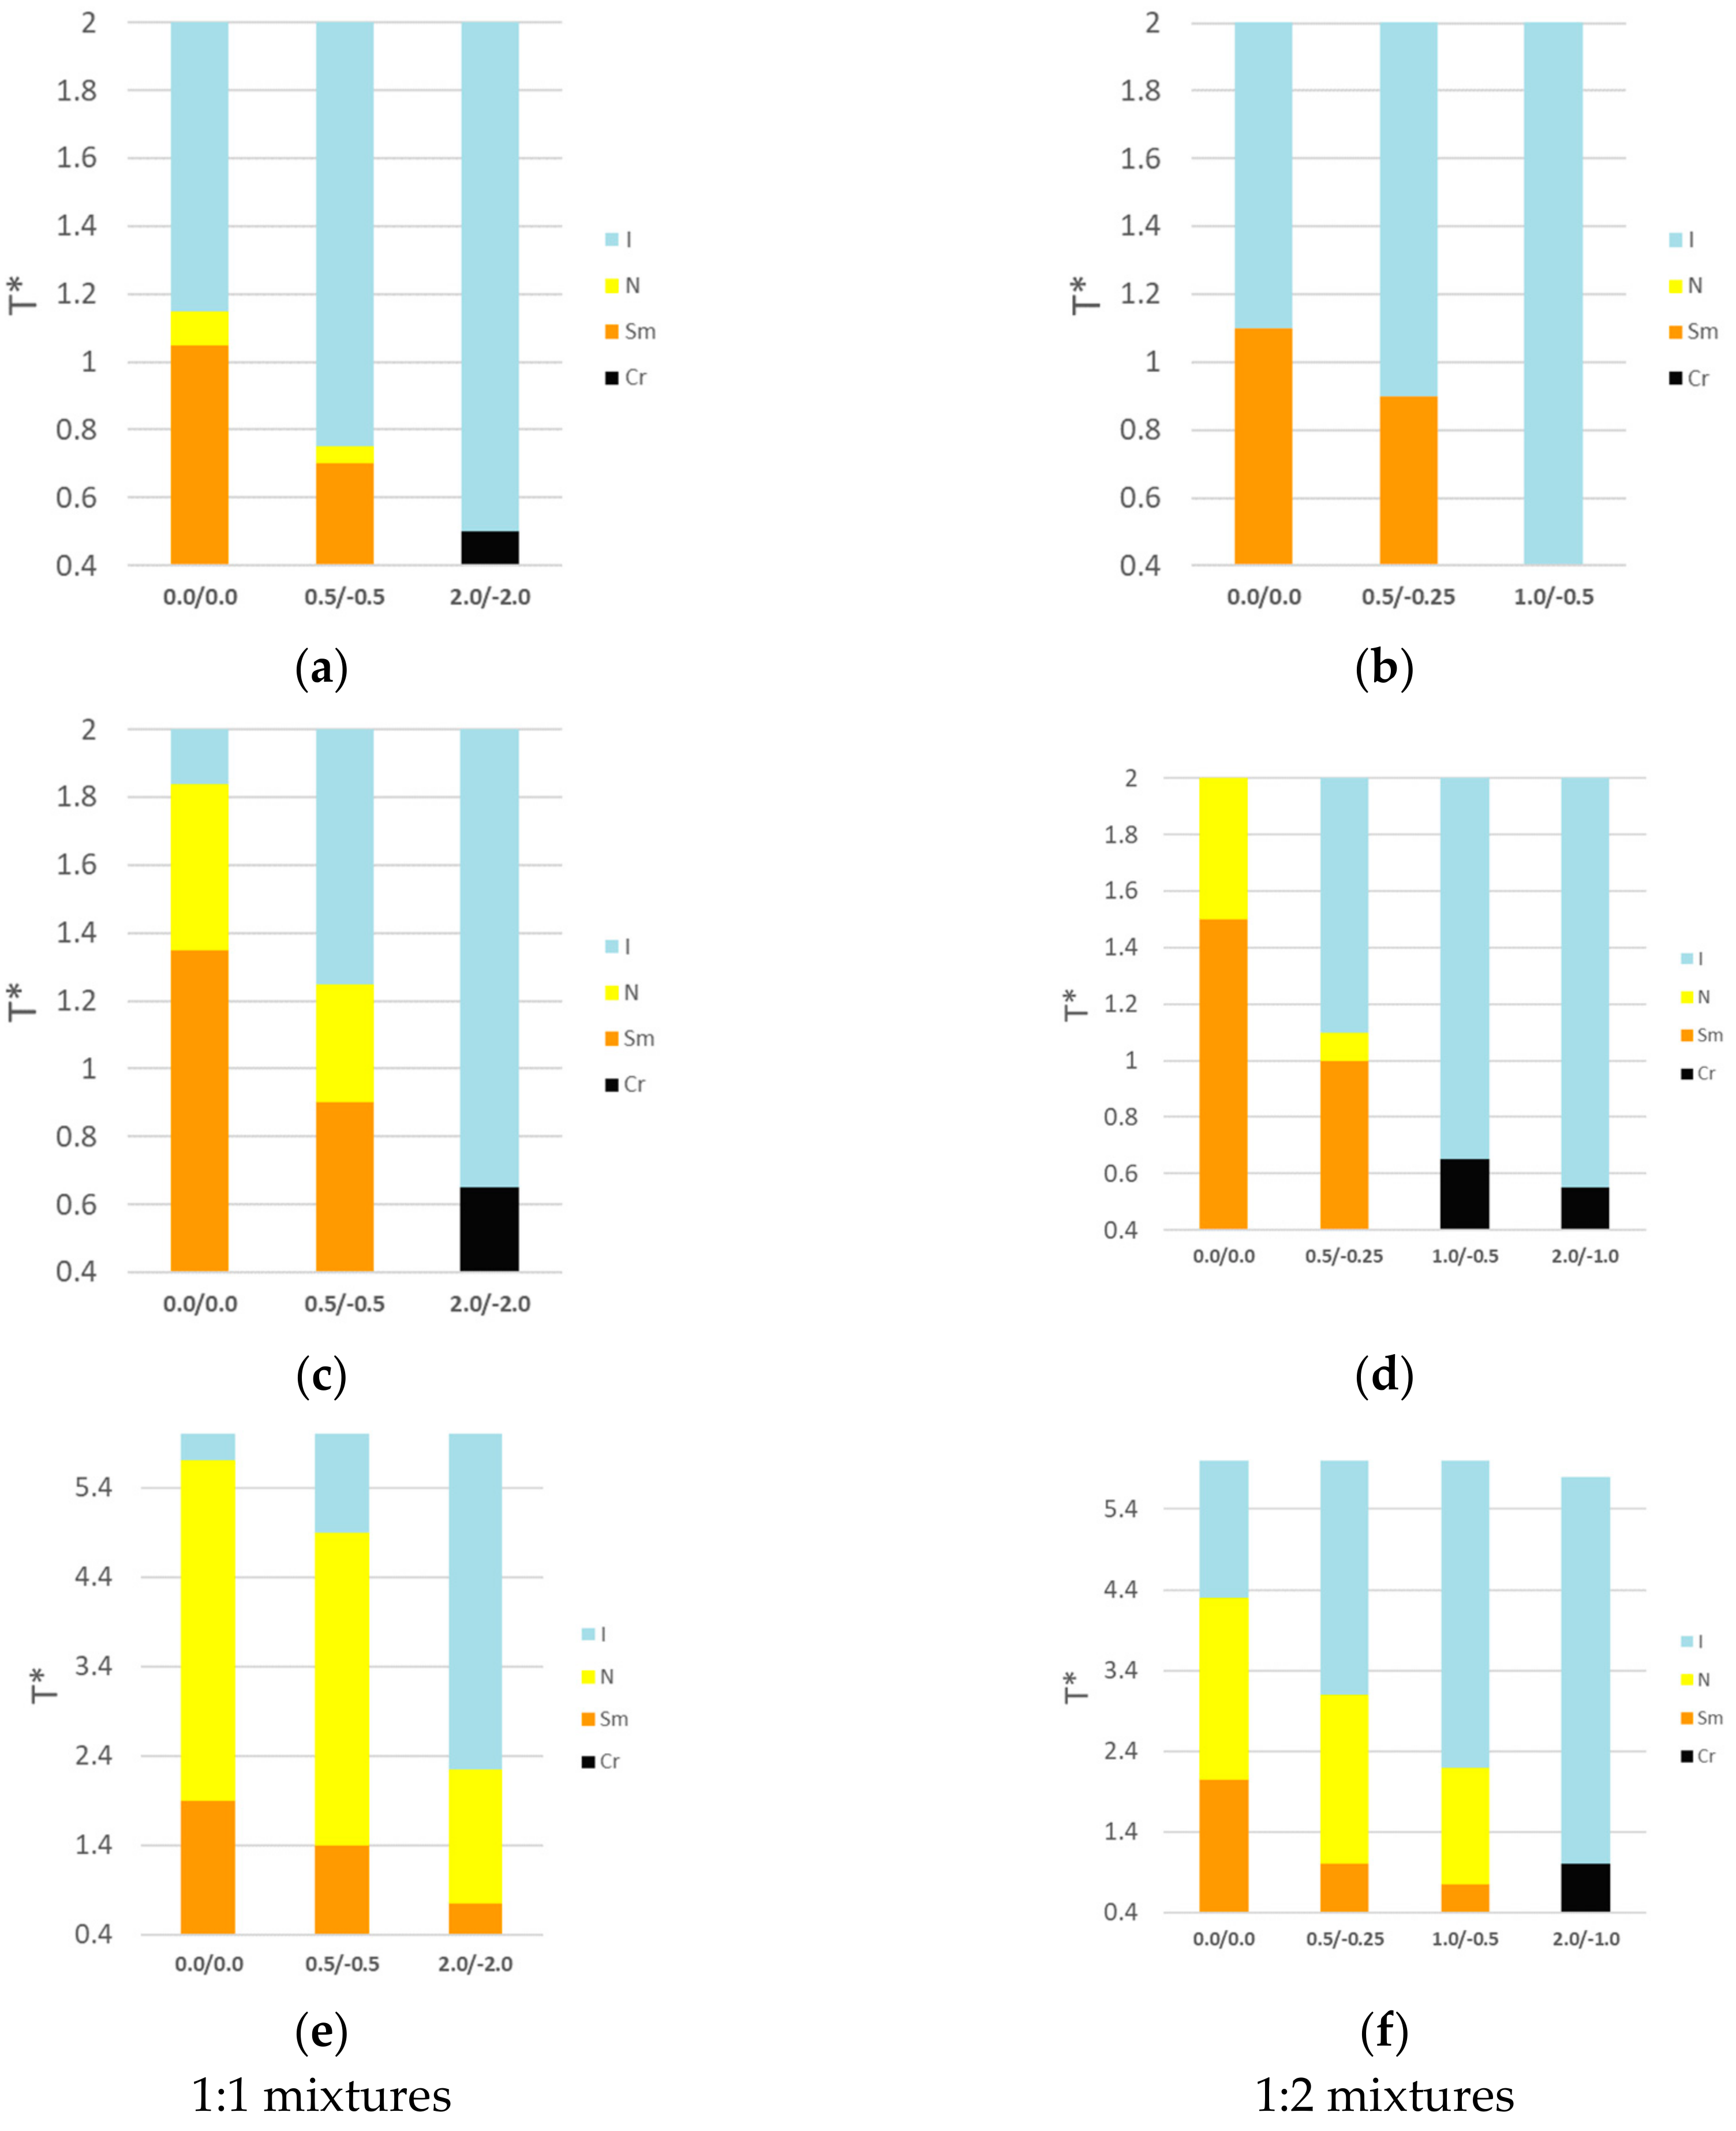
and , respectively, recalling that they are calculated considering only the GB particles’ orientation and positions. The assignment is made as follows: if both and the phase is isotropic; if and the phase is nematic; finally, if both and the phase is smectic. Inspection of the radial distribution functions (see supporting information) and snapshots is used to confirm the assignment as well as to assign crystal phases. Therefore, only structural properties of the GB particles have been considered for the phase assignment without explicitly considering the amount of clustering and micro-segregation or mixing/demixing of the GB/LJ particles and also without considering dynamic properties and possibly the formation of glassy states. A more detailed description of the phases can be obtained by inspection of the snapshots in Figure 3, Figure 5 and Figure 7. Moreover, in Figure 8 we show the thermal range of stability of the phases of the various systems as histograms.
The main differences between the 1:1 and 1:2 stoichiometries can be summarized as follows: by increasing the mole fraction of spherical LJ particles (and changing the relative charge accordingly, in order to keep the system electrically neutral) we note a significant destabilization of the LC phases; for the lowest packing fraction investigated we note that the nematic range appears smaller in the non-charged 1:2 mixtures while even the smectic phase is suppressed when the charge is increased to q* = 2.00/−1.00. Increasing the density confirms this trend and, while the charged 1:1 mixtures do exhibit a sequence of ionic nematic and ionic smectic phases, for the analogous 1:2 mixtures these are destabilized, and interesting hexagonal arrangements appear made of the highly anisotropic, and positively charged, GB particles hosting the negatively charged LJ spheres. This arrangement maximizes the side-by-side van der Waals interaction of the GB particles and, at the same time, the electrostatic energetic cost due to the repulsion between cations is compensated by the attractive interaction with the anions inside the channels. The GB interaction is, in fact, highly anisotropic, being 20 times larger, in the side-by-side configuration, than both the end-to-end interaction and the LJ-LJ interaction, so it plays a major role in the phase structure of the systems, favouring a smectic type of phase for the GB particles.
The honeycomb arrangement observed at relatively high packing fractions, high charge and low temperatures can be understood as a fortuitous matching of the relative length of the GB particles and size of the LJ particles. In Figure 9 we show a very schematic and bi-dimensional representation of the triangular unit composing the honeycomb structure. This is an oversimplified geometrical model just to highlight the importance of the right length of the GB particles; thus, we ignore, for the sake of simplicity, the overlap at the ends of each ellipsoid. The side of the equilateral triangle, in such an arrangement, is l = 4.4, while the radius of the LJ sphere is rLJ = 0.5. A simple calculation shows that the available area inside, that is the area of the triangle excluding the internal area occupied by the ellipsoids, is l·cos(30°)·l/2 − l·rLJ·π·1.5 = 3.1995. The last factor 1.5, accounts for the fact that each triangle contains only half of each ellipsoid, that is 1.5 in total (besides, it contains also 3 spheres, thus keeping the correct stoichiometry of 1:2). The area of the three spheres is only 2.3561945, that is less than the available area inside the triangle. Therefore, three LJ spheres can be accommodated inside the honeycomb structure for this particular GB.
We might expect that for a more anisotropic GB particle a different structure might be formed, e.g., of square shape. This behavior is very close to what was extensively studied by Tschierske and co-workers in several papers, see for example [52,53]. The systems investigated by the authors consists of the so-called T-shape mesogens, generally non ionic, where one or more flexible tails are linked to the middle of a rigid core. Various types of honeycomb structures with different symmetries can be observed depending on the ratio between the length of the rigid core and the lateral chains. In our mixtures made by ellipsoids and spheres, the size and shape anisotropy of the ellipsoids and the size of the spheres are the most important factors leading to the formation of the interesting geometrical structures such as the honeycomb and square shapes. The second important factor is weak ionicity, because the strong charge would cause strong ion pairing by the GB and LJ oppositely charged particles, thus avoiding the macroscopic phase separation as described above.
A second interesting effect is the stronger tendency to phase-separate of the 1:2 non-charged mixtures, compared to the analogous non-charged 1:1 mixtures. Because of the strong shape anisotropy of the GB particles (breadth-to-length ratio of 4.4), excluded volume effects are quite significant and the mixing is observed only at relatively high temperatures, or low densities. For the 1:2 mixture we observe phase separation, on cooling the temperature, even before the GB particles have a transition into a LC phase.
Therefore, ionic nematic phases can be formed in mixtures of particles of different shapes, oppositely charged; however, a fine tuning of the van der Waals (vdW) vs electrostatic (ES) contributions is necessary. In particular, doubling the charge of the ellipsoidal particles compared to that of the spheres (thus doubling the number of LJ particles to keep the system neutral) is detrimental to the stability of ionic LC phases. The fine tuning of vdW and ES interaction would be realized by designed molecular structure by steric, flexibility, effective charge strength and so on. However, the studied mixture of GB and LJ particles proved the possibility of forming a nematic ionic liquid crystalline phase.
Finally, we note that a general effect of increasing the charge, for a given packing fraction, is to increase the stability of the isotropic mixed phase, and therefore to destabilize the ionic liquid mesophases. This result has been also experimentally confirmed recently by Laschat and co-workers [54]: the authors investigated a series of amino acid/crown ether ionic LCs and found that increasing the charge is detrimental for the stability of ionic LC phases.
5. Conclusions
To summarize, in this manuscript we have presented a direct comparison of 1:1 and 1:2 mixtures of charged GB and LJ particles as models of ionic liquids and ionic liquid crystals. Despite the simplicity of the model, we observe a rich polymorphism with isotropic, nematic, smectic and crystal phases of ionic type. Generally speaking, both increasing the charge above a certain limit, as well as increasing the ratio of LJ over GB particles, leads to a destabilization of the ionic mesophases. While tuning the charge in the simulations is very easy, this is not true for a real ionic compound. One possible approach could be to favour charge transfer from the anion to the cation. It is, in fact, well-known that charge transfer occurs in ionic liquids and the effective charge of the ions is around 0.7–0.8e for some cation–anion combinations [55]. Another possibility is to increase the relative weight of π-π interactions and their anisotropy in the rigid core in order to make the electrostatic contribution less important. Finally, these results suggest that, in order to increase the thermal range of stability of ionic mesophases, especially if the elusive ionic nematic phase is sought, one possible strategy is to vary the stoichiometry in favour of the anisotropic GB cations, e.g., by synthesizing salts of 2:1 stoichiometry, with the cations bearing half the charge of the anions, and to increase the van der Waals forces compared to the electrostatic interaction by designing systems with large polarizability.
Supplementary Materials
The following are available online at https://www.mdpi.com/2073-4352/8/10/371/s1, Figures S1–S20: radial distribution functions, g(r), of the systems investigated.
Author Contributions
G.S. and K.S. conceived and designed the simulations; T.M. performed the simulations; T.M., K.S. and G.S. analyzed the data; T.M., K.S. and G.S wrote the paper.
Funding
This research received no external funding.
Acknowledgments
Computational work has been carried out on the C3P (Computational Chemistry Community in Padua) HPC facility of the Department of Chemical Sciences of the University of Padua and on the HPC facilities of the CINECA consortium (Bologna, Italy) through the ISCRA projects HP10CCR1RQ and HP10CNVBJY.
Conflicts of Interest
The authors declare no conflict of interest.
References
- Goossens, K.; Lava, K.; Bielawski, C.W.; Binnemans, K. Ionic liquid crystals: Versatile materials. Chem. Rev. 2016, 116, 4643–4807. [Google Scholar] [CrossRef] [PubMed]
- Bowlas, C.J.; Bruce, D.W.; Seddon, K.R. Liquid-crystalline ionic liquids. Chem. Commun. 1996, 14, 1625–1626. [Google Scholar] [CrossRef]
- Nusselder, J.J.H.; Engberts, J.B.F.N.; VanDoren, H.A. Liquid-crystalline and thermochromic behavior of 4-substituted 1-methylpyridinium iodide surfactants. Liq. Cryst. 1993, 13, 213–225. [Google Scholar] [CrossRef]
- Ujiie, S.; Mori, A. Cubic mesophase formed by thermotropic liquid crystalline ionic systems-effects of polymeric counterion. Mol. Cryst. Liq. Cryst. 2005, 437, 1269–1275. [Google Scholar] [CrossRef]
- Causin, V.; Saielli, G. Effect of asymmetric substitution on the mesomorphic behaviour of low-melting viologen salts of bis(trifluoromethanesulfonyl)amide. J. Mater. Chem. 2009, 19, 9153. [Google Scholar] [CrossRef]
- Casella, G.; Causin, V.; Rastrelli, F.; Saielli, G. Viologen-based ionic liquid crystals: Induction of a smectic A phase by dimerisation. Phys. Chem. Chem. Phys. 2014, 16, 5048–5051. [Google Scholar] [CrossRef] [PubMed]
- Casella, G.; Causin, V.; Rastrelli, F.; Saielli, G. Ionic liquid crystals based on viologen dimers: Tuning the mesomorphism by varying the conformational freedom of the ionic layer. Liq. Cryst. 2016, 43, 1161–1173. [Google Scholar] [CrossRef] [Green Version]
- Asaftei, S.; Ciobanu, M.; Lepadatu, A.M.; Enfeng, S.; Beginn, U. Thermotropic ionic liquid crystals by molecular-assembly and ion pairing of 4,4’-bipyridinium derivatives and tris(dodecyloxy)benzenesulfonats in a non-polar solvent. J. Mater. Chem. 2012, 22, 14426–14437. [Google Scholar] [CrossRef]
- Butschies, M.; Sauer, S.; Kessler, E.; Siehl, H.-U.; Claasen, B.; Fischer, P.; Frey, W.; Laschat, S. Influence of N-Alkyl Substituents and Counterions on the Structural and Mesomorphic Properties of Guanidinium Salts: Experiment and Quantum Chemical Calculations. Chemphyschem 2010, 11, 3752–3765. [Google Scholar] [CrossRef] [PubMed]
- Sauer, S.; Saliba, S.; Tussetschlager, S.; Baro, A.; Frey, W.; Giesselmann, F.; Laschat, S.; Kantlehner, W. p-Alkoxybiphenyls with guanidinium head groups displaying smectic mesophases. Liq. Cryst. 2009, 36, 275–299. [Google Scholar] [CrossRef]
- Sauer, S.; Steinke, N.; Baro, A.; Laschat, S.; Giesselmann, F.; Kantlehner, W. Guanidinium chlorides with triphenylene moieties displaying columnar mesophases. Chem. Mater. 2008, 20, 1909–1915. [Google Scholar] [CrossRef]
- Butschies, M.; Frey, W.; Laschat, S. Designer ionic liquid crystals based on congruently shaped guanidinium sulfonates. Chem. Eur. J. 2012, 18, 3014–3022. [Google Scholar] [CrossRef] [PubMed]
- Tao, J.; Zhong, J.; Liu, P.; Daniels, S.; Zeng, Z. Pyridinium-based ionic liquid crystals with terminal fluorinated pyrrolidine. J. Fluor. Chem. 2012, 144, 73–78. [Google Scholar] [CrossRef]
- Goossens, K.; Nockemann, P.; Driesen, K.; Goderis, B.; Goerller-Walrand, C.; Hecke, K.; Van Meervelt, L.; Van Pouzet, E.; Binnemans, K.; Cardinaels, T. Imidazolium ionic liquid crystals with pendant mesogenic groups. Chem. Mater. 2008, 20, 157–168. [Google Scholar] [CrossRef] [Green Version]
- Li, W.; Zhang, J.; Li, B.; Zhang, M.; Wu, L. Branched quaternary ammonium amphiphiles: Nematic ionic liquid crystals near room temperature. Chem. Commun. 2009, 35, 5269–5271. [Google Scholar] [CrossRef] [PubMed]
- Ringstrand, B.; Jankowiak, A.; Johnson, L.E.; Kaszynski, P.; Pociecha, D.; Gorecka, E. Anion-driven mesogenicity: A comparative study of ionic liquid crystals based on the [closo-1-CB9H10](-) and [closo-1-CB11H12](-) clusters. J. Mater. Chem. 2012, 22, 4874–4880. [Google Scholar] [CrossRef]
- Shi, R.; Wang, Y. Dual ionic and organic nature of ionic liquids. Sci. Rep. 2016, 6, 19612–19644. [Google Scholar] [CrossRef] [PubMed]
- Urahata, S.M.; Ribeiro, M.C.C. Structure of ionic liquids of 1-alkyl-3-methylimidazolium cations: A systematic computer simulation study. J. Chem. Phys. 2004, 120, 1855–1863. [Google Scholar] [CrossRef] [PubMed]
- Wang, Y.; Voth, G.A. Unique Spatial Heterogeneity in Ionic Liquids. J. Am. Chem. Soc. 2005, 127, 12192–12193. [Google Scholar] [CrossRef] [PubMed] [Green Version]
- Canongia Lopes, J.N.A.; Pàdua, A.A.H. Nanostructural Organization in Ionic Liquids. J. Phys. Chem. B 2006, 110, 3330–3335. [Google Scholar] [CrossRef] [PubMed]
- Triolo, A.; Russina, O.; Bleif, H.-J.; Di Cola, E. Nanoscale Segregation in Room Temperature Ionic Liquids. J. Phys. Chem. B 2007, 111, 4641–4644. [Google Scholar] [CrossRef] [PubMed]
- Hayes, R.; Warr, G.G.; Atkin, R. Structure and Nanostructure in Ionic Liquids. Chem. Rev. 2015, 115, 6357–6426. [Google Scholar] [CrossRef] [PubMed]
- Kondrat, S.; Bier, M.; Harnau, L. Phase behavior of ionic liquid crystals. J. Chem. Phys. 2010, 132, 184901. [Google Scholar] [CrossRef] [Green Version]
- Saielli, G.; Bagno, A.; Wang, Y. Insights on the isotropic-to-Smectic a transition in ionic liquid crystals from coarse-grained molecular dynamics simulations: The role of microphase segregation. J. Phys. Chem. B 2015, 119, 3829–3836. [Google Scholar] [CrossRef] [PubMed]
- Saielli, G.; Wang, Y. Role of the electrostatic interactions in the stabilization of ionic liquid crystals: Insights from coarse-grained MD simulations of an imidazolium model. J. Phys. Chem. B 2016, 120, 9152–9160. [Google Scholar] [CrossRef] [PubMed]
- Kofu, M.; Tyagi, M.; Inamura, Y.; Miyazaki, K.; Yamamuro, O. Quasielastic neutron scattering studies on glass-forming ionic liquids with imidazolium cations. J. Chem. Phys. 2015, 143, 234502. [Google Scholar] [CrossRef] [PubMed]
- Nemoto, F.; Kofu, M.; Yamamuro, O. Thermal and structural studies of imidazolium-based ionic liquids with and without liquid-crystalline phases: The origin of nanostructure. J. Phys. Chem. B 2015, 119, 5028–5034. [Google Scholar] [CrossRef] [PubMed]
- Nemoto, F.; Kofu, M.; Nagao, M.; Ohishi, K.; Takata, S.; Suzuki, J.; Yamada, T.; Shibata, K.; Ueki, T.; Kitazawa, Y.; Watanabe, M.; Yamamuro, O. Neutron scattering studies on short- and long-range layer structures and related dynamics in imidazolium-based ionic liquids. J. Chem. Phys. 2018, 149, 54502. [Google Scholar] [CrossRef] [PubMed]
- Nelyubina, Y.V.; Shaplov, A.S.; Lozinskaya, E.I.; Buzin, M.I.; Vygodskii, Y.S. A New volume-based approach for predicting thermophysical behavior of ionic liquids and ionic liquid crystals. J. Am. Chem. Soc. 2016, 138, 10076–10079. [Google Scholar] [CrossRef] [PubMed]
- Quevillon, M.J.; Whitmer, J.K. Charge transport and phase behavior of imidazolium-based ionic liquid crystals from fully atomistic simulations. Materials 2018, 11, 64. [Google Scholar]
- Peng, H.; Kubo, M.; Shiba, H. Molecular dynamics study of mesophase transitions upon annealing of imidazolium-based ionic liquids with long-alkyl chains. Phys. Chem. Chem. Phys. 2018, 20, 9796–9805. [Google Scholar] [CrossRef] [PubMed]
- Bates, M.A.; Luckhurst, G.R. Computer simulation studies of anisotropic systems. XXX. The phase behavior and structure of a Gay-Berne mesogen. J. Chem. Phys. 1999, 110, 7087–7108. [Google Scholar] [CrossRef]
- Margola, T.; Saielli, G.; Satoh, K. MD simulations of mixtures of charged Gay-Berne and Lennard-Jones particles as models of ionic liquid crystals. Mol. Cryst. Liq. Cryst. 2017, 649, 50–58. [Google Scholar] [CrossRef]
- Saielli, G.; Margola, T.; Satoh, K. Tuning Coulombic interactions to stabilize nematic and smectic ionic liquid crystal phases in mixtures of charged soft ellipsoids and spheres. Soft Matter 2017, 13, 5204–5213. [Google Scholar] [CrossRef] [PubMed]
- Plimpton, S. Fast parallel algorithms for short-range molecular dynamics. J. Comput. Phys. 1995, 117, 1–19. [Google Scholar] [CrossRef]
- Wang, X.; Sternberg, M.; Kohler, F.T.U.; Melcher, B.U.; Wasserscheid, P.; Meyer, K. Long-alkyl-chain-derivatized imidazolium salts and ionic liquid crystals with tailor-made properties. RSC Adv. 2014, 4, 12476–12481. [Google Scholar] [CrossRef] [Green Version]
- Rohini, R.; Lee, C.-K.; Lu, J.-T.; Lin, I.J.B. Symmetrical 1, 3-dialkylimidazolium based ionic liquid crystals. J. Chin. Chem. Soc. 2013, 60, 745–754. [Google Scholar] [CrossRef]
- Bhowmik, P.K.; Han, H.S.; Akhter, S.; Han, H.S. Lyotropic liquid-crystalline main-chain viologen polymers. J. Polym. Sci. Part A-Polymer Chem. 1995, 33, 1745–1749. [Google Scholar] [CrossRef]
- Bhowmik, P.K.; Han, H.S.; Cebe, J.J.; Burchett, R.A.; Acharya, B.; Kumar, S. Ambient temperature thermotropic liquid crystalline viologen bis(triflimide) salts. Liq. Cryst. 2003, 30, 1433–1440. [Google Scholar] [CrossRef]
- Causin, V.; Saielli, G. Effect of a structural modification of the bipyridinium core on the phase behaviour of viologen-based bistriflimide salts. J. Mol. Liq. 2009, 145, 41–47. [Google Scholar] [CrossRef]
- Berardi, R.; Emerson, A.P.J.; Zannoni, C. Monte Carlo investigations of a Gay-Berne liquid crystal. J. Chem. Soc. Faraday Trans. 1993, 89, 4069–4078. [Google Scholar] [CrossRef]
- Gay, J.G.; Berne, B.J. Modification of the overlap potential to mimic a linear site-site potential. J. Chem. Phys. 1981, 74, 3316–3319. [Google Scholar] [CrossRef]
- Berardi, R.; Fava, C.; Zannoni, C. A Gay–Berne potential for dissimilar biaxial particles. Chem. Phys. Lett. 1998, 297, 8–14. [Google Scholar] [CrossRef]
- Brown, W.M.; Petersen, M.K.; Plimpton, S.J.; Grest, G.S. Liquid crystal nanodroplets in solution. J. Chem. Phys. 2009, 130, 44901. [Google Scholar] [CrossRef] [PubMed]
- Hockney, R.; Eastwood, J. Computer Simulation Using Particles; Adam Hilger; CRC Press: New York, NY, USA, 1989. [Google Scholar]
- Shinoda, W.; Shiga, M.; Mikami, M. Rapid estimation of elastic constants by molecular dynamics simulation under constant stress. Phys. Rev. B 2004, 69, 134103. [Google Scholar] [CrossRef]
- Gabriel, A.T.; Meyer, T.; Germano, G. Molecular graphics of convex body fluids. J. Chem. Theory Comput. 2008, 4, 468–476. [Google Scholar] [CrossRef] [PubMed]
- Frenkel, D.; Louis, A.A. Phase separation in binary hard-core mixtures: An exact result. Phys. Rev. Lett. 1992, 68, 3363–3365. [Google Scholar] [CrossRef] [PubMed] [Green Version]
- Antypov, D.; Cleaver, D.J. The role of attractive interactions in rod–sphere mixtures. J. Chem. Phys. 2004, 120, 10307–10316. [Google Scholar] [CrossRef] [PubMed]
- Wysocki, A.; Löwen, H. Oscillatory driven colloidal binary mixtures: Axial segregation versus laning. Phys. Rev. E 2009, 79, 41408. [Google Scholar] [CrossRef] [PubMed]
- Vissers, T.; Van Blaaderen, A.; Imhof, A. Band formation in mixtures of oppositely charged colloids driven by an ac electric field. Phys. Rev. Lett. 2011, 106, 228303. [Google Scholar] [CrossRef] [PubMed]
- Liu, F.; Chen, B.; Glettner, B.; Prehm, M.; Das, M.K.; Baumeister, U.; Zeng, X.; Ungar, G.; Tschierske, C. The trapezoidal cylinder phase: A new mode of self-assembly in liquid-crystalline soft matter. J. Am. Chem. Soc. 2008, 130, 9666–9667. [Google Scholar] [CrossRef] [PubMed]
- Chen, B.; Zeng, X.; Baumeister, U.; Ungar, G.; Tschierske, C. liquid crystalline networks composed of pentagonal, square, and triangular cylinders. Science 2005, 307, 96–99. [Google Scholar] [CrossRef] [PubMed]
- Bader, K.; Neidhardt, M.M.; Wöhrle, T.; Forschner, R.; Baro, A.; Giesselmann, F.; Laschat, S. Amino acid/crown ether hybrid materials: How charge affects liquid crystalline self-assembly. Soft Matter 2017, 13, 8379–8391. [Google Scholar] [CrossRef] [PubMed]
- Kirchner, B.; Malberg, F.; Firaha, D.S.; Holl, O. Ion pairing in ionic liquids. J. Phys. Condens. Matter 2015, 27, 463002. [Google Scholar] [CrossRef] [PubMed]
Figure 1.
(top) Structural formula of some ionic liquid crystals (ILCs) with 1:1 stoichiometry (left, Reference [36,37]) and 1:2 stoichiometry (right, Reference [5,38,39,40]). (Bottom) schematic representation of the ion pairs of Gay–Berne (GB) and Lennard-Jones (LJ) particles used in the simulations.

Figure 2.
Dependence of the orientational order parameter, , (top panels) and translational order parameter, , (bottom panels) on the scaled temperature, T*. The left panels refer to the 1:1 stoichiometry; the right panels to the 1:2 stoichiometry. Packing fraction η* = 0.371. H and C refer to heating and cooling runs, respectively.


Figure 3.
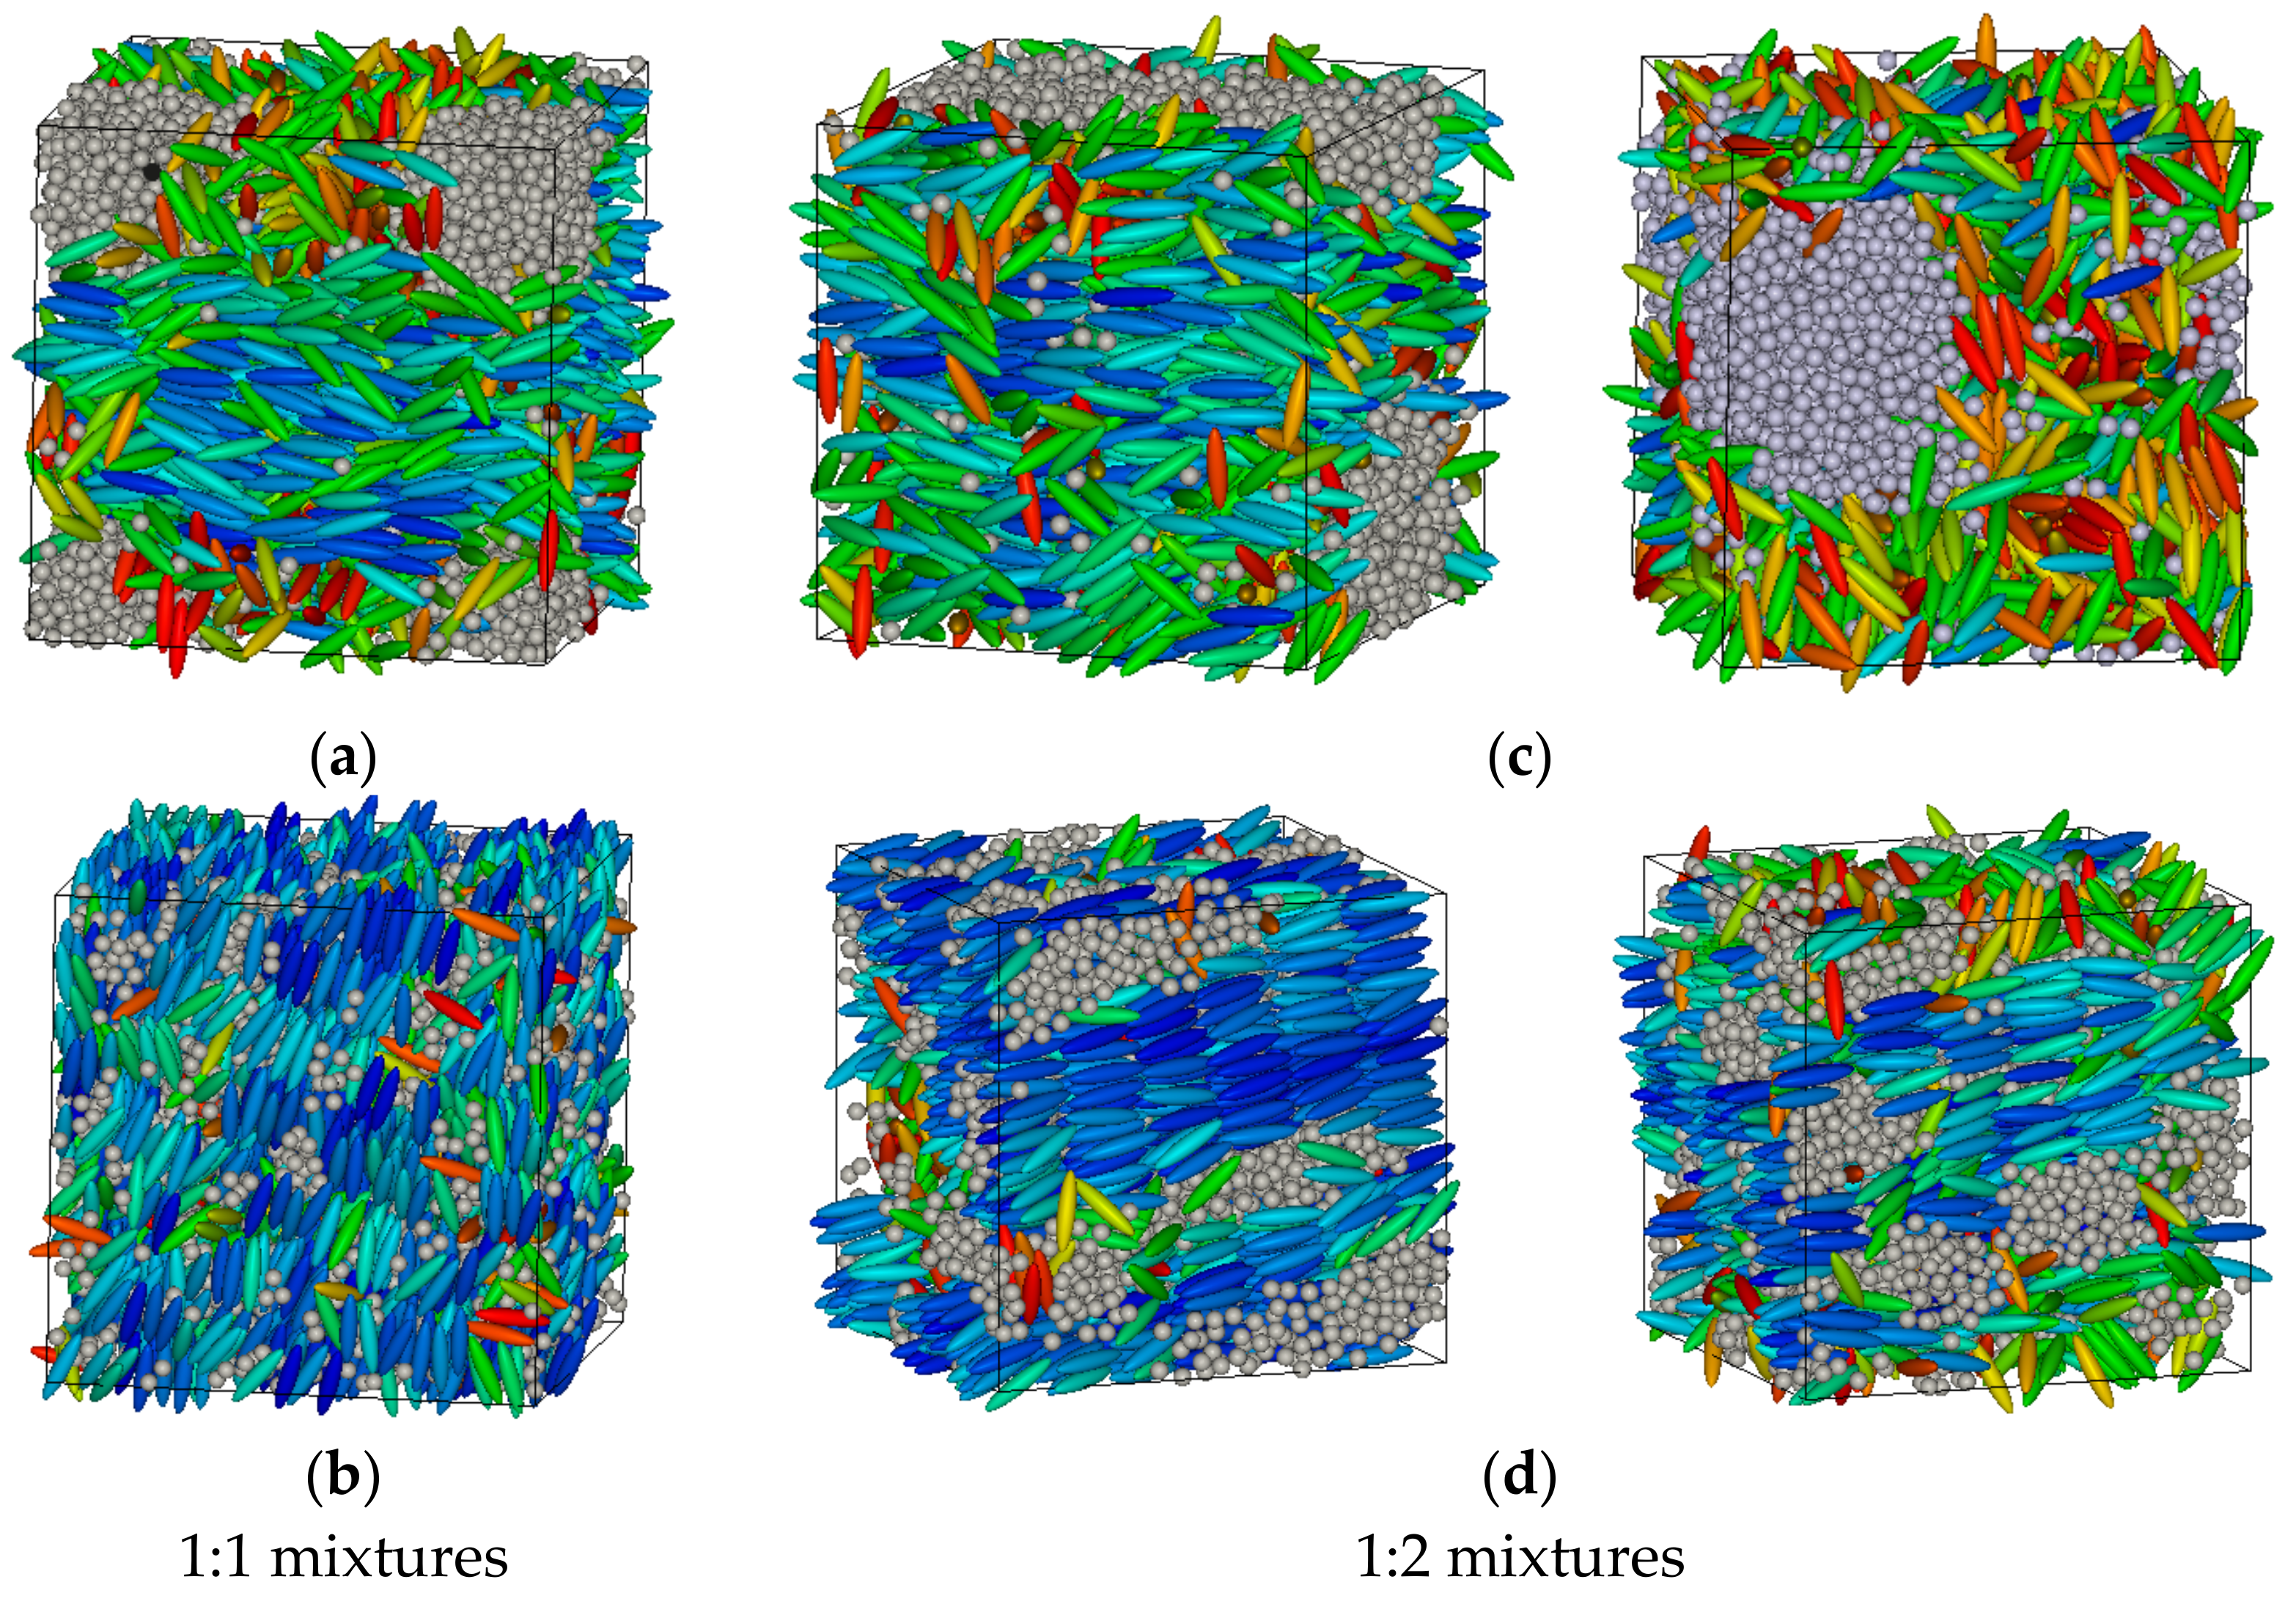
(a) 1:1 mixture: phase-separated nematic GB and isotropic LJ: q* = 0.0/−0.0, T* = 1.10; (b) 1:1 mixture: ionic LC phase with incipient smectic layering of the GB particles: q* = 0.50/−0.50, T* = 0.65. (c) 1:2 mixture: phase separated GB and LJ particles: q* = 0.0/−0.0, T* = 1.10 (left snapshot) and T* = 1.30 (right snapshot); (d) 1:2 mixture: microphase segregation GB and LJ particles: q* = 0.50/−0.25, T* = 0.65 (left snapshot) and T* = 0.70 (right snapshot), with GB particles arranged in layers. Packing fraction η* = 0.371.
Figure 3.
(a) 1:1 mixture: phase-separated nematic GB and isotropic LJ: q* = 0.0/−0.0, T* = 1.10; (b) 1:1 mixture: ionic LC phase with incipient smectic layering of the GB particles: q* = 0.50/−0.50, T* = 0.65. (c) 1:2 mixture: phase separated GB and LJ particles: q* = 0.0/−0.0, T* = 1.10 (left snapshot) and T* = 1.30 (right snapshot); (d) 1:2 mixture: microphase segregation GB and LJ particles: q* = 0.50/−0.25, T* = 0.65 (left snapshot) and T* = 0.70 (right snapshot), with GB particles arranged in layers. Packing fraction η* = 0.371.

Figure 4.
Dependence of the orientational order parameter, , (top panels) and translational order parameter, , (bottom panels) on the scaled temperature, T*. The left panels refer to the 1:1 stoichiometry; the right panels to the 1:2 stoichiometry. Packing fraction η* = 0.428. H and C refer to heating and cooling runs, respectively

Figure 5.
(a) 1:1 mixture: ionic nematic phase: q* = 0.50/−0.50, T* = 0.90; (b) 1:1 mixture: highly ordered crystal/smectic phase: q* = 2.00/−2.00, T* = 0.50. (c) 1:2 mixture: microphase segregated GB and LJ particles: q* = 0.50/−0.25, T* = 0.55 (left snapshot) and T* = 1.00 (right snapshot); (d) 1:2 mixture: microphase segregation GB and LJ particles: q* = 2.00/−1.00, T* = 0.50 (left snapshot) and T* = 0.55 (right snapshot), with GB particles arranged into an hexagonal structure hosting LJ particles inside the channels. We do not use colour-coding here since there is not a director of the phase. Packing fraction η* = 0.428.

Figure 6.
Dependence of the orientational order parameter, , (top panels) and translational order parameter, , (bottom panels) on the scaled temperature, T*. The left panels refer to the 1:1 stoichiometry; the right panels to the 1:2 stoichiometry. Packing fraction η* = 0.514. H and C refer to heating and cooling runs, respectively.

Figure 7.
(a) 1:1 mixture: ionic nematic phase: q* = 0.50/−0.50, T* = 4.00; (b) 1:1 mixture: microphase segregated ionic smectic phase: q* = 0.50, T* = 1.00. (c) 1:2 mixture: ionic nematic phase: q* = 0.50/−0.25, T* = 1.00 (left snapshot) and T* = 2.00 (right snapshot); (d) 1:2 mixture: microphase segregation GB and LJ particles: q* = 2.00/−1.00, T* = 0.30 (left snapshot) and T* = 0.70 (right snapshot), with GB particles arranged to create a hexagonal structure hosting LJ particles inside the channels. Packing fraction η* = 0.514.

Figure 8.
Temperature range of stability of the various systems investigated. (a): packing fraction η* = 0.371, GB:LJ = 1:1; (b) packing fraction η* = 0.371, GB:LJ = 1:2; (c): packing fraction η* = 0.428, GB:LJ = 1:1; (d) packing fraction η* = 0.428, GB:LJ = 1:2; (e): packing fraction η* = 0.514, GB:LJ = 1:1; (f) packing fraction η* = 0.514, GB:LJ = 1:2. Note the different T* scale for the highest packing fraction (e,f).

Figure 9.
Schematic structural unit of the honeycomb arrangement observed for some systems at high packing fraction, high charge and low temperature.
Figure 9.
Schematic structural unit of the honeycomb arrangement observed for some systems at high packing fraction, high charge and low temperature.


Table 1.
Systems investigated in this work.
| ρ*(1:1) | ρ*(1:2) | η* | |
|---|---|---|---|
| Case #1 | 0.261 | 0.332 | 0.371 |
| Case #2 | 0.303 a | 0.383 | 0.428 |
| Case #3 | 0.363 a | 0.460 | 0.514 |
a System investigated in [33].
Table 2.
Systems investigated in this work.
| GB:LJ = 1:1 | GB:LJ = 1:2 | |||
|---|---|---|---|---|
| |q*| | Phases | q* | Phases | η* |
| 0.0 a | Sm–1.05–N–1.15–Iso | 0.0/0.0 a | Sm–1.10–Iso | 0.371 |
| 0.5 | Sm–0.70–N–0.75–Iso | 0.50/−0.25 | Sm–0.70–Iso | |
| 2.0 | Cr–0.50–Iso | 1.00/−0.50 | Iso | |
| 0.0 a | Sm–1.35–N–1.84–Iso | 0.0/0.0 a | Sm–1.5–N–2.0–Iso | 0.428 |
| 0.5 | Sm−0.90–N–1.25–Iso | 0.50/−0.25 | Sm–1.0–N–1.10–Iso | |
| 2.0 | Cr–0.65–Iso | 1.00/−0.50 | Cr–0.65–Iso | |
| 2.00/−1.00 | Cr–0.55–Iso | |||
| 0.0 a | Sm–1.9–N–5.7–Iso | 0.0/0.0 a | Sm–2.05–N–4.30–Iso | 0.514 |
| 0.5 | Sm–1.4–N–4.9–Iso | 0.50/−0.25 | Sm–1.0–N–3.1–Iso | |
| 2.0 | Sm–0.75–N–2.25–Iso | 1.00/−0.50 | Sm–0.75–N–2.2–Iso | |
| 2.00/−1.00 | Cr–1.0–Iso | |||
a For non-charged systems we always observe a phase separation between GB and LJ particles.
© 2018 by the authors. Licensee MDPI, Basel, Switzerland. This article is an open access article distributed under the terms and conditions of the Creative Commons Attribution (CC BY) license (http://creativecommons.org/licenses/by/4.0/).
Share and Cite
MDPI and ACS Style
Margola, T.; Satoh, K.; Saielli, G. Comparison of the Mesomorphic Behaviour of 1:1 and 1:2 Mixtures of Charged Gay-Berne GB(4.4,20.0,1,1) and Lennard-Jones Particles. Crystals 2018, 8, 371. https://doi.org/10.3390/cryst8100371
AMA Style
Margola T, Satoh K, Saielli G. Comparison of the Mesomorphic Behaviour of 1:1 and 1:2 Mixtures of Charged Gay-Berne GB(4.4,20.0,1,1) and Lennard-Jones Particles. Crystals. 2018; 8(10):371. https://doi.org/10.3390/cryst8100371
Chicago/Turabian StyleMargola, Tommaso, Katsuhiko Satoh, and Giacomo Saielli. 2018. "Comparison of the Mesomorphic Behaviour of 1:1 and 1:2 Mixtures of Charged Gay-Berne GB(4.4,20.0,1,1) and Lennard-Jones Particles" Crystals 8, no. 10: 371. https://doi.org/10.3390/cryst8100371
Note that from the first issue of 2016, this journal uses article numbers instead of page numbers. See further details here.