Article

Fe-Loaded Montmorillonite/TiO2 Composite as a Promising Photocatalyst for Selective Conversion of Glucose to Formic Acid under Visible-Light Irradiation

1
Department of Earth Resources Engineering, Kyushu University, Fukuoka 819-0395, Japan
2
Nanjing Institute of Environmental Sciences, Ministry of Ecology and Environment of the People’s Republic of China, Nanjing 210041, China
*
Author to whom correspondence should be addressed.
Crystals 2023, 13(12), 1609; https://doi.org/10.3390/cryst13121609
Submission received: 27 October 2023 / Revised: 15 November 2023 / Accepted: 18 November 2023 / Published: 21 November 2023
(This article belongs to the Special Issue Synthesis and Properties of Photocatalysts)

Abstract

:
The development of efficient and inexpensive photocatalysts for the production of high-value chemicals from the photoreforming of biomass is a highly attractive strategy to establish the production of chemicals from sustainable resources. In this work, Fe-loaded montmorillonite/TiO2 composite (Fe-Mt/TiO2), pure TiO2, Mt/TiO2 and Mt/Fe-TiO2 were fabricated and further utilized as photocatalysts for the production of formic acid from glucose under visible-light irradiation. Among the as-prepared composites, the Fe-Mt/TiO2 exhibited the highest glucose conversion (83%), formic acid production (44%) and formic acid selectivity (53%). The effective heterojunction between Fe-Mt and TiO2 is proposed to describe the superior photocatalytic activity of Fe-Mt/TiO2, which effectively suppressed the recombination of the photogenerated electrons and holes during the reaction. Mechanism investigations suggested that the selective photocatalytic oxidation of glucose into formic acid by Fe-Mt/TiO2 mainly occurred through an α-scission reaction pathway, driven by the main active species as O2 and 1O2. The research findings in this work suggested that the Fe-Mt/TiO2 composite can be applied as a low-cost, easy-to-prepare, reusable and selective photocatalyst for sustainable synthesis of high-value chemicals from biomass-derived substrates.

1. Introduction

Global energy demand is rapidly rising due to the growth of the population and economy, with a projected 50% increase by 2050. Currently, fossil-based energies have been dominantly utilized and contributed over 85% of total energy demand [1]. However, fossil resources are nonrenewable, and the widespread use of fossil fuel has led to significant environmental concerns. Consequently, there is an urgent need to explore sustainable alternative energy resources. Lignocellulosic biomass, abundant and renewable carbon resources [2], has been considered as a potential alternative to fossil resources for overcoming the energy and environmental concerns. Moreover, transitioning to the production of chemicals and fuels from lignocellulosic biomass demonstrates a promising step towards achieving carbon neutrality. Previous works showed that various fuels and chemicals including alkanes [3], organic acids [4,5], furans [6,7], and ethanol [8] can be synthesized from lignocellulosic biomass as feedstocks. It is worth mentioning that glucose, a simple model compound of biomass, has been considered as a potential alternative to lignocellulose, which has a complex structure, in the investigation of photoreforming mechanisms [9].
Formic acid is a versatile organic building block chemical and can be used in several applications such as food additives, bactericide and in various industries including dyes, textile, rubber and leather industries [10]. The global formic acid production reached one million metric tons (Mt) in 2019, and the market is anticipated to expand with an annual rate of approximately 3% [11,12]. Moreover, the global formic acid consumption in 2021 was around 870.03 kilotons, with a projected increase of around 4% over the next six years [13]. In general, two main processes have been intensively developed for the production of formic acid from lignocellulosic biomass, which are wet oxidation and catalytic wet oxidation. Typically, the addition of oxidant (H2O2) and alkaline salt (NaOH or KOH) is conducted in the wet oxidation process to activate the oxidation reaction and prevent the undesired decomposition of formic acid [14]. For catalytic wet oxidation, the lignocellulosic biomass was selectively oxidized into formic acid promoted by the catalyst with the gaseous O2 supply [15]. More importantly, the wet oxidation and catalytic wet oxidation are energy consumption processes and mostly operated at high temperature (>150 °C) and pressure (>3 MPa of O2) to achieve high yield [1]. In contrast to these energy-intensive processes, the photocatalytic conversion of lignocellulosic biomass has been considered as a promising route because it can possibly be driven by solar light at the evaluated temperature (<100 °C) and atmospheric pressure [5]. In the photocatalytic processes, the photon energy is utilized instead of thermal energy, demonstrating several advantages over the conventional methods such as mild reaction operations, high efficiency, cost-effectiveness and great cleanness [16].
TiO2 is the most extensively employed photocatalyst due to its robust oxidizing capabilities, non-toxicity, low cost and chemical stability [17]. Thus, many research works have developed various methods for fabricating highly efficient TiO2-based photocatalysts with tailored properties to enhance their photocatalytic performance such as TiO2 nanoparticles [18], doped-TiO2 with other elements (Fe-TiO2 [19]) and combined TiO2 with other semiconductor materials [20]. Because the photocatalytic reaction happens on the surface of the photocatalysts, the immobilization of TiO2 particles on porous materials such as natural clays can also improve the photoactivity performance. Previous works demonstrated that several kinds of clays have been used to immobilize TiO2 particles including sepiolite, bentonite, zeolite and montmorillonite [17,21].
Recently, montmorillonite (Mt)-based composites with TiO2 have gained attention as promising photocatalysts. This is attributed to the properties of Mt such as abundant availability, substantial two-dimensional surface area, cost-effectiveness, low toxicity, remarkable chemical stability and environmentally friendly characteristics [21,22]. Furthermore, our previous works demonstrated that the incorporation of Fe3+ into Mt can enable the photocatalytic activity of Fe-Mt materials. This phenomenon was possibly caused by the creation of a mid-gap energy level through the d orbital of the doped iron (suggested by the molecule simulation) [22,23], which subsequently enhances the photocatalytic efficiency. Interestingly, a previous work also reported that the presence of Fe3+ or Fe2+ (sensitizing ions) in the photocatalytic materials can enhance the photocatalytic conversion of biomass into oxygenated hydrocarbon. Also, using mixture solvents of aqueous media and/or acetonitrile in the photocatalytic process can improve the selectivity oxidation of biomass [5]. Thus, the immobilization of TiO2 particles on the Fe-Mt (acting as a photocatalyst support) can yield highly efficient Fe-Mt/TiO2 photocatalysts due to the formation of Fe-Mt/TiO2 heterostructure. This innovative material showed significant potential for diverse photocatalytic applications in addressing global problem challenges.
Herein, the Fe-Mt/TiO2 composite was prepared and further applied as a photocatalyst for transformation of glucose to formic acid under visible-light illumination. Photocatalytic activity was determined in a mixture solvent of aqueous/acetonitrile solution. Additionally, the photocatalytic performance results were also compared to those achieved using pure TiO2, Mt/TiO2 and Mt/Fe-TiO2. The improved light absorption capability and the heterostructure between Fe-Mt and TiO2 contributed to enhance the photocatalytic performance. Furthermore, optimal parameters for the production of formic acid and possible mechanism pathways were also explored and discussed.

2. Materials and Methods

2.1. Materials and Chemicals

Iron (III) nitrate nonahydrate (Fe(NO3)3·9H2O, 99%), hydrochloric acid (HCl, 35.0–37.0%), nitric acid (HNO3, 70.0–71.0%) and sodium hydroxide (NaOH, 97%) were supplied by FUJIFILM Wako Pure Chemical Corp., Japan. Titanium (IV) chloride (TiCl4, 99%) was bought from KISHIDA Chemical Co., Ltd., Japan. The Mt material ((Na0.97Ca0.08)+1.13 (Si7.68Al0.32)(Al2.94FeIII0.25FeII0.03Mg0.78)O20(OH)4−1.13·nH2O, Kunipia-F) with the cation exchange capacity (CEC) of 1.114 mmolg−1 was supplied from Kunimine Industries Co., Ltd., Tokyo, Japan. All chemicals were utilized as received without further purification. All solutions in this work were prepared using deionized (DI) water with resistivity > 18.5 MΩcm−1 (Synergy UV Water Purification System, Millipore, MA, USA) as a solvent.

2.2. Preparation of Mt/TiO2, Fe-Mt/TiO2 and Mt/Fe-TiO2 Composites

The Mt/TiO2, Fe-Mt/TiO2 and Mt/Fe-TiO2 composites were systematically prepared following the previous report with some modifications [23]. Typically, an acidified Mt (H-Mt) was synthesized by dispersing Mt powder (2 g) in 200 mL of DI water. Then, the suspension was adjusted to a pH of 2 using 0.1 M of HNO3 or 0.01 M of NaOH and stirred at 500 rpm at room temperature for one hour. Then, the solid H-Mt was separated from an aqueous media by centrifugation, followed by washing with DI water and freeze-drying. Similarly, the Fe3+-doped Mt (Fe-Mt) sample was fabricated in a similar procedure, but the Fe(NO3)3·9H2O with the concentration equivalent to 0.114 mmol Fe/gMt was added into the Mt suspension. All samples were ground and sieved (<107 µm) prior to further use.
To prepare the Ti(OH)4/TiO2 sol–gel precursor, the TiCl4 was dropwise added into 4.5 mL of HCl (1 M) aqueous solution to obtain the final concentration of 0.83 M. Then, the solution was stirred at 500 rpm for one hour and then aged for 6 h at room temperature under ambient air to obtain a transparent solution. After that, the pH of the Ti(OH)4/TiO2 sol–gel solution was adjusted to a pH of 2 using NaOH aqueous solution. Also, the Fe-Ti(OH)4/TiO2 sol–gel was prepared following the identical procedure, but the Fe(NO3)3·9H2O with stochiometric equivalence of 0.114 mmol Fe/g(Mt/TiO2) was introduced into the Ti(OH)4/TiO2 solution before stirring and aging.
In order to synthesize Mt/TiO2 by heterocoagulation, the suspension of Mt aqueous solutions (1% w/v) was firstly prepared, which was subsequently added with the Ti(OH)4/TiO2 sol–gel. Afterwards, the above suspension was stirred at 500 rpm for 30 min to obtain a homogenous dispersion and then thermally heated at 70 °C for 15 h by left standing in the oven. Later, the solid product was extracted from the liquid media by centrifugation, washed with DI water and freeze-dried at −40 °C and 20 Pa (Freeze-dryer, FDU-1200, EYELA, Bohemia, NY, USA). The preparation of Fe-Mt/TiO2 and Mt/Fe-TiO2 composites were also conducted using similar routes, but the Fe-Mt aqueous suspension (1% w/v) and the Fe-Ti(OH)4/TiO2 sol–gel were employed as starting precursors for Fe-Mt/TiO2 and Mt/Fe-TiO2 samples, respectively. Theoretically, the TiO2 content in the Mt/TiO2-based composites was approximately 30 wt%, consistent with the results from XRF analysis (Table S1). The procedure for preparation of pure TiO2 was followed using the same procedure, using Ti(OH)4/TiO2 sol–gel as precursors without adding the Mt aqueous suspension. All as-synthesized samples were ground and sieved (<107 µm) prior to further use. The concentration of Fe3+ in the supernatant after preparation of all Fe3+-loaded samples was determined by inductive plasma–optical emission spectroscopy (ICP–OES, Perkin-Elmer 8500, Waltham, MA, USA). The Fe3+ concentration in the supernatant was lower than the detection limit of the ICP–OES, suggesting that stoichiometric equivalence of Fe3+ in all Fe3+-loaded samples is entirely incorporated in the solid matrixes.

2.3. Sample Characterization

The composition of Fe-Mt/TiO2 and Mt/Fe-TiO2 composites was examined by X-ray fluorescence spectroscopy (XRF) using an XRF spectrometer (Shimadzu-EDX800, Kyoto, Japan). The crystal phases of the samples were determined by X-ray diffraction (XRD) analysis using an Ultima IV X-ray diffractometer (Rigaku, Tokyo, Japan) with Cu Kα radiation operating at 40 kV and 40 mA and a scanning rate of 2°/min. The morphology and the elemental dispersion of the samples were examined by scanning electron microscopy with energy-dispersive X-ray spectroscopy (SEM–EDX, FlexSEM1000II and AZteclive lite FX, Hatachi, Tokyo, Japan). The optical absorption properties of the samples were investigated by a UV–vis diffuse reflectance spectroscopy (UV–vis DRS, UV-2540, Shimadzu, Japan), and BaSO4 was used as a reference. Then, the obtained UV–vis DRS spectrum was employed to calculate the energy band gap (Eg) values of the samples following Tauc’s plot method [24]. A solid-state photoluminescence (PL) measurement was performed on a spectrofluorometer (JASCO F-6600, Tokyo, Japan) at room temperature with an excitation wavelength of 320 nm. Transient photocurrent and electrochemical impedance spectroscopy (EIS) measurements were conducted on a Solartron 1280C electrochemical test system (Solartron analytical, Leicester, UK) in 0.1 M of NaCl electrolyte solution (pH = 2 adjusted by using 0.1 M of HCl) to inspect photoelectrochemical properties of the samples. The as-prepared samples were coated onto a Pt sheet electrode (1 cm2) as the working electrode, whereas the Pt wire and Ag/AgCl (in 0.1 M of NaCl) are applied as the counter and the reference electrodes, respectively.

2.4. Photocatalytic Experiments

All experiments of the photocatalytic reaction were conducted in a sealed quartz flask (50 mL) under visible-light irradiation (500 W Xe lamp, 6258, USHIO, Tokyo, Japan) with the UV-cutoff filter (λ < 380 nm, ASAHI SPECTRA, Super Cold Filter 750) under magnetic stirring at 300 rpm. In a typical run, 25 g of glucose and 25 mg of the sample were put in the reactor with 25 mL of the mixture solvent (acetonitrile/water, 90% v/v). Prior to performing the reaction at a desired temperature, the reactor was sealed with the rubber septum. Then, the reaction was stirred at 300 rpm under dark condition for 30 min to allow the equilibrium of adsorption–desorption of glucose on the sample surface. At the specific reaction time, the solution in the reactor was taken and filtered (0.22 µm filter PTFE membrane). The oxidized products and remaining glucose concentrations were quantified by using a high-performance liquid chromatography system (HPLC, CO-2065, JASCO, Tokyo, Japan) equipped with an Aminex HPX-87H (BIO-RAD, Hercules, CA, USA) column and a refractive index detector (RI-2031 Plus, Tokyo, Japan) for analysis of sugar together with a UV–vis detector (UV-2075 Plus, JASCO, Tokyo, Japan) at 210 nm for analysis of possible organic acid products. The HPLC system was performed at 50 °C and a flow rate of mobile phase (5 mM of H2SO4 aqueous solution) of 0.6 mL·min−1 in the isocratic mode. The glucose conversion and formic acid yield were calculated by the following formulas [25,26].
Glucose   conversion % = ( 1   -   (   Concentration   of   glucose   after   reaction   ( M ) Initial   concentration   of   glucose   ( M ) ) ) × 100  
Formic   acid   yield % = (   1   ×   Concentration   of   formic   acid   after   reaction   ( M ) 6   ×   Initial   concentration   of   glucose   ( M )   ) × 100  

3. Results and Discussion

3.1. Sample Characterization

The XRD patterns of pure TiO2, Mt/TiO2, Fe-Mt/TiO2 and Mt/Fe-TiO2 samples are shown in Figure 1. The pure TiO2 demonstrated the typical diffraction peaks at 25.4° and 39.7°, which are corresponded to the 101 and 004 planar planes of anatase TiO2 (JCPDS 01-071-1168) [27], respectively. Notably, a broad peak of brookite TiO2 (121) at 2θ of 30.3° was also observed in the XRD pattern of pure TiO2 (JCPDS 01-075-1582) [27] and no rutile peaks. By using the Rietveld refinement method, the contents of anatase and brookite TiO2 in pure TiO2 sample were found to be 93% and 7%, respectively. The XRD patterns of Mt-based samples show a strong peak around 2θ = 6.4–6.5° due to the d(001) basal spacing reflection of the montmorillonite. Additionally, diffraction peaks at 19.8° and 35.2° attributed to the 003 and 101 planar planes of montmorillonite (JCPDS 13-0259) [27], respectively, were also found in the XRD patterns. It is important to note that a single layer of Mt has an interlayer space of 0.96 nm (from the d value of the 001 planar plane). Consequently, following the exclusion of a single Mt layer (Scheme S1), the interlayer spaces of Mt/TiO2, Fe-Mt/TiO2 and Mt/Fe-TiO2 were determined to be 0.41 nm, 0.43 nm and 0.44 nm, respectively. This phenomenon could be attributed to the smaller size of TiO2 particles formed on the surface of each Mt layer in the Fe-Mt/TiO2 compared to that of Mt/Fe-TiO2. No diffraction peaks corresponding to iron oxide compounds (Fe2O3 or Fe3O4) were found in the XRD patterns of Fe-loaded samples, suggested that the Fe ion was incorporated in the Mt layer or TiO2 crystal structure. Interestingly, the diffraction peak of 110 rutile TiO2 (JCPDS 01-076-0324) [27] were found at 28.2°–28.4° together with a peak of anatase TiO2 (101) in XRD patterns of Mt/TiO2, Fe-Mt/TiO2 and Mt/Fe-TiO2 samples (as seen in Figure S1). The contents of anatase and rutile TiO2 were estimated to be 52% and 48% for Mt/TiO2, 64% and 36% for Fe-Mt/TiO2 and 84% and 16% for Mt/Fe-TiO2, respectively. This result suggested that the presence of Fe3+ in both Fe-Mt and Fe-TiO2 has a strong impact on the formation of anatase phase, possibly due to the repulsion between the positively charged Fe3+- and Ti4+-containing groups linked to Mt layers by interacting with their negative charge [23].
The morphology of Mt/TiO2, Fe-Mt/TiO2 and Mt/Fe-TiO2 samples are displayed in Figure 2a–d. As seen in Figure 2a, the morphology of pure TiO2 is nearly spherical-shaped, with a size ranging from 5 µm to 20 µm, which is similar morphology to the TiO2 spherical shape prepared by hydrolysis of TiCl4 solution with HCl [28]. Interestingly, the size of TiO2 particles was reduced when incorporated into the Mt layer of Mt/TiO2, Fe-Mt/TiO2 and Mt/Fe-TiO2 samples. As seen in TEM images of Fe-Mt/TiO2 in Figure S2, the particle size of TiO2 particles on the Mt layer were in the range of an estimated 7–19 nm. This result suggests that Mt can serve as the supporting material for TiO2 particle dispersion to mitigate the particle agglomeration and further enhance the photocatalytic activity. SEM–EDX elemental mapping analysis of Fe-Mt/TiO2 (Figure S3) and Mt/Fe-TiO2 (Figure S4) samples demonstrated that the Ti, Fe, Mg, Al, Si and O existed with good dispersion, which can further suggest that the TiO2 nanoparticles intensively covered the surface of the Mt supporting materials. Moreover, the uniform dispersion of Fe signals in the Fe-Mt/TiO2 and Mt/Fe-TiO2 samples implied the good distribution of Fe throughout the Mt phase, TiO2 phase and the Mt-TiO2 interface.
The UV–vis DRS was utilized to examine the optical properties of the pure TiO2, Mt/TiO2, Fe-Mt/TiO2 and Mt/Fe-TiO2 samples. As seen in Figure 3a, the pure TiO2 and Mt/TiO2 samples exhibited UV-region adsorption edges, whereas Fe-Mt/TiO2 and Mt/Fe-TiO2 samples showed a slight shift towards the visible region, potentially enhancing the photocatalytic activity. To estimate the band gap energy (Eg) of all samples, the data were processed by Tauc’s equation (Equation (3)) [24,29].
αhv = A (hvEg)n/2
where α, h, v, A and Eg are the absorption coefficient, Plank constant, the frequency of light, a proportionality constant and the band gap energy, respectively. The “n” value is 1 for the direct transition semiconductor and 4 for indirect transition of the semiconductor. Figure 3b shows the Tauc plot of all samples, and the Eg values were about 3.20, 3.31, 3.07 and 3.01 for the pure TiO2, Mt/TiO2, Fe-Mt/TiO2 and Mt/Fe-TiO2 samples, respectively. Additionally, reversed double-beam photoacoustic spectroscopy (RDB-PAS) [30] was also utilized to estimate the Eg of Fe-Mt/TiO2 and Mt/Fe-TiO2, and the obtained results (Figure S5) were comparable to those estimated by Tauc’s equation (3.06 eV for Fe-Mt/TiO2 and 3.01 eV for Mt/Fe-TiO2). The higher Eg of Mt/TiO2 than that of pure TiO2 may be due to the quantum confinement effect, consistent with previous works where the Eg values of TiO2/montmorillonite composites were greater than those of TiO2 prepared in their works [31,32]. Interestingly, both Fe-Mt/TiO2 and Mt/Fe-TiO2 samples exhibited smaller Eg values than that of pure TiO2 because the presence of Fe3+ can generate a new Fermi level between the energy band of Mt and TiO2 [33,34].
Photoluminescence (PL) analysis was conducted to study the emission properties and the migration and recombination of the photogenerated electron–hole pairs. The PL intensity of Mt/TiO2 was significantly decreased compared to that of the pure TiO2 (Figure 3c), which was possibly due to the improved suppression of photogenerated charge recombination by the Mt supporting material. Furthermore, PL intensities of Fe-Mt/TiO2 and Mt/Fe-TiO2 were lower than those of the pure TiO2, Mt/TiO2, suggesting that the presence of Fe3+ in Mt and TiO2 in both samples can mitigate recombination of the photogenerated electron–hole pairs. Notably, the Fe-Mt/TiO2 exhibited lower PL intensity than that of Mt/Fe-TiO2, indicating that the Fe-Mt component played an important role to migrate and suppress the photogenerated charge carriers. A previous work reported that incorporation of Fe3+ in clay is able to demonstrate the photocatalytic activity, suggesting that Fe-Mt can serve as a photocatalytic supporting material [23,34]. Thus, the heterojunction between Fe-Mt and TiO2 could be constructed in Fe-Mt/TiO2 and further facilitate the migration and suppression of the photogenerated charge carriers and improve the photocatalytic performance. Conversely, there should be no formation of a Mt/Fe- heterojunction in the Mt/Fe-TiO2, as unmodified Mt was employed as a non-photoactive supporting material for the dispersion of Fe-TiO2 particles.
The transient photocurrent responses under chopped irradiation and EIS were further investigated to study the migration and generation of electron in all samples. As seen in Figure 4a, the photocurrent density exhibited a gradual increase in the order of Fe-Mt/TiO2 > Mt/Fe-TiO2 > Mt/TiO2 > pure TiO2. This indicates improved charge migration in the composite materials compared to pure TiO2 and enhanced charge transfer in Fe-Mt/TiO2 compared to Mt/Fe-TiO2. In addition, in EIS Nyquist diagrams (Figure 4b), the Mt-based composites displayed a smaller arc radius than pure TiO2, which suggested a lower charge transfer resistance (Table S2) than that of pure TiO2. Similarly, the Fe-Mt/TiO2 has a smaller arc radius than that of Mt/Fe-TiO2, indicating that the Fe-Mt/TiO2 has weaker resistance for charge transportation than Mt/Fe-TiO2 [26].

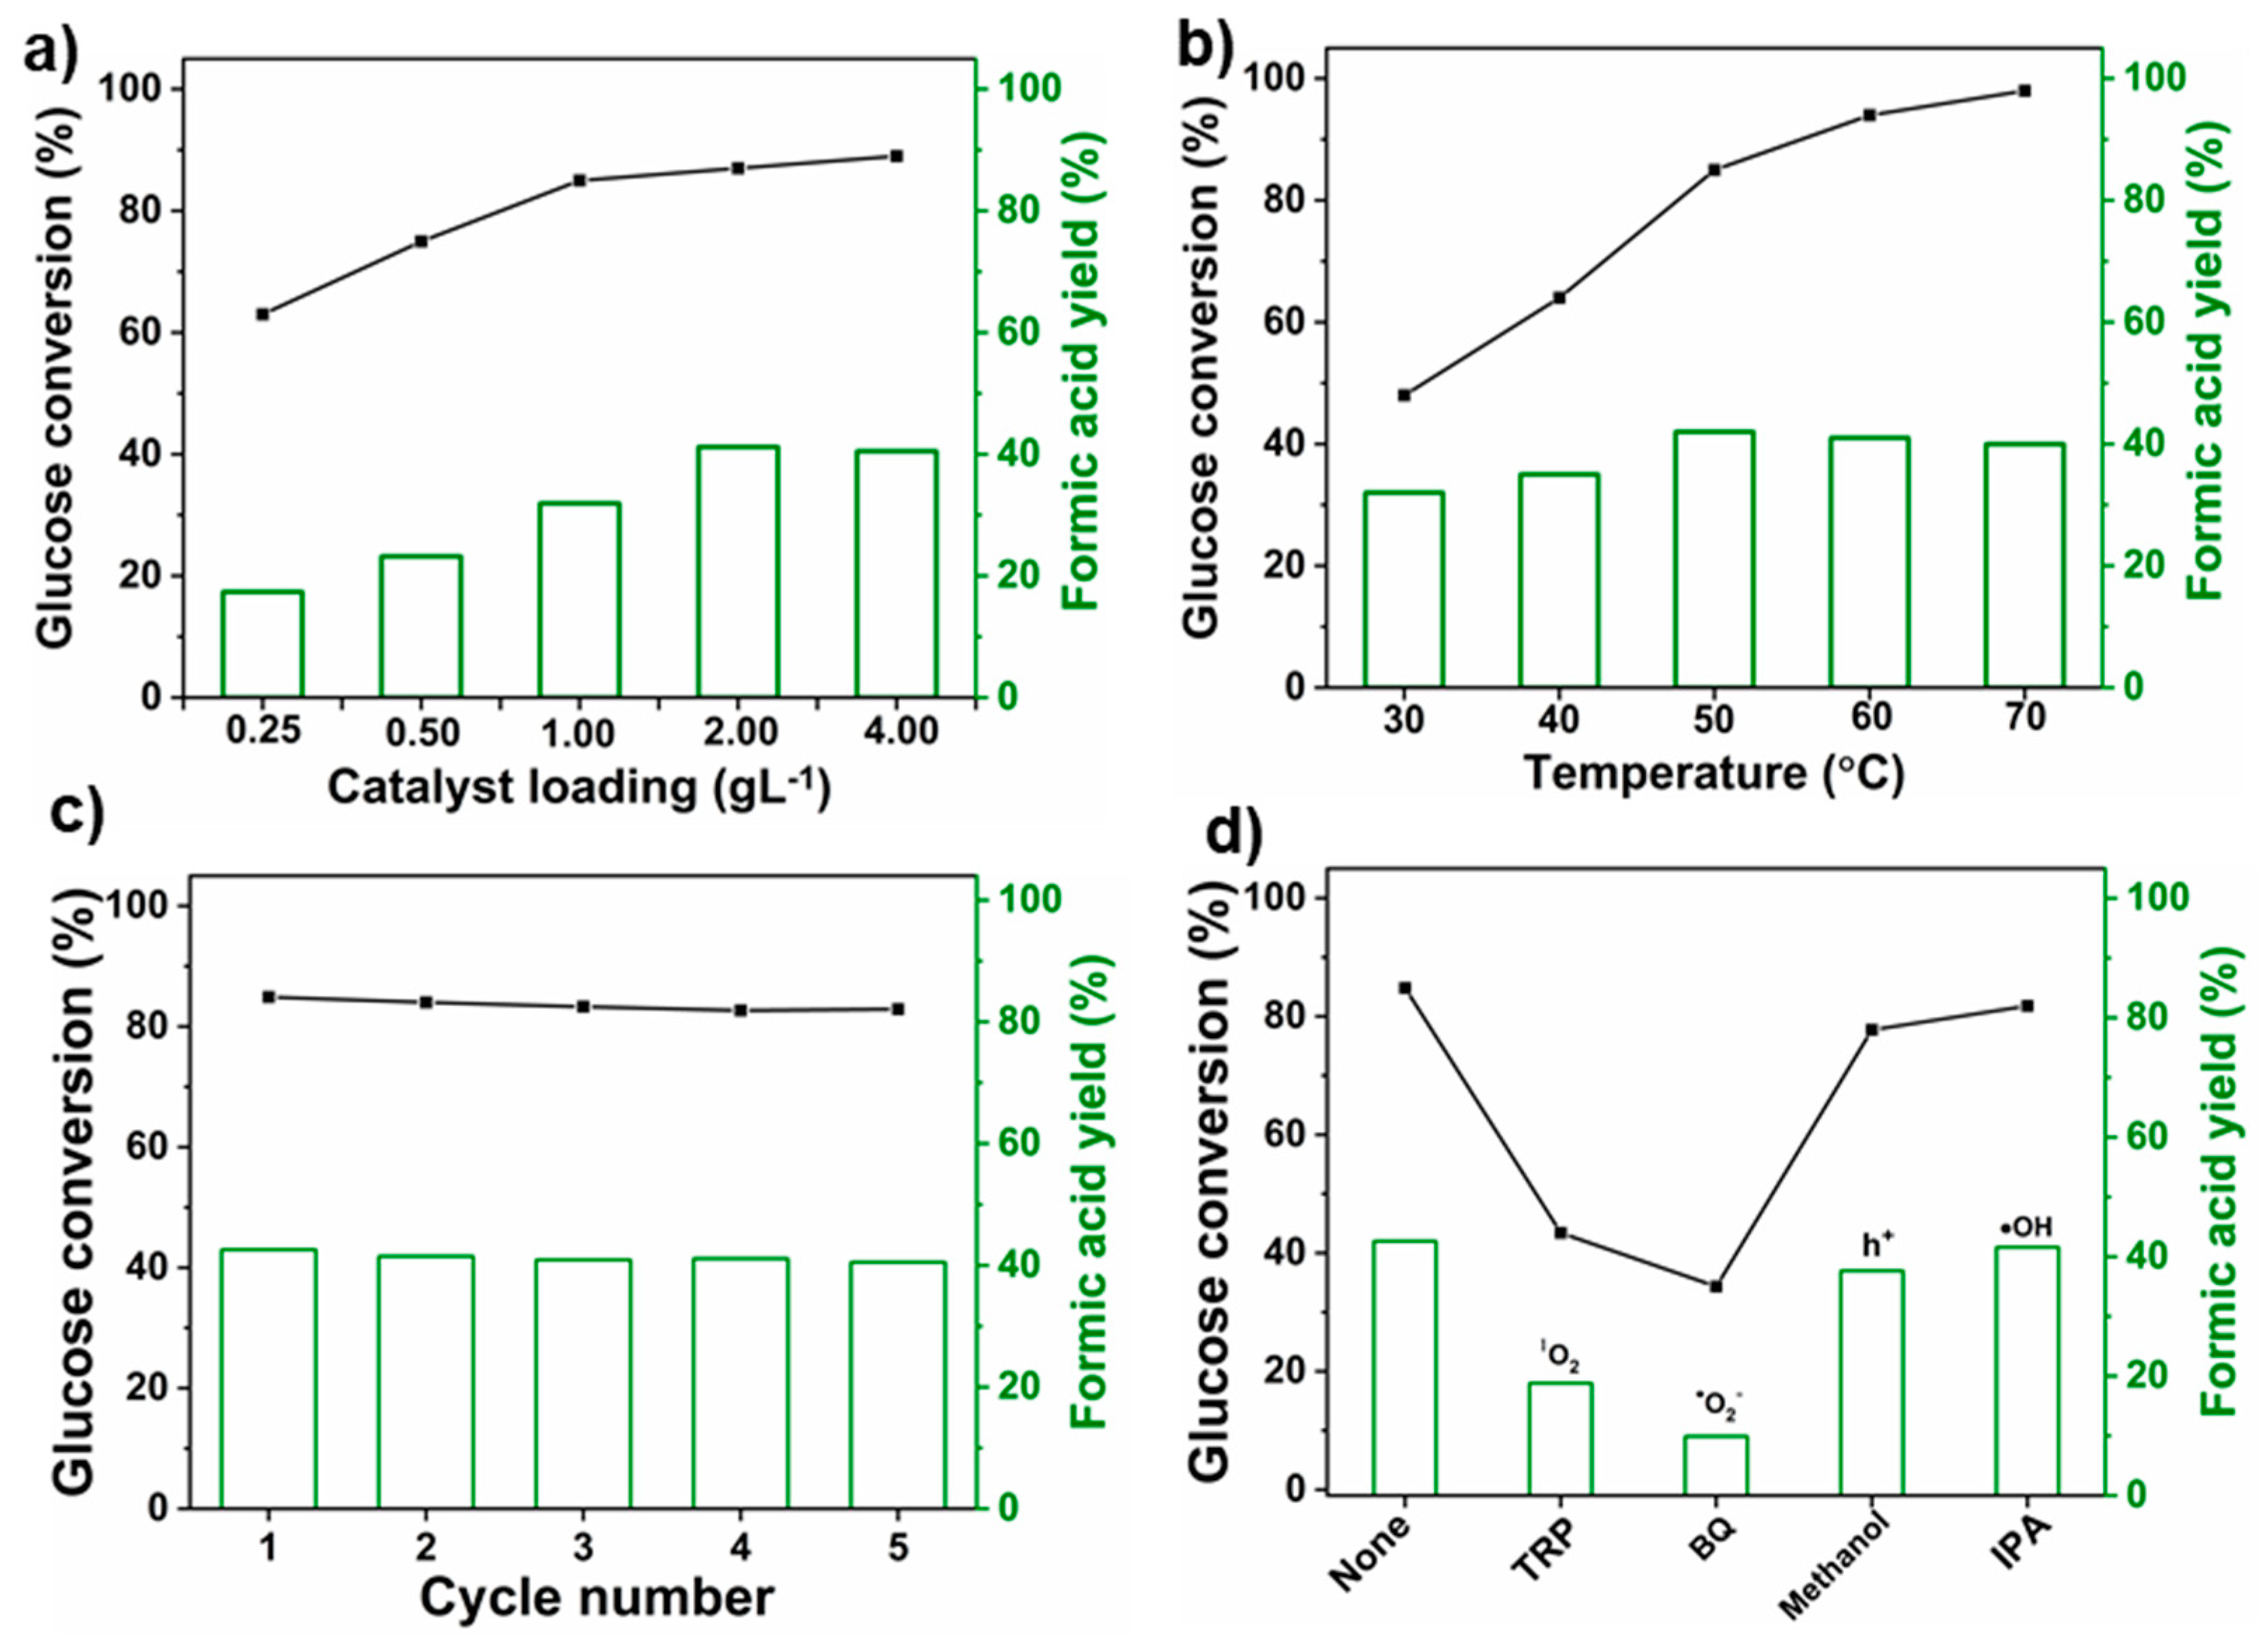
3.2. Photocatalytic Performance on Formic Aicd Production from Glucose

The photocatalytic activities of the pure TiO2, Mt/TiO2, Fe-Mt/TiO2 and Mt/Fe-TiO2 under visible-light irradiation were evaluated for the conversion of glucose to formic acid in mixture solvent (acetonitrile/water, 90 vol%). The glucose conversion, formic acid yield and formic acid selectivity after a 2 h reaction at 50 °C are reported in Figure 5a. It is worth mentioning that pristine Mt demonstrated no photocatalytic oxidation of glucose. Clearly, the incorporation of TiO2 particles into the Mt layer in Mt/TiO2 led to an enhanced photocatalytic performance. The Mt/TiO2 exhibited 60% glucose conversion and 13% formic acid yield, surpassing the performance of pristine TiO2, which achieved 58% of glucose conversion and 7% of formic acid production. This enhancement can be attributed to the smaller size of TiO2 particles and the better photogenerated charge transportation within the Mt/TiO2 composite compared to pure TiO2. Interestingly, the Fe-Mt/TiO2 composite demonstrated superior photocatalytic performance, yielding 83% glucose conversion and 44% formic acid yield compared to Mt/Fe-TiO2, which produced 78% glucose conversion and 38% formic acid production. In addition, the formic acid selectivity was increased following the order Fe-Mt/TiO2 (53%) > Mt/Fe-TiO2 (49%) >Mt/TiO2 (21%) > TiO2 (12%), which implied that the incorporation of Fe3+ in Mt and TiO2 components can also boost the photocatalytic performance and the formic acid selectivity, which is consistent with the UV–vis DRS, PL, photocurrent and EIS results. The better photocatalytic performance of Fe-Mt/TiO2, in comparison to Mt/Fe-TiO2, is mainly attributed to the presence of Fe3+ in the Mt layer, enabling the formation of an Fe-Mt/TiO2 heterojunction in the Fe-Mt/TiO2 composite. Conversely, in Mt/Fe-TiO2, the Mt component serves merely as a support without photocatalytic contribution. The possible intermedia products during the photocatalytic glucose conversion by Fe-Mt/TiO2 were investigated using HPLC analysis based on previous research. As seen in Figure 5b,c, the HPLC chromatograms obtained from the refractive index (RI) detector revealed the presence of glucose and arabinose, while the HPLC chromatograms from the UV detector detected formic acid after a 30 min reaction. As the photocatalytic reaction proceeded, the peak intensity of glucose tended to decrease, whereas the peak intensities of arabinose and formic acid continuously increased along with the reaction time. Based on the HPLC results, arabinose was concluded to be the main product intermediated in the photocatalytic glucose conversion to formic acid by the Fe-Mt/TiO2 composite, which is similar to the previous work [35].
According to the results mentioned earlier, it is clear that the Fe-Mt/TiO2 composite produced the highest amount of formic acid. As a result, additional experiments were conducted using Fe-Mt/TiO2 in the photocatalytic conversion of glucose to investigate the optimal conditions for formic acid production. Figure 6a demonstrates the influence of catalyst loading on the photocatalytic glucose conversion to formic acid. The glucose conversion and formic acid yield were significantly increased from 62% to 74% and 18% to 25%, respectively, when the catalyst loading was increased from 0.25 to 0.5 gL−1. The maximum glucose conversion (83%) and formic acid yield (44%) were obtained using the catalyst loading of 2.0 gL−1. A further increase in catalyst loading for 2.0 to 4.0 gL−1 led to less improvement of glucose conversion (85%) and a slight decrease in the formic acid production (38%), which could be caused by the decomposition of formic acid with the excess amount of catalysts [1].
Next, the effect of the reaction temperature on the photocatalytic conversion of glucose to formic acid by Fe-Mt/TiO2 was investigated at temperatures ranging from 30 to 70 °C. As seen in Figure 6b, the glucose conversion was much improved, from 22% at 30 °C to 92% at 60 °C. After the reaction temperature was further increased to 70 °C, the glucose conversion slightly increased to almost 100%. Interestingly, the formic acid yield was increased from 32% at 30 °C to reach the maximum value of 44% at 50 °C. Additionally, the formic acid yield had a negligible improvement when the reaction temperature was further increased to 60 °C and 70 °C, resulting in a reduction in formic acid production by 41% and 40%, respectively. As seen in Figure S6, gluconic acid and an unknown product were found in the HPLC chromatogram of the solution from the reaction at 70 °C. It is possible that the increase in reaction temperature can enhance the kinetic of the reaction for the glucose conversion and promote the side reactions to produce gluconic acid and other organic acid compounds. The decrease in formic acid yield at higher temperature (>50 °C) may be attributed to the exothermic nature of the oxidation of glucose to formic acid. Thermodynamically, this reaction is more favorable at lower temperatures, leading to reduced formic acid formation as the temperature increases [36].
The effect of solvent composition on the photocatalytic glucose conversion to formic acid by Fe-Mt/TiO2 was also investigated in three conditions, altering the ratio of water (W) to acetonitrile (ACN) as 100:0, 50:50 and 10:90 (%vol). As illustrated in Figure S7, increasing the acetonitrile content in the mixture solvent resulted in an increase in glucose conversion and formic acid production. In the 10: 90 (W: ACN vol%), glucose conversion and formic acid formation reached 83% and 44%, respectively, compared to 13% glucose conversion and 4% formic acid production in pure water. The better formic acid selectivity after increasing the ACN content in the solvent could be attributed to the low water content, leading to a lower concentration of highly unselective OH radicals, which is similar to the previous works [5,26,37].
The recycling test of the Fe-Mt/TiO2 on photocatalytic glucose conversion to formic acid was evaluated and is shown in Figure 6c. About 53% of formic acid yield and 83% glucose conversion were obtained in the first cycle. After water-washing and -drying of the spent Fe-Mt/TiO2 composites, the formic acid yield and glucose conversion slightly decreased to 40% and 80%, respectively. The minor reduction in formic acid production and glucose conversion could be attributed to the loss of some photocatalyst powder during the reusability testing procedure.

3.3. Possible Reaction Pathways

To further investigate the possible active species involved the photocatalytic glucose conversion by Fe-Mt/TiO2, scavenging experiments [36] were conducted employing scavengers such as tryptophan (TRP,) para-benzoquinone (BQ), methanol and isopropanol (IPA) to quench 1O2, O2, h+ and OH, respectively. Figure 6d displays the effect of each scavenger on the photocatalytic conversion of glucose to formic acid. The photocatalytic reaction with methanol and IPA exhibited comparable glucose conversion (~80%) and formic acid production (~40%) to those of reaction without scavenging reagents, suggesting that only a few h+ and OH existed in the reaction. However, the reaction in TRP and BQ delivered lower glucose conversion (41% in TRP and 37% in BQ) and formic acid yield (18% in TRP and 8% in BQ), indicating that 1O2 and O2 were produced in the reaction under visible-light illumination and played the most crucial roles in the selective glucose conversion to formic acid. Previous works reported that 1O2 and O2 were milder oxidants and resulted in better selective oxidation of organic compounds than OH. Compared to the scavenging experiments of pure TiO2 (Figure S8), the reaction in BQ and IPA gave lower glucose conversion (22% in IPA and 38% in BQ) and formic acid yield (2% in IPA and 4 % in BQ) than the reaction without. Thus, OH andO2 radicals were produced in the reaction when TiO2 was used as a photocatalyst and played important roles in the reaction. Thus, the 1O2 and O2 in our photocatalytic reaction catalyzed by Fe-Mt/TiO2 can effectively oxidize glucose while avoiding the overoxidation, resulting in the high yield of formic acid production [38]. Additionally, the high photocatalytic conversion of glucose with good selectivity may be attributed to the presence of ACN in the mixture solvent, which could potentially prolong the lifetime of 1O2 in the reaction [39].
The analysis of the electronic band position of Fe-Mt/TiO2 is important to understand the mechanism of glucose conversion. The Mott–Schottky measurements (Figure S9) were conducted to estimate flat band potentials of TiO2 and Fe-Mt, which are about −0.69 and −0.46 V vs. the normal hydrogen electrode (NHE), respectively [40]. Additionally, the negative slope in the Mott–Schottky plots in both TiO2 and Fe-Mt suggested that they are n-type semiconductors. Generally, the conduction band potential value of n-type semiconductors is more negative, about 0.1 V, than the flat band potentials. Thus, estimated conduction band (CB) potentials of TiO2 and Fe-Mt were to be −0.79 and −0.56 V, respectively. In addition, the valence band (VB) was calculated using the CB (Mott–Schottky measurements) and Eg obtained from Tauc’s plot (Figure 3b). According to the formula of EVB = ECB + Eg, the potential of the VB of TiO2 and Fe-Mt were determined to be 2.41 and 2.51 V, respectively. Based on the above results and previous work [22,23], the possible electronic band structure of Fe-Mt/TiO2 was proposed (Figure 7), revealing that the VB of TiO2 was more negative than that of Fe-Mt (2.51 V), whereas the CB of TiO2 was more positive than that of Fe-Mt (−0.56 V). Notably, the potential of Fe-mid-gap states in Fe-Mt at 1.09 eV (estimated from the previous work) was included in the proposed electronic band structure [22,23]. Thus, the Z-scheme Fe-Mt/TiO2 heterojunction could be constructed and promote the separation of the photogenerated charge carries in the material. Under light irradiation, the Fe-Mt and TiO2 can absorb photons, and the photogenerated hole and photogenerated electron were subsequently created in the CB and VB of both materials. Simultaneously, the electrons from the VB of Fe-Mt were excited to the Fe-mid-gap states and subsequently migrated to the VB of TiO2 because the VB of TiO2 was relatively more positive than that of Fe-Mt. Then, the recombination of photogenerated electrons from the Fe-mid-gap states in Fe-Mt and photogenerated hole in VB of TiO2 may prolong the lifetime of photogenerated electrons in the CB of TiO2. Thus, the photoexcited electrons accumulating on the CB of TiO2 can transform O2 to O2 because the ECB of TiO2 was more negative than −0.33 eV (O2/O2 vs. NHE). Also, the 1O2 was generated through the reaction between h+ and O2 in the reaction. Subsequently, the generated O2 and 1O2 radicals oxidized glucose into arabinose and further into formic acid, exhibiting relatively high selectivity in the process. Interestingly, the VB of Fe-Mt was more positive than that of the redox potential of OH production (H2O/OH vs. NHE, 2.27 eV), resulting in a possible generation of OH in the reaction. The proposed electronic band structure and the possible formation of 1O2 andO2 as the main reactive species align with the scavenging test results. These findings can support that the 1O2 and O2 are major reactive radicals for the conversion of glucose, whereas OH exhibited less effect on the reaction.
Possible photocatalytic oxidation pathways of glucose to formic acid catalyzed by the Fe-Mt/TiO2 composite are proposed in Figure 7. Because arabinose was found to be the primary intermediate product, the oxidation of glucose could mainly occur through the C1-C2 (α-scission) bond cleavage, driven by the activity of O2 and 1O2 radicals. In this process, the initial breakage of the C1-C2 (α-scission) bond in glucose yielded one equivalent of arabinose and one formic acid. This cycle was then repeated until all aldose was completely converted into formic acid [35].

4. Conclusions

In this work, Fe-loaded montmorillonite/TiO2 composite (Fe-Mt/TiO2), pure TiO2, Mt/TiO2 and Mt/Fe-TiO2 were systematically prepared and subsequently utilized as photocatalysts to produce formic acid via glucose conversion under visible-light irradiation. The Fe-Mt/TiO2 exhibited the highest photocatalytic conversion of glucose (83%) and formic acid yield (44%) after 2 h at 50 °C. The better photocatalytic performance of Fe-Mt/TiO2 was possibly due to the suppression of the photogenerated charge recombination, suggested by the PL, photocurrent and EIS results. Additionally, the Fe-Mt component within the Fe-Mt/TiO2 composite functioned as a photocatalyst support, facilitating the possible formation of a Z-scheme Fe-Mt/TiO2 heterojunction. Mechanism studies showed that the Fe-Mt/TiO2 material promoted the selective photocatalytic conversion of glucose to formic acid via an α-scission reaction route with arabinose as an intermediate, driven by the O2 and 1O2 as major reactive species. This work demonstrates the possible potential of clay-based materials for inexpensive and visible-light-driven photocatalytic conversion of biomass-derived substances into value-added chemicals. Additional investigations are required to find the optimal contents of Fe and TiO2 in Fe-Mt/TiO2, identify suitable modification methods, and explore milder reaction conditions for formic acid production and more environmentally friendly solvents than acetonitrile.

Supplementary Materials

The following supporting information can be downloaded at: https://www.mdpi.com/article/10.3390/cryst13121609/s1, Table S1: Elemental composition of Fe-Mt/TiO2 and Mt/Fe-TiO2 in wt%; Scheme S1: Interlayer spaces of Mt/TiO2, Fe-Mt/TiO2 and Mt/Fe-TiO2 after exclusion of Mt single layer; Figure S1: XRD patterns of Mt/TiO2, Fe-Mt/TiO2 and Mt/Fe-TiO2 in 20–35°. IA/IR is the ratio of XRD peak intensities corresponding to anatase and rutile TiO2; Figure S2: TEM image of Fe-Mt/TiO2 sample; Figure S3: SEM–EDX images of Fe-Mt/TiO2; Figure S4: SEM–EDX images of Mt/Fe-TiO2; Figure S5: the reversed double-beam photoacoustic spectra (RDB-PAS) of Fe-Mt/TiO2 and Mt/Fe-TiO2 for determination of the estimate the Eg values; Table S2: Summary of impedance parameters fitted from EIS data; Figure S6: The HPLC chromatograms of the glucose solution after photocatalytic reaction by Fe-Mt/TiO2 under visible-light sunlight irradiation at 50 °C and 70 °C for 120 min; Figure S7: Effect of solvent composition on the glucose conversion, formic acid production and formic acid selectivity from the photocatalytic reaction using Fe-Mt/TiO2 as a photocatalyst; Figure S8: The scavenging experiments on the photocatalytic conversion glucose into formic acid using pure TiO2; Figure S9: Mott–Schottky plots of TiO2 and Fe-Mt in 0.1 M of Na2SO4 electrolyte solution.

Author Contributions

Conceptualization, A.S., C.C. and K.S.; methodology, A.S. and L.Z.; software, A.S. and L.Z.; formal analysis, A.S., C.C., L.Z., S.S. and J.T.; investigation, A.S., L.Z., C.C., S.S. and J.T.; resources, K.S.; data curation, A.S.; writing—original draft preparation, A.S.; writing—review and editing, A.S., C.C. and K.S.; visualization, A.S.; supervision, K.S.; project administration, K.S.; funding acquisition, K.S. All authors have read and agreed to the published version of the manuscript.

Funding

The authors would like to express their gratitude to the Japan Society for the Promotion of Science (JSPS) KAKENHI (A) for funding the research grants (JP21F21342, JP22P22083, JP22H00266, JP22K18998), which were awarded to K.S., as well as the postdoctoral fellowships for foreign researchers (JP 22P22083) to A.S. and (JP 21P21342) to S.S.. Also, this work received partial support from the Advanced Research Infrastructure for Materials and Nanotechnology (Grant Number JPMXP1222KU1009) in Japan, sponsored by the Ministry of Education, Culture, Sports, Science and Technology (MEXT), Japan, and the 2022 Research Start Program (202208) for C.C.

Data Availability Statement

The data presented in this study are available on request from the corresponding author.

Acknowledgments

The authors extend their appreciation to Kyushu University’s Ultramicroscopy Research Center (URC) for their support in conducting TEM analysis. The graphical abstract was designed using some images from Flaticon.com (accessed on 2 October 2023).

Conflicts of Interest

The authors declare no conflict of interest.

References

  1. Xu, S.; Yang, J.; Li, J.; Shen, F. Highly Efficient Oxidation of Biomass Xylose to Formic Acid with CeOx-Promoted MnOx Catalyst in Water. ACS Sustain. Chem. Eng. 2023, 11, 921–930. [Google Scholar] [CrossRef]
  2. Cheng, Q.; Yuan, Y.-J.; Tang, R.; Liu, Q.-Y.; Bao, L.; Wang, P.; Zhong, J.; Zhao, Z.; Yu, Z.-T.; Zou, Z. Rapid Hydroxyl Radical Generation on (001)-Facet-Exposed Ultrathin Anatase TiO2 Nanosheets for Enhanced Photocatalytic Lignocellulose-to-H2 Conversion. ACS Catal. 2022, 12, 2118–2125. [Google Scholar] [CrossRef]
  3. Xia, Q.; Chen, Z.; Shao, Y.; Gong, X.; Wang, H.; Liu, X.; Parker, S.F.; Han, X.; Yang, S.; Wang, Y. Direct hydrodeoxygenation of raw woody biomass into liquid alkanes. Nat. Commun. 2016, 7, 11162. [Google Scholar] [CrossRef]
  4. Eqi, M.; Shi, C.; Zhang, M.; Kang, F.; Ma, J.; Huang, Z.; Liu, S. Modulating the tunable interfacial charge transfer of Z-scheme TiO2/CdS with Ti–S bonds for enhanced glucose photoreforming. J. Mater. Chem. A 2023, 11, 8235–8247. [Google Scholar] [CrossRef]
  5. Colmenares, J.C.; Magdziarz, A.; Bielejewska, A. High-value chemicals obtained from selective photo-oxidation of glucose in the presence of nanostructured titanium photocatalysts. Bioresour. Technol. 2011, 102, 11254–11257. [Google Scholar] [CrossRef] [PubMed]
  6. Scelfo, S.; Geobaldo, F.; Pirone, R.; Russo, N. Catalytic wet air oxidation of d-glucose by perovskite type oxides (Fe, Co, Mn) for the synthesis of value-added chemicals. Carbohydr. Res. 2022, 514, 108529. [Google Scholar] [CrossRef] [PubMed]
  7. Li, X.; Lu, X.; Hu, W.; Xu, H.; Chen, J.; Xiong, J.; Lu, L.; Yu, Z.; Si, C. Phosphotungstic acid functionalized biochar for furfural production from corncob. Fuel Process. Technol. 2022, 229, 107178. [Google Scholar] [CrossRef]
  8. Smullen, E.; Finnan, J.; Dowling, D.; Mulcahy, P. The environmental performance of pretreatment technologies for the bioconversion of lignocellulosic biomass to ethanol. Renew. Energy 2019, 142, 527–534. [Google Scholar] [CrossRef]
  9. Wang, J.; Zhao, H.; Liu, P.; Yasri, N.; Zhong, N.; Kibria, M.G.; Hu, J. Selective superoxide radical generation for glucose photoreforming into arabinose. J. Energy Chem. 2022, 74, 324–331. [Google Scholar] [CrossRef]
  10. Dutta, I.; Chatterjee, S.; Cheng, H.; Parsapur, R.K.; Liu, Z.; Li, Z.; Ye, E.; Kawanami, H.; Low, J.S.C.; Lai, Z.; et al. Formic Acid to Power towards Low-Carbon Economy. Adv. Energy Mater. 2022, 12, 2103799. [Google Scholar] [CrossRef]
  11. Miesse, C.M.; Jung, W.S.; Jeong, K.-J.; Lee, J.K.; Lee, J.; Han, J.; Yoon, S.P.; Nam, S.W.; Lim, T.-H.; Hong, S.-A. Direct formic acid fuel cell portable power system for the operation of a laptop computer. J. Power Sources 2006, 162, 532–540. [Google Scholar] [CrossRef]
  12. Ma, Z.; Legrand, U.; Pahija, E.; Tavares, J.R.; Boffito, D.C. From CO2 to Formic Acid Fuel Cells. Ind. Eng. Chem. Res. 2021, 60, 803–815. [Google Scholar] [CrossRef]
  13. Formic Acid Market-Growth, Trends, COVID-19 Impact, and Forecasts (2022–2027). 2022. Available online: https://www.mordorintelligence.com/industry-reports/formic-acid-market (accessed on 23 October 2023).
  14. Jin, F.; Yun, J.; Li, G.; Kishita, A.; Tohji, K.; Enomoto, H. Hydrothermal conversion of carbohydrate biomass into formic acid at mild temperatures. Green Chem. 2008, 10, 612–615. [Google Scholar] [CrossRef]
  15. Niu, M.; Hou, Y.; Ren, S.; Wu, W.; Marsh, K.N. Conversion of wheat straw into formic acid in NaVO3–H2SO4 aqueous solution with molecular oxygen. Green Chem. 2015, 17, 453–459. [Google Scholar] [CrossRef]
  16. Li, Y.; Ma, J.; Jin, D.; Jiao, G.; Yang, X.; Liu, K.; Zhou, J.; Sun, R. Copper oxide functionalized chitosan hybrid hydrogels for highly efficient photocatalytic-reforming of biomass-based monosaccharides to lactic acid. Appl. Catal. B Environ. 2021, 291, 120123. [Google Scholar] [CrossRef]
  17. Djellabi, R.; Ghorab, M.F.; Cerrato, G.; Morandi, S.; Gatto, S.; Oldani, V.; Di Michele, A.; Bianchi, C.L. Photoactive TiO2–montmorillonite composite for degradation of organic dyes in water. J. Photochem. Photobiol. A Chem. 2014, 295, 57–63. [Google Scholar] [CrossRef]
  18. Bi, X.; Du, G.; Sun, D.; Zhang, M.; Yu, Y.; Su, Q.; Ding, S.; Xu, B. Room-temperature synthesis of yellow TiO2 nanoparticles with enhanced photocatalytic properties. Appl. Surf. Sci. 2020, 511, 145617. [Google Scholar] [CrossRef]
  19. Bansal, P.; Verma, A. In-situ dual effect studies using novel Fe-TiO2 composite for the pilot-plant degradation of pentoxifylline. Chem. Eng. J. 2018, 332, 682–694. [Google Scholar] [CrossRef]
  20. Acharya, R.; Parida, K. A review on TiO2/g-C3N4 visible-light- responsive photocatalysts for sustainable energy generation and environmental remediation. J. Environ. Chem. Eng. 2020, 8, 103896. [Google Scholar] [CrossRef]
  21. Chuaicham, C.; Trakulmututa, J.; Shu, K.; Shenoy, S.; Srikhaow, A.; Zhang, L.; Mohan, S.; Sekar, K.; Sasaki, K. Recent Clay-Based Photocatalysts for Wastewater Treatment. Separations 2023, 10, 77. [Google Scholar] [CrossRef]
  22. Chuaicham, C.; Xiong, Y.; Sekar, K.; Chen, W.; Zhang, L.; Ohtani, B.; Dabo, I.; Sasaki, K. A promising Zn-Ti layered double hydroxide/Fe-bearing montmorillonite composite as an efficient photocatalyst for Cr(VI) reduction: Insight into the role of Fe impurity in montmorillonite. Appl. Surf. Sci. 2021, 546, 148835. [Google Scholar] [CrossRef]
  23. Zhang, L.; Chuaicham, C.; Balakumar, V.; Sekar, K.; Ohtani, B.; Sasaki, K. Determination of the roles of FeIII in the interface between titanium dioxide and montmorillonite in FeIII-doped montmorillonite/titanium dioxide composites as photocatalysts. Appl. Clay Sci. 2022, 227, 106577. [Google Scholar] [CrossRef]
  24. Balakumar, V.; Manivannan, R.; Chuaicham, C.; Karthikeyan, S.; Sasaki, K. A simple tactic synthesis of hollow porous graphitic carbon nitride with significantly enhanced photocatalytic performance. Chem. Commun. 2021, 57, 6772–6775. [Google Scholar] [CrossRef]
  25. Suriyachai, N.; Chuangchote, S.; Laosiripojana, N.; Champreda, V.; Sagawa, T. Synergistic Effects of Co-Doping on Photocatalytic Activity of Titanium Dioxide on Glucose Conversion to Value-Added Chemicals. ACS Omega 2020, 5, 20373–20381. [Google Scholar] [CrossRef] [PubMed]
  26. Roongraung, K.; Chuangchote, S.; Laosiripojana, N.; Sagawa, T. Electrospun Ag-TiO2 Nanofibers for Photocatalytic Glucose Conversion to High-Value Chemicals. ACS Omega 2020, 5, 5862–5872. [Google Scholar] [CrossRef] [PubMed]
  27. ICDD. ICDD Powder Diffraction File Inorganic and Organic Data Book International Centre for Diffraction Data; ICDD: Newtown Square, PA, USA, 2010. [Google Scholar]
  28. Yan, P.; Zhang, Y.; Zheng, S. Microscale spherical TiO2 powder prepared by hydrolysis of TiCl4 solution: Synthesis and kinetics. Particuology 2024, 84, 60–71. [Google Scholar] [CrossRef]
  29. Mokhtar, B.; Kandiel, T.A.; Ahmed, A.Y.; Komy, Z.R. New application for TiO2 P25 photocatalyst: A case study of photoelectrochemical sensing of nitrite ions. Chemosphere 2021, 268, 128847. [Google Scholar] [CrossRef] [PubMed]
  30. Nitta, A.; Takashima, M.; Murakami, N.; Takase, M.; Ohtani, B. Reversed double-beam photoacoustic spectroscopy of metal-oxide powders for estimation of their energy-resolved distribution of electron traps and electronic-band structure. Electrochim. Acta 2018, 264, 83–90. [Google Scholar] [CrossRef]
  31. Chen, K.; Li, J.; Wang, W.; Zhang, Y.; Wang, X.; Su, H. The preparation of vanadium-doped TiO2–montmorillonite nanocomposites and the photodegradation of sulforhodamine B under visible light irradiation. Appl. Surf. Sci. 2011, 257, 7276–7285. [Google Scholar] [CrossRef]
  32. Ooka, C.; Yoshida, H.; Horio, M.; Suzuki, K.; Hattori, T. Adsorptive and photocatalytic performance of TiO2 pillared montmorillonite in degradation of endocrine disruptors having different hydrophobicity. Appl. Catal. B Environ. 2003, 41, 313–321. [Google Scholar] [CrossRef]
  33. Begna, W.B.; Gurmesa, G.S.; Zhang, Q.; Geffe, C.A. A DFT+U study of site dependent Fe-doped TiO2 diluted magnetic semiconductor material: Room-temperature ferromagnetism and improved semiconducting properties. AIP Adv. 2022, 12, 025002. [Google Scholar] [CrossRef]
  34. Zhang, L.; Chuaicham, C.; Balakumar, V.; Sasaki, K. Effect of ionic Fe(III) doping on montmorillonite for photocatalytic reduction of Cr(VI) in wastewater. J. Photochem. Photobiol. A Chem. 2022, 429, 113909. [Google Scholar] [CrossRef]
  35. Li, J.; Smith, R.L.; Xu, S.; Li, D.; Yang, J.; Zhang, K.; Shen, F. Manganese oxide as an alternative to vanadium-based catalysts for effective conversion of glucose to formic acid in water. Green Chem. 2022, 24, 315–324. [Google Scholar] [CrossRef]
  36. Jin, B.; Yao, G.; Wang, X.; Ding, K.; Jin, F. Photocatalytic Oxidation of Glucose into Formate on Nano TiO2 Catalyst. ACS Sustain. Chem. Eng. 2017, 5, 6377–6381. [Google Scholar] [CrossRef]
  37. Llatance-Guevara, L.; Flores, N.E.; Barrionuevo, G.O.; Mullo Casillas, J.L. Waste Biomass Selective and Sustainable Photooxidation to High-Added-Value Products: A Review. Catalysts 2022, 12, 1091. [Google Scholar] [CrossRef]
  38. Xiong, L.; Tang, J. Strategies and Challenges on Selectivity of Photocatalytic Oxidation of Organic Substances. Adv. Energy Mater. 2021, 11, 2003216. [Google Scholar] [CrossRef]
  39. Da Vià, L.; Recchi, C.; Gonzalez-Yañez, E.O.; Davies, T.E.; Lopez-Sanchez, J.A. Visible light selective photocatalytic conversion of glucose by TiO2. Appl. Catal. B Environ. 2017, 202, 281–288. [Google Scholar] [CrossRef]
  40. Kumar, D.P.; Hong, S.; Reddy, D.A.; Kim, T.K. Noble metal-free ultrathin MoS2 nanosheet-decorated CdS nanorods as an efficient photocatalyst for spectacular hydrogen evolution under solar light irradiation. J. Mater. Chem. A 2016, 4, 18551–18558. [Google Scholar] [CrossRef]
Figure 1. XRD patterns of pure TiO2, Mt/TiO2, Fe-Mt/TiO2 and Mt/Fe-TiO2.
Crystals 13 01609 g001
Figure 2. SEM images of (a) TiO2, (b) Mt/TiO2, (c) Fe-Mt/TiO2, (d) Mt/Fe-TiO2.
Crystals 13 01609 g002
Figure 3. (a) UV–vis DRS Spectra, (b) Tauc’s plot to estimate the energy band gap and (c) PL spectra of the pure TiO2, Mt/TiO2, Fe-Mt/TiO2 and Mt/Fe-TiO2 samples.
Crystals 13 01609 g003
Figure 4. (a) Transient photocurrent density and (b) the electrochemical impedance spectroscopy (EIS) Nyquist plots of the pure TiO2, Mt/TiO2, Fe-Mt/TiO2 and Mt/Fe-TiO2 samples.
Crystals 13 01609 g004
Figure 5. (a) Glucose conversion, formic acid yield and formic acid selectivity of the pure TiO2, Mt/TiO2, Fe-Mt/TiO2 and Mt/Fe-TiO2 samples under visible-light sunlight irradiation at 50 °C for 120 min, (b,c) the HPLC chromatograms of the solution obtained from the refractive index (RI) and the UV detector detectors, respectively, after glucose conversion over the reaction times using the Fe-Mt/TiO2 composite as the photocatalyst.
Crystals 13 01609 g005
Figure 6. Effects of (a) catalyst loading, (b) reaction temperature, (c) reusability and (d) various scavengers on the photocatalytic conversion of glucose to formic acid using the Fe-Mt/TiO2 composite as the photocatalyst.
Crystals 13 01609 g006
Figure 7. Possible reaction pathways of formic production from glucose in the mixture solvent of water and acetonitrile under visible-light irradiation promoted by Fe-Mt/TiO2.
Crystals 13 01609 g007
Disclaimer/Publisher’s Note: The statements, opinions and data contained in all publications are solely those of the individual author(s) and contributor(s) and not of MDPI and/or the editor(s). MDPI and/or the editor(s) disclaim responsibility for any injury to people or property resulting from any ideas, methods, instructions or products referred to in the content.

