Article

Theoretical Investigation of Anhydrofusarubin: Structural and Optical Properties

1
Center for Optical and Laser Materials Research, St. Petersburg State University, Ulianovskaya 5, 198504 St. Petersburg, Russia
2
Faculty of Physics, St. Petersburg State University, Universitetskaya Nab. 7/9, 199034 St. Petersburg, Russia
3
Federal Scientific Agro-Engineering Center VIM, 1st Institutskiy Proezd 5, 109428 Moscow, Russia
4
Prokhorov General Physics Institute of the Russian Academy of Sciences, Department of Oscillation, Vavilov St. 38, 119991 Moscow, Russia
5
L.L.C. Rostagroservice, 344012 Rostov-on-Don, Russia
6
Department of Processes and Machines in Agribusiness, Kuban State Agrarian University Named after I.T. Trubilin, 350044 Krasnodar, Russia
*
Author to whom correspondence should be addressed.
Crystals 2023, 13(11), 1556; https://doi.org/10.3390/cryst13111556
Submission received: 1 October 2023 / Revised: 28 October 2023 / Accepted: 29 October 2023 / Published: 31 October 2023

Abstract

:
Anhydrofusarubin is a naphthoquinone pigment synthesized by a number of Fusarium genus fungi. Being a biologically active substance, it demonstrates promising antibiotic properties and rather good hypothetical effectiveness against certain types of cancer. In this regard, an important task arises to study the structural properties and spectral manifestation of Anhydrofusarubin in order to identify and characterize this substance in terms of synthesis and application purposes. In this regard, the aim of the article was to study the structure of the Anhydrofusarubin molecule and its structure-property correlation. The density functional theory was used to investigate the optical properties and stability of the molecular structures. The computational results obtained with B3LYP and wb97XD exchange correlation functionals and the triple zeta basis sets were compared with available experimental data. In addition to the ground state structure, a tautomer with slightly higher energy (by 0.78–0.9 kcal/mol) and a relatively small potential barrier was found. Also, the investigation of flexibility of the pyran ring reveals the presence of two conformational enantiomer forms, being in good agreement with the recent experimental data on the crystal structure. The vibrational and UV-visible absorption spectra were simulated and interpreted.

1. Introduction

Fusarium genus fungi are widely distributed in soil and associated with plants. They are sources of various metabolites [1,2,3,4]. The research of these fungi will play an important role in solving practically vital problems such as detecting infection of agricultural crops [5,6,7,8,9,10,11,12,13,14,15], as well as the isolation and synthesis of biologically active compounds that are promising for the needs of pharmacology [16,17,18,19,20,21,22]. Naphthoquinone pigments occupy a special place among the metabolites synthesized by individual Fusarium and Cladosporium fungi. These pigments demonstrate antibacterial and phytotoxic biological activity [23,24].
Promising naphthoquinone pigments include anhydrofusarubin (5,10-Dihydroxy-7-methoxy-3-methyl-1H-naphtho[2,3-c]pyran-6,9-dione, CAS 79383-28-1, C15H12O6)—fusarubin group pigment [25]. This pigment was extracted from Fusarium species and Chlamidosporum species fungi [19,26,27], and also was obtained by heating the pigment Fusarubin [28]. Moreover, the isolation of anhydrofusarubin from marine fungi B77 [20] and several ways of artificial synthesis of this compound have been investigated in a number of studies [16,29]. Despite the fact that this substance demonstrates antibiotic and antibacterial properties [20,24], recent interest has been devoted to its anhydrofusarubin cytotoxic activity against certain human cancer cells [27,29,30], in particular the acceleration of apoptosis of cancer cells at certain concentrations [27].
Due to the biological importance and high biological activity of anhydrofusarubin and its derivatives, studying the correlation between their spectral and structural properties is very promising. To date, the structure of anhydrofusarubin has been characterized mainly by NMR spectroscopy. Detection of this substance at low concentrations was carried out by chromatographic techniques coupled with UV luminescence and UV-visible (UV-Vis) absorption spectroscopy [26,27,28]. Relatively few data are presented on vibrational peculiarities of anhydrofusarubin and similar compounds [22,28,31]. At the same time, the methods of vibrational spectroscopy, namely IR spectroscopy in the mid-IR range and Raman spectroscopy, being sensitive and relatively easy to implement, can act as alternative methods aimed at studying the structure of metabolites [32]. An additional advantage of IR spectroscopy is connected with its sensitivity for detecting polar groups. Raman spectroscopy, in turn, is especially promising due to the possibility of noncontact and nondestructive research, having the possibility of resonant amplification of scattered light under certain resonant conditions [33].
The ability to model the structure and its properties using quantum chemistry and molecular dynamics methods makes it possible to predict and explain the chemical properties of compounds without resorting to expensive and time-consuming experiments, as well as to predict their interactions with media such as solvents or proteins [3,33,34]. The investigation of stable states of a bioactive molecule can also be promising for modifying its biological activity by heating or laser exposure. From this point of view, the anhydrofusarubin molecule attracts special attention due to its broad absorption peaks with the longest wavelength maximum in the yellow part of the spectrum. Additionally, at elevated temperatures this molecule is more stable compared with fusarubin family pigments, which contain OH groups and thus can be obtained by the heating of fusarubin [28].
Based on the above reasons, this article aims to study the structural features of anhydrofusarubin using vibrational spectra and electronic absorption spectra in the UV-visible region.

2. Methodological Part

Theoretical modeling of the anhydrofusarubin structural features was carried out via quantum-chemical calculations within the framework of density functional theory (DFT). The B3LYP and WB97XD functionals realized within the triple-zeta split Pople-type valence basis sets were used. Such approximations allow quite accurate predicting of the structural and optical properties. In view of previous studies [10,34,35,36], the following functional/basis combinations were selected: B3LYP/6-311G(2d,p) and WB97XD/6-311++G(d,p). In what follows, we will refer to these computational methods as 1st and 2nd approaches, respectively. The calculations were performed using the Gaussian G09W Rev C.01 program (Gaussian Inc, Wallingford, CT, USA) [37]. Visualization of the obtained results was carried out with the use of GaussView software ver. 5.0.9 (Gaussian Inc, Wallingford, CT, USA). The following color scheme was used for the molecule visualization. In the figures, the atoms of carbon, oxygen and hydrogen are dark gray, red and light gray respectively. Presentation of the obtained results in graphical form was carried out using the program Origin 9.0 software (OriginLab Co.; Northampton, MA, USA).
All discussed molecular structures were optimized to fulfill the criteria of zero forces and atomic displacements within the standard accuracy. The predefined ultrafine grid was used for integration over reciprocal space. To test stability of the optimized structures, the calculated phonon spectra were analyzed for absence of imaginary vibrational frequencies. When scanning potential energy by dihedral angle variation, the scanning step was 15°. For a similar scan across interatomic distances, the scanning step was 0.01 Å. All potential energy scans (PES) were performed in optimization mode over all structural parameters except the scan coordinate. The vibrational modes were analyzed based on the calculated eigenvectors. The half-width of the spectral peaks corresponding to the vibrational mode was selected to be 4 cm−1. For the calculated vibrational mode frequencies, the scaling procedure was performed in order to obtain better agreement between theory and experiment (see Figure S1 and procedure description in Supporting Information). The UV-Vis absorption spectra were calculated using the time-dependent approach DFT (TD-DFT). The oscillator strengths and excitation energies were calculated for 70 lowest singlet transitions. In the case of UV-Vis absorbance spectrum, the HWHM was 0.333 eV.
The following notations for methyl and methylene groups were used: The ordinary number for carbon atom and the sub index to show the number of attached hydrogens (e.g., C17H3 carbon atom C17 with three bonded hydrogen atoms ad hoc H18, H19, H20).
The crystal geometry optimization was performed with the use of Castep (Material studio) software [38]. The calculations were performed within generalized gradient approximation (GGA) with Perdew–Burke–Ernzerhof (PBE) functional [39] and with semi-empirical dispersion correction according to the Grimme correction scheme [40]. In the following, we will refer to this computational method as GGA-PBE-G6. The basis set of plane waves with a cut-off energy equal to 1000 eV was used. The Monkhorst–Pack grid of k vectors was chosen to be 2 × 2 × 2 with an average step of about 0.05 1/Å. The SCF convergence criterion was set as 5 × 10⁻⁷ Ha. The geometry optimization was performed by BFGS method [41] until the following convergence criteria were achieved: the forces were less than 1.4 × 10⁻² eV/Å, atomic displacements were less than 7.5 × 10⁻⁴ Å, and the stresses less than 1.4 × 10⁻² GPa.

3. Results and Discussion

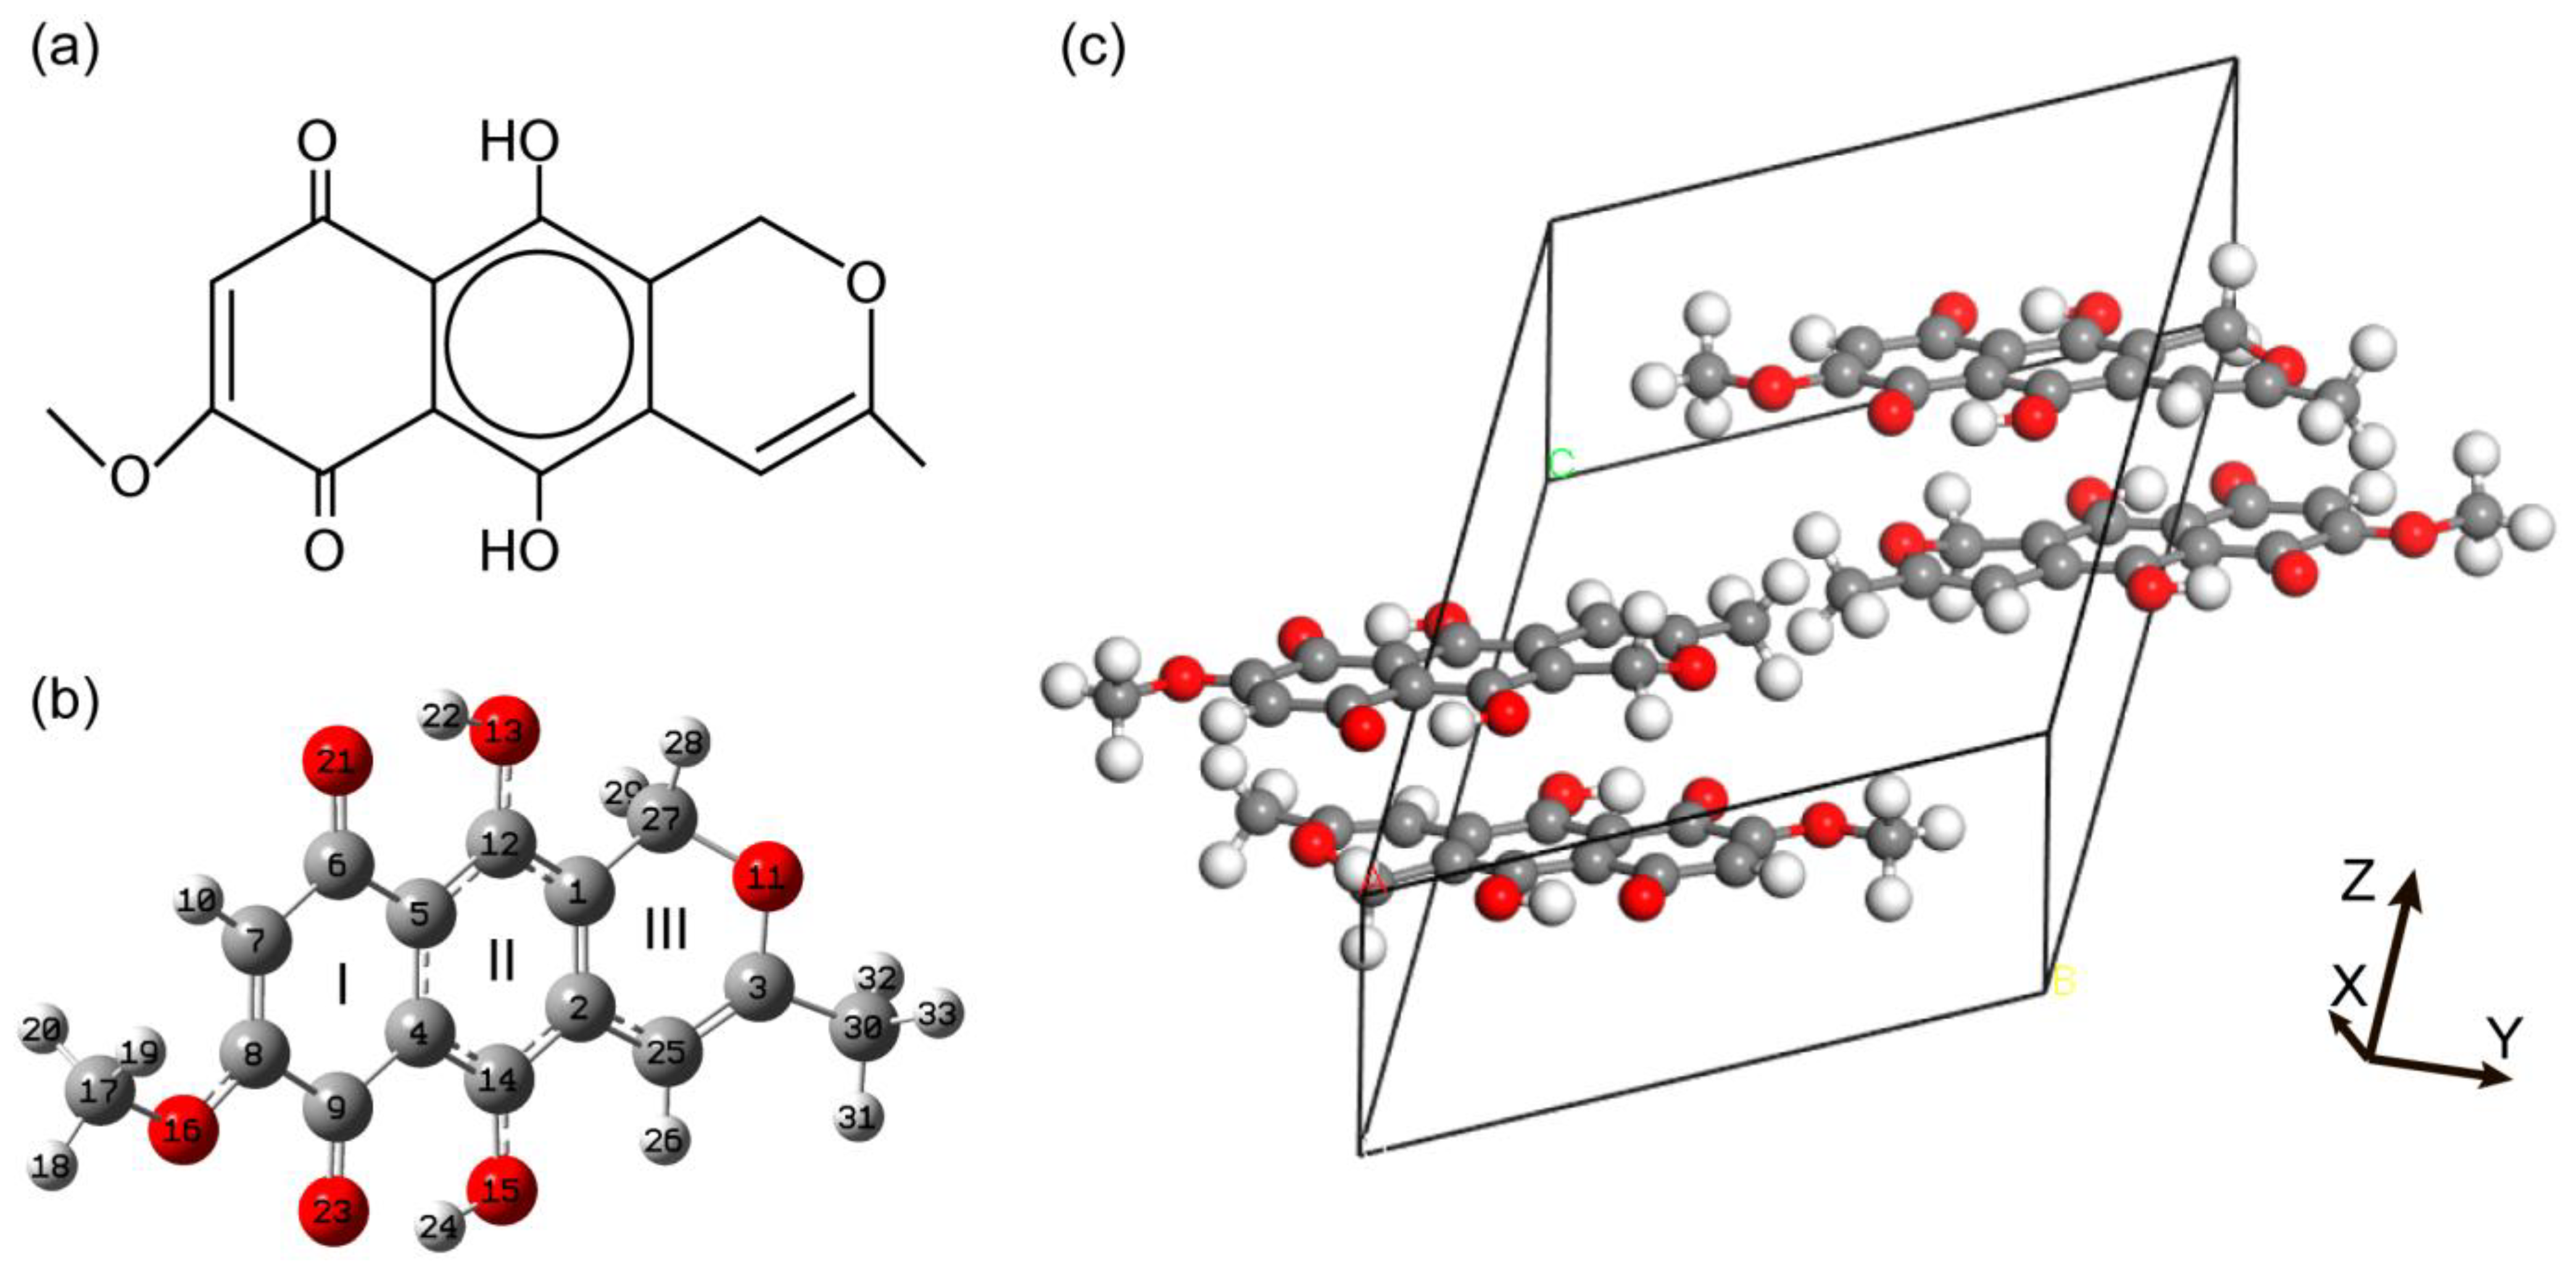
3.1. Structural Peculiarities

The unit cell of an anhydrofusarubin crystal with P 1 ¯ space group contains four molecular units [20], with two molecules in the asymmetric unit. The anhydrofusarubin molecule is polycyclic with three edge sharing rings (see Figure 1a). One can observe the MeO-naphthazarin part (rings I and II), as well as the pyran ring (ring III) with a methyl group.
Optimization of the crystal geometry with the use of experimental structure [20,42] as starting point was carried out. The structure of the isolated anhydrofusarubin molecule was optimized within the two computational approaches described in Section 2. The resulting optimized geometry for the molecule is shown in Figure 1a and the optimized unit cell is presented in Figure 1b. The comparison of bond lengths and planar and dihedral angles is given in Table 1.
The largest differences between theory and experiment in the case of the crystal calculation are associated with the C7C8, C6O21, and C9O23 bonds in the first ring which are longer in calculations by 0.02–0.03 Å (see Table 1). A possible reason is overestimation of the hydrogen bond effect in calculations within the Grimme correction method. Molecular calculations within the framework of the first and second approaches show similar results for the bond lengths in the first ring and its functional groups. The discrepancy generally does not exceed 0.02 Å. In this case, there is an overestimation of the carbon–carbon bond lengths in the first ring, and an underestimation of the polar C-O and C=O bond lengths compared with the experimental data. In general, the bond lengths R in the first ring are distributed as follows: R(C=O) < R(C=C) < R(C-O) < R(C-C). The largest deviation for angles is observed for the C8C7H10 angle, which may occur due to underestimation of hydrogen bond effect through the H10 atom. For other plane angles, molecular calculations yield deviations that do not exceed 1°.
Considering the second ring, which is based on a benzene ring with attached OH groups, the solid-state calculations predict C=C bonds longer than in experimental data. At the same time, molecular calculations using both methods predict closer values. The opposite situation occurs for polar C-O bonds. Within the molecular calculations, the largest deviations in the angles are obtained for the C-O-H angles. This can be associated, on the one hand, with the isolated molecule approximation, and on the other hand, with not accurate consideration of the hydrogen bond effect. Within all computational approaches, the predicted in-plane angles in the benzene ring are about 120°.
In general, the MeO-naphthazirine part is planar. Its most stable configuration corresponds to the structure with MeO-naphthazirine of Cs symmetry. Deviation from a Cs symmetry in the anhydrofusarubin molecule is associated with a nonplanar structure of the third pyran ring. The solid-state calculations predict for this ring the largest discrepancy in the lengths of double carbon bonds (an overestimation by 0.033 Å). For molecular calculations, similar overestimation takes place but to a lesser extent. The largest discrepancies in molecular calculation take place for planar C1-C27-O11 and C27-O11-C3 angles. It should be noted that quite large differences between molecular calculations and experiments concern the dihedral angles. Such discrepancy arises from the underestimation of interactions through hydrogen bonds, as well as from the flexibility of the pyran ring. The crystal approach that accounts for these features provides relatively small deviations not exceeding 2° and good agreement in dihedral angles of theory and experiment. The deviations could be partly due to an inaccurate account of electronic correlation in the solid state theoretical approach.

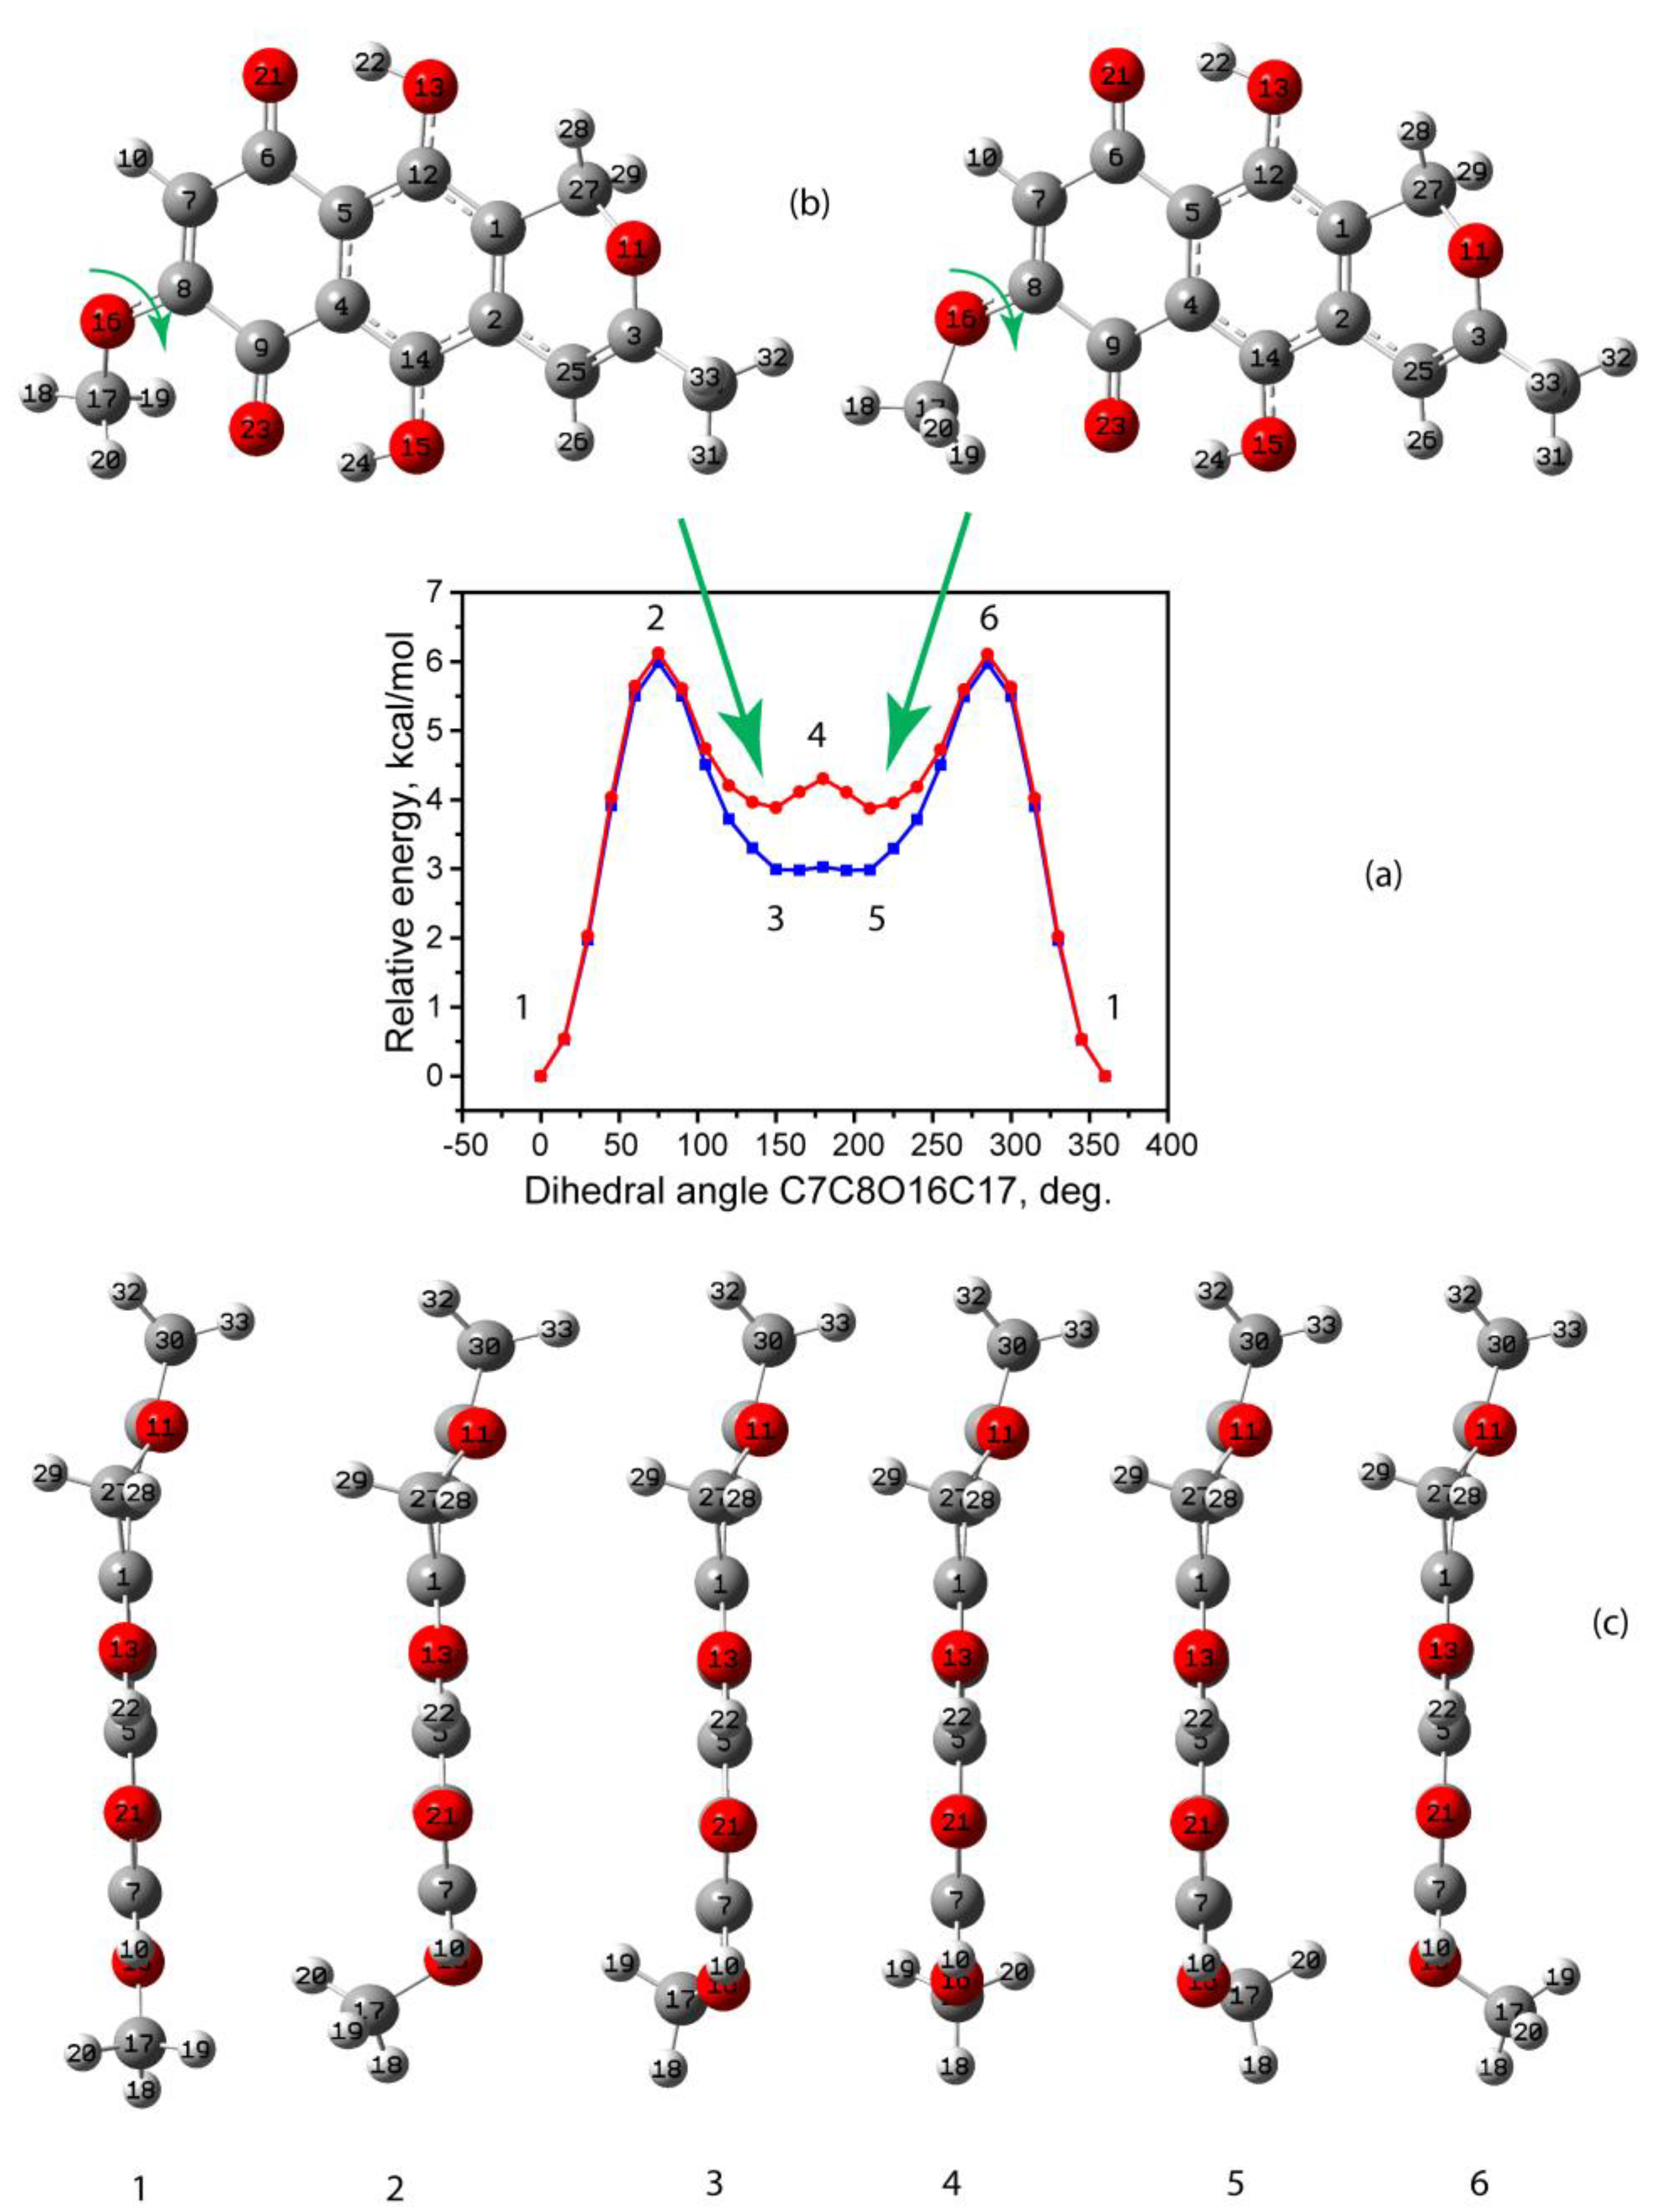
3.1.1. Conformational Enantiomers of Anhydrofusarubin

Analyzing the experimental parameters given in Table 1, it could be highlighted that the main difference in molecules of the first and second types concerns the geometry of the third ring. The given experimental dihedral angles for both types of molecules in the third ring are close in magnitude and opposite in sign. The difference can be explained by intermolecular interactions, indicating the presence of two conformational enantiomers, i.e., the stable conformers that transform into each other upon mirror transformation in a plane coinciding with naphthazarin rings plane.
Of practical interest may be the assessment of the potential barrier to the transition from one state to another. In order to estimate the potential barriers of the conformational enantiomer’s transformation, a potential energy was scanned by the C25C27H29 angle variation. The results obtained by two molecular approaches are shown in Figure 2.
The obtained estimates show that the height of the potential barrier of the transformation of one conformational enantiomer into another is relatively small, in the range of 1.0–1.6 kcal/mol. They have the same vibrational properties and electronic absorbance spectrum in the UV-Vis region [44]. Taking into account that both conformational enantiomers possess the same total potential energy, and that the potential barrier is comparable with thermal energy (0.6 kcal/mol at 300 K), one can assume that the transformation may occur in sufficient quantities already at room temperature. Considered transformation, in fact, is a case of conformational enantiomers that interconvert into one another relatively easily. Such wagging distortion of a nonrigid pyran ring is akin to fish-like tail motion. The relatively low potential barrier is reflected in the structure of the unit cell, which consists of four molecules with two molecules belonging to one type of conformational enantiomers, and two others to another type, as indicated by the dihedral angle values presented in Table 1.
The conformational enantiomers considered are polar. Their dipole moments differ in the sign of the components perpendicular to this mirror plane. An external electric field applied to the crystal in a direction perpendicular to the molecular plane cancels the equivalence of the two conformational enantiomers and possibly inhibits dynamic structural fluctuations.
It should be noted that other higher-energy conformational enantiomers are possible. The enantiomeric transition results in rotation around the C8O16 bond accompanied by the aforementioned out-of-plane bending of the pyran ring. The related energy increase is mainly caused by the rotation transformation. In this regard, the potential energy scanning by the dihedral angle C7C8O16C17 was carried out with the use of two molecular approaches. The resulting scan, as well as independently optimized enantiomer geometries, are presented in Figure 3. According to these data, it can be concluded that both methods predict fairly similarly the barrier energy height of 5.97 and 6.11 kcal/mol for the first and second approach, respectively. Both approaches predict similar values of dihedral angles for the steady state, namely 150 and 212°. In this case, one of the hydrogen atoms (see Figure 3) of the methyl group is ordered so that the shortest CH---O contact with a length of 2.454 Å (first approach) and 2.441 Å (second approach) is formed. At the same time, another hydrogen atom forms a longer C-H---O contact with a length of 2.685 Å (first approach) and 2.694 Å (second approach). This is not the case of a classic hydrogen bond but rather a coordination rearrangement governed by electrostatic H…O interaction.
On the other hand, the relative energies of these conformational enantiomers differ by approximately 0.9 kcal/mol, achieving 2.96 and 3.88 kcal/mol for the first and second approaches, respectively, which may partly correlate with the geometry of the MeO group and the slightly smaller angle C8O16C17, as well as greater long-range interaction contribution for the second approach.
In general, the relative energy of these conformers is rather high in comparison with the ground state energy. Under normal conditions, such higher energy conformers lead to very small contribution to the vibrational and electronic absorption spectra in the UV-Vis range.

3.1.2. Tautomerism in Anhydrofusarubin

Due to the fact that first and second rings with attached groups are structurally similar to MeO-naphthazarin molecule, it was decided to study the possible intramolecular tautomerism dealt with O-H---O hydrogen bond. At the top of Figure 4, the found optimized tautomer geometry during the distance relaxed scans between O---H is shown. It should be noted that each tautomer can be associated with a conformational enantiomer related to it by the bending of the pyran ring, as well as a rotamer related to it by the rotation of the MeO group. The lowest found tautomer corresponds to the simultaneous proton transfer forming O21H22 and O23H24 bonds (see Figure 4a). Estimations within the first and the second approaches demonstrate that this tautomer total energy is only 0.78 and 0.90 kcal/mol higher than in the case of ground state (see Figure 1b). The possible explanation of such tautomer formation may be described in two ways. The first of them deals with two consecutive proton transfers. The example of such process and relative energy changes is shown in Figure 4d,e. As one can see, the first and the second approaches predict the 5.1 and 7.0 kcal/mol potential barrier in order to obtain the conformer in Figure 4b with the total energy higher by 4.31 and 5.73 kcal/mol as compared with the ground state. Furthermore, being in the conformer state demonstrated in Figure 4b, an additional 1.46 and 2.18 kcal/mol potential barrier needs to be overcome according to the first and second approaches. For comparison, the conformer demonstrated in Figure 4c is predicted to have had higher total energy by 4.49 and 6.02 kcal/mol as compared with the ground state.
The obtained energy of the tautomer in Figure 4a after transformation is comparable with the thermal energy 0.6 kcal/mol at 300 K. On the basis of the obtained estimations, it can be assumed the presence of tautomer molecules in the gas phase and solutions with low solvent effects. On the other hand, the potential barrier for such two proton transition is relatively high in case of room temperature.
Additionally, the optimization of crystal structure with tautomer molecules similar to that in Figure 4 with P 1 ¯ space group was performed (the tautomer analogue of the crystal considered in [20]). The optimized structural parameters are presented in Table S3. The obtained tautomer crystal energy is 3.39 kcal/mol higher than the ground state energy (see Table S1).

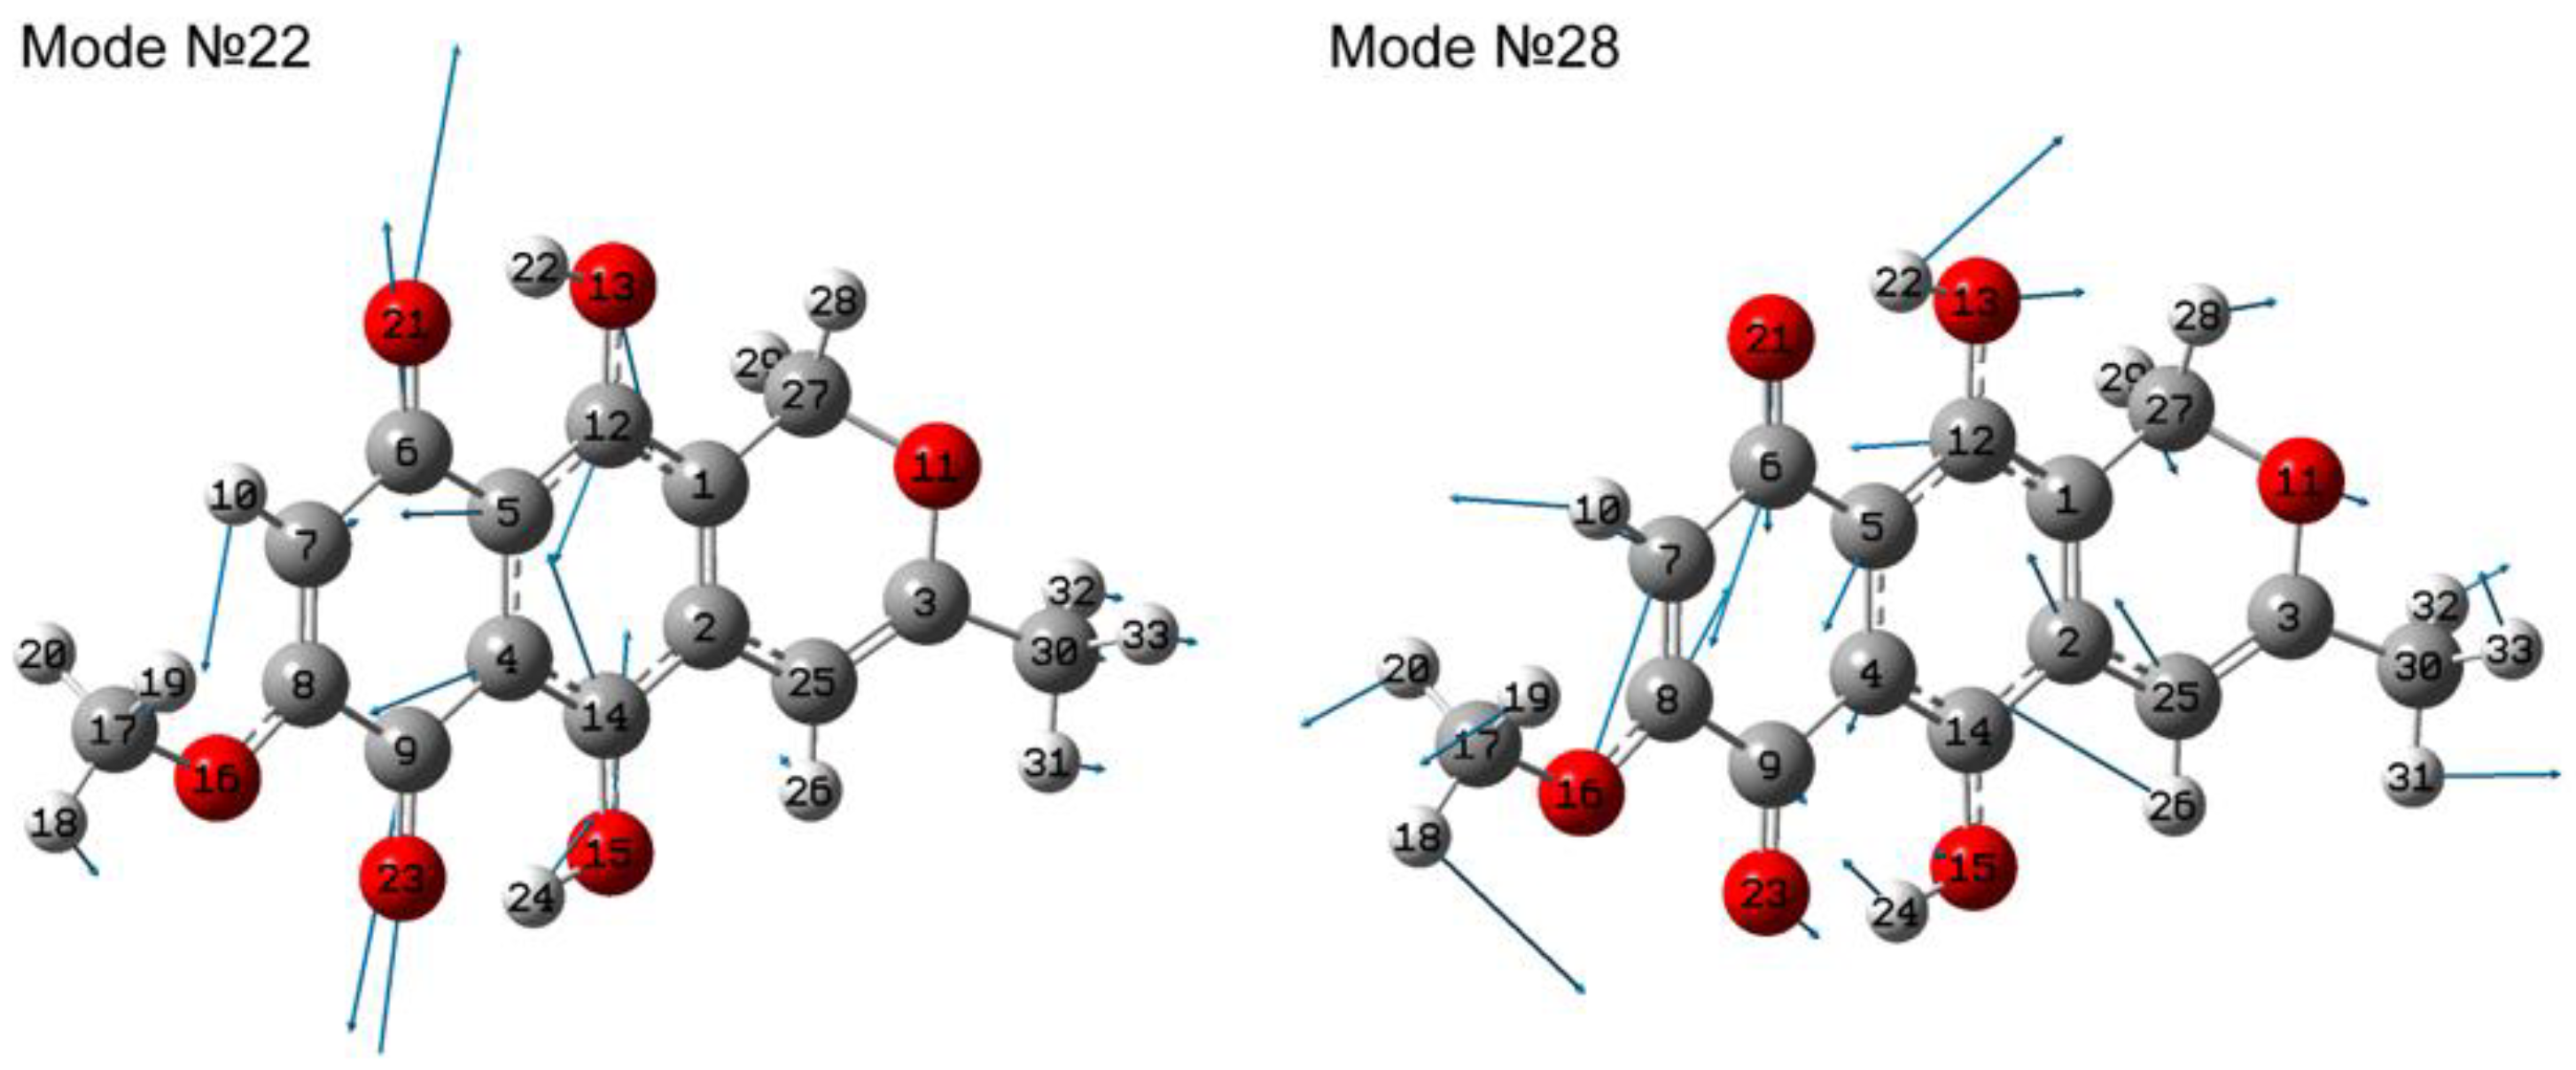
3.2. IR absorbance Spectroscopy

All vibrational modes of a molecular crystal can be divided into intramolecular and intermolecular ones. Vibrational modes with a significant intermolecular contribution have vibration frequencies less than 200 cm−1, while the intramolecular modes are localized in a frequency region above 200 cm−1. Being more intense in IR absorbance, they can be used as a fingerprint of the substance. The most practically important frequency range is limited to 375–4000 cm−1 (mid IR (MIR) range) due to the widespread use of FTIR spectrometers with KBR beam splitters. Previous studies of anhydrofusarubin were carried out with its solution in chloroform and ethanol [22,24,28]. Only a few papers are devoted to anhydrofusarubin study in the crystalline state [20] with limited IR absorbance data [22,26,29]. In order to demonstrate more general spectroscopic peculiarities of a given compound regardless of the environment influence, below we consider vibrational spectra of the gas phase in a practically important range (375–4000 cm−1). For greater clarity, the single-molecule approximation was selected, demonstrating a fairly close agreement between theory and experiment in describing the intramolecular vibrations of a molecular crystal [8,10].
The IR absorption spectra calculated by both molecular methods are shown in Figure 5. A complete table with frequencies and mode assignment is given in Supplementary Information (see Table S2). Further in the text, they will be referred to as individual modes, indicating their number in Table S2.
The C-H and O-H bond stretching vibrations correspond to modes No. 82–93 (see Table S2. The ν(O15H24) mode (No. 93) has the highest frequency in both computational approaches. The frequency of the ν(O13H22) mode is predicted to be lower. This may be due to the influence of the hydrogen bonds between the O15 atom and H28 and H29 atoms of the methylene group.
It is noticeable that the second approach predicts higher frequencies for ν(OH) vibrations (see Table S2). Thus, the second approach provides the ν(OH) frequencies for both chelate groups higher than frequency of any ν(CH) mode. At the same time, the first approach predicts the ν(O13H22) frequency lower than the ν(C25H26) and ν(C7H10) frequencies, but higher than the frequencies of the νas(CH3) mode (see Table S2). It should be noted that the standard frequency range for ν(=C-H) vibrations is 3000–3100 cm−1, while the frequency of the νas(CH3) mode is 2960 ± 10 cm−1 [43]. The first approach demonstrates a fairly strong decrease in frequency, which is indicative of a strong hydrogen bond. The ν(OH) mode of anhydrofusarubin has 3357 cm−1 peak frequency [22]. It should be noted that this bond strongly depends on the environment (possible formation of hydrogen bonds), and its spectral manifestation is influenced by presence of other OH groups. For example, in the spectrum of fusarubin (in the structure of which there is one additional OH group compared to anhydrofusarubin), peaks are registered at 3380 and 3460 cm−1 [31].
In our calculations, both theoretical approaches predict two intense peaks (modes No. 93 and 90), with mode No. 90 being more active. However, the anharmonicity of ν(OH) vibrations and the lack of possibility to take into account the interaction of the molecule with the environment lead to an overestimation of strength of the O---H-O hydrogen bonds and the prediction of much lower ν(OH) frequencies.
An interesting feature occurs in vibrational modes associated with the methylene group H28-C27-H29 of the pyran ring. The ν(CH) vibrations have a distinct individual character with predominant atomic displacements in one of the C-H bonds. For equatorial H28 atoms, the ν(CH) frequency in both calculations is predicted in the region of νas(CH3) vibrations of methyl groups. At the same time, for axial hydrogen atoms, the predicted ν(CH) frequency in both calculations is lower than the frequencies of νs(CH3) mode, possessing the frequency at 2927 cm−1 approximately [29,45]. This peak lies in the range typical for νas(CH2) modes [43]. This frequency value is close to the frequency of mode No. 82 predicted by the first approach. In addition, the IR-activity of this mode is predicted as greater than the activity of mode No. 88.
Very intense localized IR absorption peaks are predicted in the frequency range of the vibrational modes No. 76–81 (see Table S2). They correspond to vibrations delocalized between double bonds C=O and C=C with some admixture of the bending δ(COH) vibrations (see Figure 4). This spectral feature is similar to the experimental IR absorption spectra of naphthazarin [46]. In this regard, the appearance of spectral features similar to those of naphthazarin and fusarubin is expected. In the spectrum of naphthazarin in this region, two pronounced peaks are noted at 1617 and 1564 cm−1 [46], which is close to the 1600 and 1575 cm−1 peaks reported in [31]. According to the results of our calculation using the first method, we can expect the formation of two bands formed by the superposition of two groups of modes. One of them is formed mainly by mode No. 77; the second one is formed by modes No. 79 and 80 (see Table S2). Calculations by the second method predict a different ratio of absorptions in the bands, which leads to a different resulting contour (see Figure 5). With a larger peak width, it will be more similar to the contour of the bands from the spectrum of naphthazirin [46]. Only one peak has a frequency in the range of 1592–1603 cm−1 [22,26,29], which may be a consequence of the combination of several vibrational modes into one band. To illustrate this effect, Figure S3 shows the contours of the spectra in the range 400–1700 cm−1 obtained with different widths of individual lines.
Both computational methods predict that the main contribution to vibrational modes No. 69–74 comes from δ(CH3) and δ(CH2) vibrations. Their absorption activity is weak compared to other bands in the considered range.
For this compound, the most IR-active vibrational modes are observed in the range of 1100–1500 cm−1. Figure 6 presents atomic displacement patterns calculated by the first approach for several the most active modes.
A common characteristic feature of these modes is the significant contribution of δ(OH) vibrations localized in one or two OH groups. In this case, the high-frequency modes are characterized by a larger contributions of the modes of higher frequencies. For example, the highest-frequency modes, No. 67 and 68, are characterized by a contribution of the ν(C=C) vibrations, as well as the δ(HCH) vibrations.
As the frequency decreases, although symmetric bending vibrations are observed in modes No. 62 and No. 65, the contribution from bond stretching vibrations of single bonds also becomes more and more significant. In this case, the δ(CCH) vibrations are noted already for modes No. 53, 56, 59, and 61, and a rocking type of motions in methyl groups is clearly manifested for modes No. 53 and No. 56. The most IR active mode is mode no. 56, whose features include stretching vibrations of single bonds, in particular ν(O16-C8) and ν(C3-O11), coupled with significant admixture of a δ(HCC) and δ(HOC) deformations and the rocking type deformations of the methyl group.
The position of the strong peak observed in the experimental IR absorption spectrum of fusarubin at about 1215 cm−1 [31] is close in frequency to mode No. 56, which is also theoretically intense. However, in the IR absorption spectrum of naphthazarin, this peak is not the most intense. This can be explained by the fact that in mode No. 56 an additional contribution to the dipole moment variation is caused by the ν(C-O) vibrations, which are present in fusarubin and absent in naphthazarin. This makes the IR-activity of a similar mode of naphthazarin lesser. Also, in the experimental spectrum, the presence of a peak around 1150 cm−1 was noted [22,29]. In the calculated spectra, this peak can be associated with mode No. 53 of close frequency. A similar line was observed in the spectrum of fusarubin at about 1150 cm−1 [31].
The vibrational modes No.44-50 are characterized by an increasing contribution from rocking type for methyl groups, bending CCH, along with single bond stretching vibrations. The most polar single bonds in this case are the C–O vibrations in the pyran ring and in the O–Me bond. On the low-frequency side of the range, a contribution from deformation vibrations in the carbon core appears (see, for example, atomic displacements in mode no. 44 (Table S2).
Several moderate IR-active modes are predicted in the 750–895 cm−1 region. A characteristic feature of modes in this range is the appearance of a contribution from torsional vibrations with hydrogen atom, the most active are vibrational modes No.40 and No.43 with the most significant contribution from τ(HOCC). According to calculations within the first approach, the frequency of mode No. 43 is close to the position of the peak 870 cm−1, which may be associated with torsional vibrations in identical parts of the fusarubin and anhydrofusarubin molecules. At the same time, vibrations in mode No. 40 occur predominantly with variation in the dihedral angle H24O15C14C4. Note that the O15H24 group in anhydrofusarubin has a different environment than in fusarubin owing to the presence of the pyran ring. This difference leads to an increase in frequency.
Depending on the atomic displacements, in the range of 375–700 cm−1, the modes can be divided into two large groups: with predominantly in-plane motion and with out-of-plane motion (contribution of torsional vibrations). Modes with out-of-plane atomic motions are often characterized by a contribution of the tors(HCCC) type. Vibrational modes with planar motion are characterized by the presence of deformation vibrations in the rings (δ(CCC)), as well as deformation vibrations in the end parts or attached radicals of the form δ(CCO) or δ(CCO). As an example, atomic displacements in modes No.22 and 28 could be considered; see Figure 7. Deformations in rings 1 and 2 occur in antiphase in mode No. 22, i.e., one ring expands and the second narrows, evidenced by the oppositely directed amplitudes of C6 and C9 atomic displacements with the corresponding oxygens of one ring and carbons C12 and C14 of the second ring. One of the largest atomic displacements is δ(C8C7C6) in mode No. 28; δ(C5C12O13) and δ(C7C8O16) are involved along with it.

3.3. UV-Vis Absorbance Spectroscopy

A calculation of 70 lower singlet transitions was carried out via two approaches for a single molecule in the gas phase. The resulting spectrum, as well as the transitions’ oscillator strengths in the UV-Vis region, are shown in Figure 8. The presence of three intense maxima (peaks 1, 3, and 5) and one weak maximum (peak 2) was noted in the practically important range of 180–900 nm in the calculated spectrum. Another low-intensity peak, peak 4, against the background of a wide peak, peak 5, was obtained by comparison with the data presented in [45]. Qualitatively, the calculated spectrum for a single molecule in the gas phase was similar to the spectrum presented in [28]. The longest-wavelength broad peak corresponded to the transition HOMO (MO75) -> LUMO (MO76); see Figure 8 and Figure 9 and Table 2. Contributions to the transition from various MOs are presented in Table 2, and the bonding and antibonding regions for MOs are in Figure 9. The resulting calculated spectrum shows two peaks with the highest absorption, which is in qualitative agreement with the description in [46] and the demonstrated spectrum in [28]. In general, the first approach predicted peak positions in the UV-vis absorption spectrum more accurately than the second approach (see Table 2 and Table S4) in the calculation conditions. The observed discrepancies may be due to the underestimation of the hydrogen interaction and a significant overestimation of the energy difference between MOs LUMO-HOMO. Based on the calculated energies HOMO and LUMO MOs, such parameters as ionization potential, electron affinity, electronegativity, electrophilicity index, chemical hardness, and chemical softness were calculated. These parameters were estimated based on formulas on the energies of HOMO and LUMO orbitals [47,48]. The estimations for the first approach are listed in Table 3. The comparison of estimated parameters for both approaches is demonstrated in Table S5.

4. Conclusions

A theoretical study of the anhydrofusarubin molecule in the gas phase was performed using two different exchange-correlation DFT functionals. The structure of the anhydrofusarubin crystal was theoretically determined using the GGA-PBE-G6 approach. Two molecular structures are compared and the crystalline environment effect is analyzed.
In the course of studying the structural features of the molecule, it was shown that the pyran ring has significant flexibility, which manifests itself in the possibility of changing the position of the oxygen atom, as well as nearby equatorial and axial hydrogen atoms in the CH2 group. Considering a single molecule, the potential barrier to such a transition is relatively small (about 1.0–1.5 kcal/mol), and thus, the transition can be reversible. This fact was confirmed in the experimentally determined structure of this molecular crystal, obtained earlier. The study of hydrogen bond tautomerism in the MeO-naphthazarin part of anhydrofusarubin showed the possibility of the existence of a tautomer with a significant concentration of molecules even at room temperature. The potential energy for this structure is higher by 0.78–0.9 kcal/mol compared with the ground state energy.
The vibrational states and the IR absorption spectrum spectra of anhydrofusarubin in the gas phase were calculated and interpreted. In addition, the electronic absorption spectrum in the UV-vis range was calculated. The transition energies (wavelengths) and oscillator strength were determined. It is shown that these computational results are in fairly close agreement with the experimental spectra in the range of 180–600 nm.

Supplementary Materials

The following supporting information can be downloaded at: https://www.mdpi.com/article/10.3390/cryst13111556/s1: Figure S1. The optimized structure of naphthazarin molecule with 1st approach (a) and comparison; Table S1. The optimized lattice constants, angles, and energy for anhydrofusarubin crystal shown in Figure 1b and comparison with experimental data from [2,3]; Table S2. Calculated vibration frequencies in the most stable conformation of the anhydrofusarubin molecule, calculated by two methods along with their interpretation; Figure S2. Theoretical IR absorption spectra calculated by 1st (a) and 2nd (b) approaches with unscaled (as is) frequencies; Figure S3. Theoretical scaled IR absorption spectra calculated by 1st (a) with HWHM 4 (blue) and 20 cm−1 (black) and 2nd (b) approaches with HWHM 4 (red) and 20 cm−1 (black); Table S3. The optimized lattice constants, angles, and energy for tautomer crystal; Table S4. Comparison of predicted wavelength transitions for first and second methods; Table S5. Calculated with the two approaches, HOMO and LUMO energies and related parameters for the molecule in GP.

Author Contributions

Conceptualization, D.P., M.S. and A.P.; formal analysis, D.P. and M.S.; investigation, D.P., S.B., M.S., M.M., A.G., V.N. and A.D.; writing—original draft preparation, D.P., S.K. and A.P.; writing—review and editing, D.P., M.S., O.N., A.P., E.B., M.M., A.G. and V.N.; visualization, D.P.; supervision, A.P. and M.M. All authors have read and agreed to the published version of the manuscript.

Funding

This work was supported by a grant of the Ministry of Science and Higher Education of the Russian Federation for large scientific project in priority areas of scientific and technological development (grant number 075-15-2020-774).

Data Availability Statement

The data presented in this study are available in the article.

Acknowledgments

The authors express their gratitude to the resource centers: “Optical and Laser Materials Research” of the Research Park of St. Petersburg State University.

Conflicts of Interest

The authors declare no conflict of interest.

References

  1. Toghueo, R.M.K. Bioprospecting Endophytic Fungi from Fusarium Genus as Sources of Bioactive Metabolites. Mycology 2020, 11, 1–21. [Google Scholar] [CrossRef] [PubMed]
  2. Ahmed, A.M.; Mahmoud, B.K.; Millán-Aguiñaga, N.; Abdelmohsen, U.R.; Fouad, M.A. The Endophytic Fusarium Strains: A Treasure Trove of Natural Products. RSC Adv. 2023, 13, 1339–1369. [Google Scholar] [CrossRef] [PubMed]
  3. Kundu, A.; Mandal, A.; Saha, S.; Prabhakaran, P.; Walia, S. Fungicidal Activity and Molecular Modeling of Fusarubin Analogues from Fusarium oxysporum. Toxicol. Environ. Chem. 2020, 102, 78–91. [Google Scholar] [CrossRef]
  4. Daniel, J.J.; Zabot, G.L.; Tres, M.V.; Harakava, R.; Kuhn, R.C.; Mazutti, M.A. Fusarium Fujikuroi: A Novel Source of Metabolites with Herbicidal Activity. Biocatal. Agric. Biotechnol. 2018, 14, 314–320. [Google Scholar] [CrossRef]
  5. Spanic, V.; Katanic, Z.; Sulyok, M.; Krska, R.; Puskas, K.; Vida, G.; Drezner, G.; Šarkanj, B. Multiple Fungal Metabolites Including Mycotoxins in Naturally Infected and Fusarium-Inoculated Wheat Samples. Microorganisms 2020, 8, 578. [Google Scholar] [CrossRef]
  6. Cuperlovic-Culf, M.; Wang, L.; Forseille, L.; Boyle, K.; Merkley, N.; Burton, I.; Fobert, P.R. Metabolic Biomarker Panels of Response to Fusarium Head Blight Infection in Different Wheat Varieties. PLoS ONE 2016, 11, e0153642. [Google Scholar] [CrossRef]
  7. Shinha, K.K.; Bhatnagar, D. Mycotoxins in Agriculture and Food Safety; CRC Press: Boca Raton, FL, USA, 1998. [Google Scholar]
  8. Pankin, D.; Povolotckaia, A.; Kalinichev, A.; Povolotskiy, A.; Borisov, E.; Moskovskiy, M.; Gulyaev, A.; Lavrov, A.; Izmailov, A. Complex Spectroscopic Study for Fusarium Genus Fungi Infection Diagnostics of “Zalp” Cultivar Oat. Agronomy 2021, 11, 2402. [Google Scholar] [CrossRef]
  9. Gámiz-Gracia, L.; García-Campaña, A.M.; Arroyo-Manzanares, N. Application of LC–MS/MS in the Mycotoxins Studies. Toxins 2020, 12, 272. [Google Scholar] [CrossRef]
  10. Pankin, D.; Smirnov, M.; Povolotckaia, A.; Povolotskiy, A.; Borisov, E.; Moskovskiy, M.; Gulyaev, A.; Gerasimenko, S.; Aksenov, A.; Litvinov, M.; et al. DFT Modelling of Molecular Structure, Vibrational and UV-Vis Absorption Spectra of T-2 Toxin and 3-Deacetylcalonectrin. Materials 2022, 15, 649. [Google Scholar] [CrossRef]
  11. Makino, T.; Kato, K.; Lyozumi, H.; Honzawa, H.; Tachiiri, Y.; Hiramatsu, M. Ultraweak Luminescence Generated by Sweet Potato and Fusarium oxysporum Interactions Associated with a Defense Response. Photochem. Photobiol. 1996, 64, 953–956. [Google Scholar] [CrossRef]
  12. Moskovskiy, M.N.; Belyakov, M.V.; Dorokhov, A.S.; Boyko, A.A.; Belousov, S.V.; Noy, O.V.; Gulyaev, A.A.; Akulov, S.I.; Povolotskaya, A.; Efremenkov, I.Y. Design of Device for Optical Luminescent Diagnostic of the Seeds Infected by Fusarium. Agriculture 2023, 13, 619. [Google Scholar] [CrossRef]
  13. Pankin, D.; Povolotckaia, A.; Borisov, E.; Povolotskiy, A.; Borzenko, S.; Gulyaev, A.; Gerasimenko, S.; Dorochov, A.; Khamuev, V.; Moskovskiy, M. Investigation of Spectroscopic Peculiarities of Ergot-Infected Winter Wheat Grains. Foods 2023, 12, 3426. [Google Scholar] [CrossRef] [PubMed]
  14. Dorokhov, A.; Moskovskiy, M.; Belyakov, M.; Lavrov, A.; Khamuev, V. Detection of Fusarium Infected Seeds of Cereal Plants by the Fluorescence Method. PLoS ONE 2022, 17, e0267912. [Google Scholar] [CrossRef] [PubMed]
  15. Zhang, X.; Yu, X.; Wen, K.; Li, C.; Mujtaba Mari, G.; Jiang, H.; Shi, W.; Shen, J.; Wang, Z. Multiplex Lateral Flow Immunoassays Based on Amorphous Carbon Nanoparticles for Detecting Three Fusarium Mycotoxins in Maize. J. Agric. Food Chem. 2017, 65, 8063–8071. [Google Scholar] [CrossRef]
  16. Pillay, A.; Rousseau, A.L.; Fernandes, M.A.; de Koning, C.B. The Synthesis of the Pyranonaphthoquinones Dehydroherbarin and Anhydrofusarubin Using Wacker Oxidation Methodology as a Key Step and Other Unexpected Oxidation Reactions with Ceric Ammonium Nitrate and Salcomine. Org. Biomol. Chem. 2012, 10, 7809. [Google Scholar] [CrossRef]
  17. Wu, Q.; Patocka, J.; Nepovimova, E.; Kuca, K. A Review on the Synthesis and Bioactivity Aspects of Beauvericin, a Fusarium Mycotoxin. Front. Pharmacol. 2018, 9, 1338. [Google Scholar] [CrossRef]
  18. Adeleke, B.; Babalola, O. Pharmacological Potential of Fungal Endophytes Associated with Medicinal Plants: A Review. J. Fungi 2021, 7, 147. [Google Scholar] [CrossRef]
  19. Tatum, J.H.; Baker, R.A. Naphthoquinones Produced by Fusarium Solani Isolated from Citrus. Phytochemistry 1983, 22, 543–547. [Google Scholar] [CrossRef]
  20. Shao, C.-L.; Wang, C.-Y.; Deng, D.-S.; She, Z.-G.; Gu, Y.-C.; Lin, Y.-C. Crystal Structure of a Marine Natural Compound, Anhydrofusarubin. Chin. J. Struct. Chem. 2008, 27, 824–828. [Google Scholar]
  21. Tatum, J.H.; Baker, R.A.; Berry, R.E. Metabolites of Fusarium Solani. Phytochemistry 1989, 28, 283–284. [Google Scholar] [CrossRef]
  22. Tadpetch, K.; Vijitphan, P. Synthesis of 8-0-Methylfusarubin, 8-0-Methylanhydrofusarubin, Fusarubin and Anhydrofusarubin. Doctoral Dissertation, Prince of Songkla University, Hat Yai, Thailand, 2019. [Google Scholar]
  23. Suzuki, M.; Nishida, N.; Ishihara, A.; Nakajima, H. New 3-O-Alkyl-4a,10a-dihydrofusarubins Produced by Fusarium sp. Mj-2. Biosci. Biotechnol. Biochem. 2013, 77, 271–275. [Google Scholar] [CrossRef] [PubMed]
  24. Khan, M.I.H.; Sohrab, M.H.; Rony, S.R.; Tareq, F.S.; Hasan, C.M.; Mazid, M.A. Cytotoxic and Antibacterial Naphthoquinones from an Endophytic Fungus, Cladosporium sp. Toxicol. Rep. 2016, 3, 861–865. [Google Scholar] [CrossRef] [PubMed]
  25. Buckingham, J. Dictionary of Natural Products, Supplement 1; Chapman & Hall: London, UK, 1994. [Google Scholar]
  26. Khan, N.; Afroz, F.; Begum, M.N.; Roy Rony, S.; Sharmin, S.; Moni, F.; Mahmood Hasan, C.; Shaha, K.; Sohrab, M.H. Endophytic Fusarium Solani: A Rich Source of Cytotoxic and Antimicrobial Napthaquinone and Aza-Anthraquinone Derivatives. Toxicol. Rep. 2018, 5, 970–976. [Google Scholar] [CrossRef] [PubMed]
  27. Adorisio, S.; Fierabracci, A.; Muscari, I.; Liberati, A.; Cannarile, L.; Thuy, T.; Sung, T.; Sohrab, H.; Hasan, C.; Ayroldi, E.; et al. Fusarubin and Anhydrofusarubin Isolated from A Cladosporium Species Inhibit Cell Growth in Human Cancer Cell Lines. Toxins 2019, 11, 503. [Google Scholar] [CrossRef]
  28. Ammar, M.S.; Gerber, N.N.; Mcdaniel, L.E. New Antibiotic Pigments Related to Fusarubin from Fusarium Solani (MART.) SACC. I. Fermentation, Islation, and Antimicrobial Activities. J. Antibiot. 1979, 32, 679–684. [Google Scholar] [CrossRef]
  29. Vijitphan, P.; Rukachaisirikul, V.; Muanprasat, C.; Iawsipo, P.; Panprasert, J.; Tadpetch, K. Unified Synthesis and Cytotoxic Activity of 8-O-Methylfusarubin and Its Analogues. Org. Biomol. Chem. 2019, 17, 7078–7087. [Google Scholar] [CrossRef]
  30. Hasan, S.; Ansari, M.; Ahmad, A.; Mishra, M. Major Bioactive Metabolites from Marine Fungi: A Review. Bioinformation 2015, 11, 176–181. [Google Scholar] [CrossRef]
  31. Gerber, N.N.; Ammar, M.S. New Antibiotic Pigments Related to Fusarubin from Fusarium Solani (MART.) SACC. II. Structure Elucidations. J. Antibiot. 1979, 32, 685–688. [Google Scholar] [CrossRef]
  32. De Gussem, K. Mycotechnology: Present Status & Future Prospects; I K International Publishing: Delhi, India, 2007; pp. 288–301. [Google Scholar]
  33. Volkov, V.V.; Perry, C.C. Fungal Pigments on Paper: Raman and Quantum Chemistry Studies of Alternaria Sp. Dyes Pigments 2021, 195, 109719. [Google Scholar] [CrossRef]
  34. Pankin, D.; Povolotckaia, A.; Borisov, E.; Belyakov, M.; Borzenko, S.; Gulyaev, A.; Moskovskiy, M. Theoretical Modelling of Structure, Vibrational and UV–Vis Absorbance Spectra of Rubrofusarin Molecule. Spectrochim. Acta Part A Mol. Biomol. Spectrosc. 2023, 293, 122469. [Google Scholar] [CrossRef]
  35. Zięba, S.; Piotrowska, A.; Mizera, A.; Ławniczak, P.; Markiewicz, K.H.; Gzella, A.; Dubis, A.T.; Łapiński, A. Spectroscopic and Structural Study of a New Conducting Pyrazolium Salt. Molecules 2021, 26, 4657. [Google Scholar] [CrossRef]
  36. Sutradhar, D.; Chandra, A.K.; Zeegers-Huyskens, T. Theoretical Study of the Interaction of Fluorinated Dimethyl Ethers and the ClF and HF Molecules. Comparison between Halogen and Hydrogen Bonds. Int. J. Quantum Chem. 2016, 116, 670–680. [Google Scholar] [CrossRef]
  37. Frisch, M.J.; Trucks, G.W.; Schlegel, H.B.; Scuseria, G.E.; Robb, M.A.; Cheeseman, J.R.; Scalmani, G.; Barone, V.; Mennucci, B.; Petersson, G.A.; et al. Gaussian 09, Revision C.01. 2010. Available online: https://www.scienceopen.com/document?vid=45b5a7ba-f6ee-40ce-b346-7407f99a540d (accessed on 25 October 2023).
  38. Clark, S.J.; Segall, M.D.; Pickard, C.J.; Hasnip, P.J.; Probert, M.I.J.; Refson, K.; Payne, M.C. First Principles Methods Using CASTEP. Z. Kristallogr. Cryst. Mater. 2005, 220, 567–570. [Google Scholar] [CrossRef]
  39. Kohn, W.; Sham, L.J. Self-Consistent Equations Including Exchange and Correlation Effects. Phys. Rev. 1965, 140, A1133–A1138. [Google Scholar] [CrossRef]
  40. Grimme, S. Semiempirical GGA-type Density Functional Constructed with a Long-range Dispersion Correction. J. Comput. Chem. 2006, 27, 1787–1799. [Google Scholar] [CrossRef] [PubMed]
  41. Pfrommer, B.G.; Côté, M.; Louie, S.G.; Cohen, M.L. Relaxation of Crystals with the Quasi-Newton Method. J. Comput. Phys. 1997, 131, 233–240. [Google Scholar] [CrossRef]
  42. Cambridge Crystallographic Data Centre. Available online: https://www.ccdc.cam.ac.uk/Structures/Search?Compound=anhydrofusarubin&DatabaseToSearch=Published (accessed on 25 October 2023).
  43. Caballero, B.; Trugo, L.; Finglas, P. (Eds.) Encyclopedia of Food Sciences and Nutrition; Elsevier Science B.V.: Amsterdam, The Netherlands, 2003. [Google Scholar]
  44. Mayo, D.W.; Miller, F.A.; Hannah, R.W. (Eds.) Course Notes on the Interpretation of Infrared and Raman Spectra; John Wiley & Sons, Inc.: Hoboken, NJ, USA, 2004; ISBN 9780471690085. [Google Scholar]
  45. Paul, S.O.; Schutte, C.J.H.; Hendra, P.J. The Fourier Transform Raman and Infrared Spectra of Naphthazarin. Spectrochim. Acta Part A Mol. Spectrosc. 1990, 46, 323–329. [Google Scholar] [CrossRef]
  46. Frisvad, J.C.; Thrane, U. Standardized High-Performance Liquid Chromatography of 182 Mycotoxins and Other Fungal Metabolites Based on Alkylphenone Retention Indices and UV—VIS Spectra (Diodearray Detection). J. Chromatogr. A 1987, 404, 195–214. [Google Scholar] [CrossRef]
  47. Onda, K.; Yamochi, H.; Koshihara, S. Diverse Photoinduced Dynamics in an Organic Charge-Transfer Complex Having Strong Electron–Phonon Interactions. Acc. Chem. Res. 2014, 47, 3494–3503. [Google Scholar] [CrossRef]
  48. Parsaee, Z.; Mohammadi, K.; Ghahramaninezhad, M.; Hosseinzadeh, B. A Novel Nano-Sized Binuclear Nickel(II) Schiff Base Complex as a Precursor for NiO Nanoparticles: Synthesis, Characterization, DFT Study and Antibacterial Activity. New J. Chem. 2016, 40, 10569–10583. [Google Scholar] [CrossRef]
Figure 1. (a)—Schematic representation of the most stable anhydrofusarubin molecule; (b)—optimized geometry of the most stable structure of anhydrofusarubin molecule in the gas phase with numbering of atoms and cycles (I, II, III are the notations for the 1st, 2nd and 3rd rings correspondingly); (c)—optimized unit cell of anhydrofusarubin crystal (the lattice constants are presented in Table S1).
Crystals 13 01556 g001
Figure 2. Scan of the total potential energy as the angle C25C27H29 changes, calculated by the 1st approach (blue) and the 2nd (red) approaches for the case of the gas phase.
Crystals 13 01556 g002
Figure 3. (a): Potential energy scan when changing the dihedral angle C7C8O16C17 according to the first (blue) and second (red) computational approaches; green arrows highlight axis of the rotation. (b): Molecular structure in the third (left) and fifth (right) stages. (c): Profile view of the molecule in different stages of the transformation.
Crystals 13 01556 g003
Figure 4. The found optimized tautomer structures (ac) with respect to the ground state. The relative energy changes with the change in distance between O23 and H24 (d) and O13 and H22 atoms (e) according to the first (blue) and second (red) approaches.
Crystals 13 01556 g004
Figure 5. Theoretical IR absorption spectra calculated by 1st (a) and 2nd (b) approaches with scaled frequencies. The unscaled spectra are demonstrated in Figure S2 in Supporting Information.
Crystals 13 01556 g005
Figure 6. Atomic displacements in vibrational modes, obtained by calculation using the first approach.
Crystals 13 01556 g006
Figure 7. Atomic displacements in modes No. 22 and 28, calculated by the first approach.
Crystals 13 01556 g007
Figure 8. Calculated optic absorption spectrum (red) and oscillator strength (blue) for anhydrofusarubin molecule with the 1st approach in gas phase.
Crystals 13 01556 g008
Figure 9. Illustration of molecular orbitals for Table 2.
Crystals 13 01556 g009
Table 1. Comparison of structural parameters for the most stable anhydrofusarubin structure of the isolated molecule calculated with 1st approach and 2nd approaches and for the molecule in molecular crystal calculated by GGA-PBE-G6 method with experimental data from [20,42] *.
Theoretical Geometry for Single MoleculeXRD Data from [20,43]Theoretical Geometry for Molecules in Crystal Asymmetrical Unit
Bond, Å1st Approach2nd ApproachMolecule 1Molecule 2GGA-PBE-G6
Molecule 2
GGA-PBE-G6
Molecule 1
Ring IC7-C61.4581.4611.4481.4431.4511.445
C6-C51.4551.4601.4451.4511.4501.449
C5-C41.4201.4231.4211.4211.4191.421
C4-C91.4541.4581.4431.4461.4451.447
C9-C81.4981.5021.4921.4921.4871.491
C8-C71.3521.3481.3341.3341.3691.371
C6-O211.2481.2371.2561.2561.2751.278
C9-O231.2361.2261.2391.2391.2601.259
C8-O161.3351.3261.3391.3391.3431.339
O16-C171.4261.4181.4391.4381.4431.446
Ring IIC5-C121.4011.3931.3931.3891.4141.415
C12-C11.4071.4091.4021.4071.4131.412
C1-C21.3861.3791.3781.3781.3971.394
C2-C141.4241.4221.4181.4181.4331.432
C14-C41.4011.3941.3941.3941.4131.411
C12-O131.3391.3351.3441.3441.3411.341
C14-O151.3361.3331.3341.3341.3341.334
Ring IIIC1-C271.5011.5011.4981.4921.5041.506
C27-O111.4411.4281.4301.4301.4511.456
O11-C31.3571.3521.3511.3511.3591.355
C3-C251.3481.3461.3261.3261.3591.359
C25-C21.4461.4501.4431.4431.4381.437
C3-C301.4911.4901.4891.4881.4851.487
Angle, o
Ring IC7-C6-C5118.5118.7119.0119.2118.9119.0
C6-C5-C4120.4120.3119.9119.9120.4120.3
C5-C4-C9120.7120.5120.5120.2120.6120.9
C4-C9-C8117.4117.5117.5117.5117.8117.1
C9-C8-C7121.2121.3121.6121.6121.2121.5
C7-C6-O21119.7119.7119.8120.0120.6120.5
C8-C9-O23119.6119.6119.6119.6120.5120.6
C9-C8-O16112.2112.1111.8111.8112.7112.7
C8-C7-H10122.7122.8119.1119.3121.6121.8
C8-O16-C17118.0118.0117.1117.2116.9116.6
Ring IIC5-C12-C1119.6119.4120.1120.5119.9120.1
C12-C1-C2121.4121.4121.1120.4121.2120.6
C1-C2-C14119.5119.7120.0120.0119.1119.8
C2-C14-C4119.7119.5119.8119.8119.8119.9
C14-C4-C5120.2120.3120.1120.0120.3119.8
C4-C14-C15122.4123.3123.7123.7121.4122.2
C14-C15-H24106.2107.5104.8103.1104.8105.9
C5-C12-O13122.0123.0121.8122.0120.7120.7
C12-O13-H22105.5106.8101.8100.9103.6103.3
Ring IIIC1-C27-O11112.3111.9114.2114.1113.6114.0
C27-O11-C3116.4116.1118.4118.0117.8118.9
O11-C3-C25122.2122.0122.3122.3123.0122.9
C3-C25-C2119.4118.9120.7120.7119.6120.1
C25-C2-C1118.6118.4118.5118.2119.2119.1
C2-C1-C27117.1116.7118.3118.5118.3119.1
C1-C27-H_eq111.6111.8108.7108.7112.2112.3
C1-C27-H_ax110.3109.8108.7108.7109.9110.3
C3-C25-H26120.2120.4119.8119.7119.9120.2
C25-C3-C30125.7125.7126.2126.1125.5125.2
H29-C27-H28108.5108.7107.6107.6107.5107.6
Dihedral angle, o
C12-C1-C27-O11148.7146.9158.7−158.4−159.1162.5
C1-C27-O11-C342.745.532.6−33.8−34.328.6
C27-O11-C3-C25−23.7−25.3−21.222.321.4−18.6
O11-C3-C25-C2−6.2−6.6−0,10.51.3−0.9
C3-C25-C2-C14−162.4−160.9−171.1169.6171.1−171.3
C3-C25-C2-C114.515.67.6−9.7−9.08.5
C27-O11-C3-C33160.1158.4163.0−161.3−161.9164.3
* The parameters for first molecule absent in [20] were added from [42].
Table 2. Comparison of theoretically predicted singlet transitions within the first method and experimental data from past works.
Theoretical Results for GP Single MoleculeExperimental Data
[45][28]
Peak numberOscillator strengthOrbitals with >10% contribution (contribution percent)Wavelength, nm (energy, eV)Wavelength, nmWavelength, nm
Peak 10.228471–>78
(18%)
73–>78
(49%)
203 (6.1006)215
Peak 20.163074–>78
(81%)
241 (5.1536)235237
Peak 30.1579and0.184474–>77
(29%)
75–>78
(62%)
and
75–>77
(87%)
285 (4.3561)


and
298 (4.1562)
288290
Peak 40.037473–>76
(85%)
351 (3.5301)345
Peak 50.137175–>76 (93%)560 (2.2151)540 * and 570545
* Experimentally observed position of peak 5 depends on the solvent type that could be dealt with effect of different solvent polarity.
Table 3. Calculated with the first approach HOMO and LUMO energies and related parameters for the ground state molecule in the gas phase.
Estimated ValueMethod 1
LUMO energy, eV−3.15
HOMO energy, eV−5.75
LUMO-HOMO, eV2.60
Electron affinity, eV3.15
Ionization potential, eV5.75
Chemical hardness, eV1.30
Electronegativity, eV4.45
Electrophilicity index7.62
Chemical softness, eV−10.38
Disclaimer/Publisher’s Note: The statements, opinions and data contained in all publications are solely those of the individual author(s) and contributor(s) and not of MDPI and/or the editor(s). MDPI and/or the editor(s) disclaim responsibility for any injury to people or property resulting from any ideas, methods, instructions or products referred to in the content.

