Article

Si-Doped Nitrogenated Holey Graphene (C2N) as a Promising Gas Sensor for O-Containing Volatile Organic Compounds (VOCs) and Ammonia

1
MOE Key Laboratory of Resources and Environmental System Optimization, College of Environmental Science and Engineering, North China Electric Power University, Beijing 102206, China
2
Department of Physics and Collaborative Innovation Center for Optoelectronic Semiconductors and Efficient Devices, Fujian Provincial Key Laboratory of Theoretical and Computational Chemistry, Xiamen University, Xiamen 361005, China
*
Authors to whom correspondence should be addressed.
Crystals 2023, 13(5), 816; https://doi.org/10.3390/cryst13050816
Submission received: 15 April 2023 / Revised: 10 May 2023 / Accepted: 11 May 2023 / Published: 14 May 2023
(This article belongs to the Special Issue First Principles Calculation for Crystalline Materials)

Abstract

:
Two-dimensional (2D) crystalline materials have been regarded as promising sensor materials due to their large specific surface area, high sensitivity, and low cost. In the present work, based on the density functional theory (DFT) method, the sensor performance of novel silicon (Si)-doped nitrogenated holey graphene (SiC2N) toward five typical VOCs (HCHO, CH3OH, C3H6O, C6H6, and C2HCl3) and ammonia were systematically investigated. The results demonstrated that Si doping could effectively decrease the band gap of C2N and simultaneously provide active sites for gas adsorption. Through comprehensive analyses of adsorption energies and electronic properties, the SiC2N was found to exhibit high selectivity for O-containing VOCs (HCHO, CH3OH, and C3H6O) and NH3 via a covalent bond. Moreover, after the HCHO, CH3OH, C3H6O, and NH3 adsorption, the band gap of SiC2N greatly decreases from 1.07 eV to 0.29, 0.13, 0.25, and 0.12 eV, respectively, which indicated the enhancement the conductivity and enabled the SiC2N to be a highly sensitive resistive-type sensor. In addition, the SiC2N possesses a short recovery time. For instance, the recovery time of HCHO desorbed from SiC2N is 29.2 s at room temperature. Our work anticipates a wide range of potential applications of Si-doped C2N for the detection of toxic VOCs and ammonia, and supplies a valuable reference for the development of C2N-based gas sensors.

1. Introduction

Along with the improvement of residential air tightness, the issues related to indoor air pollution have aroused increasing critical attention. Volatile organic compounds (VOCs) and ammonia are identified as the main indoor contaminants that are mainly emitted from building and furnishing materials [1]. Long-term exposure to these harmful gases can cause severe health problems such as headaches, respiratory tract irritation, nervous system injury, and even cancer such as leukemia, etc. [2,3]. Given the increasing health hazard, the environmental monitoring of exposed VOCs is desired.
Over time, researchers have devoted continuous efforts to develop novel and high-performance capture agents for gaseous contaminants detection [4,5,6]. Two-dimensional (2D) and nonmetal materials, such as graphene, graphdiyne, phosphorene, carbon nitrides, etc., have been widely used in interdisciplinary regions, such as gas sensors [7,8,9,10,11,12,13,14,15], spintronics [16,17], photo- or electro- catalysis [18,19], and so on, due to their large specific surface area, unique electronic properties, and low cost. Additionally, such 2D materials that act as sensor materials exhibited high sensitivity in minute concentrations. For instance, the graphene/polyaniline nanocomposite proposed by Wu et al. [9] exhibited high sensitivity for ammonia molecules at ppm level. In addition, Ahmad’s group [12] reported that the detection limit of black phosphorus toward NO2 was as low as 5 ppb. Very recently, a novel 2D nitrogenated holey graphene (C2N) was synthesized by Mahmood’s group [20] through a bottom-up wet-chemical reaction. The newly synthesized C2N possesses a high specific surface area and uniformly distributed pores and is deemed a potential candidate for gas detection. Previous computational works manifested that C2N-based materials can be used in the detection of some toxic gases such as NI3 [21], H2S [22], and so on [23,24]. However, the pristine C2N exhibited finite adsorption ability, low selectivity, and low sensitivity toward VOCs and ammonia (NH3) [25,26,27]. Can the sensor performance of C2N toward VOCs and ammonia be regulated through appropriate functionalization strategies?
Previous studies have demonstrated that heteroatom doping can not only offer active sites for gas adsorption but also promote the charge transfer between gases and substrate, thereby effectively enhancing the sensor performance of materials. For instance, metal oxides doped with Sc [28] and Ag [29] atoms exhibited enhanced sensor performance toward VOCs in contrast with their pure phase. Additionally, it has been reported that B [30], N [31], and Li [32] atoms doping could effectively enhance the selective recognition of carbon-based materials toward VOCs and ammonia. In addition, previous theoretical studies have reported that metal (e.g., Al and Ti)-doped C2N were potential sensing materials for certain VOCs [27,33]. At present, it remains curious if nonmetal-modified C2N is an efficient sensor material for VOCs. Silicon (Si), as one of the most earth-abundant elements, is non-toxic and environmentally friendly. Ren and coworkers [34] have prepared Si-doped metastable ε-phase WO3 as a gas sensor for acetone (C3H6O). It was found that Si element doping could not only provide abundant target–receptor sites for target gases but also enhance the charge transfer performance of WO3. The synthesized Si-doped ε-WO3-based detector exhibited high sensitivity (a detection limit of 10 ppb) and outstanding selectivity for C3H6O. In addition, Guntner and coworkers found that the sensor response of MoO3 toward NH3 increased twice via Si doping when compared to its pristine phase [35]. Very recently, the DFT method has been utilized by Singsen et al. [36] to investigate the chemical detection performance of Si-doped green phosphorene (Si-GreenP) for biotoxin volatile organic compounds. The results demonstrated that the Si-GreenP presented enhanced adsorption ability (almost ~five times greater than pure GreenP) and selectivity toward formaldehyde (HCHO) and C3H6O. Additionally, considerable changes have been found in the band gap and work function of Si-GreenP after gas adsorption, suggesting its excellent sensitivity as a gas sensor. Given these advances, Si-doped C2N may be a potential gas sensor for VOCs and NH3. However, at present, the understanding of electronic characteristics and potential sensor performance of Si-doped C2N remain in its infancy and needs further exploration.
In the current work, the dispersion corrected density functional theory was implemented to investigate the electronic properties of Si-doped nitrogenated holey graphene (SiC2N) as well as its sensor ability for typical VOCs (HCHO, methanol (CH3OH), C3H6O, benzene (C6H6), and trichloroethylene (C2HCl3)) and NH3. Firstly, the detailed doping modes of SiC2N and the inherent regulation of the Si atom on the electronic structures of C2N were exhaustively discussed. Next, we systematically analyzed the adsorption performance and selectivity of pure C2N and SiC2N toward various VOCs and NH3. It was found that after Si doping, the capture ability and selectivity of C2N toward O-containing VOCs and NH3 were dramatically improved. In addition, the SiC2N possessed high sensitivity and appropriate recovery time as a resistive-type sensor. These explorations aim to contribute a theoretical basis to existing knowledge and provide new insights for the design and development of high-performance C2N-based sensing materials used for VOCs and ammonia detection.

2. Materials and Methods

The 2 × 2 supercell of C2N was used as the basic computational model in the present work. A vacuum space of 20 Å in the z-direction was employed to avoid the interlayer interaction. All the spin-polarized density functional theory calculations were executed by using the Vienna ab initio simulation package (VASP) code [37]. The Perdew–Burke–Ernzerhof (PBE) functional within the generalized gradient approximation (GGA) was adopted to treat the exchange–correlation energies and potentials [38]. The interactions between core ions and valence electrons were depicted with the projector augmented wave (PAW) pseudopotential [39] with the cutoff energy set to 500 eV. Additionally, the D3 vdw correction proposed by S. Grimme was performed for the consideration of van der Waals interactions [40,41]. The convergence criteria for the total energy and the Hellmann–Feynman force were 10−5 eV and 0.01 eV/Å, respectively. The 3 × 3 × 1 and 7 × 7 × 1 Monkhorst–Pack grids were utilized for the geometric optimizations and electronic characteristics, respectively. In addition, the electronic structure calculations with HSE06 functional [42] were also carried out for partial systems with the Monkhorst–Pack grids of 7 × 7 × 1 to obtain accurate band structure and band-gap values. The formation energies for the Si atom doping process were calculated by the following equation:
Eform = E(SiC2N) − E(C2N) − μ(Si)
where the E(SiC2N) and E(C2N) were the total electronic energies of SiC2N and pristine C2N, respectively. The μ(Si) represented the potential energy of Si atoms, which was adopted as the cohesive energy of each Si atom in the Si-bulk (−4.63 eV).
The adsorption energies (Ead) of SiC2N toward gases were obtained by Formula (2):
Ead = E(SiC2N_gas) − E(SiC2N) − E(gas)
where the E(SiC2N_gas) and E(SiC2N) donated the total electronic energies of SiC2N_gas and SiC2N, respectively. Additionally, the E(gas) were the energies of isolated VOCs and NH3. In addition, the conductivity and adsorption of Gibbs free energies were found within the VASPKIT code [43]. Moreover, the Atomistix ToolKit (ATK) package was performed to investigate the transport properties of the SiC2N-based systems [44].

3. Results and Discussion

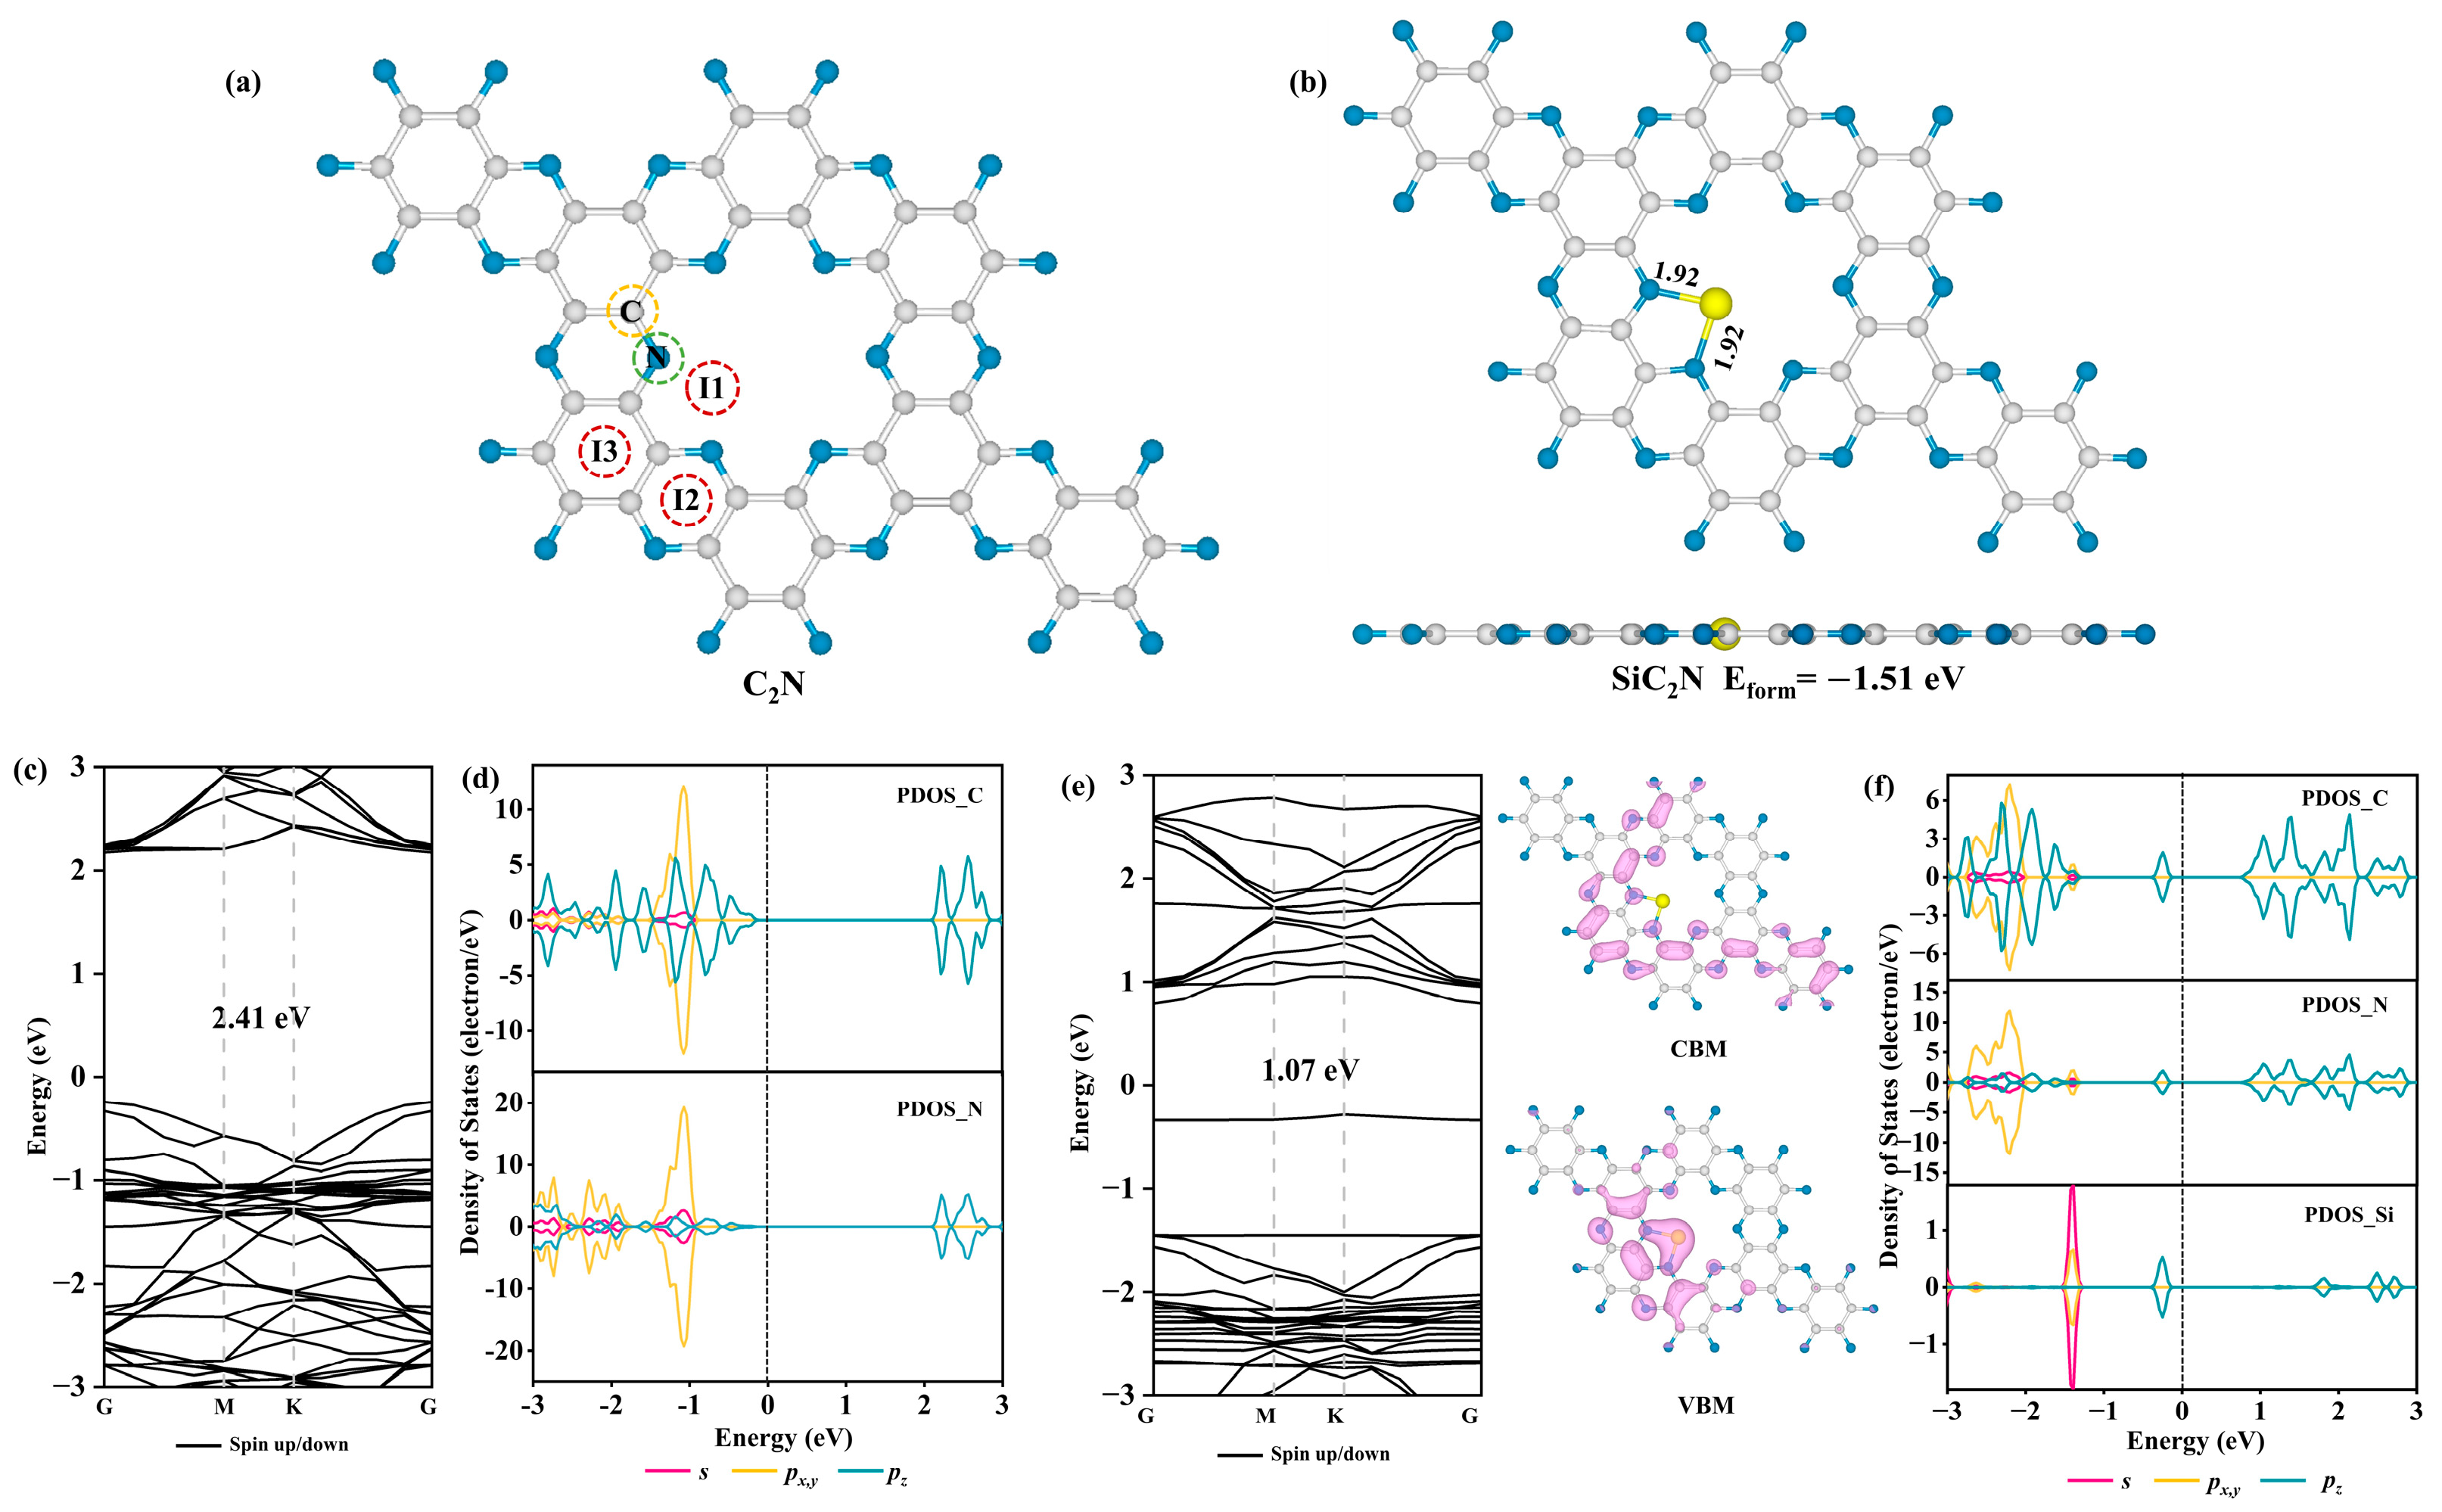
3.1. Geometric Configurations and Electronic Properties of Si-Doped C2N

Firstly, the incorporation configurations and formation energies of Si-doped C2N (SiC2N) were comprehensively investigated. As shown in Figure 1a, there are five distinct sites, including the C atom, N atom, and interstitial space (I1, I2, and I3) for Si doping; the optimized configurations are shown in Figure S1. The computational results demonstrate that the Si atom is more favorable to anchor on the I1 site with the formation energy of −1.51 eV. This configuration was filtered out and displayed in Figure 1b. The negative formation energy indicates that the doping process is exothermic, which provides significant feasibility in terms of experimental synthesis of Si-doped C2N. Herein, the doping density of the Si atom is at a relatively low level of 1.37 at%. Then, we only focus on this configuration. The stability of SiC2N was further validated by the ab initio molecular dynamics simulations (AIMD) [45] at 300 and 500 K for 10 ps, respectively. As shown in Figure S2, the geometric structure of SiC2N is well preserved at room temperature and even at 500 K, indicative of the high thermodynamic stability of SiC2N.
Then, the band structures and partial density of states (PDOS) plots were investigated with the HSE06 functional in Figure 1c–f to obtain accurate electronic characteristics of intrinsic C2N and SiC2N. Firstly, as shown in Figure 1c,d, the pristine C2N exhibits a semiconductor feature with a direct band gap of ~2.41 eV, which is quite consistent with previous studies [46]. As shown in Figure 1e, after Si doping, the band gap of SiC2N considerably decreases to 1.07 eV, which is conducive to electron transmission. Additionally, the Si doping yields a new state on the VBM, which is mainly localized around the Si atom. More notably, from the PDOS plot of SiC2N, we can observe that the VBM mainly consists of active pz electrons, which ensure high activity of SiC2N for gas adsorption. In addition, strong hybridization can be observed between Si and N atoms, signing strong covalent characters. Herein, the band structures of pure C2N and SiC2N were also calculated with the PBE functional, as displayed in Figure S3a,b. Additionally, the obtained band gap values for C2N and SiC2N with the PBE functional are 1.65 and 0.60 eV, respectively. To sum up, Si doping can effectively regulate the electronic structure of C2N, which will be beneficial for electron transmission and gas adsorption.
The electron localization function (ELF) map of SiC2N is presented in Figure 2a. The ELF map has been deemed a useful tool to directly ascertain the bonding nature and the degree of electron localization [47,48]. In general, the region with an ELF value > 0.5 signs covalent interaction and high electron localization [49]. Firstly, topographical analysis of ELF manifests that the formed Si-N exhibits a covalent feather. In addition, the highly localized electrons are located on the Si atom, which is susceptible to interaction with the incoming gas molecules. In addition, the charge density difference (CDD) plot of SiC2N between the Si atom and C2N was also analyzed in Figure 2b, from which we can see remarkable charge transfer between the Si atom and the substrate. Additionally, the Bader charge result demonstrates that the Si atom donates 1.28 e to the C2N.

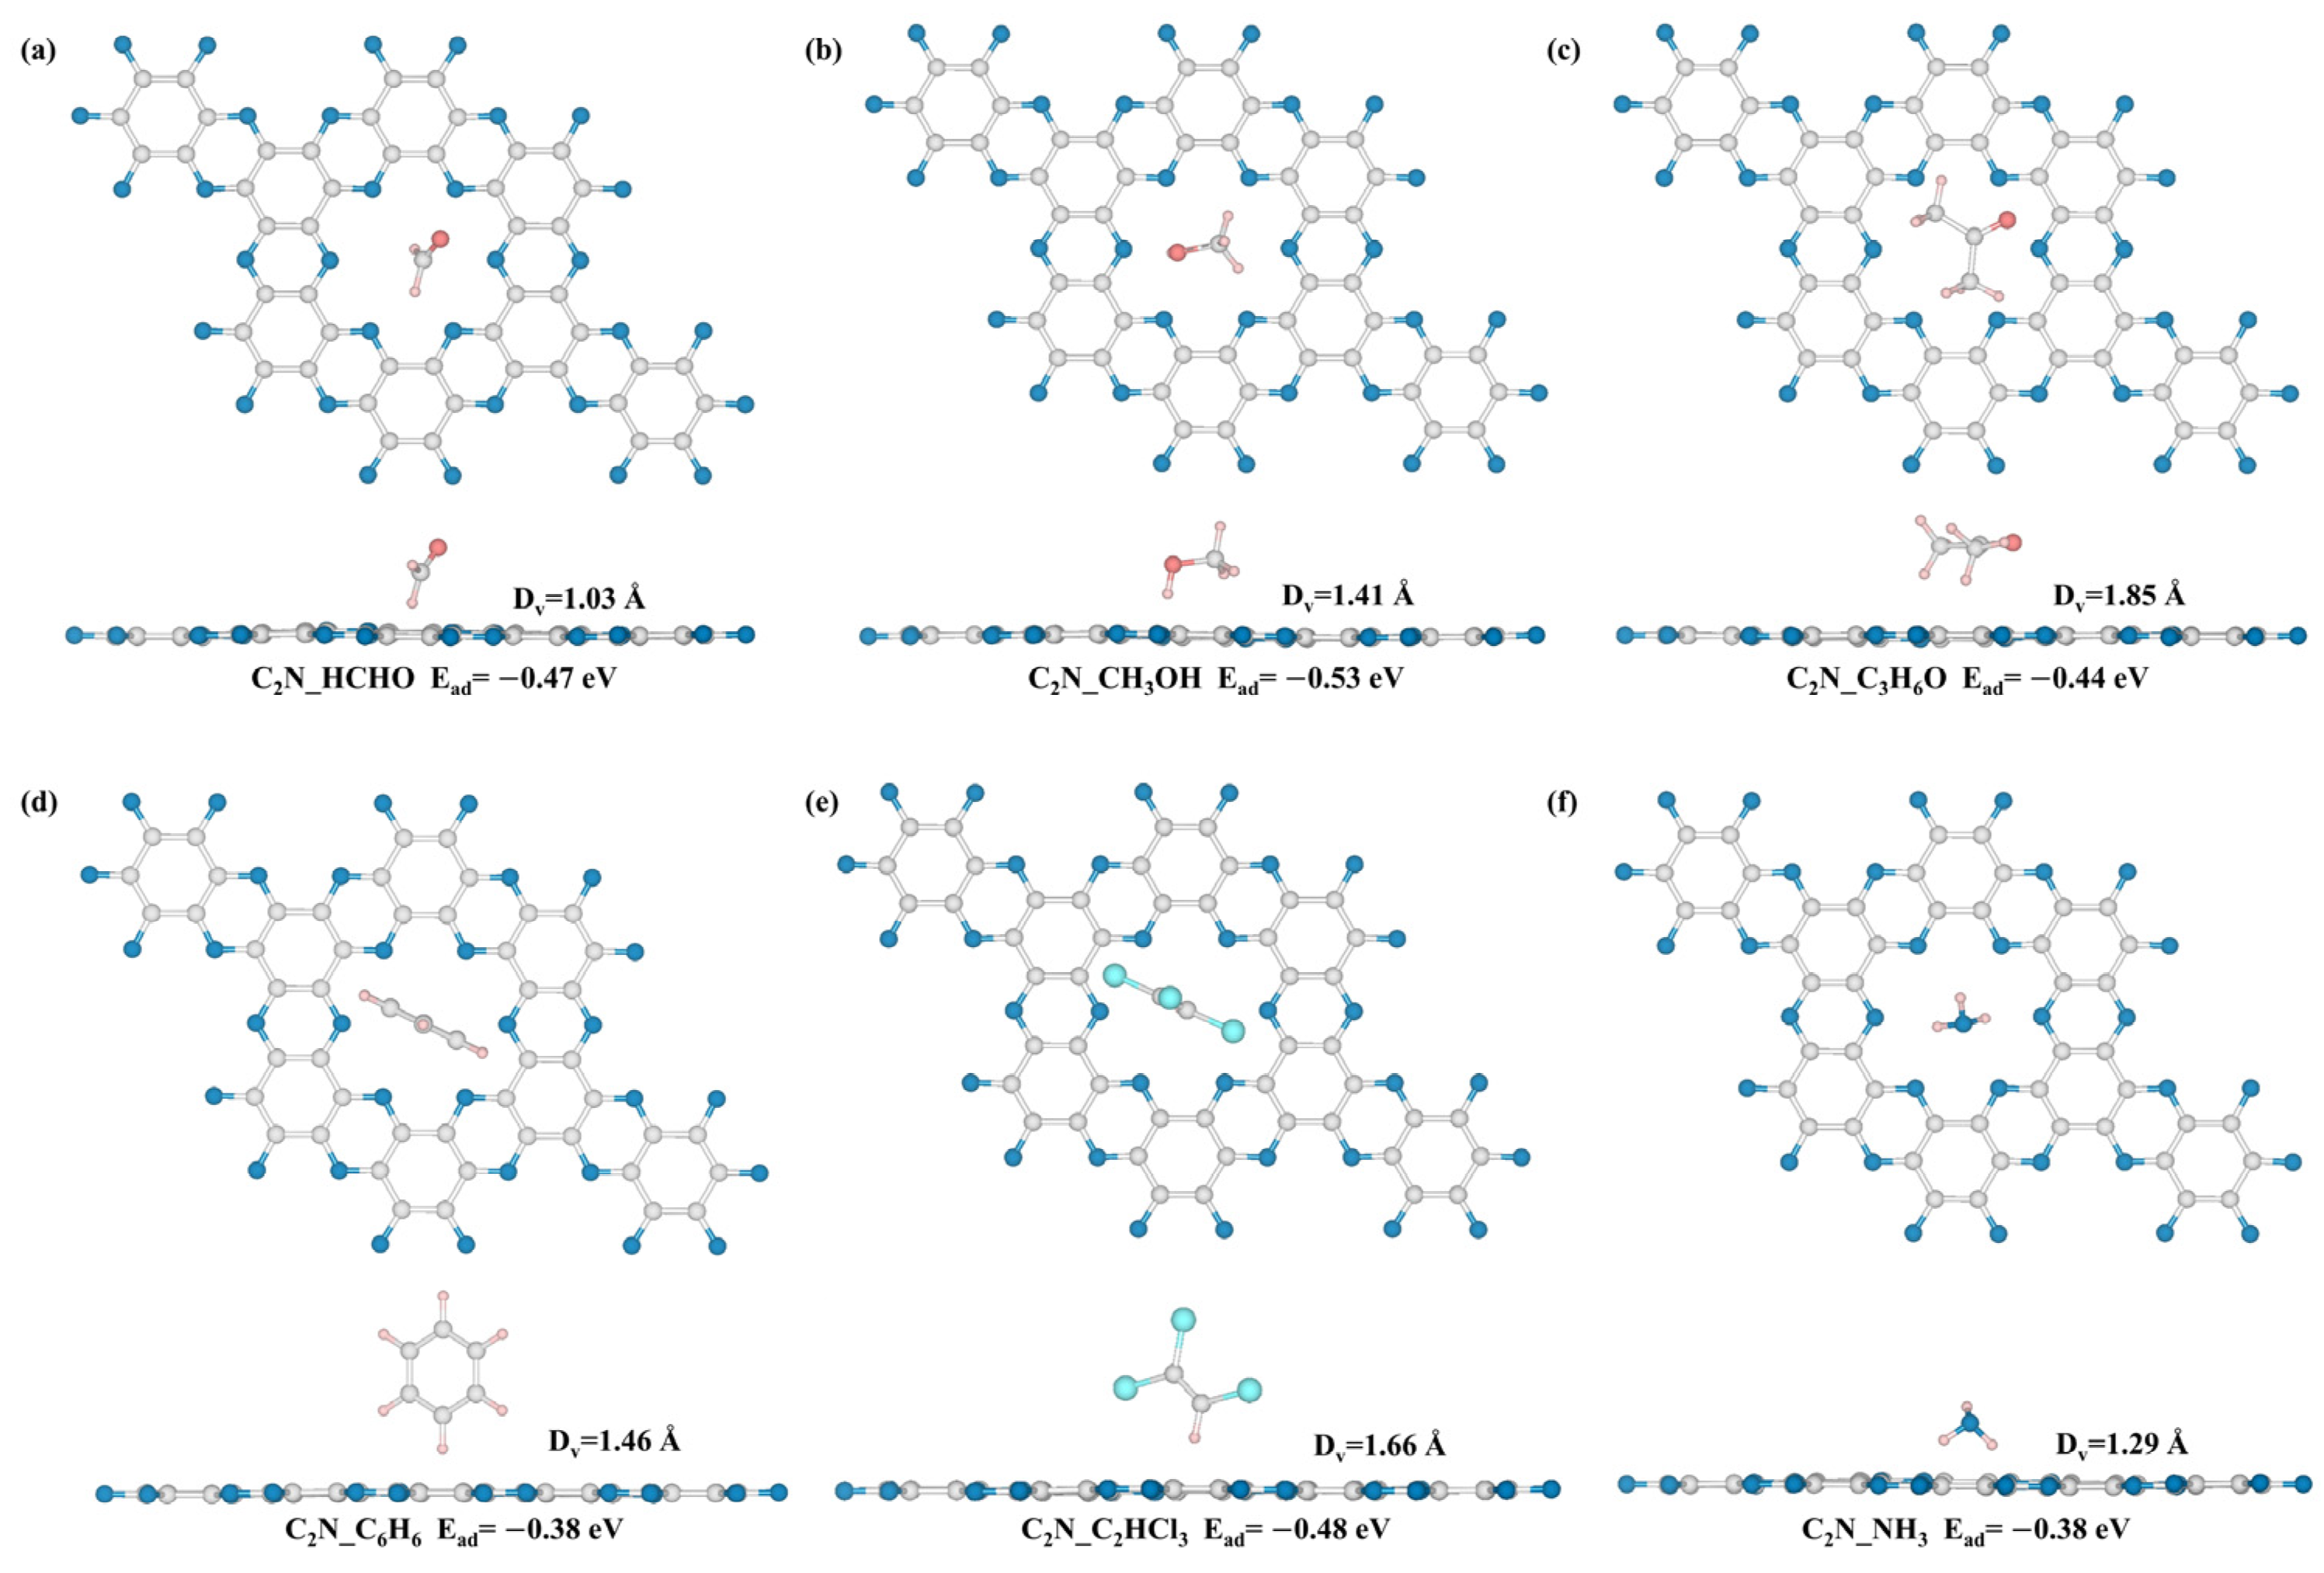
3.2. Adsorption of Gases on Pristine C2N

In this section, the adsorption behavior of gaseous pollutants on pristine C2N was investigated. Four typical and toxic VOCs (HCHO, CH3OH, C3H6O, C6H6, and C2HCl3) and NH3 were selected as the target adsorbates. Various initial adsorption configurations were constructed to determine the most stable structures of C2N_gas systems. According to previous studies, the gases preferred to adsorb on the large hole site of C2N (see Figure S3c) due to its copious π-electrons; thus, it was chosen as the adsorption site for VOCs and NH3 [24,50,51]. For volatile organic compounds, the adsorption models were established by laying the pollutants in parallel to vertical positions on the hole site. In the vertical scenarios, the interaction sites of VOCs were also considered. For NH3, only the interaction sites of NH3 (N and H) were taken into account. The initial binding configurations, the optimized structures, and the adsorption energies of gases on pristine C2N were recorded in Figures S4–S7.
The optimal binding configurations were filtered out and depicted in Figure 3, and the corresponding adsorption energies were listed in Table 1. As displayed in Figure 3, the HCHO, C6H6, and C2HCl3 molecules tend to adsorb on the C2N sheet in a vertical orientation, in which their C-H bonds point toward the large hole of C2N. The vertical distances (named as Dv) between the HCHO, C6H6, and C2HCl3 molecules and the substrate are 1.03, 1.46, and 1.66 Å, respectively, while the CH3OH and C3H6O molecules prefer to lie flat on the C2N surface with vertical distances of 1.41 and 1.85 Å, respectively. When it comes to the NH3 molecule, the NH3 is adsorbed on the surface of C2N with its two H atoms downwards; the Dv between NH3 and C2N is 1.29 Å. Notably, scrutinizing the binding configurations of C2N_gas systems, there are no obvious chemical bonds between them, which portends weak interaction. Moreover, the adsorption energy of −0.50 eV is always used to distinguish physical and chemical adsorption [52]. As summarized in Table 1, the Ead of C2N for HCHO, CH3OH, C3H6O, C6H6, C2HCl3, and NH3 molecules are −0.47, −0.53, −0.44, −0.38, −0.48, and −0.38 eV, respectively, demonstrating physisorption or weak chemisorption. Their relatively weak interaction ascribes to the van der Waals affinity of π-electrons in C2N toward VOCs (or NH3). Additionally, it can be seen that the adsorption energies of pure C2N toward these gases are at a comparable level, indicating poor selectivity.
Then, the electronic properties of C2N_gas systems, including PDOS and Bader charge, were investigated to further comprehend the interaction behavior between C2N and contaminants. The density of states of gases before and after adsorption, the partial density of states of gases, and C2N in the adsorption systems were displayed in Figure S8. On the one hand, there are tiny state variations in the DOS of gas molecules after the adsorption process. On the other hand, the gas molecules hybridize with C2N at a low degree. Additionally, as recorded in Table 1, only thimbleful charge transfers can be observed in C2N_gas systems. The density of states and Bader charge results further prove the relatively weak interaction between C2N and VOCs (or NH3).

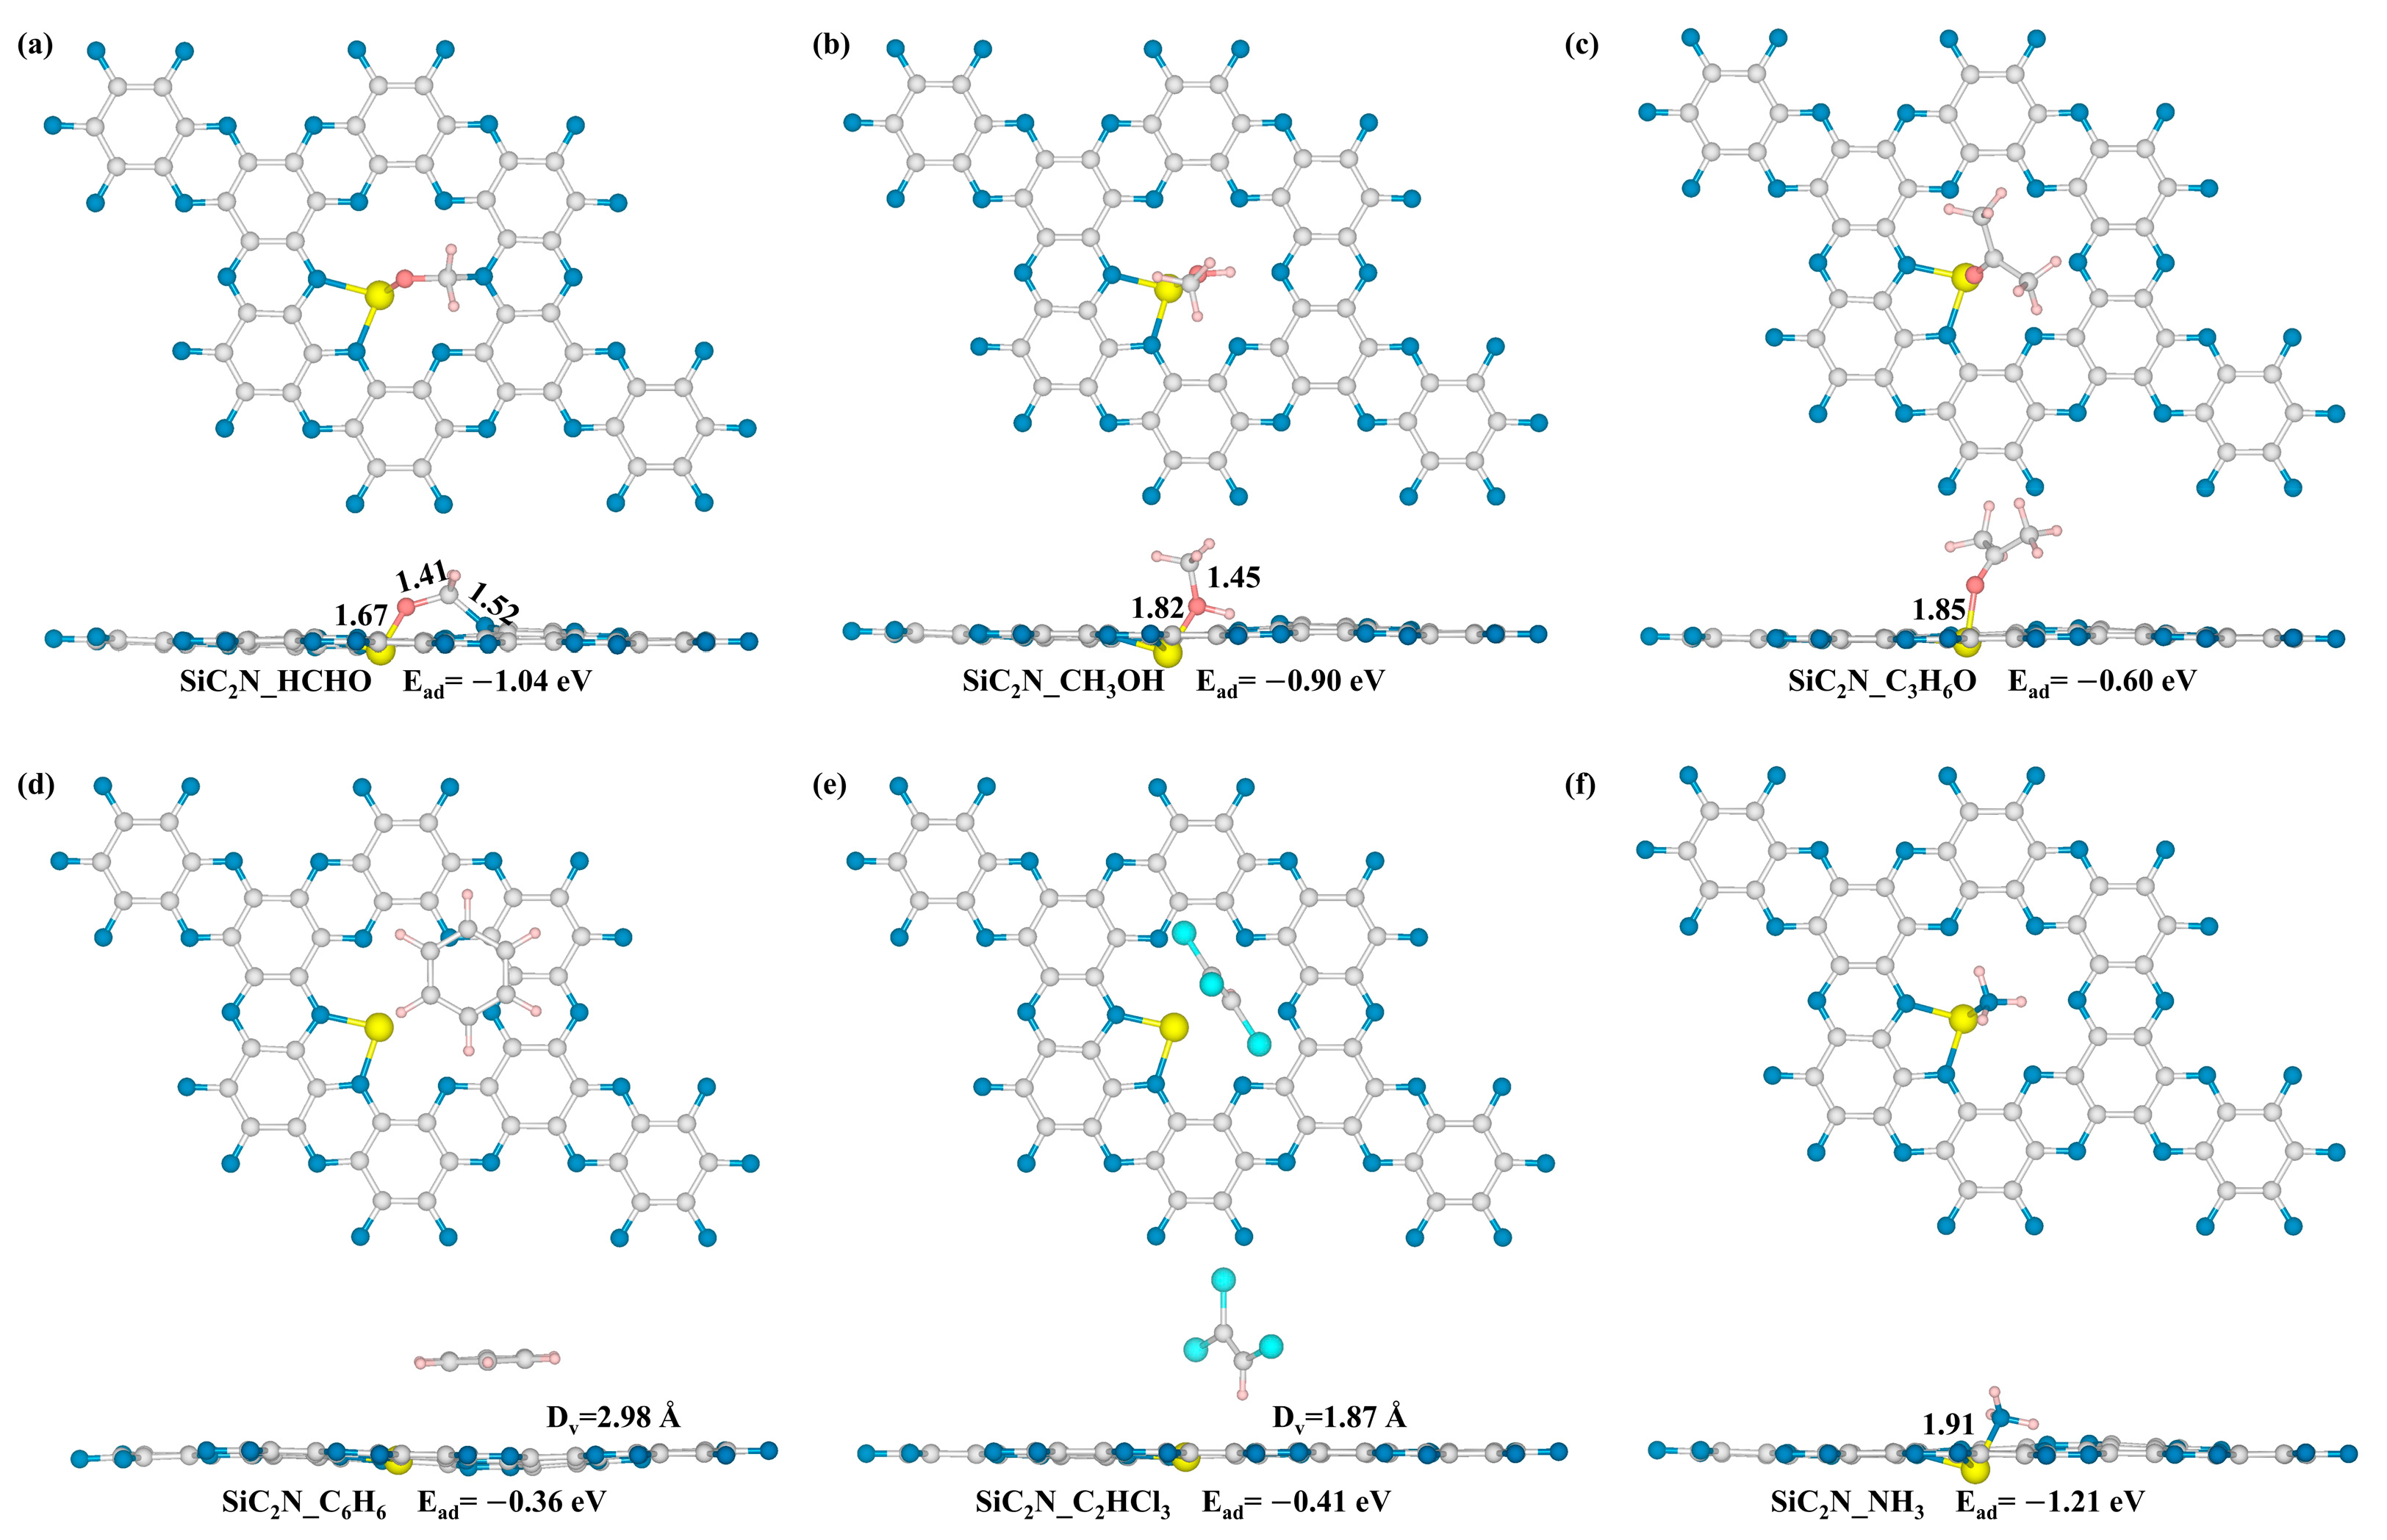
3.3. Adsorption of Gases on SiC2N

3.3.1. Binding Configurations and Adsorption Energies

The adsorption behavior of VOCs and NH3 on Si-doped C2N was probed in this section. Herein, the Si and hole sites were selected as the adsorption sites for gas molecules (see Figure S3d). Similarly, various binding configurations of SiC2N_gas systems were examined in Figures S9–S20 to search for the optimal adsorption structures. The most energetically favorable binding configurations of SiC2N_gas systems are depicted in Figure 4, and the corresponding adsorption energies are displayed in Table 1. Combining the binding configurations and adsorption energies, we can see that Si doping can effectively promote the adsorption of HCHO, CH3OH, C3H6O, and NH3. Firstly, as shown in Figure 4a, the HCHO molecule prefers to interact with SiC2N in a parallel pattern, in which the Si atom and the N atom of the C2N skeleton act as dual adsorption sites for HCHO. Stable Si-O (1.67 Å) and N-C (1.52 Å) bonds are formed between HCHO and SiC2N, which ultimately leads to appreciable adsorption energy of −1.04 eV. In the CH3OH, C3H6O, and NH3 adsorption systems, the O atoms in hydroxyl and ketone groups, as well as the N atom of NH3, are chemically active to interact with the dopant Si atom. The newly formed Si-O (or Si-N) bond lengths in SiC2N_CH3OH, SiC2N_C3H6O, and SiC2N_NH3 systems are 1.82, 1.85, and 1.91 Å, respectively, which are quite close to the sum covalent radii of Si and O (N) atoms (1.84 for Si-O and 1.86 for Si-N). These results indicate the formation of covalent bonds between Si and O (or N) atoms. Additionally, the obtained adsorption energies of SiC2N for CH3OH, C3H6O, and NH3 are −0.90, −0.60, and −1.21 eV, respectively, which are much higher than that of pristine C2N, whereas the C6H6 and C2HCl3 still tend to physically adsorb on the hole site of SiC2N, accompanied by small adsorption energies of −0.36 and −0.41 eV, respectively. There is no noticeable enhancement in the C6H6 and C2HCl3 adsorption after Si doping. Overall, from both structural and energetical perspectives, doping the Si atom can remarkably boost the selective adsorption performance of SiC2N for target O-containing VOCs (HCHO, CH3OH, and C3H6O) and NH3. Additionally, the outstanding capture capacity and selectivity may enable the SiC2N to be a potential semiconductor material for the environmental monitoring of gaseous pollutants.
It should be noted that as a sensor material, the SiC2N should be insensitive to main ambient gases (N2 and O2). Thus, the adsorption of these two ambient gases on the Si site of SiC2N was also evaluated in Figure S21. The computational results reveal that the adsorption of N2 on the SiC2N can be summarized as a weak van der Waals interaction (Ead = −0.12 eV), indicating that the nitrogen almost does not interfere with VOC and NH3 detection. However, the O2 has a stronger interaction with Si-doped C2N with the adsorption energy of −2.05 eV, which will cause the Si site to be occupied and thereby decrease the sensor performance. Therefore, it is advisable to utilize appropriate O2 filters or control the detection environment to minimize the interference of O2 in actual application [35].

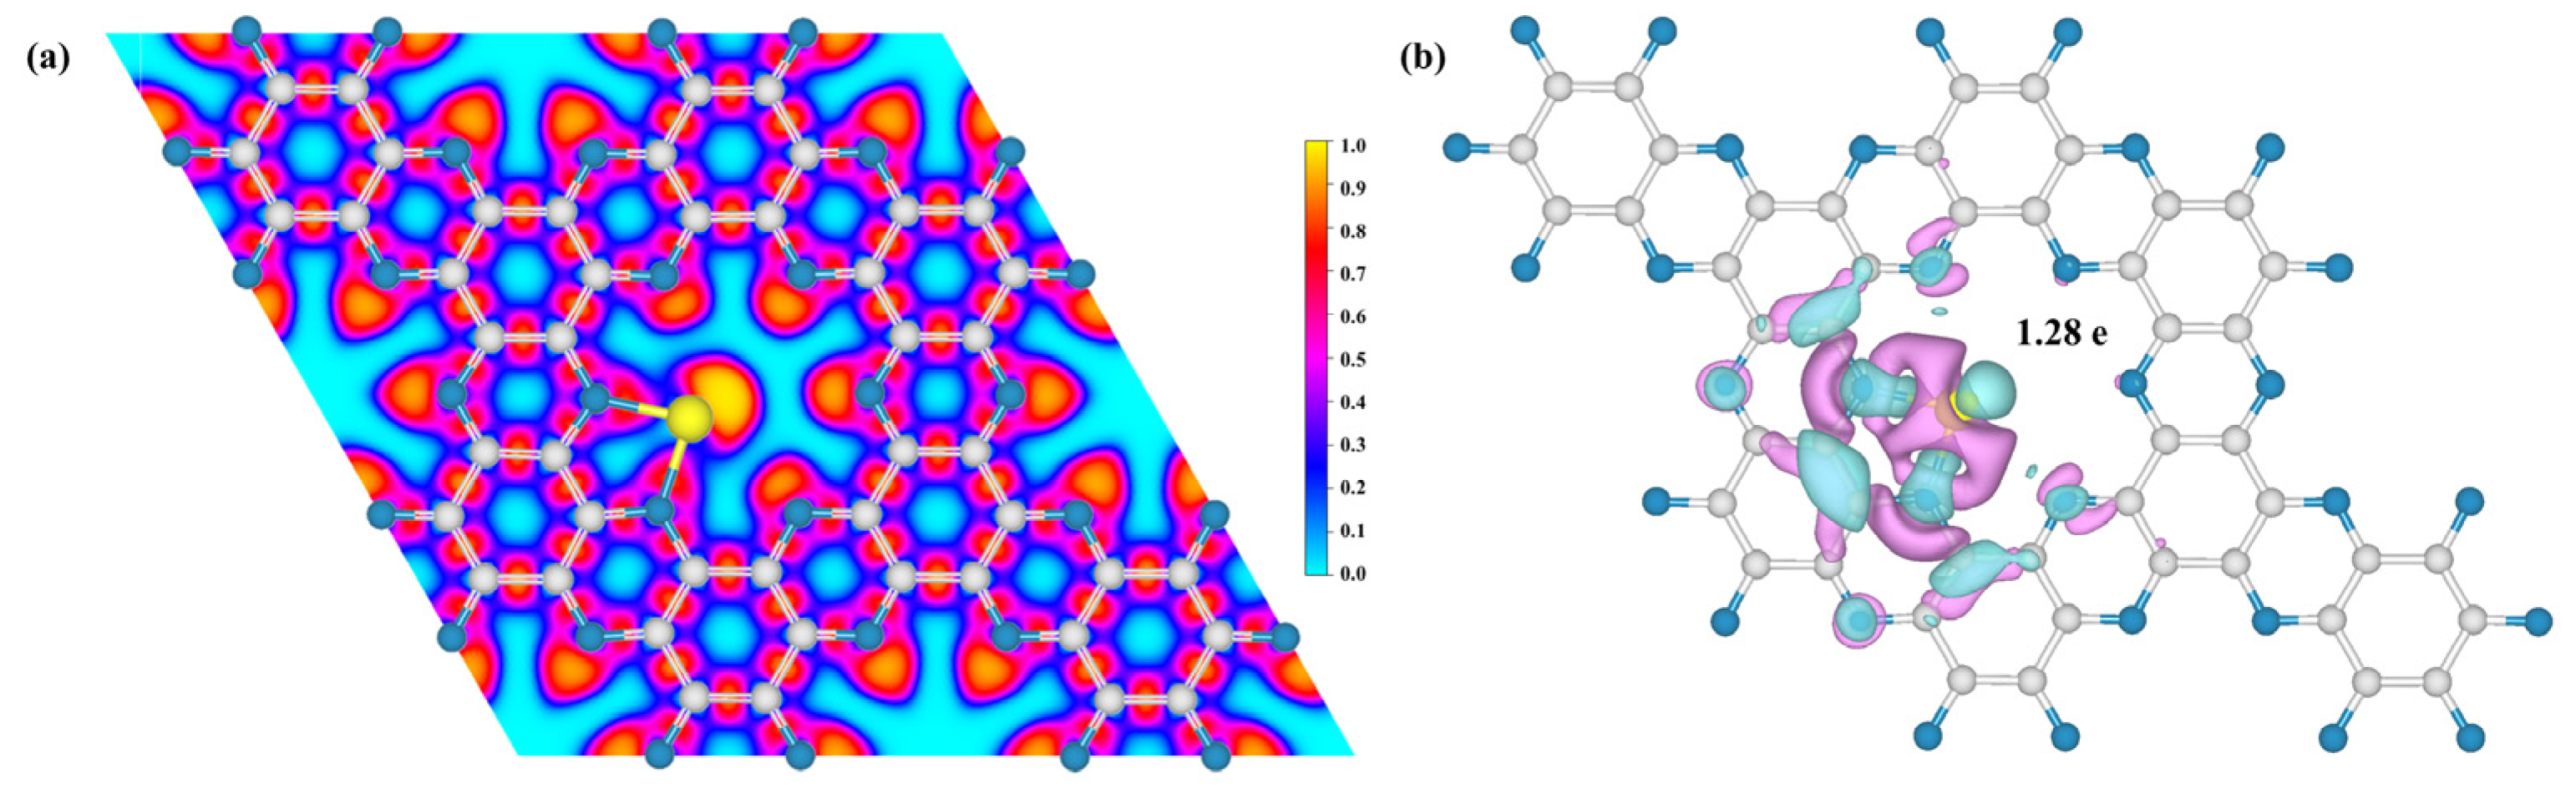
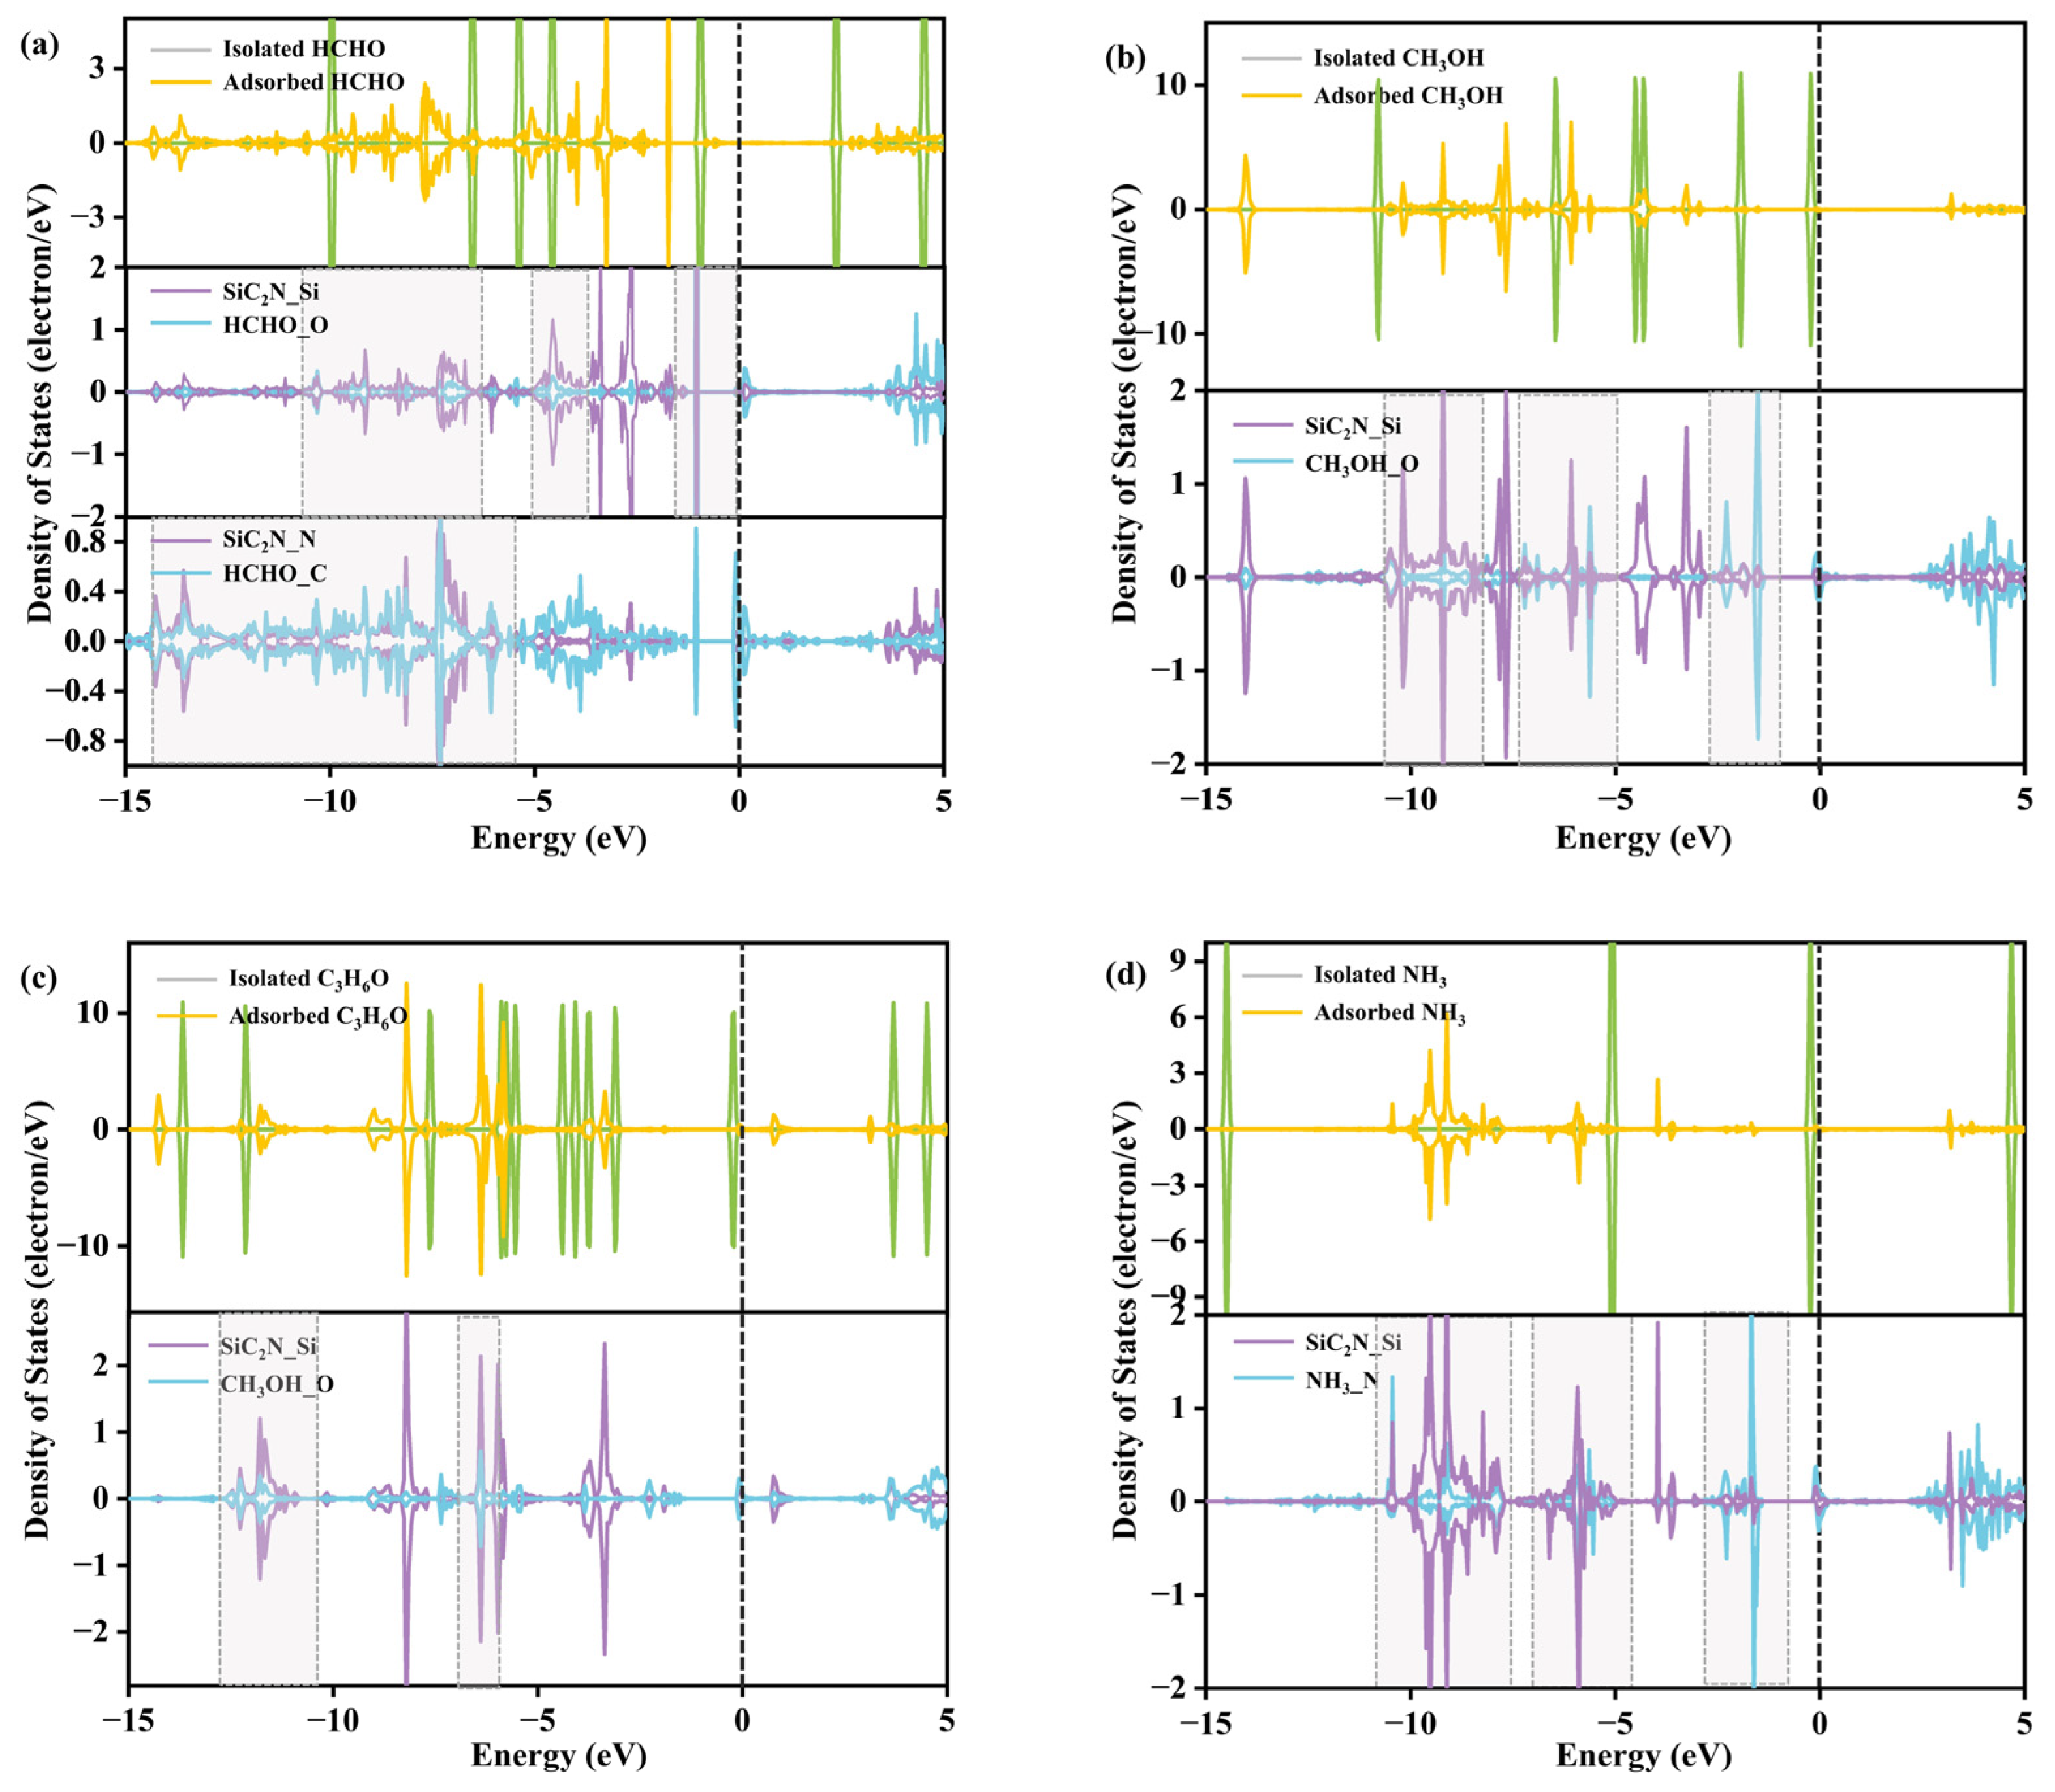
3.3.2. Interaction Mechanism

Then, the electronic characteristics, including PDOS, ELF, and CDD, were probed within the PBE method to give a deep mechanistic understanding of the interaction between SiC2N and O-containing VOCs (or NH3). The density of states of gases before and after adsorption, the partial density of states of working Si (or N) atoms in SiC2N, and the O (or N) in gases for SiC2N_HCHO, SiC2N_CH3OH, SiC2N_C3H6O, and SiC2N_NH3 systems were shown in Figure 5. In the cases of HCHO adsorption, first, it can be seen that the localized electronic states of isolated HCHO split into small continuous energy states, which can be regarded as the electron redistribution caused by the strong interaction. Additionally, in the SiC2N_HCHO system, the dopant Si atom and the N atom of C2N act as dual adsorption sites for HCHO. The O atom of HCHO highly hybridizes with the Si at −10.69~−6.60, −5.14~−4.45, and −1.35~−0.73 eV, respectively. In addition, obvious orbital overlaps between the N atom of SiC2N and the C atom of HCHO can be observed at −14.60~−5.79 eV. These results confirm the formation of intense Si-O and N-C covalent bonds. Furthermore, as depicted in Figure 5b–d, in the SiC2N_CH3OH, SiC2N_C3H6O, and SiC2N_NH3 systems, the orbitals of CH3OH, C3H6O, and NH3 molecules are also divided into several small states. Additionally, there are obvious electron hybridizations between the Si atom and the O (or N) of gaseous molecules, likewise indicating their exquisite covalent interaction. Herein, one can see that the hybrid degree between Si and the O of C3H6O is weaker compared with that in the other three systems, which explains the relatively weak adsorption capacity of SiC2N toward C3H6O. In comparison, the electronic state deformations of the C6H6 and C2HCl3 in the adsorption process are negligible. Additionally, there are a few orbital overlaps between C6H6 (or C2HCl3) and SiC2N in SiC2N_C6H6 and SiC2N_C2HCl3 systems (see Figure S22). The DOS results further demonstrate the high selective adsorption performance of SiC2N toward O-containing VOCs and NH3.
As discussed above, the bonding nature can be intuitively determined by ELF diagrams. The ELF plots of SiC2N_HCHO, SiC2N_CH3OH, SiC2N_C3H6O, and SiC2N_NH3 systems are given in Figure S23. It can be seen that the Si-O (or Si-N) bonds exhibit covalent bonding characteristics. Additionally, it can be seen that the covalent degree of Si-O bond in SiC2N_C3H6O is lower than the Si-O (or Si-N) in other adsorption systems, which is corroborated mutually in the previous adsorption energies and DOS results. The ELF diagrams of SiC2N_C6H6 and SiC2N_C2HCl3 were not analyzed since there is no obvious chemical bonding between SiC2N and C6H6 (or C2HCl3). Moreover, the CDD diagrams of the adsorption systems with regard to SiC2N and gas molecules are presented in Figure S24. Significant charge transfer can be observed between the SiC2N substrate and O-containing VOCs (or NH3). The amounts of charge transfer in various adsorption systems were recorded in Table 1. It can be seen that the charge transfer from the SiC2N monolayer to HCHO, CH3OH, and C3H6O is calculated to be 0.388, 0.057, and 0.134 e, respectively. Additionally, in the SiC2N_NH3 system, the NH3 molecule donates 0.046 e to the SiC2N sheet. The remarkable charge transfer demonstrates the intense covalent bonding between O-containing VOCs (or NH3) and SiC2N, while the charges of C6H6 and C2HCl3 are almost unchanged after being adsorbed on SiC2N.

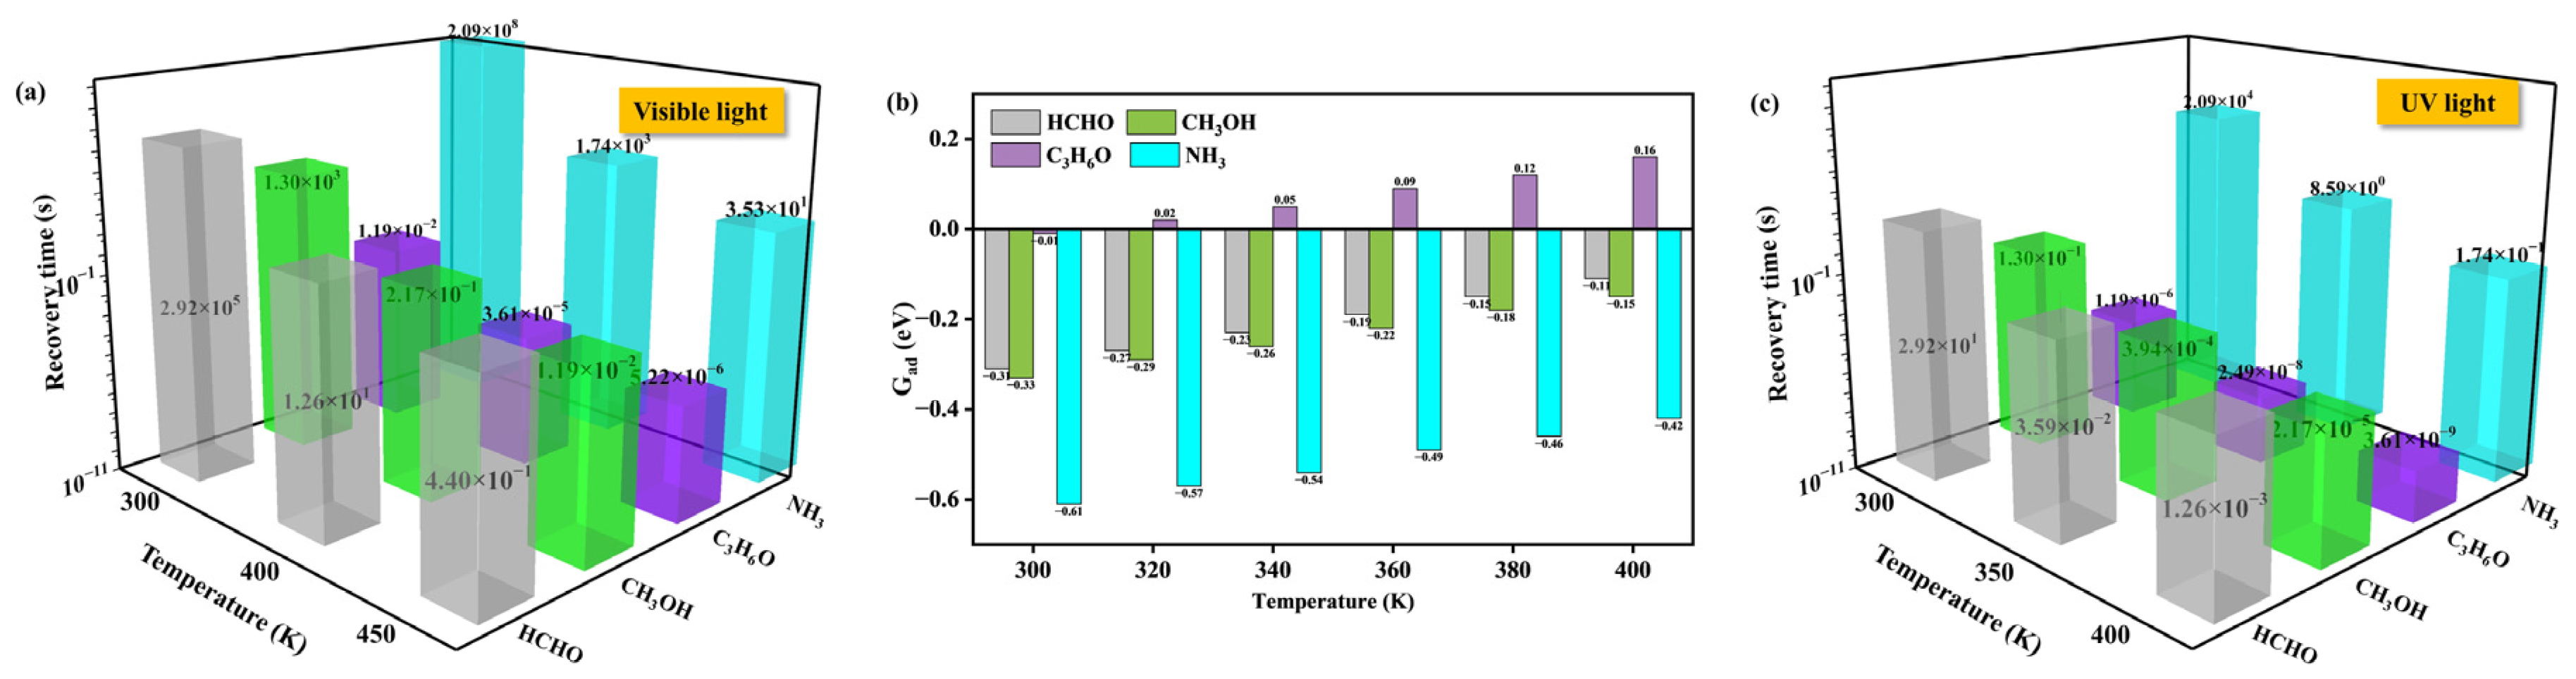
3.4. Sensor Explanation of Si-Doped C2N Sheet

3.4.1. Sensor Performance of SiC2N

The potential of SiC2N as resistive or work function (Φ)-type sensors was assessed in this section. Firstly, the operation of sensor materials is mainly based on the conductance variations after capturing target analytes. Additionally, the conductivity (σ) of semiconductor materials is quite related to its band gap, and the relationship between the σ and Eg is expressed as follows [53,54]:
σ exp ( E g 2 k T )
where the Eg, k, and T donate the band gap, Boltzmann constant (8.62 × 10⁻⁵ eV/K), and temperature, respectively. The band structures of SiC2N_gas systems with the HSE06 functional were depicted in Figure 6. One can see that the adsorption of O-containing VOCs and NH3 inspires dramatic declines in the band gap of SiC2N. The band gaps of SiC2N_HCHO, SiC2N_CH3OH, SiC2N_C3H6O, and SiC2N_NH3 systems considerably decrease to 0.29, 0.13, 0.25, and 0.12 eV, respectively, which will result in an evident increase in conductivity, while the band gap of SiC2N is almost unchanged after the adsorption of C6H6 and C2HCl3. The band structures of SiC2N_gas systems calculated by the PBE functional were displayed in Figure S25. In general, the PBE method underestimates the band-gap values; qualitatively, the PBE results are quite consistent with the HSE06 results. Herein we further calculated the electrical conductivity (σ) of SiC2N and the adsorption systems at 300 K in Figure 7 with the PBE functional. It can be observed that the adsorption of O-containing VOCs and NH3 generates remarkable changes in conductivity; their peaks of conductivity occur at lower values of the chemical potential. In addition, one can see that the conductivity of the carrier near or at the chemical potential is 0 V, which is consistent with the PBE band structure results (see Figure S25) and further confirms the narrower band gaps of the adsorption systems, while the adsorption of C6H6 and C2HCl3 has a negligible influence on the conductivity of SiC2N. These results indicate that the Si-doped C2N possesses both high sensitivity and selectivity for O-containing VOC and NH3 detection. Furthermore, the current–voltage of the SiC2N_NH3 system was found as an example to ensure the effect of gas adsorption on the conductivity of SiC2N. The I–V curves for pure SiC2N and SiC2N_NH3 systems are shown in Figure 7g, in which the applied voltage ranges from 0 to 1.0 with the increment of 0.2 V. For pure SiC2N, there is no apparent current flow at 0 and 0.2 V owing to the band gap of SiC2N. The current appears when the applied voltage reaches 0.4 V, and then the current gradually increases along with the applied voltage. Additionally, the adsorption of NH3 remarkably enhances the electrical conductivity of the SiC2N sheet. Firstly, due to the quite small band gap of the SiC2N_NH3 system, there is an obvious current in the SiC2N_NH3 system even at a small applied voltage of 0.2 V. In addition, it can be observed that the current flows in the SiC2N_NH3 system are evidently stronger in contrast with the pure SiC2N when using the applied voltage of 0~1 V. Additionally, the difference in the conductivity is most significant at the applied voltage of 0.4 V. One can see that at the applied voltage of 0.4 V, the current flowing through SiC2N_NH3 system is 18.76 μA, which is almost six times higher than pure SiC2N (3.27 μA), which predicts that the SiC2N sheet possesses highest sensitivity toward NH3 at 0.4 V. Overall, the current–voltage curve further proves the high sensitivity toward ammonia.
The sensitivity of SiC2N toward O-containing VOCs and ammonia was further investigated. The sensitivity was calculated by the following equation [55]:
S = ( σ 2 σ 1 ) / σ 1
where the σ 2 and σ 1 donate the electrical conductance of SiC2N_gas and SiC2N systems, respectively. Additionally, according to the relationship between the σ and Eg in Equation (3), the S can be written as follows:
S = exp [ ( E g 2 E g 1 ) / 2 k T ] = exp ( Δ E g / 2 k T )
where the E g 2 and E g 1 are the band gap of SiC2N_gas and SiC2N systems, respectively. The sensitivity of SiC2N toward O-containing VOCs and ammonia at 300, 350, and 400 K were summarized in Figure 8. It can be seen that the sensitivity of SiC2N toward O-containing VOCs and NH3 is high (8.17× > 104) within the normal working temperature range (300–400 K). In addition, the sensitivity of some other sensor materials reported in previous studies is summarized in Table S1 [36,54,55,56,57,58,59,60]. The sensitivity of SiC2N toward O-containing VOCs and NH3 is comparable to or higher than some well-established gas sensors such as Si-GreenP toward acetone (~108 at room temperature) [36], vacancy-doped black phosphorus toward CO2 (1254%, 298 K) [56], Rh-BN toward SO2 (4.79 × 10⁷, 298 K) [54], and so on, showing superior sensor ability.
We also assess the performance of SiC2N as a Φ-type sensor in Figure S26 [61,62]. However, the relatively small Φ changes (−6.63%~−8.28%) after O-containing VOC and NH3 adsorption may cause the SiC2N to suffer from low sensitivity in the realistic application. The detailed descriptions were displayed in SI. Therefore, by comparison, the Si-doped C2N is more suitable as a resistive-type sensor for O-containing VOC and NH3 detection.
The recovery time is another vital factor for gas-sensor materials in practical application, and it can be improved by increasing the working temperature or applying ultraviolet (UV) light. The recovery time was determined by the following [63]:
τ = ω 1 exp ( E ad k T )
where the ω, Ead, k, and T were the attempt frequency (1012/s), adsorption energies for target gases, and Boltzmann constant as well as temperature, respectively. The calculated recovery time of SiC2N_gas systems at the temperature of 300, 400, and 450 K was summarized in Figure 9a. It can be found that the recovery time of SiC2N_C3H6O is only 1.19 × 10⁻², while the SiC2N_HCHO, SiC2N_CH3OH, and SiC2N_NH3 systems require a relatively long time (1.30 × 10³~2.09 × 10⁸ s) at room temperature. Nevertheless, when using a working temperature of 400 K, the recovery time of SiC2N_HCHO and SiC2N_CH3OH systems can significantly decrease to 12.6 and 2.17 × 10⁻¹ s, respectively. As the temperature continues to rise to 450 K, the SiC2N_NH3 system likewise presents a short recovery time of 3.53 × 101 s. It can be seen that only the detection of NH3 needs a relatively high recovery temperature of 450 K; nevertheless, it is acceptable. The calculated recovery time without UV of O-containing VOCs is shorter than some well-established sensor materials. For example, the recovery time for detecting HCHO of SiC2N is 12.6 s at 400 K, which is lower than Au-modified indium–gallium–zinc oxide (13 s at 523 K) [64], A-site cation deficiency in LaFeO3 (13 s at 478 K) [65], In2O3 (40 s at 438 K) [66], SnO2 (7 s at 488 K) [67], and ZnO/SnO2 (9 s at 498 K) [68]. Moreover, we also estimated the adsorption Gibbs free energies of gases on SiC2N at the temperature of 300~400 K, as shown in Figure 9b. The adsorption Gibbs free energies were calculated by the following:
∆Gad = G(SiC2N_gas) − G(SiC2N) − G(gas)
where the G(SiC2N_gas) and G(SiC2N) donated the Gibbs free energies of SiC2N_gas and SiC2N, respectively. Additionally, the G(gas) was the Gibbs free energies of isolated VOCs and NH3. It can be seen that only the NH3 exhibits a relatively large ∆Gad of −0.43~−0.61 eV at 300~400 K. The ∆Gad for O-containing VOCs on SiC2N is quite small, indicating that the entropy effect involving the temperature is conducive to the desorption of gases. In addition, according to previous reports, the recovery time can be further shortened by exposure to UV light (ω = 1016/s) due to the elimination of the desorption barrier [69,70]. Additionally, UV light has been widely used to reduce recovery time. Aasi and coworkers have reported that the desorption of indole from Pd-decorated MoS2 needs a recovery time of 1.28 × 10⁵ s, whereas, under UV light, the recovery time can greatly decrease to 12.8 s. Herein, the recovery time of SiC2N_gas systems under UV light at 300, 350, and 400 K is shown in Figure 9c. It can be seen that, under exposure to UV light, the SiC2N_HCHO, SiC2N_CH3OH, and SiC2N_C3H6O possess short recovery times of 29.2, 0.13, and 1.19 × 10⁻⁶ s, respectively, at room temperature. Even for the SiC2N_NH3 system, when using UV light, the recovery time can be effectively shortened to 26.2 s at 350 K. In a word, the apparent changes in conductivity and acceptable recovery time offer significant advantages for SiC2N as a resistive-type sensor in the detection of O-containing VOCs and NH3.
Moreover, we also investigated the co-adsorption of gases on the sensor performance of SiC2N, and the results were recorded in Figures S27–S30 and Table S2. It was found that the coverage and co-adsorption of different gases have little effect on the sensitivity but slightly increase the recovery time. Therefore, in the real application, the environment with low gas concentration is more favorable for the utilization of SiC2N. A detailed description is displayed in the Supporting Information. Furthermore, we also investigated the sensor performance of the other two nonmetal B- [71] and P-doped C2N [72] for VOCs and ammonia, the results were recorded in Figures S31–S34 and Table S3. The weak affinity of P-doped C2N towards VOCs and NH3 manifests its poor sensor performance. And although BC2N also presents high sensivitity for O-containing VOCs and ammonia, the BC2N_gas systems need a long recovery time or high operation temperature. Therefore, comparing B- and P-doped C2N, the SiC2N is more suitable as a sensor for VOCs and ammonia.

3.4.2. The Effect of Si Doping Density

In this section, we further increase the doping density of the Si atom to evaluate the effect of doping density on the sensing performance. Two other Si doping densities were taken into consideration, including moderate and high Si doping density. In the case of moderate Si doping density, two Si atoms were incorporated into a 2 × 2 supercell of C2N with a Si doping density of 2.70 at%. As shown in Figure S35a,b, there are two possible doping modes for Si2C2N. In one case, the two Si atoms are scattered in two different interstitial spaces (labeled as Si2C2N_a), and in another one, the Si atoms are gathered in one interstitial space (labeled as Si2C2N_b). Additionally, the former configuration is proved to be more energetically favorable (Eform = −2.98 eV), which is chosen as the computational model for Si2C2N. In addition, the Si doping density was further increased to 5.26 at%, and the optimized configuration of Si4C2N was shown in Figure S35c. Herein, we first analyze the effect of Si density on the electronic characteristics of Si-doped C2N in Figure S35d–g. It can be seen that the band gaps of Si-doped C2N decrease with the Si density. Moreover, similar to SiC2N, the VBM of Si2C2N and Si4C2N is composed of active pz electrons, which also guarantee the high activity of Si2C2N and Si4C2N.
Then, we further assess the doping density of Si atoms on the sensing performance of Si-doped C2N toward O-containing VOCs and ammonia. Firstly, the adsorption of HCHO, CH3OH, C3H6O, and NH3 on Si2C2N was investigated. Since the two dopant Si atoms can both serve as the adsorption sites for gases, the adsorptions of single and two gaseous pollutants on Si2C2N were both taken into consideration. The optimized adsorption configurations are displayed in Figure S36. It can be seen that the adsorption energies of Si2C2N and Si4C2N toward O-containing VOCs and ammonia are slightly larger than that of SiC2N, and the adsorption energies gradually increase with the Si doping density. In addition, the band gaps of Si-doped C2N after the adsorption of O-containing VOCs and ammonia are summarized in Table 2. For Si2C2N, similar to SiC2N, a single molecule of O-containing VOCs or ammonia adsorption can cause remarkable band gap changes. It can be seen after a CH3OH, C3H6O, and NH3 molecule adsorption that the band gaps of Si2C2N_CH3OH, Si2C2N_C3H6O, and Si2C2N_NH3 systems considerably decrease to 0.02, 0.03, and 0.07 eV. Additionally, the band gap of Si2C2N_HCHO approaches 0 eV, indicating the high sensor performance of Si2C2N. The quantities of the adsorbed gases have little effect on sensing performance (see Table S4).
Furthermore, for Si4C2N, the adsorption configurations of gases on Si4C2N were presented in Figures S37 and S38, and the band gap, as well as band gap changes in Si4C2N_gas systems, are also recorded in Table 2. Since the intrinsic band gap of Si4C2N is quite small (~0.27 eV), after the adsorption of O-containing VOCs and ammonia, the band gap values are very close to 0 eV. The band gap changes are smaller in contrast with SiC2N and Si2C2N systems, which results in low sensitivity. In addition, since Si doping density also affects adsorption energies, it can be seen that the recovery time is slightly increased along with the Si doping density (see Table 2). Therefore, taking careful consideration of sensitivity and recovery time, low or moderate Si doping densities are more favorable for Si-doped C2N as a resistive-type sensor.

4. Conclusions

In summary, the sensor performance of Si-doped nitrogenated holey graphene (C2N) for five kinds of representative VOCs (HCHO, CH3OH, C3H6O, C6H6, and C2HCl3) and NH3 were systematically evaluated by the first-principle calculations. Firstly, the formation energies and AIMD simulations proved the incorporation of Si atom into C2N was thermodynamically stable. The Si doping not only induced a considerable decrease (~1.34 eV) in the band gap of C2N, but also provided an adsorption site for gaseous pollutants. Compared with the inherent physical or weak chemical adsorption of C2N toward gases, the SiC2N exhibited high capture capacity and selectivity for O-containing VOCs and NH3 through intense strong covalent bonds. Furthermore, the potential of SiC2N as resistive- and work-function-type sensors were checked. The band gap of SiC2N dramatically decreases after capturing O-containing VOCs and NH3. The band gap of SiC2N_HCHO, SiC2N_CH3OH, SiC2N_C3H6O, and SiC2N_NH3 systems are 0.29, 0.13, 0.25, and 0.12 eV, respectively, which leads to great enhancement in the conductivity of the system. In comparison, the changes in work function were relatively tiny (−6.63%~−8.28%), demonstrating that the SiC2N is more suitable to act as a resistive-type sensor. In addition, the SiC2N was found to possess an acceptable recovery time in detecting O-containing VOCs and NH3. When using UV light, the SiC2N_HCHO, SiC2N_CH3OH, and SiC2N_C3H6O possess short recovery times of 29.2, 0.13, and 1.19 × 10⁻⁶ s, respectively, at room temperature. Additionally, the recovery time of SiC2N_NH3 is 26.2 s at 350 K. In conclusion, our findings demonstrate that the Si-doped C2N is a promising candidate for the environmental detection of O-containing VOCs and ammonia.

Supplementary Materials

The following supporting information can be downloaded at https://www.mdpi.com/article/10.3390/cryst13050816/s1. Figure S1: Optimized structures of (a) SiC2N_C, (b) SiC2N_N, (c) SiC2N_I1, and (d) SiC2N_I2, and (e) SiC2N_I3 systems; Figure S2: Variations of temperatures and energies against the time for AIMD simulations of SiC2N at (a) 300 and (b) 500 K; Figure S3: The band strucures of (a) C2N and (b) SiC2N with PBE method; the adsorption sites of (c) C2N and (d) SiC2N for VOCs and ammonia; Figure S4: The initial adsorption configurations of HCHO, CH3OH, and C3H6O molecules on the hole site of pristine C2N; Figure S5: The initial adsorption configurations of C6H6, C2HCl3, and NH3 molecules on the hole site of pristine C2N; Figure S7: The optimized adsorption configurations of C6H6, C2HCl3, and NH3 molecules on the hole site of pristine C2N based on the initial configurations in Figure S5; Figure S8: The density of states of gases before and after adsorption; the partial density of states of C2N and gases for (a) C2N_HCHO, (b) C2N_CH3OH, (c) C2N_C3H6O, (d) C2N_C6H6, (e) C2N_C2HCl3, and (f) C2N_NH3 systems; Figure S9: The initial adsorption configurations of HCHO molecule on the Si and hole sites of SiC2N; Figure S10: The initial adsorption configurations of CH3OH molecule on the Si and hole sites of SiC2N; Figure S11: The initial adsorption configurations of C3H6O molecule on the Si and hole sites of SiC2N; Figure S12: The initial adsorption configurations of C6H6 molecule on the Si and hole sites of SiC2N; Figure S13: The initial adsorption configurations of C2HCl3 molecule on the Si and hole sites of SiC2N; Figure S14: The initial adsorption configurations of NH3 molecule on the Si and hole sites of SiC2N; Figure S15: The optimized adsorption configurations of SiC2N_HCHO systems based on the initial configurations in Figure S9; Figure S16: The optimized adsorption configurations of SiC2N_CH3OH systems based on the initial configurations in Figure S10; Figure S17: The optimized adsorption configurations of SiC2N_C3H6O systems based on the initial configurations in Figure S11; Figure S18: The optimized adsorption configurations of SiC2N_C6H6 systems based on the initial configurations in Figure S12; Figure S19: The optimized adsorption configurations of SiC2N_C2HCl3 systems based on the initial configurations in Figure S13; Figure S20: The optimized adsorption configurations of SiC2N_NH3 systems based on the initial configurations in Figure S14; Figure S21: The optimal binding configurations of N2 and O2 on SiC2N; Figure S22: The density of states of gases before and after adsorption, the partial density of states of SiC2N and gases for (a) SiC2N_C6H6 and (b) SiC2N_C2HCl3 systems; Figure S23: The electron localization function (ELF) diagrams of (a) SiC2N_HCHO, (b) SiC2N_CH3OH, (c) SiC2N_C3H6O, and (d) SiC2N_NH3 systems, in which partial atoms are hidden for better reading; Figure S24: The charge density difference between gases and SiC2N in (a) SiC2N_HCHO, (b) SiC2N_CH3OH, (c) SiC2N_C3H6O, (d) SiC2N_C6H6, (e) SiC2N_C2HCl3, and (f) SiC2N_NH3 systems; Figure S25: Band structures of (a) SiC2N_HCHO, (b) SiC2N_CH3OH, (c) SiC2N_C3H6O, (d) SiC2N_C6H6, (e) SiC2N_C2HCl3, and (f) SiC2N_NH3 systems within PBE method; Figure S26: (a) The work function and (b) work function changes in SiC2N and SiC2N_gas systems; Figure S27: The adsorption configurations of two or three same gases on the SiC2N sheet; Figure S28: The adsorption configurations of two kinds of gases on the SiC2N sheet; Figure S29: The adsorption configurations of three kinds of gases on the SiC2N sheet; Figure S30: The band structures of the two-molecule adsorption system; Figure S31: The optimal configuration, band structure, and partial density of states of BC2N and PC2N; Figure S32: The optimal adsorption configurations of VOCs and ammonia on BC2N; Figure S33: The optimal adsorption configurations of VOCs and ammonia on PC2N; Figure S34: The band structure of BC2N_HCHO, BC2N_CH3OH, BC2N_C3H6O, and BC2N_NH3 systems; Figure S35: The optimized configurations of (a) Si2C2N_a, (b) Si2C2N_b, and (c) Si4C2N; the band structure of (d) Si2C2N and (f) Si4C2N; the partial density of states of (e) Si2C2N and (g) Si4C2N; Figure S36: The optimized configurations of HCHO, CH3OH, C3H6O, and NH3 on Si2C2N; Figure S37: The optimized configurations of HCHO and CH3OH on Si4C2N; Figure S38: The optimized configurations of C3H6O and NH3 on Si4C2N. Table S1: The sensitivity of some other sensor materials reported in previous studies; Table S2: The adsorption energies and recovery times of gas co-adsorption on SiC2N sheet; Table S3: The recovery time of BC2N_gas systems under UV light; Table S4: The band gap and recovery time of SinC2N_gas systems based on the PBE functional.

Author Contributions

Conceptualization, Y.L. and X.C.; investigation, Y.L.; writing—original draft preparation, Y.L. and C.Y.; visualization, Y.L., H.Z. and K.L.; data curation, Y.L., C.Y. and H.Z.; writing—review and editing, X.C. and Y.A.; funding acquisition, X.C. and Y.A. All authors have read and agreed to the published version of the manuscript.

Funding

This work was supported by the National Natural Science Foundation of China (22076044 and 22073076), the National Key Research and Development Program of China (2017YFA0207002), and the MOE Key Laboratory of Resources and Environmental Systems Optimization (NCEPU).

Data Availability Statement

Data sharing is not applicable to this article.

Acknowledgments

The authors thank the MOE Key Laboratory of Resources and Environmental Systems Optimization (NCEPU) for the computational resources, as well as the National Natural Science Foundation and the National Key Research and Development Program of China for the funding in the current work.

Conflicts of Interest

The authors declare no conflict of interest.

References

  1. Han, K.; Zhang, J.S.; Wargocki, P.; Knudsen, H.N.; Varshney, P.K.; Guo, B. Model-based approach to account for the variation of primary VOC emissions over time in the identification of indoor VOC sources. Build Environ. 2012, 57, 403–416. [Google Scholar] [CrossRef]
  2. Guo, H.; Lee, S.C.; Chan, L.Y.; Li, W.M. Risk assessment of exposure to volatile organic compounds in different indoor environments. Environ. Res. 2004, 94, 57–66. [Google Scholar] [CrossRef]
  3. Salthammer, T. Very volatile organic compounds: An understudied class of indoor air pollutants. Indoor Air 2016, 26, 25–38. [Google Scholar] [CrossRef] [PubMed]
  4. Mirzaei, A.; Leonardi, S.G.; Neri, G. Detection of hazardous volatile organic compounds (VOCs) by metal oxide nanostructures-based gas sensors: A review. Ceram. Int. 2016, 42, 15119–15141. [Google Scholar] [CrossRef]
  5. Miah, M.R.; Yang, M.; Khandaker, S.; Bashar, M.M.; Alsukaibi, A.K.D.; Hassan, H.M.A.; Znad, H.; Awual, M.R. Polypyrrole-based sensors for volatile organic compounds (VOCs) sensing and capturing: A comprehensive review. Sens. Actuator A Phys. 2022, 347, 113933. [Google Scholar] [CrossRef]
  6. Thangamani, G.J.; Deshmukh, K.; Kovářík, T.; Nambiraj, N.A.; Ponnamma, D.; Sadasivuni, K.K.; Khalil, H.P.S.A.; Pasha, S.K.K. Graphene oxide nanocomposites based room temperature gas sensors: A review. Chemosphere 2021, 280, 130641. [Google Scholar] [CrossRef]
  7. Schedin, F.; Geim, A.K.; Morozov, S.V.; Hill, E.W.; Blake, P.; Katsnelson, M.I.; Novoselov, K.S. Detection of individual gas molecules adsorbed on graphene. Nat. Mater. 2007, 6, 652–655. [Google Scholar] [CrossRef]
  8. Basu, S.; Bhattacharyya, P. Recent developments on graphene and graphene oxide based solid state gas sensors. Sens. Actuat. B-Chem. 2012, 173, 1–21. [Google Scholar] [CrossRef]
  9. Wu, Z.; Chen, X.; Zhu, S.; Zhou, Z.; Yao, Y.; Quan, W.; Liu, B. Enhanced sensitivity of ammonia sensor using graphene/polyaniline nanocomposite. Sens. Actuat. B-Chem. 2013, 178, 485–493. [Google Scholar] [CrossRef]
  10. Wu, Y.; Chen, X.; Weng, K.; Arramel, A.; Jiang, J.; Ong, W.J.; Zhang, P.; Zhao, X.; Li, N. Highly Sensitive and Selective Gas Sensor Using Heteroatom Doping Graphdiyne: A DFT Study. Adv. Electron. Mater. 2021, 7, 2001244. [Google Scholar] [CrossRef]
  11. Li, X.; Zheng, Y.; Wu, W.; Jin, M.; Zhou, Q.; Fu, L.; Zare, N.; Karimi, F.; Moghadam, M. Graphdiyne applications in sensors: A bibliometric analysis and literature review. Chemosphere 2022, 307, 135720. [Google Scholar] [CrossRef] [PubMed]
  12. Abbas, A.N.; Liu, B.; Chen, L.; Ma, Y.; Cong, S.; Aroonyadet, N.; Köpf, M.; Nilges, T.; Zhou, C. Black Phosphorus Gas Sensors. ACS nano 2015, 9, 5618–5624. [Google Scholar] [CrossRef] [PubMed]
  13. Liang, T.; Dai, Z.; Liu, Y.; Zhang, X.; Zeng, H. Suppression of Sn2+ and Lewis acidity in SnS2/black phosphorus heterostructure for ppb-level room temperature NO2 gas sensor. Sci. Bull. 2021, 66, 2471–2478. [Google Scholar] [CrossRef]
  14. Zhao, J.; Liu, H.; Yu, Z.; Quhe, R.; Zhou, S.; Wang, Y.; Liu, C.C.; Zhong, H.; Han, N.; Lu, J.; et al. Rise of silicene: A competitive 2D material. Prog. Mater. Sci. 2016, 83, 24–151. [Google Scholar] [CrossRef]
  15. Fernández-Escamilla, H.N.; Guerrero-Sánchez, J.; Martínez-Guerra, E.; Takeuchi, N. Adsorption and dissociation of NO2 on silicene. Appl. Surf. Sci. 2019, 498, 143854. [Google Scholar] [CrossRef]
  16. Meng, R.; Pereira, L.D.; Locquet, J.P.; Afanasev, V.; Pourtois, G.; Houssa, M. Hole-doping induced ferromagnetism in 2D materials. npj Comput Mater 2022, 8, 230. [Google Scholar] [CrossRef]
  17. Du, A.; Sanvito, S.; Smith, S. First-Principles Prediction of Metal-Free Magnetism and Intrinsic Half-Metallicity in Graphitic Carbon Nitride. Phys. Rev. Lett. 2012, 108, 197207. [Google Scholar] [CrossRef]
  18. Liu, Y.; Li, J.M.; Cao, X.R.; Wei, X.; Cao, J.Y.; Lin, K.X.; Zhou, Y.Y.; Ai, Y.J. Hydrogenated Si-doped g-C3N4: Promising electrocatalyst for CO2 capture and conversion. Appl. Surf. Sci. 2023, 614, 156195. [Google Scholar] [CrossRef]
  19. Long, J.; Xie, X.; Xu, J.; Gu, Q.; Chen, L.; Wang, X. Nitrogen-Doped Graphene Nanosheets as Metal-Free Catalysts for Aerobic Selective Oxidation of Benzylic Alcohols. ACS Catal. 2012, 2, 622–631. [Google Scholar] [CrossRef]
  20. Mahmood, J.; Lee, E.K.; Jung, M.; Shin, D.; Jeon, I.Y.; Jung, S.M.; Choi, H.J.; Seo, J.M.; Bae, S.Y.; Sohn, S.D.; et al. Nitrogenated holey two-dimensional structures. Nat. Commun. 2015, 6, 6486. [Google Scholar] [CrossRef]
  21. Yar, M.; Hashmi, M.A.; Ayub, K. The C2N surface as a highly selective sensor for the detection of nitrogen iodide from a mixture of NX3 (X = Cl, Br, I) explosives. RSC Adv. 2020, 10, 31997–32010. [Google Scholar] [CrossRef] [PubMed]
  22. Bhattacharyya, K.; Pratik, S.M.; Datta, A. Controlled Pore Sizes in Monolayer C2N Act as Ultrasensitive Probes for Detection of Gaseous Pollutants (HF, HCN, and H2S). J. Phys. Chem. C 2018, 122, 2248–2258. [Google Scholar] [CrossRef]
  23. Yar, M.; Ahsan, F.; Gulzar, A.; Ayub, K. Adsorption and sensor applications of C2N surface for G-series and mustard series chemical warfare agents. Microporous Mesoporous Mater. 2021, 317, 110984. [Google Scholar] [CrossRef]
  24. Yong, Y.; Cui, H.; Zhou, Q.; Su, X.; Kuang, Y.; Li, X. C2N monolayer as NH3 and NO sensors: A DFT study. Appl. Surf. Sci. 2019, 487, 488–495. [Google Scholar] [CrossRef]
  25. Huang, C.; Mahmood, J.; Wei, Z.; Wang, D.; Liu, S.; Zhao, Y.; Noh, H.J.; Ma, J.; Xu, J.; Baek, J.B. Metal (M = Ru, Pd and Co) embedded in C2N with enhanced lithium storage properties. Mater. Today Energy 2019, 14, 100359. [Google Scholar] [CrossRef]
  26. Hussain, T.; Sajjad, M.; Singh, D.; Bae, H.; Lee, H.; Larsson, J.A.; Ahuja, R.; Karton, A. Sensing of volatile organic compounds on two-dimensional nitrogenated holey graphene, graphdiyne, and their heterostructure. Carbon 2020, 163, 213–223. [Google Scholar] [CrossRef]
  27. Su, Y.; Ao, Z.; Ji, Y.; Li, G.; An, T. Adsorption mechanisms of different volatile organic compounds onto pristine C2N and Al-doped C2N monolayer: A DFT investigation. Appl. Surf. Sci. 2018, 450, 484–491. [Google Scholar] [CrossRef]
  28. Tong, B.; Meng, G.; Deng, Z.; Gao, J.; Liu, H.; Dai, T.; Wang, S.; Shao, J.; Tao, R.; Kong, F.; et al. Sc-doped NiO nanoflowers sensor with rich oxygen vacancy defects for enhancing VOCs sensing performances. J. Alloys Compd. 2021, 851, 155760. [Google Scholar] [CrossRef]
  29. Tomer, V.K.; Duhan, S. Ordered mesoporous Ag-doped TiO2/SnO2 nanocomposite based highly sensitive and selective VOC sensors. J. Mater. Chem. A 2016, 4, 1033–1043. [Google Scholar] [CrossRef]
  30. Matsoso, J.B.; Antonatos, N.; Kumar, P.R.; Jellett, C.; Mazánek, V.; Journet, C.; Sofer, Z. Simultaneous microwave-assisted reduction and B/N co-doping of graphene oxide for selective recognition of VOCs. J. Mater. Chem. C 2022, 10, 3307–3317. [Google Scholar] [CrossRef]
  31. Yang, Y.; Sun, C.; Huang, Q.; Yan, J. Hierarchical porous structure formation mechanism in food waste component derived N-doped biochar: Application in VOCs removal. Chemosphere 2022, 291, 132702. [Google Scholar] [CrossRef] [PubMed]
  32. Liu, Y.; Gao, L.; Fu, S.; Cheng, S.; Gao, N.; Li, H. Highly efficient VOC gas sensors based on Li-doped diamane. Appl. Surf. Sci. 2023, 611, 155694. [Google Scholar] [CrossRef]
  33. Liu, Y.; Guo, L. Adsorption mechanisms of different toxic molecular gases on intrinsic C2N and Ti-C2N-V monolayer: A DFT study. J. Mol. Model 2022, 28, 289. [Google Scholar] [CrossRef]
  34. Ren, Y.; Zou, Y.; Liu, Y.; Zhou, X.; Ma, J.; Zhao, D.; Wei, G.; Ai, Y.; Xi, S.; Deng, Y. Synthesis of orthogonally assembled 3D cross-stacked metal oxide semiconducting nanowires. Nat. Mater. 2020, 19, 203–211. [Google Scholar] [CrossRef] [PubMed]
  35. Güntner, A.T.; Righettoni, M.; Pratsinis, S.E. Selective sensing of NH3 by Si-doped α-MoO3 for breath analysis. Sens. Actuat. B-Chem. 2016, 223, 266–273. [Google Scholar] [CrossRef]
  36. Singsen, S.; Watwiangkham, A.; Ngamwongwan, L.; Fongkaew, I.; Jungthawan, S.; Suthirakun, S. Defect Engineering of Green Phosphorene Nanosheets for Detecting Volatile Organic Compounds: A Computational Approach. ACS Appl. Nano Mater. 2023, 6, 1496–1506. [Google Scholar] [CrossRef]
  37. Kresse, G.; Furthmüller, J. Efficiency of ab-initio total energy calculations for metals and semiconductors using a plane-wave basis set. Comput. Mater. Sci. 1996, 6, 15–50. [Google Scholar] [CrossRef]
  38. Perdew, J.P.; Burke, K.; Ernzerhof, M. Generalized Gradient Approximation Made Simple. Phys. Rev. Lett. 1996, 77, 3865–3868. [Google Scholar] [CrossRef]
  39. Blöchl, P.E. Projector augmented-wave method. Phys. Rev. B Condens. Matter 1994, 50, 17953–17979. [Google Scholar] [CrossRef]
  40. Grimme, S.; Antony, J.; Ehrlich, S.; Krieg, H. A consistent and accurate ab initio parametrization of density functional dispersion correction (DFT-D) for the 94 elements H-Pu. J. Chem. Phys. 2010, 132, 154104. [Google Scholar] [CrossRef]
  41. Grimme, S.; Ehrlich, S.; Goerigk, L. Effect of the damping function in dispersion corrected density functional theory. J. Comput. Chem. 2011, 32, 1456–1465. [Google Scholar] [CrossRef]
  42. Heyd, J.; Scuseria, G.E. Efficient hybrid density functional calculations in solids: Assess-ment of the Heyd–Scuseria–Ernzerhof screened Coulomb hybrid functional. J. Chem. Phys. 2004, 121, 1187–1192. [Google Scholar] [CrossRef] [PubMed]
  43. Wang, V.; Xu, N.; Liu, J.C.; Tang, G.; Geng, W.T. VASPKIT: A user-friendly interface facilitating high-throughput computing and analysis using VASP code. Comput. Phys. Commun. 2021, 267, 108033. [Google Scholar] [CrossRef]
  44. Brandbyge, K.; Mozos, J.; Ordejón, P.; Taylor, J.; Stokbro, K. Density-functional method for nonequilibrium electron transport. Phys. Rev. B 2001, 65, 165401. [Google Scholar] [CrossRef]
  45. Krack, M.; Parrinello, M. All-electron ab-initio molecular dynamics. Phys. Chem. Chem. Phys. 2000, 2, 2105–2112. [Google Scholar] [CrossRef]
  46. Kishore, M.R.A.; Ravindran, P. Enhanced Photocatalytic Water Splitting in a C2N Monolayer by C-Site Isoelectronic Substitution. ChemPhysChem 2017, 18, 1526–1532. [Google Scholar] [CrossRef] [PubMed]
  47. Navas, J.; Sánchez-Coronilla, A.; Gallardo, J.J.; Cruz Hernández, N.; Piñero, J.C.; Alcántara, R.; Fernández-Lorenzo, C.; De los Santos, D.M.; Aguilar, T.; Martín-Calleja, J. New insights into organic-inorganic hybrid perovskite CH3NH3PbI3 nanoparticles. An experimental and theoretical study of doping in Pb2+ sites with Sn2+, Sr2+, Cd2+ and Ca2+. Nanoscale 2015, 7, 6216–6229. [Google Scholar] [CrossRef]
  48. Domingo, L.R.; Pérez, P.; Sáez, J.A. Understanding the local reactivity in polar organic reactions through electrophilic and nucleophilic Parr functions. RSC Adv. 2013, 3, 1486–1494. [Google Scholar] [CrossRef]
  49. Zhu, B.C.; Deng, P.J.; Zeng, L.; Guo, J. Computational exploration of gallium-doped neutral and anionic magnesium nanocluster materials: Ga2Mgnq (n=1-11; q=0, -1) nanocluster’s properties based on DFT. Mater. Today Commun. 2021, 29, 103004. [Google Scholar] [CrossRef]
  50. Wei, B.; Mei, Q.; An, Z.; Li, M.; Qiu, Z.; Bo, X.; He, M. Nonmetal-Doped C2N Nanosheets for Removal of Methoxyphenols: A First-Principles Study. ACS Appl. Nano Mater. 2021, 4, 478–486. [Google Scholar] [CrossRef]
  51. Gao, Z.; Huang, Z.; Meng, Y.; Tang, H.; Ni, Z.; Xia, S. Theoretical study on the mechanism of CO2 adsorption and reduction by single-atom M (M = Cu, Co, Ni) doping C2N. Chem. Phys. Lett. 2022, 804, 139902. [Google Scholar] [CrossRef]
  52. Gergen, B.; Nienhaus, H.; Weinberg, W.H.; McFarland, E.W. Chemically Induced Electronic Excitations at Metal Surfaces. Science 2001, 294, 2521–2523. [Google Scholar] [CrossRef] [PubMed]
  53. Kaewmaraya, T.; Ngamwongwan, L.; Moontragoon, P.; Karton, A.; Hussain, T. Drastic Improvement in Gas-Sensing Characteristics of Phosphorene Nanosheets under Vacancy Defects and Elemental Functionalization. J. Phys. Chem. C 2018, 122, 20186–20193. [Google Scholar] [CrossRef]
  54. Xia, S.Y.; Tao, L.Q.; Jiang, T.; Sun, H.; Li, J. Rh-doped h-BN monolayer as a high sensitivity SF6 decomposed gases sensor: A DFT study. Appl. Surf. Sci. 2021, 536, 147965. [Google Scholar] [CrossRef]
  55. Aref, A.; Roohollah, J.; Sadegh, M.A.; Balaji, P. Novel green phosphorene as a superior gas sensor for dissolved gas analysis in oil transformers: Using DFT method. Mol. Simul. 2022, 48, 541–550. [Google Scholar] [CrossRef]
  56. Ghashghaee, M.; Ghambarian, M. Highly improved carbon dioxide sensitivity and selectivity of black phosphorene sensor by vacancy doping: A quantum chemical perspective. Int. J. Quantum. Chem. 2020, 120, e26265. [Google Scholar] [CrossRef]
  57. Aasi, A.; Aghaei, S.M.; Panchapakesan, B. Pt-decorated phosphorene as a propitious room temperature VOC gas sensor for sensitive and selective detection of alcohols. J. Mater. Chem. C 2021, 9, 9242–9250. [Google Scholar] [CrossRef]
  58. Cao, W.; Zhao, Q.; Yang, L.; Cui, H. Enhanced NOx adsorption and sensing properties of MoTe2 monolayer by Ni-doping: A first-principles study. Surf. Interfaces 2021, 26, 101372. [Google Scholar] [CrossRef]
  59. Wang, X.L. Potential application of BC3 nanotubes as a gamma-hydroxybutyric acid drug sensor: A DFT study. Comput Theor Chem 2021, 1202, 113299. [Google Scholar] [CrossRef]
  60. Long, Y.; Xia, S.-Y.; Guo, L.-Y.; Tan, Y.; Huang, Z. As-Doped h-BN Monolayer: A High Sensitivity and Short Recovery Time SF6 Decomposition Gas Sensor. Sensors 2022, 22, 4797. [Google Scholar] [CrossRef]
  61. Baikie, I.D.; Mackenzie, S.; Estrup, P.J.Z.; Meyer, J.A. Noise and the Kelvin method. Rev. Sci. Instrum. 1991, 62, 1326–1332. [Google Scholar] [CrossRef]
  62. Richardson, O.W. Electron Emission from Metals as a Function of Temperature. Phy. Rev. 1924, 23, 153–155. [Google Scholar] [CrossRef]
  63. Ma, S.X.; Li, D.J.; Rao, X.J.; Xia, X.F.; Su, Y.; Lu, Y.F. Pd-doped h-BN monolayer: A promising gas scavenger for SF6 insulation devices. Adsorption 2020, 26, 619–626. [Google Scholar] [CrossRef]
  64. Niu, J.S.; Chen, P.L.; Lin, K.W.; Tsai, J.H.; Hsu, W.C.; Liu, W.C. An Indium-Gallium-Zinc-Oxide Layer Decoratedwith Gold Nanoparticles for Ultrahigh Sensitive Formaldehyde Gas Detection. IEEE Trans. Electron. Devices 2023, 70, 269–274. [Google Scholar] [CrossRef]
  65. Zhu, L.; Wang, J.; Liu, J.; Chen, X.; Xu, Z.; Ma, Q.; Wang, Z.; Liang, J.; Li, S.; Yan, W. Designing highly sensitive formaldehyde sensors via A-site cation deficiency in LaFeO3 hollow nanofibers. Appl. Surf. Sci. 2022, 590, 153085. [Google Scholar] [CrossRef]
  66. Lu, Z.; Sima, Z.; Song, P. MOF-derived nest-like hierarchical In2O3 structures with enhanced gas sensing performance for formaldehyde detection at low temperature. Inorg. Chem. Commun. 2022, 146, 110133. [Google Scholar] [CrossRef]
  67. Cai, H.; Luo, N.; Hu, Q.; Xue, Z.; Wang, X.; Xu, J. Multishell SnO2 Hollow Microspheres Loaded with Bimetal PdPt Nanoparticles for Ultrasensitive and Rapid Formaldehyde MEMS Sensors. ACS Sens. 2022, 7, 1484–1494. [Google Scholar] [CrossRef]
  68. Du, L.; Sun, H. Facile synthesis of ZnO/SnO2 hybrids for highly selective and sensitive detection of formaldehyde. New J. Chem. 2022, 46, 5573–5580. [Google Scholar] [CrossRef]
  69. Chen, R.J.; Franklin, N.R.; Kong, J.; Cao, J.; Tombler, T.W.; Zhang, Y.; Dai, H. Molecular photodesorption from single-walled carbon nan-tubes. Appl. Phys. Lett. 2001, 79, 2258–2260. [Google Scholar] [CrossRef]
  70. Aasi, A.; Aghaei, S.M.; Panchapakesan, B. Noble metal (Pt or Pd)-decorated atomically thin MoS2 as a promising material for sensing colorectal cancer biomarkers through exhaled breath. Int. J. Comp. Mat. Sci. Eng. 2023, 2350014. [Google Scholar] [CrossRef]
  71. Ji, S.; Wang, Z.; Zhao, J. A boron-interstitial doped C2N layer as a metal-free electrocatalyst for N2 fixation: A computational study. J. Mater. Chem. 2019, 7, 2392–2399. [Google Scholar] [CrossRef]
  72. Wu, Q.; Wang, H.; Shen, S.; Huang, B.; Dai, Y.; Ma, Y. Efficient nitric oxide reduction to ammonia on a metal-free electrocatalyst. J. Mater. Chem. 2021, 9, 5434–5441. [Google Scholar] [CrossRef]
Figure 1. (a) The 2 × 2 supercell of C2N as well as the possible doping sites for Si atom; (b) the optimal doping configuration of Si-doped C2N; (c) the band structure and (d) partial density of states of pure C2N calculated with HSE06 functional; (e) the band structure, CBM and VBM distribution of Si-doped C2N calculated with HSE06 functional, with the isosurface value of 0.0015 e/Bohr3; and (f) the partial density of states of Si-doped C2N calculated with HSE06 functional.
Crystals 13 00816 g001
Figure 2. (a) Electron localization function (ELF) diagram of Si-doped C2N; (b) the charge density difference of SiC2N between the Si atom and C2N. The cyan and magenta regions denote the charge accumulation and depletion, respectively, and the isosurface value is 0.002 e/Bohr3.
Crystals 13 00816 g002
Figure 3. The optimal binding configurations of (a) C2N_HCHO; (b) C2N_CH3OH; (c) C2N_C3H6O; (d) C2N_C6H6; (e) C2N_C2HCl3, and (f) C2N_NH3. (Silvery: C atom, Blue: N atom, Red: O atom, Cyan: Cl atom, and Pink: H atom).
Crystals 13 00816 g003
Figure 4. The optimal binding configurations of (a) SiC2N_HCHO; (b) SiC2N_CH3OH; (c) SiC2N_C3H6O; (d) SiC2N_C6H6; (e) SiC2N_C2HCl3, and (f) SiC2N_NH3. Bonds are in Å. (Silvery: C atom, Blue: N atom, Yellow: Si atom, Red: O atom, Cyan: Cl atom, Pink: H atom).
Crystals 13 00816 g004
Figure 5. The density of states of gases before and after adsorption, and the partial density of states of working Si (or N) atom in SiC2N and the O (or N) in gases for (a) SiC2N_HCHO, (b) SiC2N_CH3OH, (c) SiC2N_C3H6O, and (d) SiC2N_NH3 systems.
Crystals 13 00816 g005
Figure 6. Band structures of (a) SiC2N_HCHO, (b) SiC2N_CH3OH, (c) SiC2N_C3H6O, (d) SiC2N_C6H6, (e) SiC2N_C2HCl3, and (f) SiC2N_NH3 systems calculated by the HSE06 functional.
Crystals 13 00816 g006
Figure 7. (af) The electrical conductivity (σ) as a function of chemical potential for SiC2N and adsorption systems; (g) the I–V curves of SiC2N and SiC2N_NH3 system at the voltage of 0–1 V.
Crystals 13 00816 g007
Figure 8. The sensitivity of SiC2N to O-containing VOCs and NH3.
Crystals 13 00816 g008
Figure 9. (a) Recovery time of the SiC2N for VOC and NH3 detection under visible light; (b) the adsorption Gibbs free energies of VOCs and ammonia on SiC2N; and (c) recovery time of the SiC2N for VOC and NH3 detection under UV light.
Crystals 13 00816 g009
Table 1. The adsorption energies (Ead) and Bader charge transfer (Δq) in C2N_gas and SiC2N_gas systems. The minus sign in Δq represents the electron reduction of gases.
Ead (eV)Δq (Gas) Ead (eV)Δq (Gas)
C2N_HCHO−0.470.017SiC2N_HCHO−1.040.388
C2N_CH3OH−0.530.019SiC2N_CH3OH−0.900.057
C2N_C3H6O−0.440.005SiC2N_C3H6O−0.600.134
C2N_C6H6−0.380.003SiC2N_C6H6−0.36−0.016
C2N_C2HCl3−0.480.001SiC2N_C2HCl3−0.410.017
C2N_NH3−0.38−0.004SiC2N_NH3−1.21−0.046
Table 2. The band gap and recovery time of SinC2N_gas systems based on the PBE functional.
Eg (eV) τ
(UV Light)
τ
(UV Light)
τ
(UV Light)
SiC2N_HCHO0.11 2.92   × 101 3.59   × 10−2 1.26   × 10−3
SiC2N_CH3OH~0 1.30   × 10−1 3.94   × 10−4 2.17   × 10−5
SiC2N_C3H6O0.07 1.19   × 10−6 2.49   × 10−8 3.61   × 10−9
SiC2N_NH3~0 2.09   × 104 8.59   × 100 1.74   × 10−1
Si2C2N_HCHO~0 6.68   × 104 2.26   × 101 4.15   × 10−1
Si2C2N_CH3OH0.02 1.37   × 102 1.30   × 10−1 4.01   × 10−3
Si2C2N_C3H6O0.03 1.79   × 10−5 2.38   × 10−7 2.75   × 10−8
Si2C2N_NH30.02 6.80   × 105 1.56   × 102 2.37   × 100
Si4C2N_HCHO~0 2.21   × 107 2.84   × 103 3.22   × 101
Si4C2N_CH3OH~0 4.46   × 103 2.37   × 100 5.45   × 10−2
Si4C2N_C3H6O~0 5.70   × 10−5 6.26   × 10−7 6.56   × 10−8
Si4C2N_NH3~0 4.78   × 107 5.41   × 103 5.75   × 101
Disclaimer/Publisher’s Note: The statements, opinions and data contained in all publications are solely those of the individual author(s) and contributor(s) and not of MDPI and/or the editor(s). MDPI and/or the editor(s) disclaim responsibility for any injury to people or property resulting from any ideas, methods, instructions or products referred to in the content.

