Characterization of Pure Face-Shear Strain in Piezoelectric α-Tellurium Dioxide (α-TeO2)


École de Technologie Supérieure, Université du Québec, Montréal, QC H3C1K3, Canada
*
Author to whom correspondence should be addressed.
Crystals 2020, 10(10), 939; https://doi.org/10.3390/cryst10100939
Submission received: 21 September 2020
/
Revised: 12 October 2020
/
Accepted: 13 October 2020
/
Published: 15 October 2020
(This article belongs to the Special Issue Piezoelectric Materials and Technology)
Abstract
:Paratellurite, also known as α-tellurium dioxide, is a ceramic that is primarily employed for its interesting optical properties. However, this material’s crystal structure belongs to the 422 symmetry class that allows a unique piezoelectric behavior to manifest itself: deformation in pure face-shear. This means that crystal symmetry necessitates the piezoelectric tensor to have only a single non-zero coefficient, d123 = d14: such unique behavior has the potential to enable novel gyroscopic sensors and high-precision torsional microelectromechanical systems (MEMS) actuators, as pure face-shear can be used to induce pure torsion. Although α-TeO2 is one of the few known materials belonging to this symmetry class, considerable uncertainty in its single piezoelectric coefficient exists, with the few reported literature values ranging from 6.13 to 14.58 pC/N; this large uncertainty results from the difficulty in using conventional piezoelectric characterization techniques on paratellurite, limiting measurements to indirect methods. The novel applications that would be enabled by the adoption of this extraordinary material are frustrated by this lack of confidence in the literature. We therefore leverage, for the first time, a first-principles analytical physical model with electrochemical impedance spectroscopy (EIS) to determine, directly, the lone piezoelectric coefficient d123 = d14 = 7.92 pC/N.
1. Introduction
The study and understanding of piezoelectricity over the last century contributed to the development of countless applications, including sound navigation ranging (sonar), microelectromechanical systems (MEMS), fiber optic phase modulators used in high-speed telecommunications, automobile airbags, and the atomic force microscope (AFM). In most current applications, typically the thickness-shear (d15), thickness-extension (d13), and length or width extension deformation modes are used (d33). Face-shear (d14) is a more complex type of deformation, and is of great potential interest for torsional applications, like novel gyroscopic sensors or high-precision torsional MEMS actuators. However, although there exist 20 piezoelectric crystal classes, these various modes occur simultaneously and are typically interdependent and electromechanically coupled; very few materials offer a pure face-shear mode that is unpolluted by other, often undesirable excitation modes. One of the few alternative materials includes β-quartz, which allows pure-shear mode in certain limited orientations [1], is thermodynamically unstable except at high temperatures. For room temperature applications, α-phase tellurium dioxide (paratellurite, TeO2) is particularly interesting: as a rare 422 symmetry class crystal [2,3], its only non-zero piezoelectric coefficient is d123 = d14. Thermodynamics and crystal symmetry arguments impose an elastic mechanical stiffness tensor cijkl = cIJ, a dielectric permittivity tensor εij, and a piezoelectric strain tensor dijk = diJ with few independent coefficients [4,5,6]:
In particular, the remarkably simple piezoelectric coefficient tensor means that a perfectly pure face-shear deformation can be induced by the piezoelectric effect in crystals of the 422 symmetry class. An application that leverages paratellurite would therefore be unencumbered by undesired deformation modes, thereby enabling a cleaner signal with theoretically no spurious excitations and reduced energy consumption—of particular importance in tomorrow’s MEMS devices.
Paratellurite is a relatively well-studied material in terms of its interesting optical and acoustic behavior, is currently a dominant material for state-of-the-art optoacoustic applications, and is enjoying growing interest for novel optical and acoustical micro- and nano-systems [7,8,9,10,11,12,13,14,15]. However, in contrast to these well-characterized optical and acoustic properties, the piezoelectric behavior of paratellurite is purely understood and rarely harnessed.
In particular, substantial uncertainty regarding the magnitude of the single piezoelectric coefficient d123 = d14 exists in the literature, due to the difficulty in characterizing this unique mode, with the few available studies estimating values ranging from 6.13 to 14.58 pC/N [16,17,18,19]. This large uncertainty is a direct result of the challenges faced by employing traditional piezoelectric characterization techniques to a pure face-shear piezoelectric deformation that lacks piezoelectric deformation components in other directions.
However, what is exciting about paratellurite is precisely the pure-shear excitation that is exhibited by this fascinating material. Unfortunately, this very mode has proven elusive to experimentally measure, and no previous study has been able to characterize this piezoelectric deformation mode directly.
The fundamental principle used to traditionally characterize the piezoelectric behavior of a material is the resonance method. This approach requires the experimental observation of either the mechanical or electrical frequency response for a sample covering one or many resonances that occur at specific excitation frequencies. Simple one-dimensional phenomenological equivalent-circuit models like those proposed by Van Dyke [20], Mason [21] and KLM [22] have been used for almost a century, and are proven work-horses that rely on a single pure resonant frequency. Further generalizations of these numerical models that attempt to simultaneously fit the phenomenological equivalent-circuit model to multiple resonant frequencies have lately been developed and can now be used due to the recent progress in computing power [23]. However, these numerical approaches are empirical in nature, and in the case of paratellurite, additionally suffer from the experimental difficulty in accurately inducing and measuring pure face shear deformation without mechanically constraining the crystal. An approach that does not rely on a phenomenological equivalent-circuit model is therefore desirable.
Ohmachi [16], Ogi [17], and Ledbetter [18] used the resonant ultrasound spectroscopy (RUS) method combined with the solution to the Christoffel continuum mechanics equation to characterize the paratellurite elastic properties and the IRE 1D longitudinal electromechanical coupling factor formula to deduce the piezoelectric and dielectric properties [23]. This indirect method, based on purely mechanical measurements, requires using multiple single-crystal samples, each cut at a specific angle and geometry, in an attempt to isolate independent elasticity tensor components by relating each of the three possible propagating bulk waves in a given direction with a combination of coefficients. This indirect approach helps overcome the experimental challenge of inducing and measuring pure face shear, but suffers from the difficulty of precision machining the different required cuts on multiple single-crystal samples. In addition, invasive conventional acoustic transducers that mechanically constrain each sample in a different way have to be attached in order to measure the sound velocities; this contributes to significant experimental uncertainty, particularly because extraction of the piezoelectric and dielectric properties are obtained using a model that necessarily assumes a pure one dimensional acoustic wave motion in a free sample, which is experimentally nearly impossible to ensure in such a complex set-up. In addition, the characterization requires measuring multiple samples that must be assumed otherwise identical, which poses a challenge in repeatability and reliability (e.g., inconsistent chemical composition, residual strains, crystal defects, interfaces, sample shape/size, etc.).
Arlt and Schweppe [5,6] proposed an approach that combines the piezoelectric governing equations with the assumption of a single two dimensional resonant wave motion, resulting in a significant simplification of the computational challenges. However, the single wave motion assumption is an oversimplification, as it leads to significant discrepancies between experimental and predicted impedance or admittance curves; using the resonant method with this approach necessarily neglects all other possible standing waves, harmonics, or interactions that can occur in a single crystal. In order to help partially alleviate this problem, a specific sample geometry must be properly chosen to try to experimentally obtain a resonant frequency that is as pure as possible.
More recently, Brissaud [24,25] proposed an impedance based model that takes account of the possible superposition of the three longitudinal (pressure) waves propagating according to the three Cartesian axes. This generalization of the approach pioneered by Schweppe [6] is used to build an analytical model that combines the piezoelectric governing equations with their proper free vibration boundary conditions and combines them with the equations governing Gauss’ Law of electrostatics. This model results in a more general solution of piezoelectric modeling but only describes longitudinal compressive and tensile strains (i.e., pressure waves), thereby remaining limited to the non-shear vibration modes.
De Castilla et al. [26,27], recently developed a further generalization of Brissaud’s model by taking in account the linear superposition of all nine constituent bulk waves that can propagate on an orthogonal basis: 3 pressure waves and 6 shear waves. The objective of the present manuscript is therefore to characterize the electromechanical behavior of paratellurite using this new very low assumption impedance model. We therefore report on how this analytical model, based on constitutive piezoelectric equations, can be used, for the first time, with electrochemical impedance spectroscopy (EIS) to directly characterize this fascinating pure-shear piezoelectric behavior in paratellurite without the need for phenomenological equivalent circuits or similar empirical assumptions. We thereby hope to help improve upon the large uncertainty that persists in the literature regarding the piezoelectric properties of this exciting material.
2. Materials and Methods
Electrochemical impedance spectroscopy (EIS), also known as electrical impedance spectroscopy or electromechanical impedance spectroscopy, is a well-established materials characterization technique [28].
The classical approach of using this powerful characterization method involves measuring the electrical impedance of a sample over a wide frequency range to identify resonance frequencies; a numerical or analytical model is then used to identify the material parameters that fit to the resonance frequencies observed in the experimentally measured impedance spectrum. Typically, phenomenological equivalent-circuit models or numerical finite-element (FE) methods are used. For example, the Randles equivalent circuit has been used in electrochemical impedance spectroscopy for almost a century [29,30]. However, many other equivalent electrical circuits exist, some of which have been found to better describe piezoelectric behavior [20,21,22]. Nevertheless, all equivalent circuits remain empirical in nature and are not directly based on the underlying physical mechanisms.
In addition to the empirical nature of such an equivalent circuit model, the challenge that arises with characterizing paratellurite or α-tellurium dioxide is that it has few resonant frequencies due to only having a single non-zero piezoelectric coefficient. Using a phenomenological or numerical model to attempt to extract material properties from a system with so few resonances is therefore extremely unreliable, as too many best-fit solutions exist.
We therefore prefer to employ a first-principles analytical model based on the underlying physical governing thermodynamic equations, as described by De Castilla et al. [27]. Such an ab-initio approach has the advantage of employing the laws of physics to establish dependent mathematical relationships between material parameters, thereby reducing the number of apparently independent solutions. An experimental impedance spectrum with few observed resonances can therefore by successfully modeled. This novel method allowed us to leverage EIS to directly characterize the face-shear piezoelectric behavior in α-TeO2 for the first time.
The main assumption of this model is that, as discussed in the introduction, the nine possible existing bulk waves can be superimposed to describe the full dynamic behavior of a piezoelectric material. As described in De Castilla et al. [27], each of the three displacement waves propagating orthogonally in Cartesian (x1, x2, x3) space at a time t is expressed as a weighted sum of the contribution of the three bulk waves f(xi) that propagate in that given direction (x1, x2, or x3):
where is the displacement vector, e is the Euler’s constant, and j is the imaginary number. In the nine unknown parameters Akl, the subscripts k and l represent the propagation direction and the displacement polarity of the wave component, respectively, and is the angular frequency. Fortunately, as paratellurite has a high level of symmetry, all nine bulk waves f(xi) exhibit a pure displacement, simplifying the computational effort in obtaining an analytical solution for the displacement vector.
To solve for uk, one has to satisfy the Christoffel equation coming from the combination of plane wave propagation and the equations of motion [8]:
where is the Christoffel stiffness tensor that is expressed as
where is the elasticity stiffness tensor in a given n direction that takes in account the piezoelectric effect as
where is the Kronecker delta, ρ is the material density, represents the bulk wave velocity, is the elastic stiffness tensor at constant electric field, is the piezoelectric stress tensor, and is the dielectric permittivity tensor under constant strain. The piezoelectric stress tensor used in the above expressions can be related to the piezoelectric strain tensor more commonly reported in the experimental literature by
where is the elastic compliance tensor at constant electric field.
At this point, we can refer to the governing equations describing piezoelectricity (in the stress-charge form):
where T is the stress tensor, S is the strain tensor, E is the electric field vector, D is the dielectric displacement tensor, and superscript t stands for the transpose operation on a tensor.
The electric field and the dielectric displacement field at a specific point in the material are unknown. As described in detail in De Castilla et al. [27], integrating these two constitutive piezoelectric Equations (7a) and (7b) over each face of the sample to satisfy the mechanical boundary conditions yields a system of equations representing the displacement field with nine equations and containing nine unknowns Akl. The solution gives the expression of the unknowns Akl as a function of voltage V(ω), dielectric charge Q, the frequency ω, and the material parameters ().
Taking into account the electrical boundary conditions as well, we can integrate the second piezoelectric Equation (7b) over the entire volume of the sample of size 2a1 × 2a2 × 2a3:
As described in De Castilla et al., resolving this expression (8) by using the system of nine equations with nine unknowns obtained earlier yields an analytical expression that describes the electrochemical impedance Z(ω) of the piezoelectric material:
The electrochemical impedance is thereby analytically described based on the piezoelectric, dielectric, and elastic properties of paratellurite, i.e., .
The final step is therefore to measure the experimental impedance spectrum and then to solve the inverse problem by fitting this analytical solution to the experimental data [26,27].
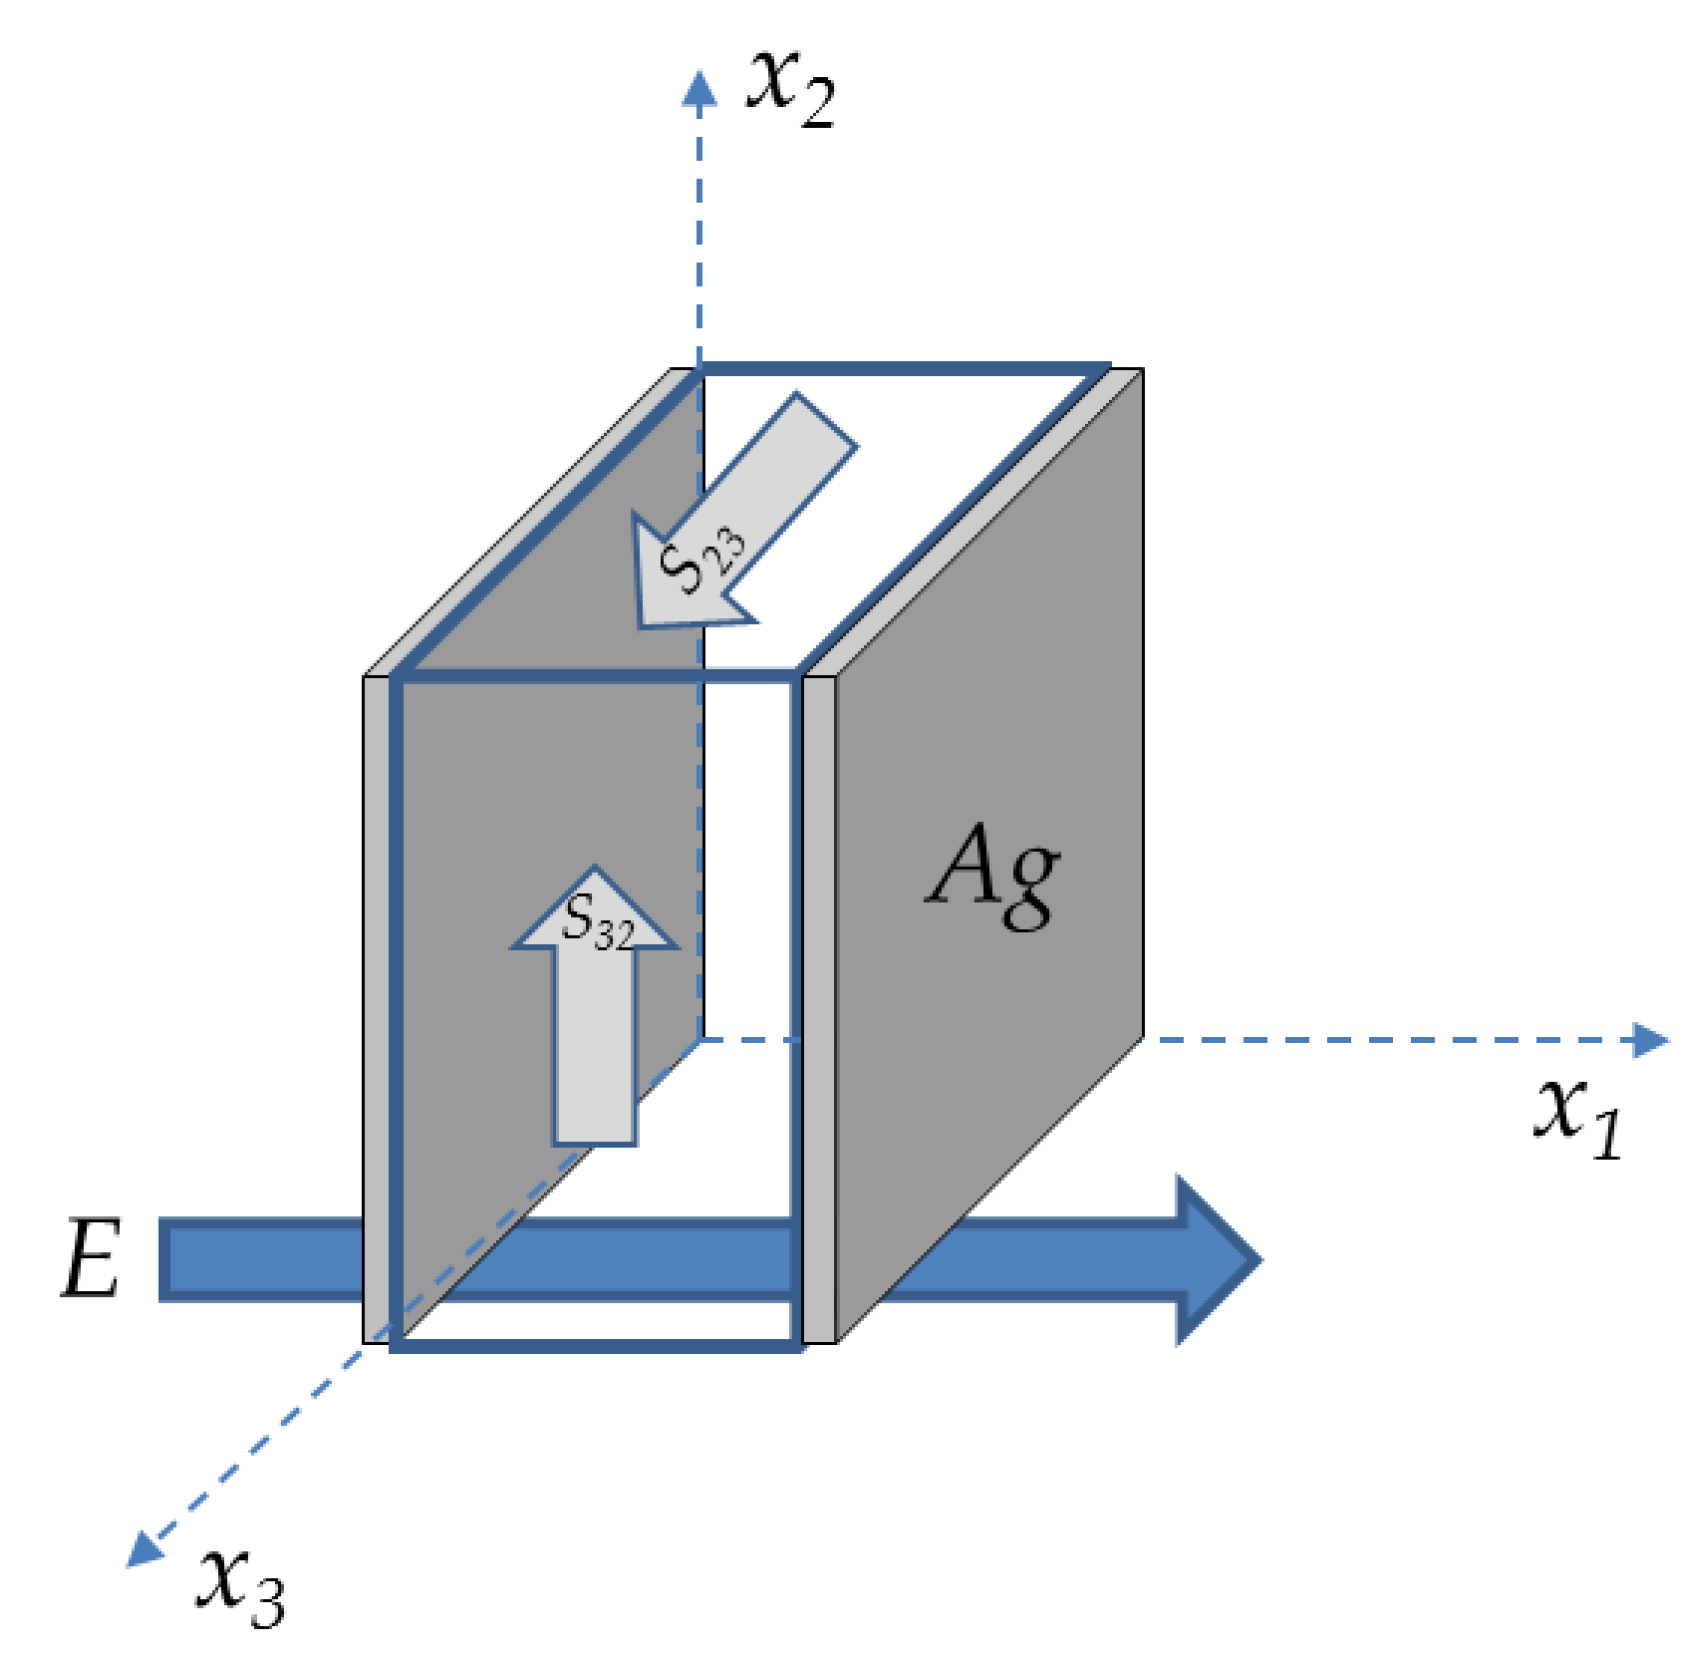
Experimentally, monocrystalline X-cut α-TeO2 grown by the Czochralski method was studied (5 mm thick by 10 mm wide by 10 mm long). Silver paste electrodes were used on the square faces, respectively; as the crystal is unconstrained and large compared to the electrodes, electrical and mechanical effects of the electrodes can be neglected. By imposing the electric field E in the x1-direction (1-direction), only the S23 and S32 deformations are induced by the sole d14 = d123 piezoelectric coefficient, as shown in Figure 1 below.
A Keysight E4990A impedance analyzer (Keysight Technologies, Santa Rosa, California, USA) was used to extract the electrochemical impedance (EIS) spectrum over a frequency sweep from 20 Hz to 200 kHz with a 500 mV excitation signal to capture the fundamental face-shear resonance that occurred around 133 kHz. The analytical model was used to fit to the experimentally observed impedance spectrum, thereby extracting the material parameters.
3. Results and Discussion
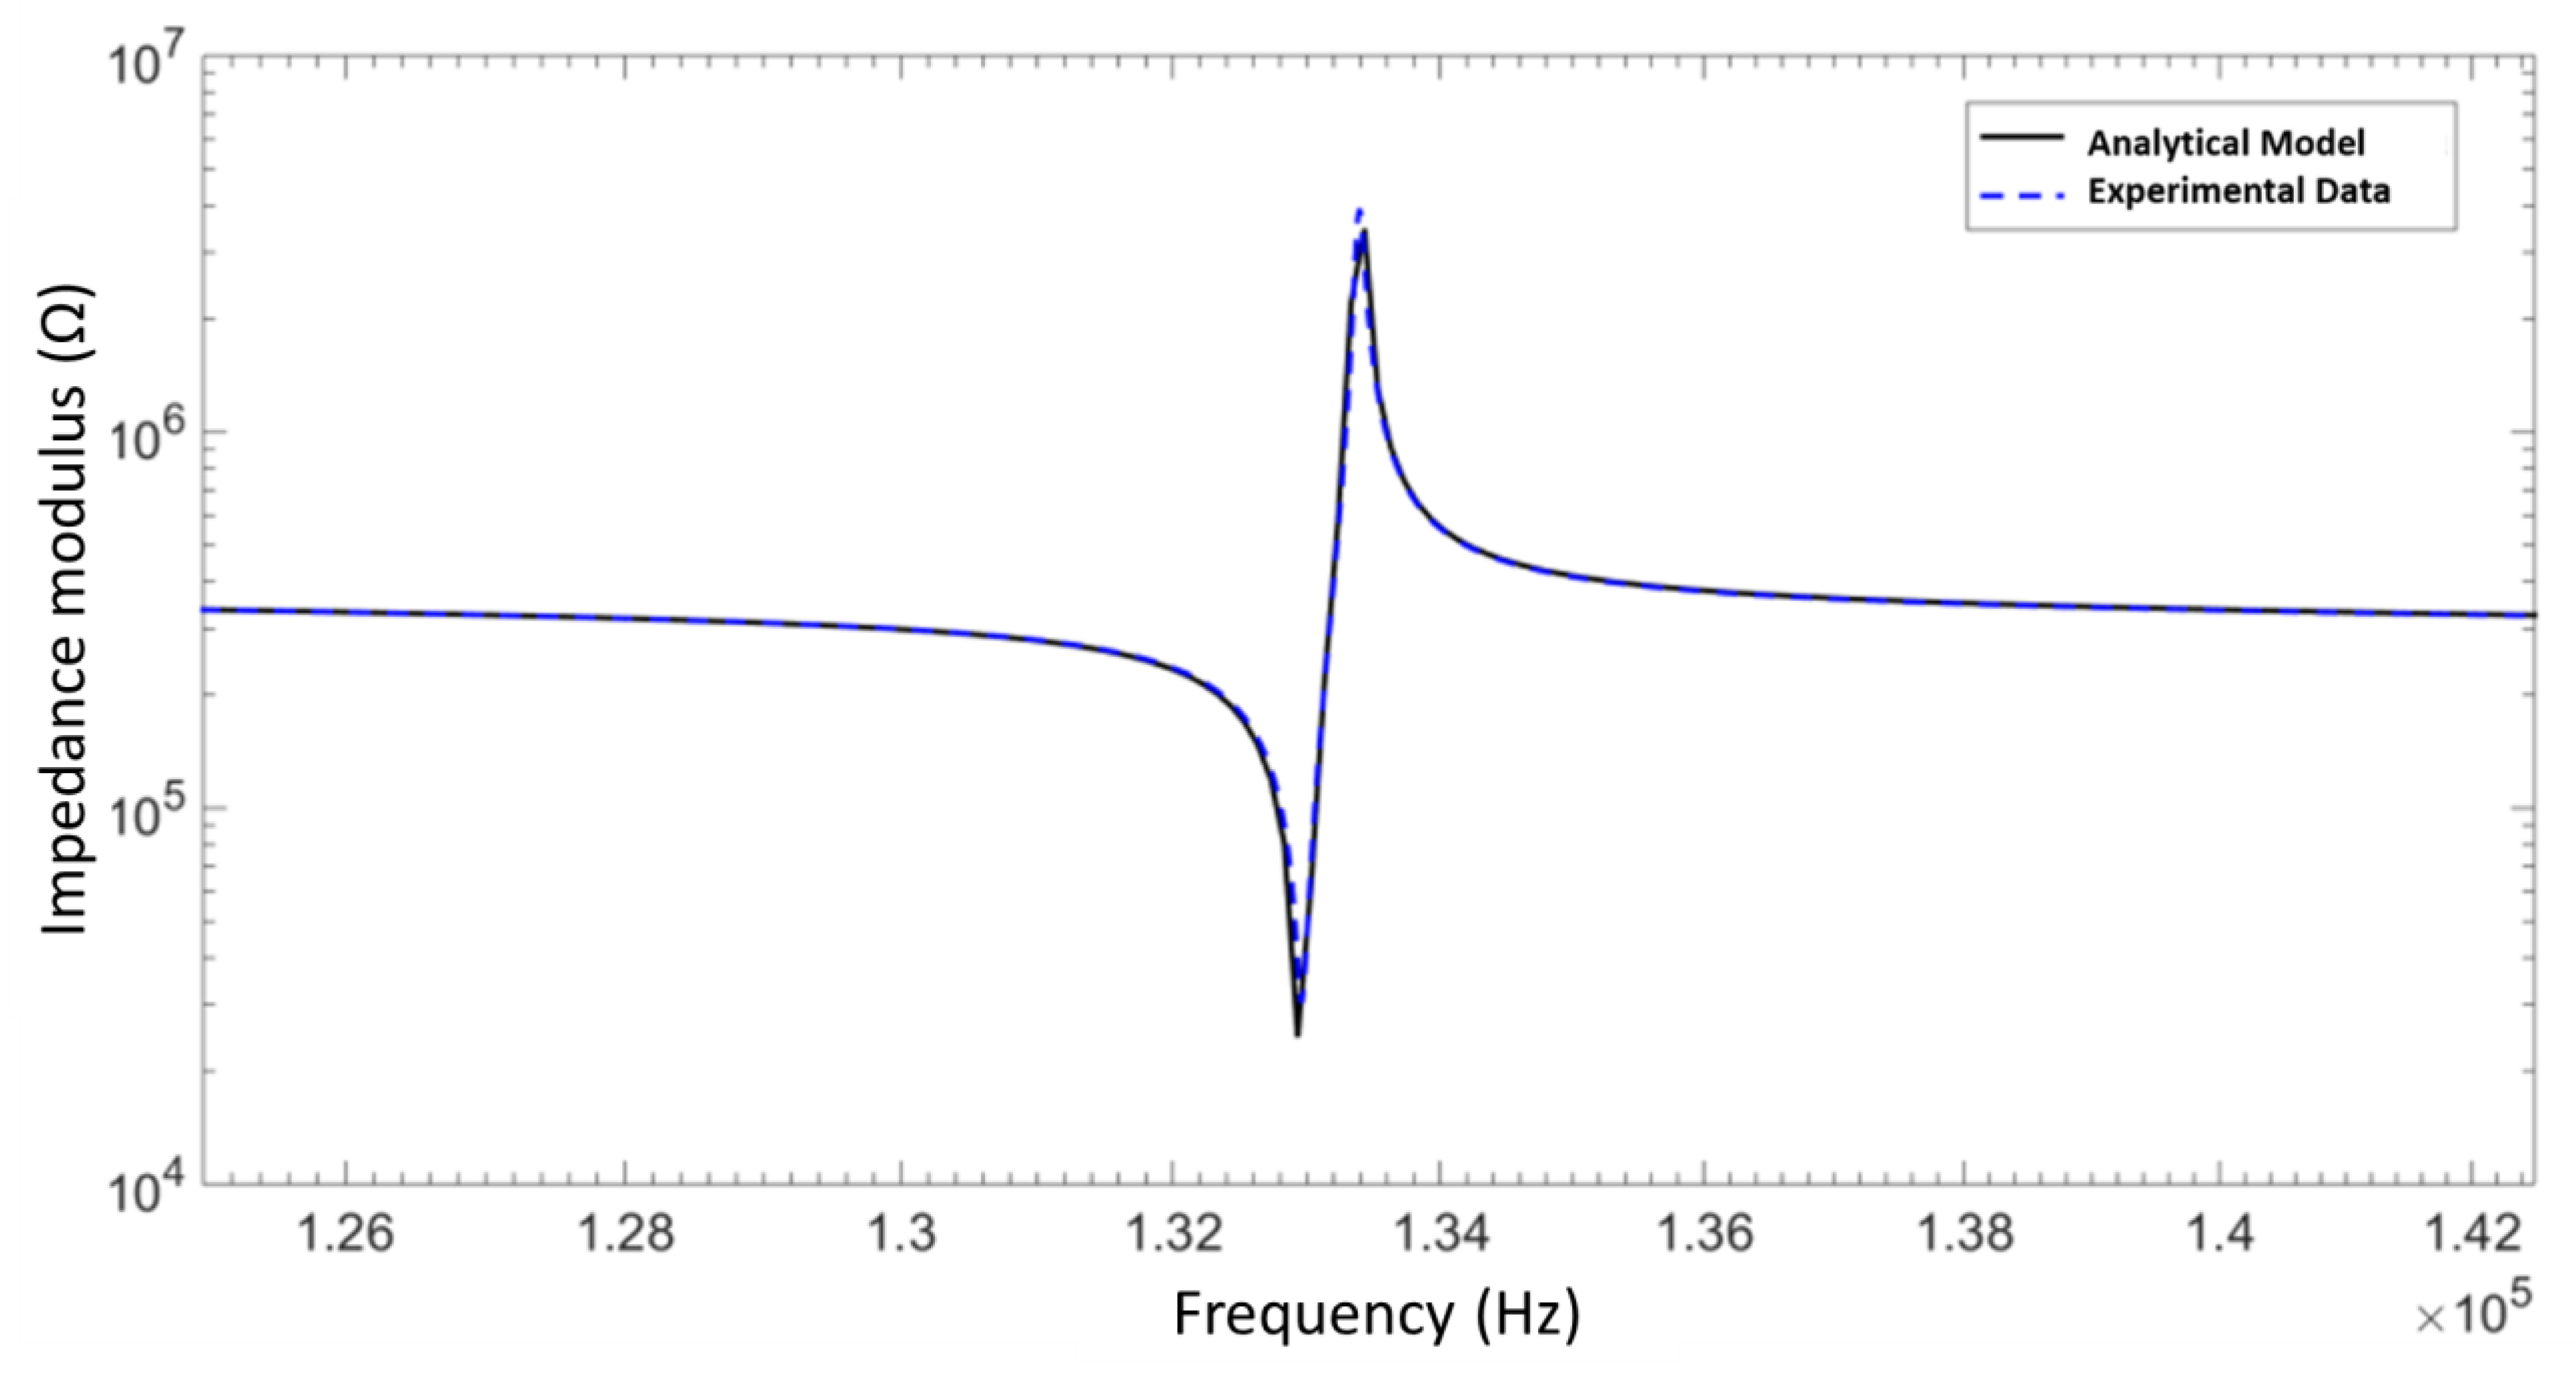
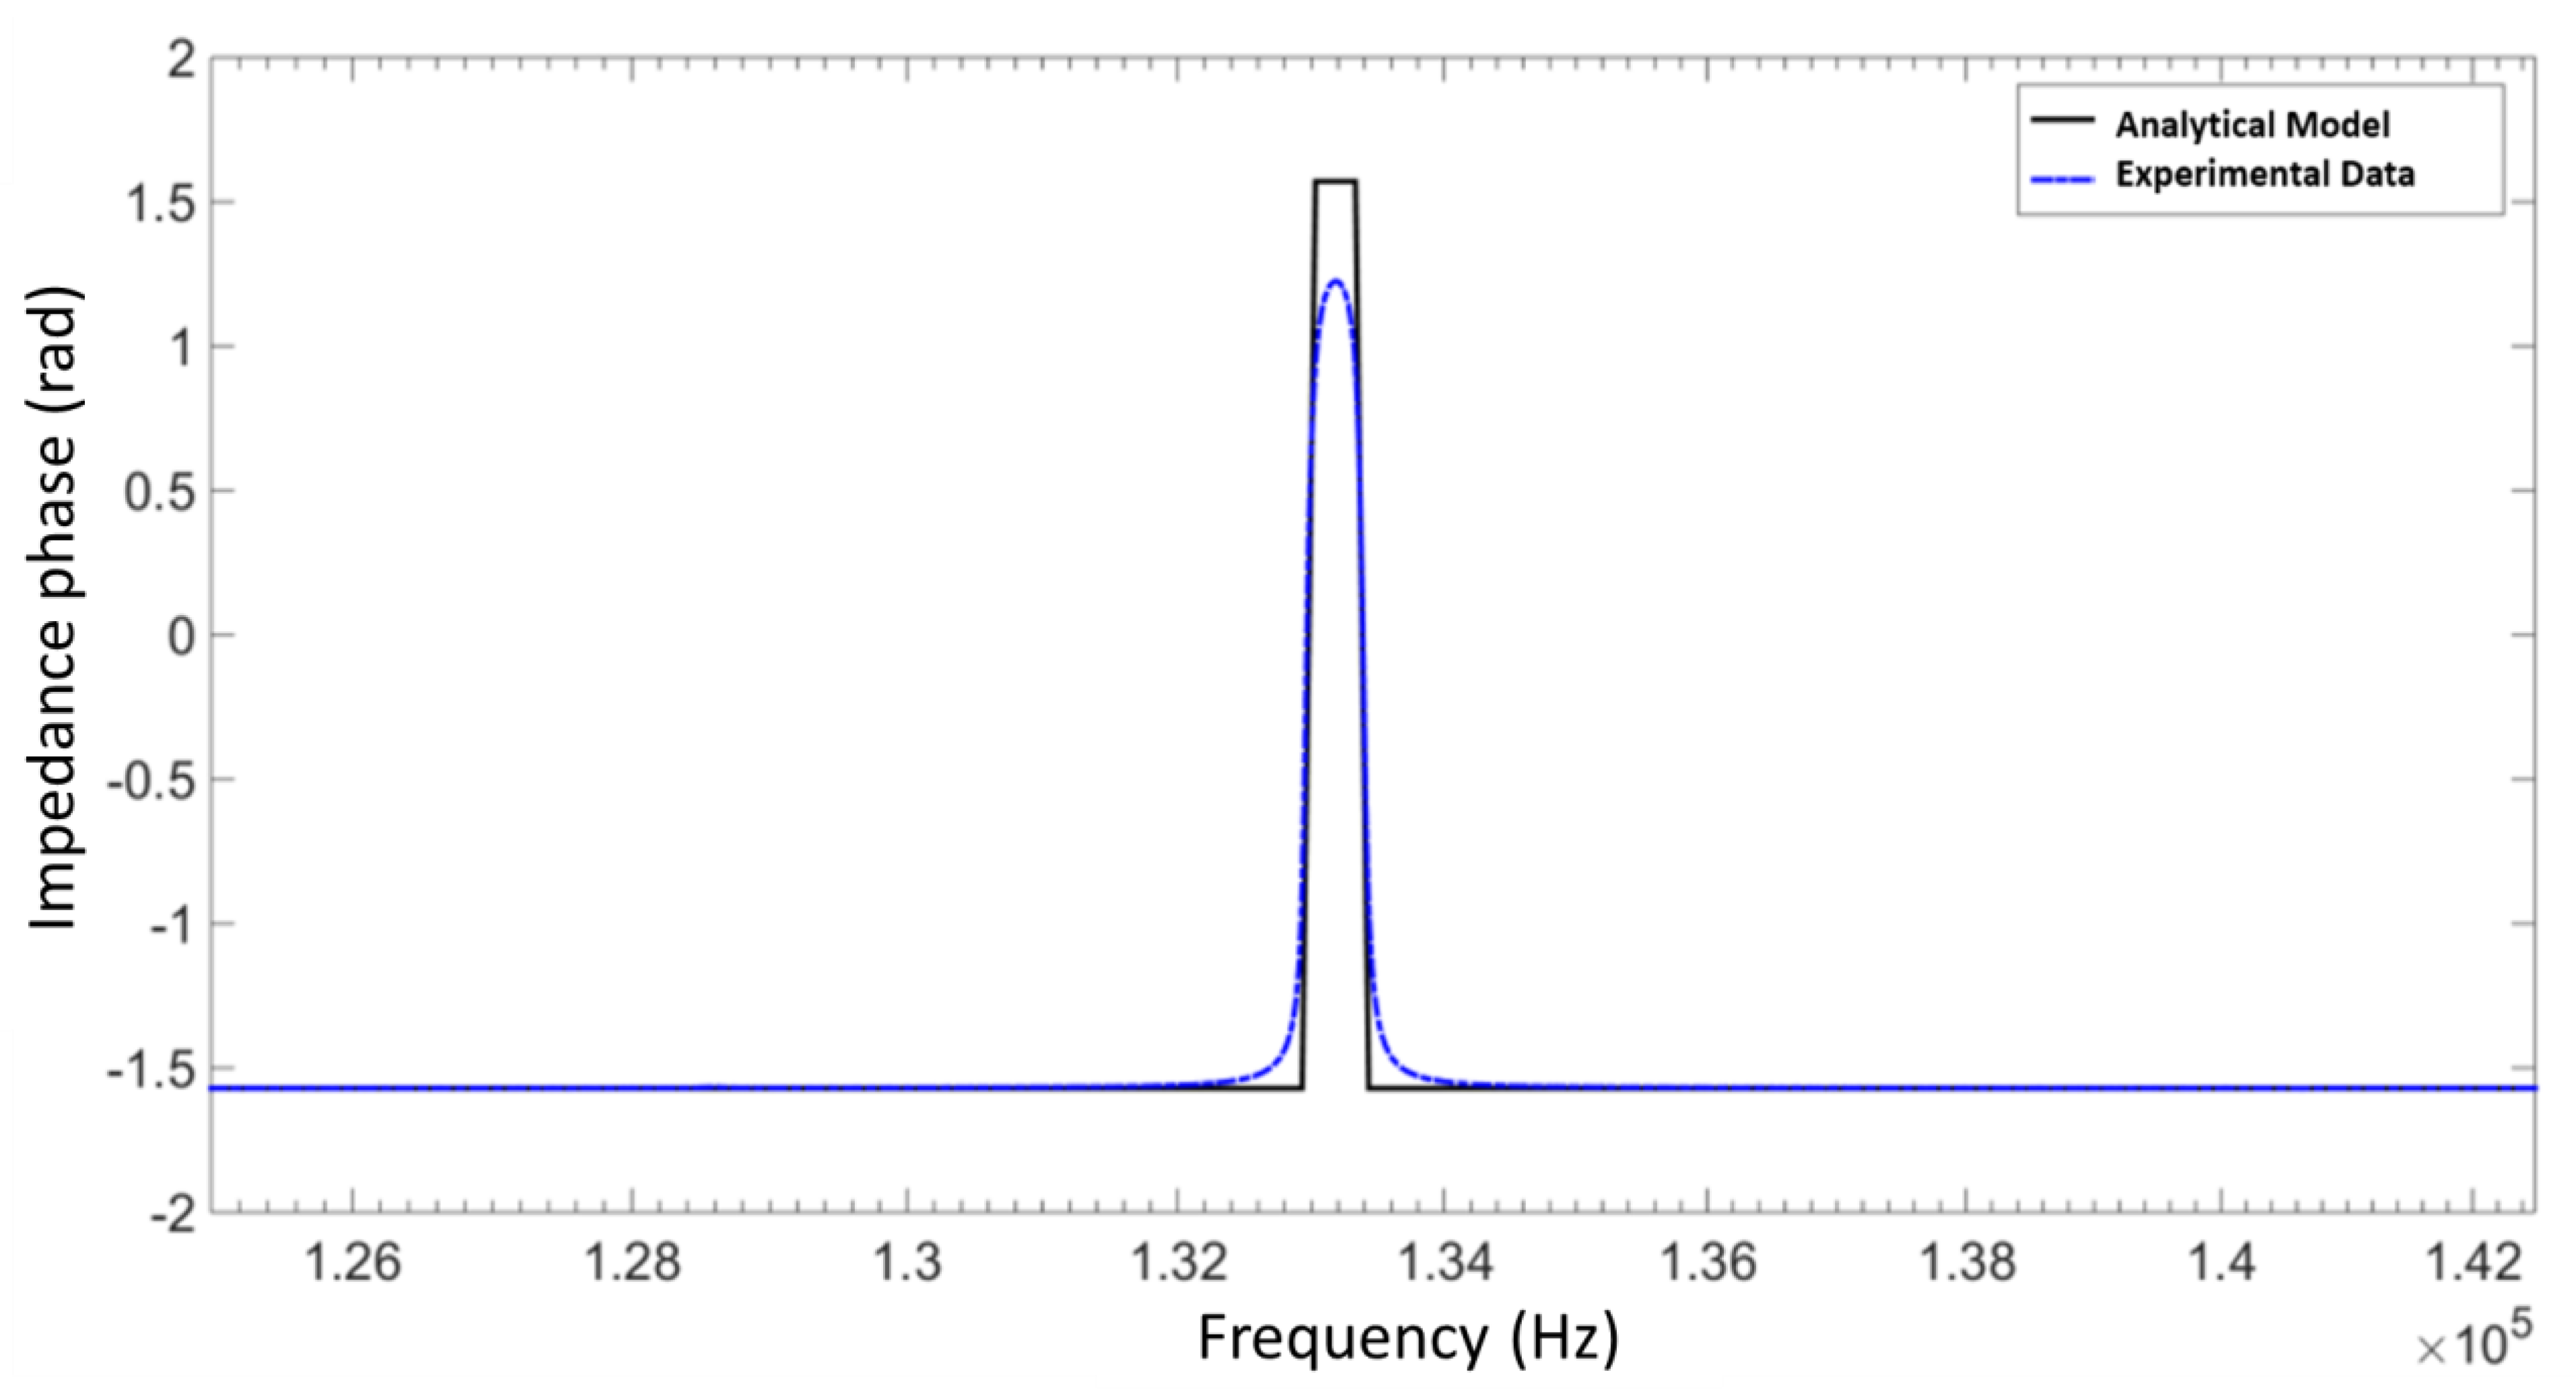
The electrochemical impedance modulus and phase about the fundamental face-shear frequency are provided in Figure 2 and Figure 3, respectively. The analytical model is shown to be in excellent agreement with the experimentally observed spectra, and describes the fundamental face-shear resonance observed about 133 kHz very well.
We could extract the material properties by fitting the analytical impedance model to the experimentally observed impedance spectra. Note that the nature of the face-shear resonance and the crystal symmetry inherent in the 422 crystal class to which paratellurite belongs allows the extraction of the material parameters , , and . Those are the material property coefficients that describe the face-shear resonance in paratellurite, and therefore are the material properties that play a role in the impedance spectrum observed. The material properties extracted by analytical EIS in the present study are provided in Table 1, as are all the known literature values for the piezoelectric coefficient of paratellurite.
We found that our measurements for the mechanical elasticity coefficient c44 and dielectric coefficient ε11 are generally consistent with the literature for α-tellurium dioxide. Our method is, however, the only direct analytical measurement reported in the literature for d123 = d14, the sole piezoelectric coefficient. An additional benefit of using this analytical model is that because the entire electrochemical impedance spectrum is described using these material properties, it is possible to fit the complete experimental spectrum (over a wide frequency range) at once, thereby reducing uncertainty and experimental error.
In a previous study [19], we had reported on the use of finite element analysis (FEA) EIS simulations and Doppler interferometry to study α-tellurium dioxide, and found 6.13 pC/N ≤ d14 ≤ 6.88 pC/N. However, our previous FEA simulation was unable to provide as satisfactory a fit to the experimental EIS data (after extensive simulation/computation time) compared to the present analytical model that is easily computed with a personal computer in a few seconds. In particular, our previous numerical approach did not reliably converge, as the lack of multiple resonant frequencies in the impedance spectrum of paratellurite provides too many possible solutions for the material parameters. In addition, use of Doppler interferometry required invoking the quasi-static assumption while applying an alternating electric field at 40 kHz—an obvious contradiction. We therefore find that our previous results using numerical FEA and Doppler interferometry are likely an underestimate of the piezoelectric coefficient d14, while not providing for the extraction of other material properties.
Instead, we agree more closely with the measurements of Ohmachi and Uchida [16], who characterized the piezoelectric coefficient indirectly using the purely mechanical resonant ultrasound method. One major drawback of that method is the need for several chemically identical samples cut at precisely defined geometries. Any uncertainty in the machining or chemical consistency/defects is amplified in the final result. In addition, the resonant ultrasound method necessitates the application of acoustic transducers on the sample, thereby preventing free mechanical movement. This contrasts with an EIS method, where no mechanical clamping is needed, and all surfaces are allowed to be mechanically free. Our use of the analytical model developed by De Castilla et al. [27], as opposed to an empirical equivalent circuit or a numerical approach, allowed us to successfully use EIS for this material that lacks multiple resonant frequencies in the impedance spectrum. Given the large discrepancy that exists in the literature regarding the piezoelectric constant d123 = d14, this suggests that the other higher values reported for d123 = d14 also obtained by indirect measurements using the mechanical resonant ultrasound method, including Ogi and Fukunage [17] and Ledbetter et al. [18], may be significant overestimates.
We therefore believe that the present characterization enabled by analytical EIS provides for the most reliable measurement of the piezoelectric behavior of α-tellurium dioxide (paratellurite) to date.
4. Conclusions
We were able to extract the material parameters , , and of paratellurite (α-tellurium dioxide) by leveraging a first-principles analytical model with electrochemical impedance spectroscopy (EIS). This enabled us, for the first time, to directly characterize the face-shear piezoelectric coefficient in α-TeO2 as = 7.92 pC/N. We found that our measurements are partly consistent with the literature, in particular with the measurements of Ohmachi and Uchida [16]; given that our measurements are the first direct measurements reported on this material using analytical EIS, we believe that other authors that used more indirect methods may have overestimated this piezoelectric coefficient. Although our findings confirm the exciting potential of paratellurite, further work exploring the dielectric loss mechanism will be necessary before this interesting material can be applied in next-generation devices.
Author Contributions
Conceptualization, G.B. and R.J.Z.; methodology, G.B.; validation, P.B. and R.J.Z.; formal analysis, G.B. and R.J.Z.; investigation, G.B.; writing—original draft preparation, R.J.Z.; writing—review and editing P.B.; supervision, P.B. and R.J.Z.; funding acquisition, G.B., P.B. and R.J.Z. All authors have read and agreed to the published version of the manuscript.
Funding
This research was funded by the Canadian National Science and Engineering Research Council (NSERC), grant number RGPIN-2015-04185, and the Fonds de la recherche du Québec—Nature et technologies (FRQNT) bourses de doctorat en recherche grant number 198752. The APC was funded by École de Technologie Supérieure.
Conflicts of Interest
The authors declare no conflict of interest. The funders had no role in the design of the study; in the collection, analyses, or interpretation of data; in the writing of the manuscript, or in the decision to publish the results.
References
- Buchanan, J.P. Handbook of Piezoelectric Crystals for Radio Equipment Designers; Wright Air Development Center, Air Research and Development Command, US Air Force: Baltimore, MD, USA, 1956. [Google Scholar]
- Liebertz, J. Einkristallzüchtung von Paratellurit (TeO2). Cryst. Res. Technol. 1969, 4, 221–225. [Google Scholar] [CrossRef]
- Miyazawa, S.; Iwasaki, H. Single Crystal Growth of Paratellurite TeO2. Jpn. J. Appl. Phys. 1970, 9, 441–445. [Google Scholar] [CrossRef]
- Nye, J.F. Physical Properties of Crystals—Their Representation by Tensors and Matrices; Oxford Science Publications; Oxford University Press: Oxford, UK, 1957. [Google Scholar]
- Arlt, J.; Schweppe, H. Paratellurite, a new piezoelectric material. Solid State Commun. 1968, 6, 783–784. [Google Scholar] [CrossRef]
- Schweppe, H. Elastic and piezoelectric properties of paratellurite (TeO2). Ultrasonics 1970, 8, 84–87. [Google Scholar] [CrossRef]
- Ceriotti, M.; Pietrucci, F.; Bernasconi, M. Ab initio study of the vibrational properties of crystalline TeO2: The α, β, and γ phases. Phys. Rev. B 2006, 73, 104304. [Google Scholar] [CrossRef] [Green Version]
- Bonner, W.A.; Singh, S.; Van Uitert, L.G.; Warner, A.W. High quality tellurium dioxide for acousto-optic and non-linear applications. J. Electron. Mater. 1972, 1, 154–164. [Google Scholar] [CrossRef]
- Uchida, N. Optical Properties of Single-Crystal Paratellurite (TeO2). Phys. Rev. B 1971, 4, 3736–3745. [Google Scholar] [CrossRef]
- Ayrault, B.; Decamps, E.-A.; Abba, F.; Marqueton, Y.; Durand, M. Lattice dynamics of paratellurite TeO2. Solid State Commun. 1972, 11, 639–643. [Google Scholar] [CrossRef]
- Warner, A.W.; White, D.L.; Bonner, W.A. Acousto--optic light deflectors using optical activity in paratellurite. J. Appl. Phys. 1972, 43, 4489. [Google Scholar] [CrossRef]
- Voloshinov, V.B.; Polikarpova, N.V. Acousto-optic investigation of propagation and reflection of acoustic waves in paratellurite crystal. Appl. Opt. 2009, 48, C55–C66. [Google Scholar] [CrossRef]
- Ovchinnikova, E.; Novikov, D.; Zschornak, M.; Kulikov, A.; Kozlovskaya, K.; Dmitrienko, V.; Oreshko, A.; Blagov, A.; Mukhamedzhanov, E.; Marchenkov, N.; et al. Forbidden Reflections in TeO2 in the Vicinity of the Te L1 Absorption Edge. Crystals 2020, 10, 719. [Google Scholar] [CrossRef]
- Abbudi, M.; Barnett, D.M. Search for Exceptional Waves: Tellurium Dioxide, an Example. Appl. Mech. Rev. 1990, 43, S354–S358. [Google Scholar] [CrossRef]
- Declercq, N.F.; Polikarpova, N.V.; Voloshinov, V.B.; Leroy, O.; Degrieck, J. Enhanced anisotropy in Paratellurite for inhomogeneous waves and its possible importance in the future development of acousto-optic devices. Ultrasonics 2006, 44, e833–e837. [Google Scholar] [CrossRef] [PubMed]
- Ohmachi, Y. Temperature Dependence of Elastic, Dielectric, and Piezoelectric Constants in TeO2 Single Crystals. J. Appl. Phys. 1970, 41, 2307. [Google Scholar] [CrossRef]
- Ogi, H.; Fukunaga, M.; Hirao, M.; Ledbetter, H. Elastic constants, internal friction, and piezoelectric coefficient ofα−TeO2. Phys. Rev. B 2004, 69, 024104. [Google Scholar] [CrossRef]
- Ledbetter, H.; Leisure, R.G.; Migliori, A.; Betts, J.; Ogi, H. Low-temperature elastic and piezoelectric constants of paratellurite (α-TeO2). J. Appl. Phys. 2004, 96, 6201–6206. [Google Scholar] [CrossRef]
- Boivin, G.; Belanger, P.; Zednik, R.J. Torsional Piezoelectric Strain in Monocrystalline Paratellurite. Mater. Sci. Forum 2016, 879, 637–641. [Google Scholar] [CrossRef]
- Van Dyke, K. The Piezo-Electric Resonator and Its Equivalent Network. Proc. IRE 1928, 16, 742–764. [Google Scholar] [CrossRef]
- Mason, W.P. An Electromechanical Representation of a Piezoelectric Crystal Used as a Transducer. Proc. Inst. Radio Eng. 1935, 23, 1252–1263. [Google Scholar] [CrossRef]
- Krimholtz, R.; Leedom, D.; Matthaei, G. New equivalent circuits for elementary piezoelectric transducers. Electron. Lett. 1970, 6, 398–399. [Google Scholar] [CrossRef]
- Jaffe, B.; Cook, W.R., Jr.; Jaffe, H. Piezoelectric Ceramics, Non-Metallic Solids: A Series of Monographs; Academic Press: London, UK; New York, NY, USA, 1971; Volume 3. [Google Scholar]
- Brissaud, M. Characterization of piezoceramics. IEEE Trans. Ultrason. Ferroelectr. Freq. Control 1991, 38, 603–617. [Google Scholar] [CrossRef]
- Brissaud, M. Three-dimensional modeling of piezoelectric materials. IEEE Trans. Ultrason. Ferroelectr. Freq. Control 2010, 57, 2051–2065. [Google Scholar] [CrossRef]
- De Castilla, H.; Belanger, P.; Zednik, R.J. High temperature characterization of piezoelectric lithium niobate using electrochemical impedance spectroscopy resonance method. J. Appl. Phys. 2017, 122, 244103. [Google Scholar] [CrossRef] [Green Version]
- De Castilla, H.; Belanger, P.; Zednik, R.J. Generalized Dynamic Analytical Model of Piezoelectric Materials for Characterization Using Electrical Impedance Spectroscopy. Materials 2019, 12, 2502. [Google Scholar] [CrossRef] [Green Version]
- Macdonald, J.R.; Johnson, W.B. Fundamentals of Impedance Spectroscopy; Wiley: Hoboken, NJ, USA, 2005; pp. 1–26. [Google Scholar]
- Randles, J.E.B. Kinetics of rapid electrode reactions. Discuss. Faraday Soc. 1947, 1, 11–19. [Google Scholar] [CrossRef]
- Lasia, A. Electrochemical Impedance Spectroscopy and its Applications; Springer Science + Business Media: New York, NY, USA, 2014. [Google Scholar] [CrossRef]
Figure 1.
Piezoelectric shear strains S23 and S32 induced on the x2 and x3 faces of a paratellurite crystal by applying electric field E between the x1 faces using silver (Ag) electrodes.
Figure 1.
Piezoelectric shear strains S23 and S32 induced on the x2 and x3 faces of a paratellurite crystal by applying electric field E between the x1 faces using silver (Ag) electrodes.

Figure 2.
Electrical impedance modulus spectrum in monocrystalline paratellurite about the fundamental face-shear piezoelectric excitation.
Figure 2.
Electrical impedance modulus spectrum in monocrystalline paratellurite about the fundamental face-shear piezoelectric excitation.

Figure 3.
Electrical impedance phase spectrum in monocrystalline paratellurite about the fundamental face-shear piezoelectric excitation.
Figure 3.
Electrical impedance phase spectrum in monocrystalline paratellurite about the fundamental face-shear piezoelectric excitation.


Table 1.
Material properties of α-tellurium dioxide (paratellurite, α-TeO2) experimentally determined in this study by analytical Electrochemical Impedance Spectroscopy (EIS) compared to values reported in the literature.
Table 1.
Material properties of α-tellurium dioxide (paratellurite, α-TeO2) experimentally determined in this study by analytical Electrochemical Impedance Spectroscopy (EIS) compared to values reported in the literature.
| Measurement | (pC/N) | (GPa) | (1) |
|---|---|---|---|
| Current Study (Analytical EIS) | 7.92 | 25.4 | 20.2 |
| Boivin et al. [19] (Finite Element Analysis & Doppler Interferometry) | 6.13–6.88 | n/a | n/a |
| Ohmachi and Uchida [16] (Resonant Ultrasound Method) | 8.13 | 26.5 | 22.9 |
| Ogi and Fukunage [17] (Resonant Ultrasound Method) | 12.41 | 26.6 | 22.7 |
| Ledbetter et al. [18] (Resonant Ultrasound Method) | 14.58 * | 26.9 | n/a |
* As only a combination of was reported by Ledbetter et al., the relative permittivity reported by Ogi and Fukunage [17] was used to calculate .
Publisher’s Note: MDPI stays neutral with regard to jurisdictional claims in published maps and institutional affiliations. |
© 2020 by the authors. Licensee MDPI, Basel, Switzerland. This article is an open access article distributed under the terms and conditions of the Creative Commons Attribution (CC BY) license (http://creativecommons.org/licenses/by/4.0/).
Share and Cite
MDPI and ACS Style
Boivin, G.; Bélanger, P.; Zednik, R.J. Characterization of Pure Face-Shear Strain in Piezoelectric α-Tellurium Dioxide (α-TeO2). Crystals 2020, 10, 939. https://doi.org/10.3390/cryst10100939
AMA Style
Boivin G, Bélanger P, Zednik RJ. Characterization of Pure Face-Shear Strain in Piezoelectric α-Tellurium Dioxide (α-TeO2). Crystals. 2020; 10(10):939. https://doi.org/10.3390/cryst10100939
Chicago/Turabian StyleBoivin, Guillaume, Pierre Bélanger, and Ricardo J. Zednik. 2020. "Characterization of Pure Face-Shear Strain in Piezoelectric α-Tellurium Dioxide (α-TeO2)" Crystals 10, no. 10: 939. https://doi.org/10.3390/cryst10100939
Note that from the first issue of 2016, this journal uses article numbers instead of page numbers. See further details here.