Article

Broadband Anisotropic Optical Properties of the Terahertz Generator HMQ-TMS Organic Crystal

1
INFN-Section of Rome ’La Sapienza’, P.Le Aldo Moro, 2, 00185 Rome, Italy
2
Department of Physics, Sapienza University, P.le Aldo Moro, 5, 00185 Rome, Italy
3
Elettra–Sincrotrone Trieste S.C.p.A., S.S.14 km 163.5, Basovizza, 34149 Trieste, Italy
4
SBAI Department, Sapienza University, Via A. Scarpa, 14-00161 Rome, Italy
5
INFN-LNF, Via Enrico Fermi 40, 00044 Frascati (RM), Italy
*
Authors to whom correspondence should be addressed.
Condens. Matter 2020, 5(3), 47; https://doi.org/10.3390/condmat5030047
Submission received: 19 May 2020 / Revised: 6 July 2020 / Accepted: 11 July 2020 / Published: 14 July 2020

Abstract

:
HMQ-TMS (2-(4-hydroxy-3-methoxystyryl)-1-methylquinolinium 2,4,6-trimethylbenzenesulfonate) is a recently discovered anisotropic organic crystal that can be exploited for the production of broadband high-intensity terahertz (THz) radiation through the optical rectification (OR) technique. HMQ-TMS plays a central role in THz technology due to its broad transparency range, large electro-optic coefficient and coherence length, and excellent crystal properties. However, its anisotropic optical properties have not been deeply researched yet. Here, from polarized reflectance and transmittance measurements along the x 1 and x 3 axes of a HMQ-TMS single-crystal, we extract both the refraction index n and the extinction coefficient k between 50 and 35,000 cm 1 . We further measure the THz radiation generated by optical rectification at different infrared (IR) wavelengths and along the two x 1 and x 3 axes. These data highlight the remarkable anisotropic linear and nonlinear optical behavior of HMQ-TMS crystals, expanding the knowledge of its properties and applications from the THz to the UV region.

1. Introduction

THz radiation (1 THz∼33 cm 1 or 4 meV photon energy) has gained over the years a considerable interest due to its broad variety of applications. Starting from fundamental scientific investigations, where THz can be used as a resonant probe for the plethora of excitations in condensed matter physics [1,2,3], its applications reach also to various industrial and biomedical activities [4,5,6,7], security applications [8,9,10], and particle-accelerator physics [11,12]. Following the growing interest, a rapid development of both THz generators and detectors has been made possible thanks to novel technologies that have become available in these last two decades, such as quantum cascade lasers, photoconductive antennas, Gunn lasers, and sources based on nonlinear optical (NLO) effects. The latter realm has been the starting point for the production of single cycle, high-intensity THz signals comparable to those obtained from free-electron facilities [13,14]. The process of difference frequency generation [15,16] or optical rectification (OR) [15,17,18,19,20,21,22] still holds the greatest interest due to its capabilities of reaching electric field magnitudes up to tens of MV/cm providing a broad THz spectral range going from nearly 0.1 THz up to 15 THz [1,23]. Due to these properties, novel NLO materials have been highly investigated in terms of THz transparency and linear and nonlinear optical responses. As already highlighted in literature, the production of THz radiation through OR process is highly dependent on the material properties, like the microscopic optical response functions of the crystal [15,24]. The real and imaginary parts of the refractive index, both in the optical and THz emission regions, give information about the phase matching condition and the absorption effects inside the crystal. Therefore, the knowledge of those optical parameters is of great importance in order to optimize the OR process and the emitted THz spectrum. Moreover, many efforts are also required in order to optimize future growth processes of new THz crystals [25,26].
Among the many materials already discovered, like inorganic NLO crystals such as ZnTe and GaP [27], organic NLO crystals offer the best platform, mainly due to their strong nonlinear optical response arising from the molecules hyperpolarizability and orientation inside the crystal [15]. Organic crystals like DAST, DSTMS, OH1 [28,29,30], 2-(4-hydroxy-3-methoxystyryl)-1-methylquinolinium 2,4,6-trimethylbenzenesulfonate (HMQ-TMS) [31] and BNA [32], are already widely used for THz photonics. Here, HMQ-TMS is an organic molecular crystal built upon HMQ (2-(4-hydroxy-3-methoxystyryl)-1-methylquinolinium) cations and TMS (2,4,6-trimethylbenzenesulfonate) counter anions. HMQ-TMS shows a polar axis oriented along the x 3 direction, as shown in Figure 1. Although the electromagnetic properties of HMQ-TMS have been partially studied [31,33,34], a complete investigation of its anisotropic optical properties is still missing. In recent works, Brunner et al. [33] estimated the crystal optical group index, with light polarized along the polar axis, through retardation of laser pulses [35], covering a range from 600 to 2000 nm. In addition, the absorption coefficient α 3 were also extracted from transmission measurements in the same spectral range and between 0.3 and 1.5 THz through THz time-domain spectroscopy. The same optical parameters have also been estimated for a broader THz spectral range (1.2–12 THz) in Reference [34]. In this paper, we extract from polarized reflectance and transmittance measurements, from THz to ultraviolet (UV), both the real (refraction index n) and the imaginary part (extinction coefficient k) of the complex refractive index n ˜ = n i k , along the x 1 and x 3 (polar) axes of a HMQ-TMS single-crystal. We further measure the THz radiation generated by optical rectification at different infrared (IR) pumping wavelengths and along the two x 1 and x 3 axes. These data highlight the remarkable anisotropic linear and nonlinear optical behavior of HMQ-TMS crystal, as predicted from the crystallographic theory.

2. Experimental Methods

2.1. Linear Response Study

The Reflectance (R) and transmittance (T) at room temperature of a HMQ-TMS single crystal have been measured, from THz to UV (50–35,000 cm 1 ), along the x 3 and x 1 axes. The crystal is characterised by a thickness of 190 μ m (as measured by a micrometer) and lateral dimensions of 4 mm × 2.5 mm . The face of incidence coincides with the crystallographic ac-plane, parallel to the radiation polarization. THz and Mid-Infrared (MIR) regions have been investigated at the SISSI Infrared beamline in Elettra Synchrotron (Trieste) through a Bruker Vertex 70V Michelson interferometer [36,37,38]. The region going from NIR to UV has been studied at the Physics Department of the University of Rome “La Sapienza” through a JASCO V-770 spectrometer. A calibrated gold (aluminium) mirror in the THz/MIR (NIR/UV) has been used as a reference in reflectance experiments. The linear complex refractive index as a function of frequency, n ( ω ) i k ( ω ) (here ω is a wavenumber), has been obtained from T ( ω ) and R ( ω ) data by deriving the exact analytical solution to the inverse problem for a slab under the approximation k 2 n (no absorption at interfaces). The two indices can be expressed as [39]:
n ( R , T , ω ) = 1 + R F ( R , T ) 1 R F ( R , T ) + 4 R F ( R , T ) [ 1 R F ( R , T ) ] 2 1 2 ω d 2 ln 2 R F ( R , T ) T R R F ( R , T ) 1 / 2
k ( R , T , ω ) = 1 2 ω d ln R F ( R , T ) T R R F ( R , T ) ,
where d is the slab thickness and the single interface reflectance R F takes the form
R F = 2 + T 2 ( 1 R ) 2 { [ 2 + T 2 ( 1 R ) 2 ] 2 4 R ( 2 R ) } 1 / 2 2 ( 2 R )
This method, based on both R and T, is independent from any major approximation. It is thus expected to be very precise in the determination of n and k values across the broad spectroscopic range.

2.2. Ir Pumping Scheme

In order to study the THz emission from the HMQ-TMS crystal, an optical apparatus has been developed based on a collinear optical parametric amplifier (OPA) from Light Conversion®, which permits the production of femtosecond pulses at tunable IR wavelengths, going from 1200 nm up to 1600 nm. The system is shown in Figure 2. A femtosecond high-intensity pulse at 780 nm pumps the OPA, while a minor intensity is used for detection of the THz signal through the electro-optic effect in a GaP 0.2 mm thick crystal. The signal emitted from the OPA is then used in order to pump the HMQ-TMS crystal at varying wavelengths. At constant fluence (4 mJ/cm 2 ), the wavelength range spans from 1300 nm to 1600 nm, and four different values have been compared for the THz generation: 1300, 1400, 1500 and 1600 nm, as suggested by previous literature [34].

3. Results

3.1. Linear Optical Parameters

In Figure 3, R ( ω ) and T ( ω ) measurements for the HMQ-TMS crystal are reported between 50 and 35,000 cm 1 . The blue (red) solid-lines concern R data, while blue (red) dashed-lines refer to T data with light polarization along the x 1 and x 3 axes, respectively. From the T measurements, one can notice a broad transparent spectral region extending from the mid-IR to the VIS region (5000–20,000 cm 1 ) for both axes, with a plateau at 83% along x 1 and up to 80% along x 3 , respectively. This sligthly higher absorption is attributed to the major alignment of both HMQ cations and TMS anions along the x 3 axis (see Figure 1) [31]. The first electronic transition is approximately located around 20,000 cm 1 and corresponds to a strong reduction of transmittance along both axes, with a relatively low cut-off wavelength < 580 nm, in accordance with the estimation of Brunner et al. [33]. This electronic transition is related to the HMQ cations, which exhibit (in a methanol solution) an absorption maximum around 439 nm (nearly 22,000 cm 1 ) [31], mapping a smaller modulation of the reflectance (Figure 3) along the x 1 axis. In the inset of Figure 3, a magnified plot of T (R) curves in the THz/MIR region is shown. Here, minima (maxima) correspond to both intra- and intermolecular (phonon) absorptions extending to the MIR region (see Figure 3).
In order to extract the real and imaginary parts of the refraction index from R and T data, the partial transparency of the HMQ-TMS single crystal in the MIR and VIS spectral region (see Figure 3) should be taken into account. Indeed, this transparency does not allow the use of Kramers-Kronig transformations. However, the complementary T and R data allow the derivation of an analytical method (see Equations (1) and (2) which considers Fresnel losses due to multiple reflections at the crystal surfaces [39]. The extracted optical parameters have been double-checked by using the RefFit constrained fitting program for a thin slab [40]. In Figure 4, the real (n) part of refraction index along x 1 (blue curves) and x 3 (red curves) axes are shown. For both axes, n is nearly constant from MIR to red, showing an average value of 1.6 (2.0) for the x 1 ( x 3 ) axis. A strong modulation of n can be observed between 20,000 and 25,000 cm 1 , in correspondence to the electronic insulating gap. In the spectral range (5000–16,000 cm 1 ), and along the x 3 axis, the refractive index behaves accordingly to already published data [33]. Moreover, the inset of the same figure shows n in the THz/MIR spectral region, which behavior is in accordance with previous works [34].

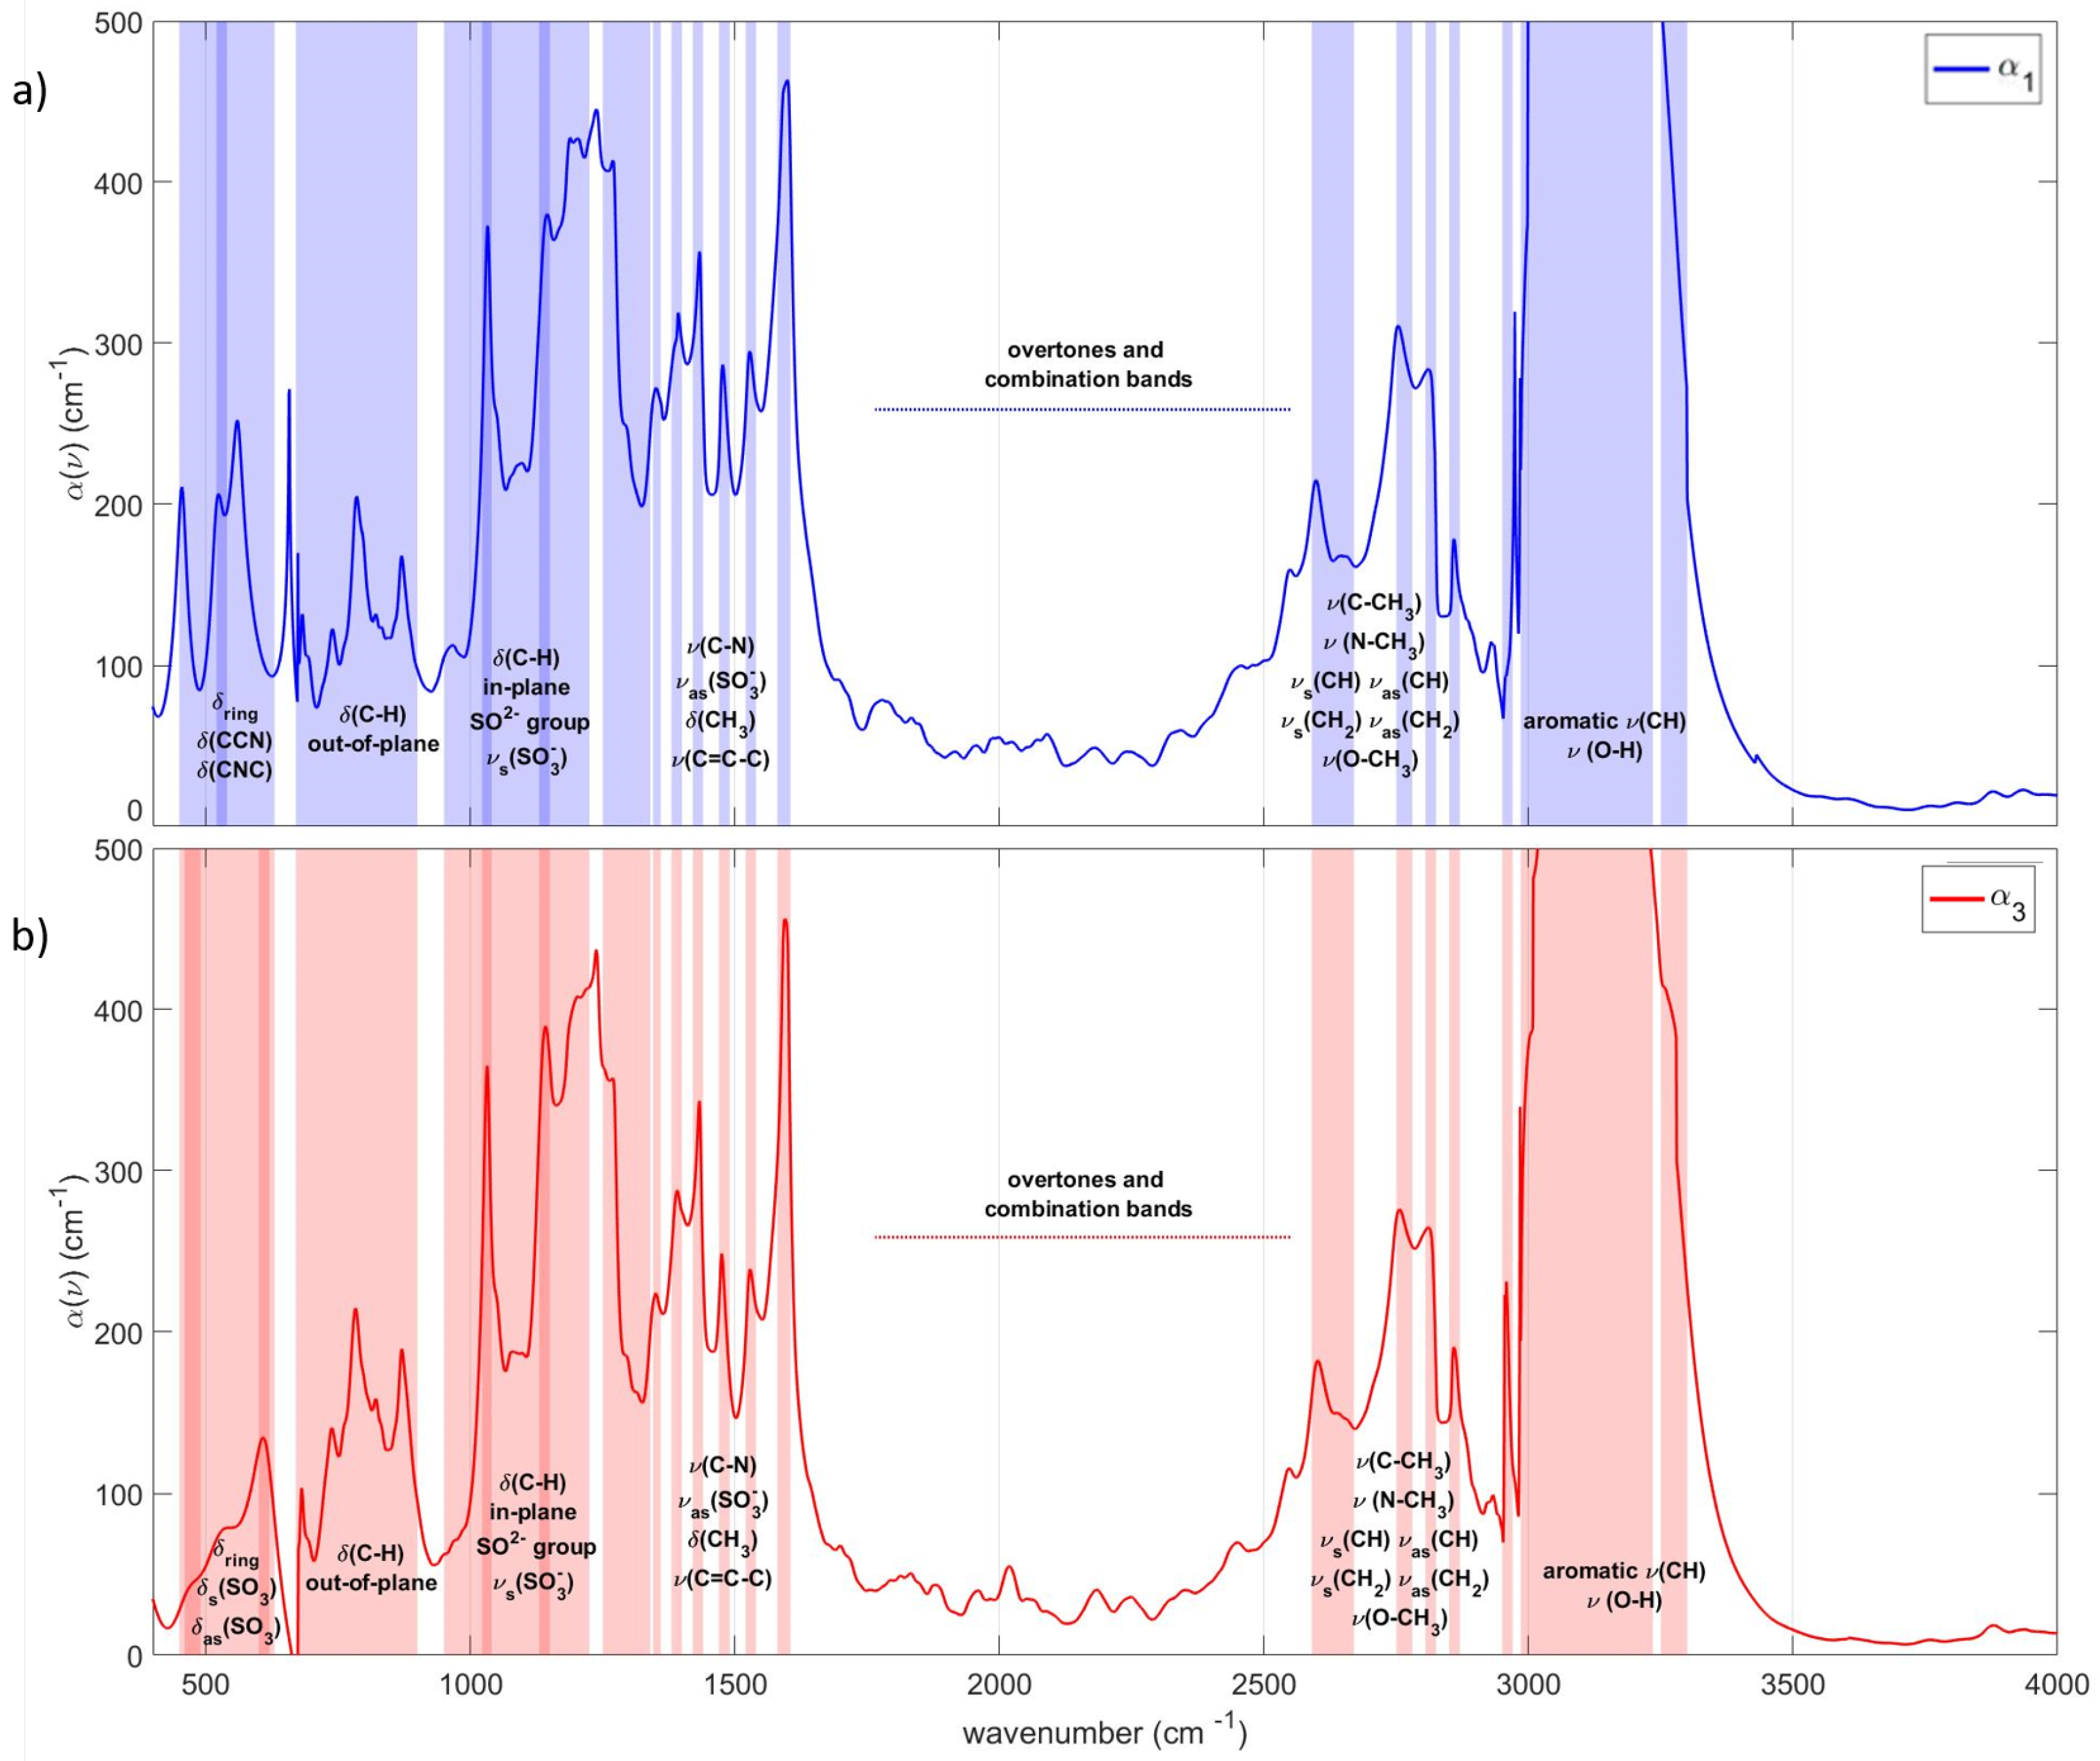
3.2. Spectral Analysis
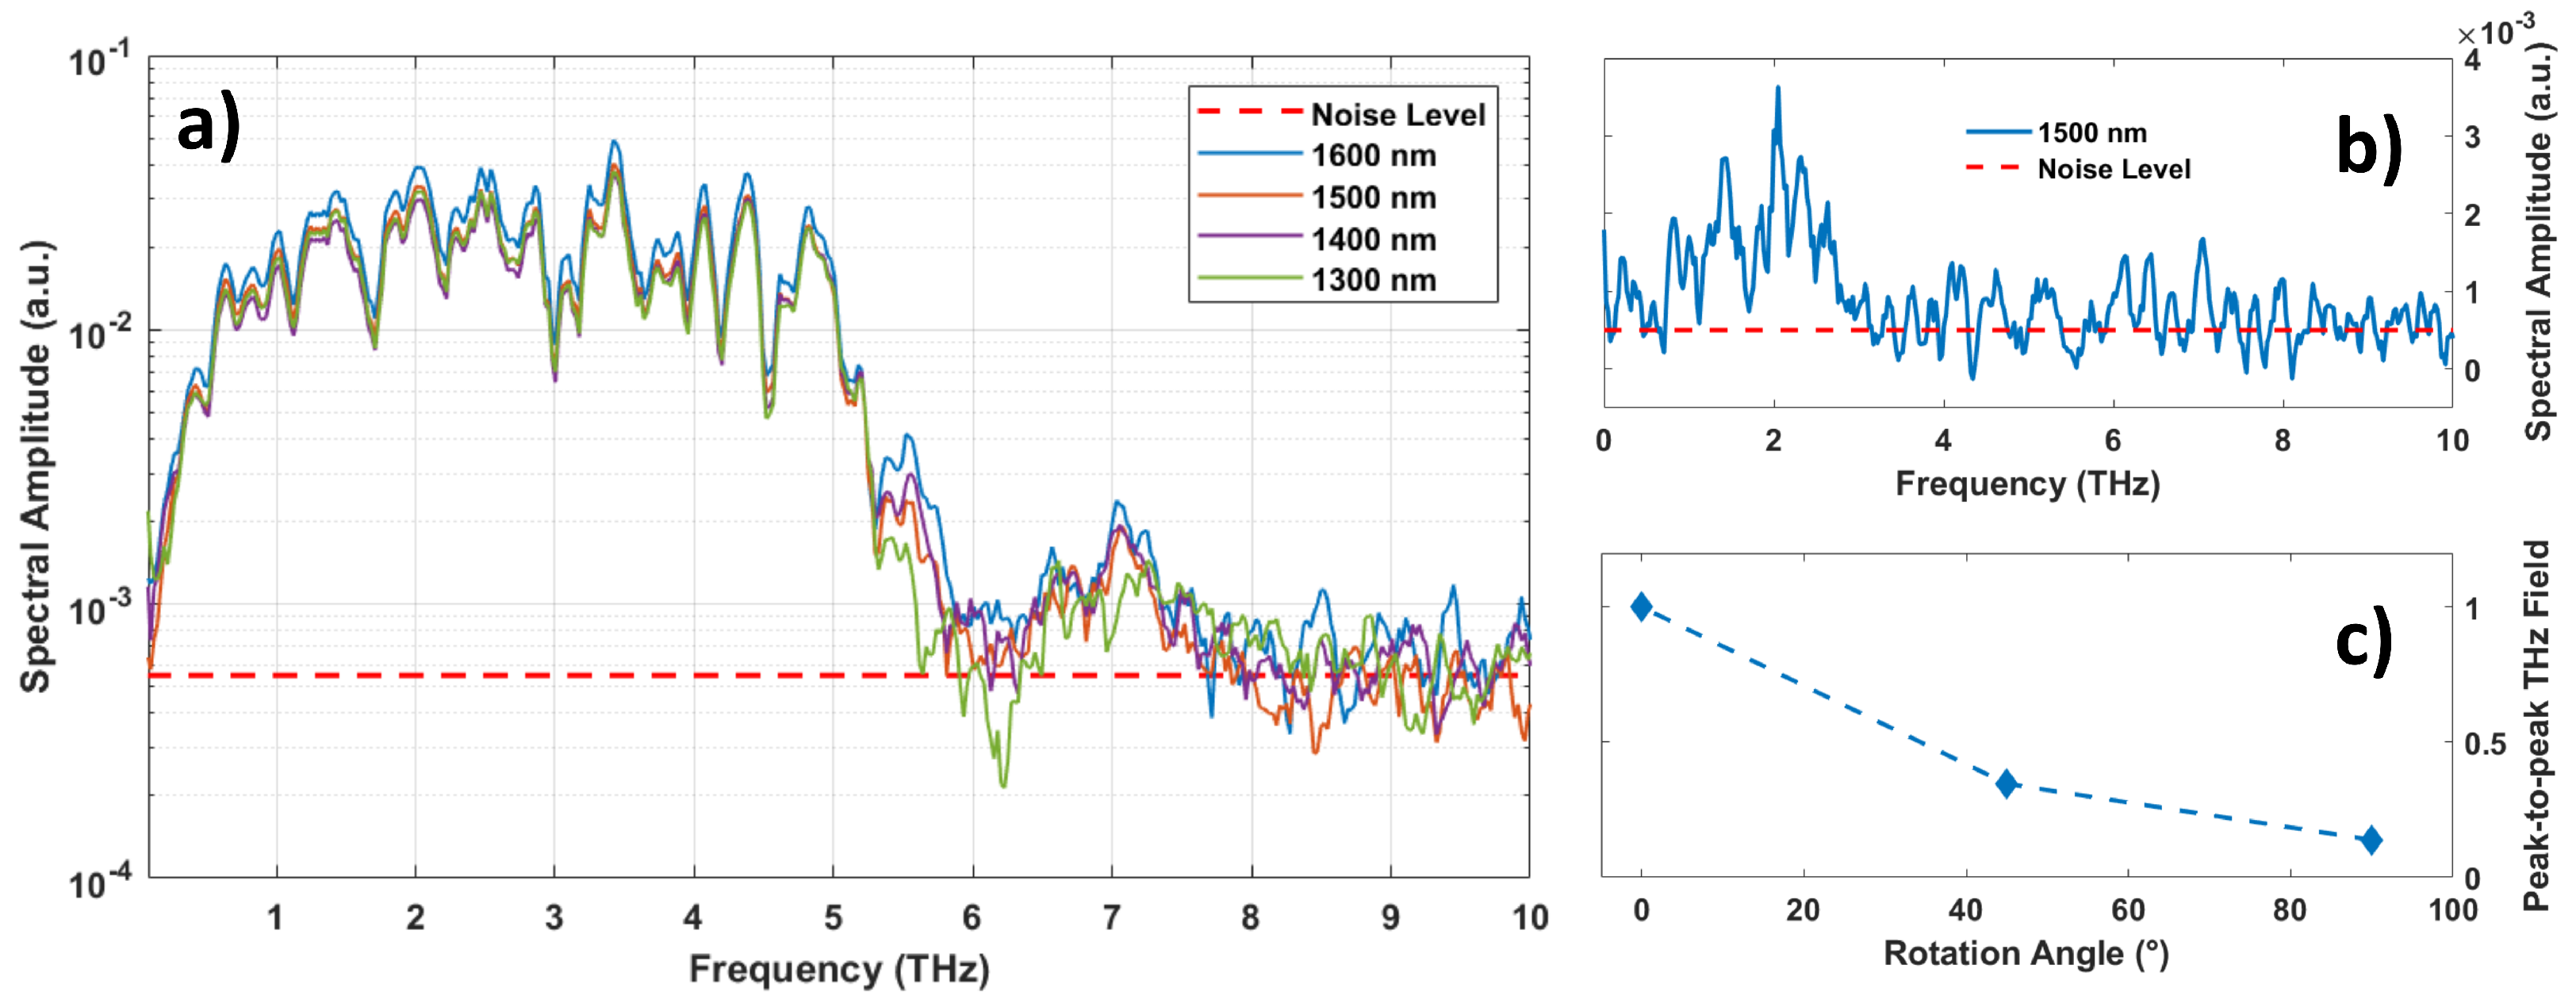
The absorption coefficients, along both x 1 and x 3 axes, are calculated through the extinction coefficient k as α = 4 π ω k ( ω is a wavenumber). They are reported in the spectral range 400–4000 cm 1 , where most of the vibrational excitations of HMQ and TMS chemical groups fall (see Figure 5a,b). Differently to the electronic transitions that show a remarkable anisotropy (see Figure 4), the two vibrational spectra have several peaks in common. A small anisotropy can be observed only below 1000 cm 1 , where ring-structure bending and lattice modes are located, and can be attributed to molecules orientation. In order to assign those peaks, one can observe that aromatic rings in the HMQ-TMS structure (see Figure 1) show several C-H and C=C-C vibrational modes. Specifically, the bending modes of quinolinium ring are present below 650 cm 1 . C-H out-of-plane and in-plane bending vibrations occur in the regions 670–900 cm 1 and 950–1225 cm 1 , respectively [41]. Along axis x 1 , the band at 528 cm 1 is identified with the C-N-C and C-C-N in-plane bending modes. For axis x 3 , in the region 450–600 cm 1 , two shoulders are distinguished at 470 and 609 cm 1 , and assigned to the symmetric and asymmetric bending vibrations of the -SO 3 group [42,43,44]. The peaks at about 1030 cm 1 , 1140 cm 1 and 1350 cm 1 can be assigned to the symmetric and asymmetric SO 3 stretching, respectively [41]. Between 1260–1340 cm 1 , three weak shoulders can be associated to aromatic primary amine C-N stretching. The peaks at 1530 and 1590 cm 1 can be attributed to the vibrations of aromatic rings, while the absorptions around 1390, 1430 and 1480 cm 1 are due to trimethyl CH 3 . The shoulder at 2652 cm 1 is related to the stretching vibration of C-CH 3 , located in the trimethylbenzenesulfonate. The methylamino N-CH 3 vibrational band is located at 2760 cm 1 . Above 2800 cm 1 , the C-H bonds vibrate with the methyl C-H symmetric and asymmetric stretching at 2860 and 2960 cm 1 , respectively, and the methyl ether O-CH 3 and C-H stretching corresponding to the band at 2815 cm 1 .
The narrow peak at 3000 cm 1 and the shoulder around 3010 cm 1 are attributed to C-H bonds around the aromatic rings [41]. The region between 3020–3230 cm 1 , related to aromatic C-H stretching and hydroxyl group vibrations, shows a very strong absorption that is nearly saturated. The small shoulder, located at 3250 cm 1 , can be attributed to O-H vibrational bonds. These general assignments are reported in Figure 5a,b.

3.3. Thz Generation

For completeness, the nonlinear properties in terms of THz generation vs. different pumping wavelengths, along the x 1 and x 3 axes, have also been measured. Referring to the scheme of Figure 2, and varying the timing overlap between the THz pulse and the 780 nm probe in a GaP detection crystal, it is possible to scan the THz electric field magnitude in order to compute the spectral amplitude. The amplitudes along the x 3 axis (coinciding with the maximum generation efficiency) at a fluence of 4 mJ/cm 2 , and at different IR pumping wavelengths (1300, 1400, 1500 and 1600 nm), are shown in Figure 6a. The comparable magnitudes of the field vs. the pumping wavelength suggest a nearly flat THz efficiency of the HMQ-TMs crystal in the whole infrared range.
The anisotropic THz emission properties of HMQ-TMS have been studied by varying the crystal orientation with respect to the linearly polarized pump. In particular, both the incidence OPA polarization and the GaP detection crystal orientation have been kept fixed while the crystal has been rotated. Although we cannot exclude that some THz intensity might come from orientation misalignment and polarization losses, a small THz emission can be observed along x 1 centered around 2 THz (Figure 6b) for a pumping wavelength at 1500 nm (similar data have been obtained at the other wavelengths). More specifically, the THz magnitude vs. the crystal orientation (Figure 6c) progressively decreases when the pumping polarization approaches x 1 .

4. Conclusions

In this paper, we have measured the complex refraction index of a HMQ-TMS single crystal from terahertz to ultraviolet, both along the polar x 3 axis and the orthogonal x 1 axis on the crystallographic ac-plane. In the visible-ultraviolet region, we observe a remarkable anisotropy which is strongly attenuated in the infrared and terahertz range. The precise extraction of both the refractive indices and the absorption coefficients proposes an inverse problem approach for the THz generation study. Therefore, we have also measured the terahertz emission spectra along the same axes when pumping in the infrared through a fs-amplifier laser. As expected from theoretical grounds, the THz emission shows a huge intensity reduction when the pumping polarization is parallel to the x 1 axis. These data expand our knowledge of the HMQ-TMS optical properties across the broad spectral range from THz to UV, allowing a better understanding of its possible applications in THz pump-probe experiments of exotic electronic systems [45,46].

Author Contributions

Conceptualization, A.D., L.T., S.L. and M.P.; methodology, A.D. and L.T.; software, A.D. and L.T.; validation, S.L., A.D. and L.T.; formal analysis, A.D. and L.T.; investigation, V.D., L.T., S.M., P.D.P. and A.P.; resources, S.L. and M.P.; data curation, A.D. and L.T.; writing—original draft preparation, A.D., L.T. and S.L.; writing—review and editing, all authors; visualization, A.D. and L.T.; supervision, M.P. and S.L.; project administration, M.P. and S.L.; funding acquisition, S.L. All authors have read and agreed to the published version of the manuscript.

Funding

Ministero dell’Istruzione, dell’Università e della Ricerca (MIUR) (Rita Levi Montalcini); Italian Ministry of Foreign Affairs and International Cooperation (PGR00806).

Conflicts of Interest

The authors declare no conflicts of interest.

Abbreviations

The following abbreviations are used in this manuscript:
MDPIMultidisciplinary Digital Publishing Institute
DOAJDirectory of open access journals
TLAThree letter acronym
LDlinear dichroism

References

  1. Zhang, X.; Xu, J. Introduction to THz Wave Phoronics; Springer: New York, NY, USA, 2010. [Google Scholar]
  2. Giorgianni, F.; Sakai, J.; Lupi, S. Overcoming the thermal regime for the electric-field driven Mott transition in vanadium sesquioxide. Nat. Commun. 2019, 1, 1159. [Google Scholar] [CrossRef] [PubMed] [Green Version]
  3. Giorgianni, F.; Chiadroni, E.; Rovere, A.; Cestelli-Guidi, M.; Perucchi, A.; Bellaveglia, M.; Castellano, M.; Di Giovanale, D.; Di Pirro, G.; Ferrario, M.; et al. Strong nonlinear terahertz response induced by Dirac surface states in Bi2Se3 topological insulator. Nat. Commun. 2016, 7, 11421. [Google Scholar] [CrossRef] [PubMed]
  4. Hochrein, T. Markets, Availability, Notice, and Technical Performance of Terahertz Systems: Historic Development, Present, and Trends. J. Infrared Millim. Terahertz Waves 2015, 36, 235–254. [Google Scholar] [CrossRef]
  5. Tonouchi, M. Cutting-edge terahertz technology. Nat. Photonics 2007, 1, 97–105. [Google Scholar] [CrossRef]
  6. Pickwell, E.; Wallace, V.P. Biomedical applications of terahertz technology. J. Phys. D Appl. Phys. 2006, 39, R301–R310. [Google Scholar] [CrossRef]
  7. D’Arco, A.; Di Fabrizio, M.; Dolci, V.; Petrarca, M.; Lupi, S. THz Pulsed Imaging in Biomedical Applications. Condens. Matter 2020, 5, 25. [Google Scholar] [CrossRef] [Green Version]
  8. Federici, J.F.; Schulkin, B.; Huang, F.; Gary, D.; Barat, R.; Oliveira, F.; Zimdars, D. THz imaging and sensing for security applications—Explosives. weapons and drugs. Semicond. Sci. Technol. 2005, 20, S266–S280. [Google Scholar] [CrossRef]
  9. Ergün, S.; Sönmez, S. Terahertz Technology for Military Applications. J. Manag. Inf. Sci. 2015, 3, 13–16. [Google Scholar] [CrossRef]
  10. Leahy-Hoppa, M.R.; Fitch, M.J.; Osiander, R. Terahertz spectroscopy techniques for explosives detection. Anal. Bioanal. Chem. 2009, 395, 247–257. [Google Scholar] [CrossRef] [PubMed]
  11. Curcio, A.; Marocchino, A.; Dolci, V.; Lupi, S.; Petrarca, M. Resonant plasma excitation by single-cycle THz pulses. Sci. Rep. 2018, 8, 1052. [Google Scholar] [CrossRef] [PubMed] [Green Version]
  12. Nanni, E.A.; Huang, K.-H.; Ravi, K.; Fallahi, A.; Moriena, G.; Miller, R.J.D.; Kartner, F.X. Terahertz-driven linear electron acceleration. Nat. Commun. 2015, 6, 8486. [Google Scholar] [CrossRef] [PubMed]
  13. Chiadroni, E.; Bacci, A.; Bellaveglia, M.; Boscolo, M.; Castellano, M.; Cultrera, L.; Di Pirro, G.; Ferrario, M.; Ficcadenti, L.; Filippetto, D.; et al. The SPARC linear accelerator based terahertz source. Appl. Phys. Lett. 2013, 102, 094101. [Google Scholar] [CrossRef] [Green Version]
  14. Perucchi, A.; Mitri, S.D.; Penco, G.; Allaria, E.; Lupi, S. The TeraFERMI terahertz source at the seeded FERMI free-electron-laser facility. Rev. Sci. Instrum. 2013, 84, 022702. [Google Scholar] [CrossRef] [PubMed]
  15. Jazbinsek, M.; Puc, U.; Abina, A.; Zidansek, A. Organic Crystals for THz Photonics. Appl. Sci. 2019, 9, 882. [Google Scholar] [CrossRef] [Green Version]
  16. Sutherland, R.L. Handbook of Nonlinear Optics; Dekker: New York, NY, USA, 2003. [Google Scholar]
  17. Zhang, X.C.; Ma, X.F.; Jin, Y.; Lu, T.M.; Boden, E.P.; Phelp, P.D.; Stewart, K.R.; Yakymyshyn, C.P. Terahertz optical rectification from a nonlinear organic crystal. Appl. Phys. Lett. 1992, 61, 3080–3082. [Google Scholar] [CrossRef]
  18. Winnewisser, C.; Jepsen, P.; Schall, M.; Schyja, V.; Helm, H. Electro-optic detection of THz radiation in LiTaO3, LiNbO3 and ZnTe. Appl. Phys. Lett. 1997, 70, 3069–3071. [Google Scholar] [CrossRef]
  19. Vicario, C.; Jazbinsek, M.; Ovchinnikov, A.V.; Chefonov, O.V.; Ashitkov, S.I.; Agranat, M.B.; Hauri, C.P. High efficiency THz generation in DSTMS, DAST and OH1 pumped by Cr:forsterite laser. Opt. Express 2015, 23, 4573–4580. [Google Scholar] [CrossRef] [Green Version]
  20. Dolci, V.; Cascioli, V.; Curcio, A.; Ficcadenti, L.; Lupi, S.; Petrarca, M. Intensity and phase retrieval of IR laser pulse by THz-based measurement and THz waveform modulation. Nucl. Instrum. Methods Phys. Res. A 2018, 909, 204–207. [Google Scholar] [CrossRef]
  21. Curcio, A.; Dolci, V.; Lupi, S.; Petrarca, M. Terahertz-based retrieval of the spectral phase and amplitude of ultrashort laser pulses. Opt. Lett. 2018, 43, 2783–2786. [Google Scholar] [CrossRef] [Green Version]
  22. Curcio, A.; Petrarca, M. Diagnosing plasmas with wideband terahertz pulses. Opt. Lett. 2019, 44, 1011–1014. [Google Scholar] [CrossRef]
  23. Kono, S.; Tani, M.; Sakai, K. Ultrabroadband photoconductive detection: Comparison with free-space electro-optic sampling. Appl. Phys. Lett. 2001, 79, 898–900. [Google Scholar] [CrossRef]
  24. Hebling, J.; Yeh, K.-L.; Hoffmann, M.C.; Bartal, B.; Nelson, K.A. Generation of high-power terahertz pulses by tilted-pulse-front excitation and their application possibilities. J. Opt. Soc. Am. B 2008, 25, B6–B19. [Google Scholar] [CrossRef]
  25. Yang, Z.; Mutter, L.; Stillhart, M.; Aravazhi, S.; Jazbinšek, M.; Schneider, A.; Gramlich, V.; Günter, P. Large-Size Bulk and Thin-Film Stilbazolium-Salt Single Crystals for Nonlinear Optics and THz Generation. Adv. Funct. Water 2007, 17, 2018–2023. [Google Scholar] [CrossRef]
  26. Ogawa, J.; Okada, S.; Glavcheva, Z.; Nakanishi, H. Preparation, properties and structures of 1-methyl-4-2-[4-(dimethylamino)phenyl]ethenylpyridinium crystals with various counter anions. J. Cryst. Growth 2008, 310, 836–842. [Google Scholar] [CrossRef]
  27. Tomasino, A.; Parisi, A.; Stivala, S.; Livreri, P.; Cino, A.C.; Busacca, A.C.; Peccianti, M.; Morandotti, R. Wideband THz Time Domain Spectroscopy based on Optical Rectification and Electro-Optic Sampling. Sci. Rep. 2013, 3, 3116. [Google Scholar] [CrossRef] [Green Version]
  28. Cunningham, P.D.; Hayden, L.M. Optical properties of DAST in the THz range. Opt. Express 2010, 18, 23620–23625. [Google Scholar] [CrossRef]
  29. Vicario, C.; Ovchinnikov, A.V.; Ashitokov, S.I.; Agranat, M.B.; Fortov, V.E.; Hauri, C.P. Generation of 0.9-mJ THz pulses in DSTMS pumped by a Cr:Mg2SiO4 laser. Opt. Lett. 2014, 39, 6632–6635. [Google Scholar] [CrossRef]
  30. Brunner, F.D.J.; Kwon, O.P.; Kwon, S.-J.; Jazbinšek, M.; Schneider, A.; Günter, P. A hydrogen-bonded organic nonlinear optical crystal for high-efficiency terahertz generation and detection. Opt. Express 2008, 16, 16496–16508. [Google Scholar] [CrossRef]
  31. Jeong, J.H.; Kang, B.J.; Kim, J.S.; Jazbinšek, M.; Lee, S.H.; Lee, S.C.; Baek, I.H.; Yun, H.; Kim, J.; Lee, Y.S.; et al. High-power Broadband Organic THz Generator. Sci. Rep. 2013, 3, 3200–3207. [Google Scholar] [CrossRef] [Green Version]
  32. Hashimoto, H.; Okada, Y.; Fujimura, H.; Moioka, M.; Sugihara, O.; Okamoto, N.; Matsushima, R. Second-Harmonic Generation from Single Crystals of N-Substituted 4-Nitroanilines. Jpn. J. Appl. Phys. 1997, 36, 6754–6760. [Google Scholar] [CrossRef]
  33. Brunner, F.D.J.; Lee, S.-H.; Kwon, O.-P.; Feurer, T. THz generation by optical rectification of near-infrared laser pulses in the organic nonlinear optical crystal HMQ-TMS. Opt. Mater. Express 2014, 4, 1586–1592. [Google Scholar] [CrossRef]
  34. Vicario, C.; Monoszlai, B.; Jazbinsek, M.; Lee, S.-H.; Kwon, O.-P.; Hauri, C.P. Intense, carrier frequency and bandwidth tunable quasi single-cycle pulses from an organic emitter covering the Terahertz frequency gap. Sci. Rep. 2005, 5, 14394. [Google Scholar] [CrossRef] [PubMed]
  35. Schneider, A.; Brunner, F.D.J.; Gunter, P. Determination of the refractive index over a wide wavelength range through time-delay measurements of femtosecond pulses. Opt. Commun. 2007, 275, 354–458. [Google Scholar] [CrossRef]
  36. Lupi, S.; Nucara, A.; Perucchi, A.; Calvani, P.; Ortolani, M.; Quaroni, L.; Kiskinova, M. Performance of SISSI, the infrared beamline of the ELETTRA storage ring. J. Opt. Soc. Am. B 2007, 24, 959–964. [Google Scholar] [CrossRef]
  37. Karantzoulis, E.; Penco, G.; Perucchi, A.; Lupi, S. Characterization of coherent THz radiation bursting regime at Elettra. Infrared Phys. Techn. 2010, 53, 300–303. [Google Scholar] [CrossRef]
  38. Roy, P.; Brubach, J.B.; Calvani, P.; de Marzi, G.; Filabozzi, A.; Gerschel, A.; Giura, P.; Lupi, S.; Marcouillé, O.; Mermet, A.; et al. Infrared synchrotron radiation: From the production to the spectroscopic and microscopic applications. Nucl. Instrum. Methods Phys. Res. Sect. A Accel. Spectrom. Detect. Assoc. Equip. 2001, 467 Pt 1, 426–436. [Google Scholar] [CrossRef]
  39. Nichelatti, E. Complex refractive index of a slab from reflectance and transmittance: Analytical solution. J. Opt. A Pure Appl. Opt. 2002, 4, 300–403. [Google Scholar] [CrossRef]
  40. Kuzmenko, A.B. Kramers–Kronig constrained variational analysis of optical spectra. Rev. Sci Instrum. 2005, 76, 083108. [Google Scholar] [CrossRef] [Green Version]
  41. Coates, J. Interpretation of Infrared Spectra, A Practical Approach. In Encyclopedia of Analytical Chemistry; Meyers, R.A., Ed.; John Wiley & Sons Ltd.: Chichester, UK, 2000; pp. 10815–10837. [Google Scholar]
  42. Buzykin, O.G.; Ivanov, S.V.; Ionin, A.A.; Kotkov, A.A.; Kozlov, A.Y. Spectroscopic detection of sulfur oxides in the aircraft wake. J. Russ. Laser Res. 2005, 26, 402–426. [Google Scholar] [CrossRef]
  43. Shishlov, N.M.; Khursan, S.L. Effect of ion interactions on the IR spectrum of benzenesulfonate ion. Restoration of sulfonate ion symmetry in sodium benzenesulfonate dimer. J. Mol. Struct. 2016, 1123, 360–366. [Google Scholar] [CrossRef]
  44. Özel, A.E.; Büyükmurat, Y.; Akyüz, S. Infrared-spectra and normal-coordinate analysis of quinoline and quinoline complexes. J. Mol. Struct. 2001, 565–566, 455–462. [Google Scholar] [CrossRef]
  45. Lupi, S.; Ortolani, M.; Calvani, P. Optical conductivity of single crystals of Na0.57CoO2. Phys. Rev. B 2004, 69, 180506. [Google Scholar] [CrossRef] [Green Version]
  46. Phuoc, V.T.; Vaju, C.; Corraze, B.; Sopracase, R.; Perucchi, A.; Marini, C.; Postorino, P.; Chiligui, M.; Lupi, S.; Janod, E.; et al. Optical Conductivity Measurements of GaTa4Se8 Under High Pressure: Evidence of a Bandwidth-Controlled Insulator-to-Metal Mott Transition. Phys. Rev. Lett. 2013, 110, 037401. [Google Scholar] [CrossRef] [PubMed]
Figure 1. (a) Chemical structure of HMQ-TMS system. (b) Orientation inside the 2-(4-hydroxy-3-methoxystyryl)-1-methylquinolinium 2,4,6-trimethylbenzenesulfonate (HMQ-TMS) crystal of the HMQ and TMS molecular groups projected on the crystallographic b-axis. A massive hyperpolarizability is associated to the HMQ chromophores, which are aligned along the polar axis x 3 in such a way to define the maximum possible value of the order parameter cos 3 θ [15].
Condensedmatter 05 00047 g001
Figure 2. Infrared (IR) pumping scheme for THz generation in a HMQ-TMS crystal. An initial 40 fs pulse at 780 nm, generated from a Ti:Sapphire laser (COHERENT® Legend Elite), is injected into the optical parametric amplifier (OPA) for the generation of IR femtosecond and high-fluence pulses. The residual pump is sent to the electro-optical detection system after passing through a delay stage and a series of optical elements. A GaP crystal is used for the detection.
Condensedmatter 05 00047 g002
Figure 3. Polarized T and R data of HMQ-TMS single crystal at room temperature along the x 1 and x 3 axis, in the 50–35,000 cm 1 spectral region. T (R) data with light polarization along x 1 and x 3 are represented by dashed (solid) blue and red lines, respectively. In the inset, R and T data are plotted in the THz/MIR region.
Condensedmatter 05 00047 g003
Figure 4. Real part of refraction index (n) of the HMQ-TMS crystal at room temperature. Solid-blue (red) line corresponds to the value along the x 1 ( x 3 ) axis. In the inset, n is plotted in the THz/MIR spectral range. The strong variation of n around 20,000 cm 1 is generated by an electronic transition of the HMQ cations.
Condensedmatter 05 00047 g004
Figure 5. Absorption coefficients of HMQ-TMS crystal at room temperature in the vibrational spectral region 400–4000 cm 1 along the polar x 3 (a) and x 1 (b) axes. The shaded area pictorially assigns the absorption peaks (or vibrational regions) to specific vibrational modes of HMQ and TMS chemical groups. (The labels are: δ bending vibration, ν stretching vibration, a s asymmetric, s symmetric, r i n g quinolinium ring).
Condensedmatter 05 00047 g005
Figure 6. (a) Spectral amplitude of the THz field generated by a HMQ-TMS single crystal pumped by a fs optical pulse at different IR wavelengths (1300, 1400, 1500 and 1600 nm). A broad frequency THz generation is visible from 0.5 up to 6 THz, with a further contribution around 7 THz. Minima in the spectra are mainly due to the water vapour absorption. (b) Spectral amplitude of the THz field generated along the x 1 axis. The intensity and spectral bandwidth are strongly reduced in comparison to the x 3 axis. Red-dashed lines in (a) and (b) represent the noise level in our experiment. (c) Peak-to-peak THz field magnitude v s the angle between the x 3 axis and the pumping polarization. The THz field value strongly decreases for an increasing angle, indicating a strong reduction of the THz emission efficiency for a pump polarization along the x 1 axis.
Condensedmatter 05 00047 g006

