

Real-Time Network Video Data Streaming in Digital Medicine

1
BioTech Research Center, Óbuda University, 1034 Budapest, Hungary
2
Image Analysis Department, 3DHISTECH Ltd.,1141 Budapest, Hungary
3
Medical Device Research Group, LPDS, Institute for Computer Science and Control Hungarian Academy of Sciences (SZTAKI), 1111 Budapest, Hungary
4
John von Neumann Faculty of Informatics, Óbuda University, 1034 Budapest, Hungary
*
Authors to whom correspondence should be addressed.
Computers 2023, 12(11), 234; https://doi.org/10.3390/computers12110234
Submission received: 2 October 2023
/
Revised: 29 October 2023
/
Accepted: 8 November 2023
/
Published: 14 November 2023
(This article belongs to the Special Issue Advances in High-Performance Switching and Routing)
Abstract
:Today, the use of digital medicine is becoming more and more common in medicine. With the use of digital medicine, health data can be shared, processed, and visualized using computer algorithms. One of the problems currently facing digital medicine is the rapid transmission of large amounts of data and their appropriate visualization, even in 3D. Advances in technology offer the possibility to use new image processing, networking, and visualization solutions for the evaluation of medical samples. Because of the resolution of the samples, it is not uncommon that it takes a long time for them to be analyzed, processed, and shared. This is no different for 3D visualization. In order to be able to display digitalized medical samples in 3D at high resolution, a computer with computing power that is not necessarily available to doctors and researchers is needed. COVID-19 has shown that everyday work must continue even when there is a physical distance between the participants. Real-time network streaming can provide a solution to this, by creating a 3D environment that can be shared between doctors/researchers in which the sample being examined can be visualized. In order for this 3D environment to be available to everyone, it must also be usable on devices that do not have high computing capacity. Our goal was to design a general-purpose solution that would allow users to visualize large amounts of medical imaging data in 3D, regardless of the computational capacity of the device they are using. With the solution presented in this paper, our goal was to create a 3D environment for physicians and researchers to collaboratively evaluate 3D medical samples in an interdisciplinary way.
1. Introduction
1.1. Data Streaming in Digital Medicine
Nowadays, the use of different imaging modalities in digital medicine and the display of the resulting data in 2D is part of medicine. In contrast, the spread of 3D visualization in routine medicine is still to come. One of the barriers to the uptake of 3D visualization is the large computational capacity required by the hardware that has to perform the computations associated with visualization. Unfortunately, not all researchers/physicians have the hardware to display, for example, pathology serial sections at an acceptable resolution in a 3D environment. Real-time network transmission can be a solution to this problem.
With this technology, it is possible to enable less powerful hardware to provide 3D visualization to the user. With real-time network streaming, most of the computations to be performed can be moved to a dedicated server. Once the calculations have been performed, this server transmits the necessary data to the clients.
Another not insignificant advantage of low-latency network transmission is that it can be used to create multi-user software that is used in a real-time environment. Real-time means that if there are data available on the server that can be displayed, they are sent to the user with the minimum possible delay. If the delay is low enough, we can make sure that the user does not experience any lag while using the software. The application of streaming technology involves the analysis of network parameters, such as the following:
- Throughput: The amount of data moved successfully from one place to another in a given period of time. Network throughput is generally measured in megabits per second or gigabits per second.
- Delay: It means the latency with which a bit is forwarded from one network endpoint to another. Usually measured in milliseconds.
- Packet Loss: Number of network packets that have not been successfully transmitted within a given period of time.
- Packet Delay Variation: The difference in end-to-end one-way delay between selected network packets in a flow. At packet delay variation, any lost packets are ignored.
In order to implement the functionalities that will ensure the sustainable operation of our system, we need to introduce a number of definitions:
- Client-side buffer: A client-side buffer is a data storage structure implemented on the connected client side of a networked system.
- Ring buffer: Also known as circular buffer or cyclic buffer. A data structure used in computing for fixed-size storage. The name refers to the fact that its operation is as if the first and last elements are linked together. It is often used to store and manage data streams. An illustration of a ring buffer can be seen in Figure 1.
- Buffering rules: The set of rules associated with a given state of the buffer.
1.2. Network Data Streaming in Different Areas of Digital Medicine
Video transmission in certain medical fields requires high-resolution data, which are large in size. One such field is digital pathology. In order to transmit these large data, different data compression algorithms have to be applied. It is also important that image streaming is a delay-sensitive operation, as the physician/researcher needs to receive the image data as soon as possible [1,2].
The recent COVID-19 pandemic has shown how important it is to use technology in everyday life to continue healing without physical contact. Nowadays, the transmission of video data is becoming increasingly common in certain areas of digital medicine. Such areas include the following:
Nowadays, the use of video streaming in medicine is becoming more and more widespread, especially in the field of telemedicine. An example of such a solution can be seen in the publication of H. Han and J. Lv [3]. In their article, they describe a solution that can provide the doctor with video data at high resolution (720 p or 1080 p), which can be used to make a more accurate diagnosis than using a lower-resolution video stream (360 p or 480 p). In their work, the authors present a solution that can increase the user’s QoE (Quality of Experience) by up to 79%. As a result, a more accurate diagnosis can be achieved.
In digital pathology, real-time data transmission is particularly difficult, as the resolution of samples is much higher than in other medical fields. Real-time image data transmission can be used in many areas of digital pathology. Examples include medical education [6] or the evaluation of samples. One possible implementation of the real-time transmission and display of digitized pathological samples is Web-based displays. With the help of these programs, users are able to examine the same tissue sample several times, from all over the word [8].
Personal doctor-to-doctor consultation, or teleconsultation, is part of everyday medicine. Low-latency image transmission even allows the user to join an active surgery as an observer. In their research [7], the authors were able to implement a system that can provide a real-time video stream of the current surgery on the client side on a device with a screen size of 320 × 240.
The dangers inherent in the use of network streaming should be mentioned. When transmitting data, an attacker could modify certain values in the transmitted data, leading to false diagnoses or illegal access to data. Solutions such as authentication or data encryption should be used to eliminate these potential risks [9,10,11]. This research area is addressed by the authors in their article [9], in which they present a solution they have developed to enable the transmission of digitized pathology samples over the network with a lower risk factor.
1.3. Real-Time Data Streaming Protocols
Currently, there are several real-time data transmission protocols on the market, which have different advantages and disadvantages [12]. Data transfer protocols are useful because they allow us to transfer large amounts of data over a network. This means that these protocols allow doctors/researchers in medicine to share large amounts of data with each other and to transfer data between different medical systems.
Examples of currently widely used real-time network streaming protocols include the following:
- RTMP (Real-Time Messaging Protocol): RTMP is a technology that enables real-time video transmission over the Internet. RTMP uses TCP (Transmission Control Protocol) to implement the data transmission. One of the major advantages of the RTMP protocol is that it can provide a real-time video stream that can operate with low latency compared to other protocols. This feature is particularly important when real-time data transmission is the goal. There are three basic parts to using the RTMP protocol. These are handshake, connection, and stream. The handshake section is a series of fast data exchanges between the server and the connected client. The client first sends a header and then a random packet of 1536 bytes. Then the server also sends the header to the client, and similarly sends a 1536-byte random packet. Then both the server and the client send back the random packet received from the other, and thus the handshake has taken place. After the handshake, basic data such as bandwidth or frame size are set between client and server. To set these up, AMF (Action Message Format) is used. AMF is a compact binary format to serialize object graphs. Once the communication channel and the connection are established, the stream is sent [13,14]. With the use of RTMP, we can achieve a lower-latency video stream than with the use of HLS. However, there are disadvantages to using RTMP, such as the lack of HTTP compatibility.
- HLS (HTTP Live Stream): HLS is an HTTP-based protocol with variable bit rate, developed by Apple Inc. The cornerstone of HLS is that data are available to the user at multiple bitrates. This allows the user to choose the one that suits him best based on the quality of the Internet. Thanks to adaptive bitrates, the client is able to play the stream from the server even if the Internet quality is not stable. HLS, in its operation, splits the stream into HTTP-based file downloads. Each such download contains only part of the original stream. These small streams are sent to the user at different bitrates, using a so-called M3U list [15,16]. Based on our research, the main advantage of HLS is the adaptive bitrate; on the other hand, this protocol has some drawbacks regarding latency.
- RTSP (Real-Time Streaming Protocol): RTSP is a protocol that works at the application layer. This protocol provides the possibility for real-time data transfer to a client by communicating directly with the server. The RTSP protocol is basically not responsible for streaming, but for the communication between the server and the client. The protocol creates and monitors the real-time video stream between the client and the server. When a new client tries to connect to the server, a similar process takes place as with the RTMP protocol. The client first sends an RTSP request to the server in order to find out what commands are available. Once the client receives a response, it sends a media description request to the server. The client then sends a setup request to the server, and in response, the server sends back the data transfer information. When these steps are complete, the client sends a request to the server to start the stream. In response, the server starts serving the video stream to the client. Since RTSP is basically responsible for communication rather than streaming, its operation consists of receiving and sending requests. For example, when the user wants to stop the stream, this request is transmitted via the RTSP protocol to the server, where the corresponding functionality is executed [17,18]. One of the advantages of RTSP is that it can provide customizable streaming, but the disadvantage is that it is not as widely supported as RTMP or HLS.
In our research, we used UDP (User Datagram Protocol) in order to implement our real-time image data transmission solution. Since, in our implementation, we send a lot of data quickly, and displaying data which was sent sooner than the currently visualized image is not practical, as it would be visible to the user in the form of lag, TCP was not a suitable choice for us. Nevertheless, the connection setup and post-connection part of our implemented system are similar to those provided by RTSP. Our client sends various requests to the server in UDP packets, and the server then executes the corresponding functionalities.
1.4. Image Storage File Formats
Today, there are many file formats that can efficiently transmit video data over the network at high compression rates [18,19,20,21]. The most commonly used of these are the following:
- PNG (Portable Network Graphic): PNG was developed to be an open-source solution to GIF (Graphics Interchange Format). The PNG file format is an ideal choice for development if you want to use lossless compression. PNG-based image compression can be broken down into three steps; these are filtering, LZ77 compression, and Huffman encoding. It is important to note that filtering is necessary to make compression more efficient. In the case of PNG, filtering is not pixel-based, but byte-based. Once the filtering is finished, the method uses LZ77 compression. This solution is a sliding window algorithm that continuously tracks the previous bytes. With the compression algorithm, the larger the sliding window, the more efficient the compression. After LZ77, the final step is to apply Huffman encoding. By using Huffman encoding, the result of LZ77 encoding can be stored in fewer bytes, which further improves the compression ratio [22,23].
- JPEG: JPEG compression is a lossy method that allows the user to set the size of the quantization table, which affects the quality of the resulting image and the compression ratio. JPEG compression includes several steps. These are changing the color space to YCbCr, breaking the image into groups, and performing DCT (Discrete Cosine Transformations) compression, which compresses data with the use of discrete DCT blocks. After that, quantization and then Huffman encoding [22,24] are performed.
- JPEG 2000: The JPEG 2000 file format was designed to create a uniform system that works well for images with different characteristics. Its main components are the DCT algorithm, a trellis-coded quantization, and binary arithmetic bitplane coding. The JPEG 2000 compression solution has a number of advantages over the original JPEG, such as rate-distortion. Perhaps more importantly, JPEG 2000 allows us to extract different pixel fidelities, resolutions, regions of interest, and components from a single compressed bitstream. This feature of JPEG 2000 allows an application to modify and send only the important part of the JPEG 2000-compressed source image to the target device [21,25,26].
In our solution, we used image compression on the server side in order to optimize network utilization. Each frame that is transmitted to the clients is stored and transmitted by the server using the PNG file format.
1.5. Previous Research Results
We have published the early results of our research in the form of conference papers in the past [27,28]. In these works, we presented the initial structure of a streaming-based solution that could be used to transmit 3D data in digital medicine [28]. In addition, the first versions of functionalities such as adaptive resolution change or buffering rules were presented in the paper [27]. In comparison to the previously published results, we continued the research and the implementation of the practical results at all points. The paper contains the newest outcome of our work. We achieved new results in the mathematical description of the relationships discovered during our research, as well as in their validation. In addition, we carried out new measurements during our research that show the resource utilization of the server in the case of 3D streaming when several users are connected. These tests may reveal the physical limitations of our current solution.
1.6. Problem Definition and Motivation
Today, the analysis of digitized medical samples is part of everyday medical data processing. This is no different in digital pathology. Compared to other medical fields, digital pathology has a much higher resolution of image data, requiring powerful hardware to display the data at a proper resolution. In our research, we aimed to reduce the hardware computing capacity required from the user by using a network streaming technique and a client–server architecture.
The use of the streaming technique is complicated by a number of factors, for example, applying the right buffering rules or ensuring the right streaming resolution for the current network parameters. The proper application of streaming techniques also implies the problem of being able to define the so-called Quality of Service (QoS) indicator. With QoS, we can ensure the operation of our system during variable network conditions. This was important for our research because it allows our system to work in real-world network conditions. With this indicator, we can, among other things, define initial settings such as the sending resolution or the sending speed. In our research, we set out to create equations to ensure the smooth operation of our streaming solution under changing network conditions. To do this, we had to solve problems such as buffering the incoming data at the client side, determining the QoS, and ensuring the right sending resolution based on the determined QoS value.
In the introduction, we reviewed the technologies that proved to be particularly important during our research during practical implementation. In the next paragraph, the tools used in our research are presented.
2. Materials and Methods
In the course of establishing the visualization and related correlations, we used anonymized pathological serial sections. In order to determine the real-life size of a given area on the sample, we need information on the real-life size of the pixels in the sample. For the first sample, this metric was 250.0 μm, which means that in real life, one pixel is 250.0 μm wide and 250.0 μm high. The total resolution of every sample in the first serial section was 35,584 × 35,580 pixels. In the second serial section, each sample of the serial section had a pixel size of 250.0 μm per pixel and the total resolution of the samples was 36,352 × 53,248 pixels. The pathological samples used in our research were digitized using a p1000 hardware device from 3DHISTECH. The p1000 device was specifically designed for routine histopathology, capable of digitizing up to two pathology samples per second. To ensure that the pathological samples were properly transformed together, we used the 2.0 version of SlideMatch software. This software is able to transform together the samples inside a serial section with micrometer accuracy, thus creating the possibility of 3D visualization.
3. Results
3.1. The Structure of Our Solution
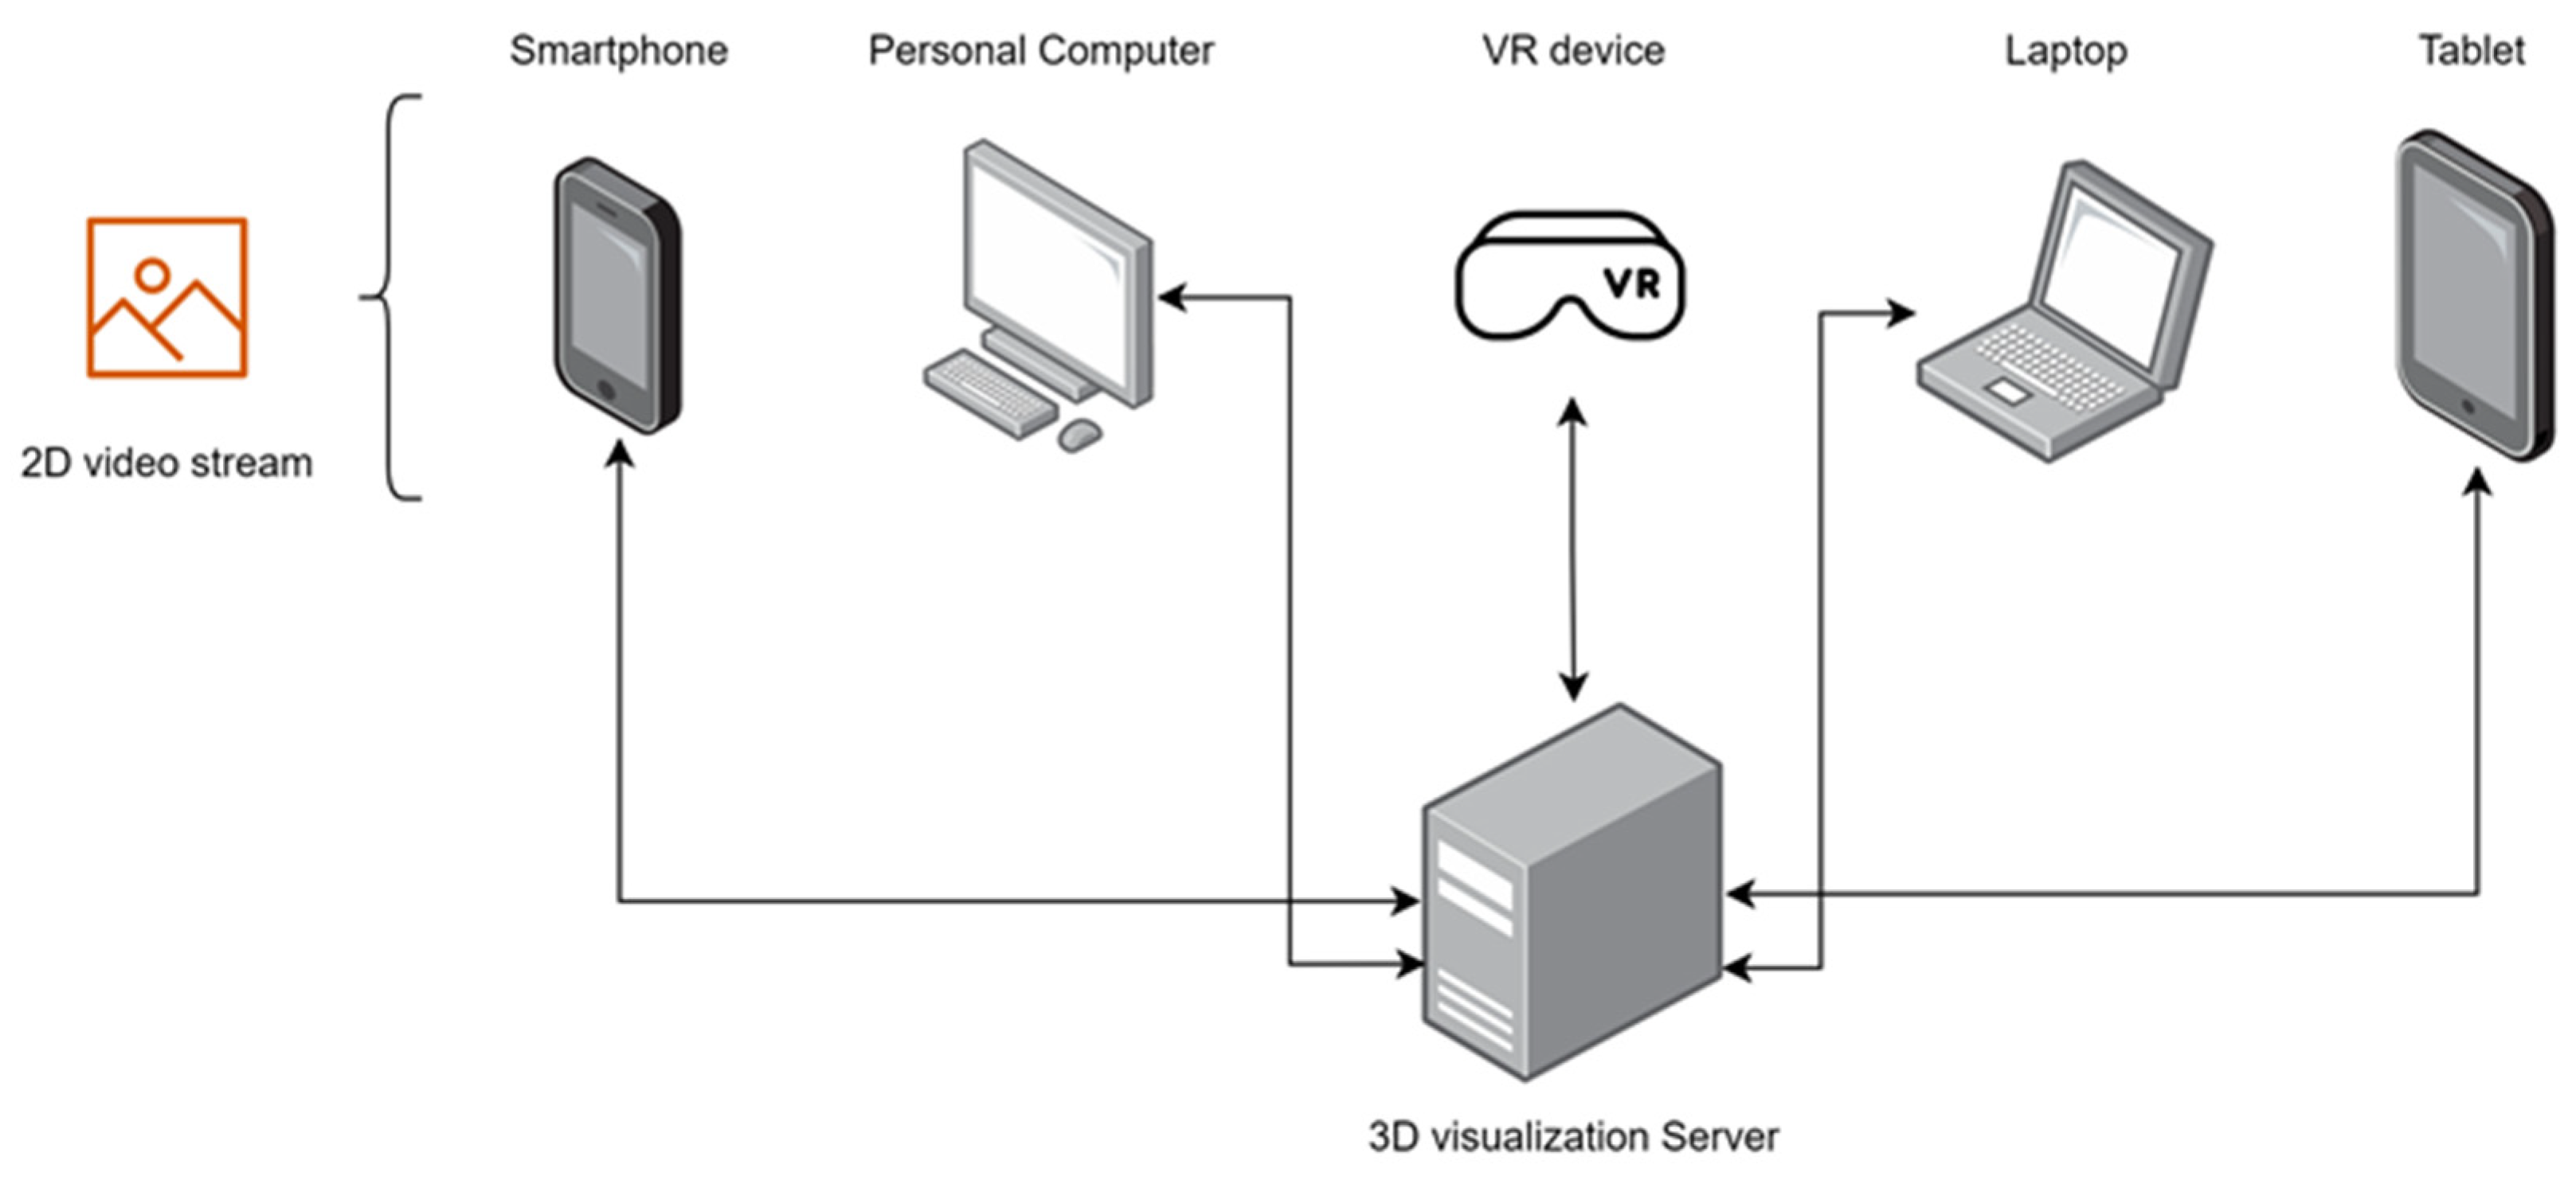
The idea behind our solution was to create a system that would allow users to create 3D visualizations on any device, at any time. In addition, it was important for us that users would be able to collaborate in real time on visualized 3D medical samples. For more information about the first structural plans regarding our streaming solution, see the following paper [27]. Our system is built on a client–server architecture. This means that there is a central server that performs the computations related to the 3D visualization and transmits the results to the clients. The method of 3D display performed by the server is available in previous works [29]. In addition to the server, there are one or more client applications that receive the data and display them to the user. With this implementation, the high computational requirements of 3D visualization are only applied to the server, which allows our client application to run on smartphones, tablets, computers, or VR devices.
As shown in Figure 2, actual 3D rendering is performed “only” on the server side. Nevertheless, clients perceive it as if 3D rendering is happening on their device. We were able to achieve this effect by displaying a canvas directly in front of the users, displaying the image data received from the server. It is important to note that there is continuous two-way communication in our system. With this technique, the server is able to provide the image data, while the user is able to transmit, for example, his own motion data to the server. This is important because if the user’s motion data are transmitted to the server, the server can generate the new image data from the appropriate viewpoint. Even though the digitized medical samples are not stored on the client side and the 3D visualization is not performed on the client device, we were able to implement it in such a way that the user can walk around the 3D medical sample by continuous two-way communication. The result of the client-side visualization can be seen in Figure 3.
In Figure 3a, we can see that the user has a camera in the client software (indicated by the grey prism shape in the image). Directly in front of this camera, we have placed a canvas to display the image data from the server. With this solution, we were able to create an environment on the user’s side by transmitting 2D images over the network that the user experiences as 3D. In Figure 3b, we can see the result of the client-side display. In this case, two users are using our software at the same time. As we can see in Figure 3, a 3D digitized medical sample is displayed in the center, which the users can evaluate together using our software. Next to this, we can see that each user is represented as a 3D avatar for the other users.
As shown in Figure 4, when a new user logs in, the server determines the streaming parameters needed to start streaming. It then saves the data for each connected user and starts sending the image data at the specified resolution and speed. If the user is already connected to the server, but the data transmission is in progress, the server determines the frame to be sent and then transmits it to the user.
3.2. The Developed Client-Side Buffering Rules
In order to ensure stable operation under varying network conditions, we implemented a so-called ring buffer. For more information on our first implementation of the buffering rules, see the following paper [27]. In the ring buffer, each user stores their own frames received from the server. This allows us to continuously monitor the connection between the client and the server using the metric. The metric is determined locally by each user based on the data stored in the ring buffer. The , and so the , is determined each time the client program displays a new frame to the user or receives a new frame from the server. The method of determining is described by Equation (1).
The notations in Equation (1) mean the following:
- : The difference between the index of the most recent frame received from the server and the index of the most recently displayed frame in the client’s buffer.
- : The index of the frame in the client’s buffer that is the most recent frame from the server and has not yet been displayed by the client.
- : The index of the frame in the client buffer that was last displayed to the user.
- : The size of the ring buffer used in the client program.
In order to apply the equation in practice, two things are needed. Firstly, we need to be able to determine the index of the frame that came most recently from the server (), and secondly, we need to be able to tell which frame with the index was the last to be displayed (). If we examine the metric at fixed intervals during the execution of our program, we can get an idea of whether the client is able to maintain the appropriate display quality for the user. The examination of is shown in Equation (2).
The abbreviations used in Equation (2) have the same meanings as in Equation (1). The newly introduced abbreviation has the following meaning:
- : The current state of the client-side buffer.
If Equation (2) returns 1, the client program is working correctly and no intervention is needed. In the case where Equation (2) returns 0, the client side is displaying the image data to the user too fast for the speed at which it is received from the server. If no action is taken in this case, the user will notice a lag in the program. This can be prevented by slowing down the speed of the client-side display. In the case where Equation (2) returns −1, the client will not be able to display the images at a sufficient speed. In order to compensate for this, we need to slow down the server’s data transfer rate. With these intermediate steps, we are able to keep our system in a so-called healthy state, so that the user can use our system even with a changing network. The constant values shown in Equation (2) can be changed even at runtime. The wider the range we allow for , the later our system will intervene, but the more drastic the intervention will need to be in order to keep the system operational.
When the described client-side buffering rules are applied and returns 1, there is no change in the user experience. If returns 0, the client may experience lag, because we had to slow down the client-side data visualization speed. When the system is back to a healthy state, the client will experience a lag-free stream again. When returns a value of −1, our system will need to slow down the server-side data sending speed. In this case, the user will not experience any change in the way the program is used.
Testing the Buffering Rules
The proper functioning of buffering rules is essential to produce working real-time network software. For this reason, the buffering rules we designed and developed were tested in operation. The results of the tests are shown in Figure 5. During the tests, the sending speed of the server was manually accelerated or slowed down in order to trigger the automatic activation of the buffering rules. As shown in the figure, when the metric becomes too low, the system intervenes and can bring the value back to the normal range by increasing the server-side sending speed. This can be seen in Figure 5 in the orange color. Conversely, when we deliberately speed up the server’s sending speed during testing, the value starts to increase. We can see this in Figure 5 in the steep line. When started to become too high, the buffering rules stepped in and slowed down the server-side sending speed, so that the indicator could return to the normal range. This can be seen in Figure 5 in the gray color.
3.3. Adaptive Streaming Resolution Based on Latency
An important aspect in the implementation of our system was to be able to continue working even if the quality of the network connection between the client and the server were to degrade. To achieve this, we implemented functionality that would provide the client with a continuous stream of images. Using this, even if the latency between client and server increases, the user still receives image data, but at a lower resolution. The basic idea of adaptive resolution change can be seen in our previous conference paper [27]. To determine the latency, an empty network packet is sent from the client to the server at constant intervals, and then from the server back to the client. Meanwhile, we measure the elapsed time on the client side. These values are stored and after a given number of pieces, an average delay between the client and the server is calculated. This is shown in Equation (3).
The notations in Equation (3) mean the following:
- Average delay between client and server for a given period of time.
- : The sum of the delays measured during the period under investigation.
- : Number of measurements carried out during the period under investigation.
The result of the delay-based real-time velocity change is shown in Figure 6. As Figure 6 shows, our solution currently supports three different resolutions. Due to the architecture of our solution, the number of supported resolutions can be further extended in the future.
In the solution presented in the paper, the metric , when determined, is automatically transmitted to the server. The server, based on the average latency received from the client, sets the streaming resolution for it. This resolution is kept for that client until the next is determined. The following is re-established at constant intervals on the client side. The system is designed to be able to provide different video streaming resolutions to different users. With this solution, if a user has a faster Internet connection, he will receive a better-quality video stream from the server. This can be seen in blue in Figure 7. In contrast, a user with a slower Internet connection will receive a lower-resolution stream. This can be seen in the gray color.
In order to test the resolution change, tests have been carried out to verify that our system is able to automatically change the resolution in cases where latency warrants it. To achieve this, we set up a test environment with only the client, the server, and a switch in the network. The specifications of the devices were as follows:
- Server device: A PC with an Intel(R) Ethernet Controller (3) I225-V network card.
- Client device: A laptop with a Broadcom 802.11ac network adapter.
- Switch: A TP-LINK, TL-SG2424 smart switch.
The result of the resolution changing based on the latency can be seen in Figure 7.
3.4. The Quality of Service Calculation
The definition of QoS is a critical task for software whose functional quality depends on the quality of network parameters. For more information about the first research results regarding the QoS calculation, see the following paper [28]. Since, in our research, we designed and developed an online solution that transmits real-time video data from the server to the users, it was essential to define QoS. In the solution we developed, we considered four network parameters, which were considered in equal proportions [30]. Once the QoS metric was defined, we classified it into five categories, which allowed us to define different transmission resolutions for different network qualities. The QoS computing solution we use, its testing, and the different QoS classes are described in Section 3.3.
In order to be able to define the QoS metric when the client connects, we needed to be able to define the desired network parameters [30]. These were the following:
- throughput (TH);
- delay (D);
- packet delay variation (PDV);
- packet loss (PL).
We have achieved this by performing a constant-length QoS test phase when the client connects, in which the system determines and classifies these network parameters on a scale of 1–5. Network parameters are classified using Table 1. The threshold values used for delay, packet delay variation, and packet loss in the classification were set based on what was observed during testing. For throughput, the thresholds were set to the throughput levels required to transmit frames after compression of different resolutions, as shown in Table 2. An example of this is the second line of the throughput column. The system presented in the paper has a throughput of 4 if it is between 8.59 and 13.97 Mbps. This is set because at the highest resolution (1280 × 720), the average size of one frame is 61,044 B; on the other hand, at the second highest resolution (960 × 540), the average size of one frame is 37,532 B. If we need to send 30 frames of similar size per second, the minimum network throughput is 8.59 Mbps. Until the throughput reaches 13.97 Mbps (which would be required for higher resolution), no values of 5 are given in the test. In Table 1, in the throughput column, the constant values for the different resolutions have been determined in a similar way.
As Table 1 shows, after classifying these network parameters, four values are returned (one classification result for each network parameter). These results are used in Equation (4).
The notations in Equation (4) mean the following:
- The result of throughput classification in the network parameter analysis. The can take values between 1 and 5.
- : The result of delay classification in the network parameter analysis. The can take values between 1 and 5.
- : The result of packet delay variation classification in the network parameter analysis. The can take values between 1 and 5.
- : The result of packet loss classification in the network parameter analysis. The can take values between 1 and 5.
Once the coefficient has been determined for the current user, the proper initial resolution is set using assignment rules. The assignment rules are presented in Table 2.
As we can see from Table 2, if the QoS measurements show that the network parameters of the host are good enough, it can receive HD-quality resolution from the server. On the other hand, if the user’s initial network parameters do not allow for a high-quality video stream with our system, he can still receive lower-resolution video from the server. The server defines the QoS parameter separately for each user. In this way, individual users can receive images from the server at different resolutions depending on the quality of their network connection. A low-resolution stream naturally affects the user experience in a negative way, but with this method, we are able to provide the stream even with a lower-quality network connection. If we did not reduce the resolution, we would not be able to provide data to the user under the given network connection quality. If the definition of QoS is repeated at given intervals, our system can adapt to changing network conditions. If a higher QoS result is obtained for a given user during a repeated measurement, he will receive a higher-resolution stream from the server until the next QoS calculation.
As can be seen in Figure 8, the results of the QoS calculation gave worse values for the 10 Mb/s network than for the other two. It is important to mention that for our QoS calculation solution, we set the maximum value for throughput to 11 Mb/s. This was necessary because otherwise, we would have overloaded the network. The maximum measurement limit of 15 Mb/s was not a problem due to the compression used in the network data transmission. Due to the compression, it takes about 61,044 B (byte) to send one frame at 1280 × 720 resolution. If we take into account the 30 FPS (frames per second) sending rate, the result is 13.97 Mb/s. This allows us to measure the throughput required for the maximum resolution we plan to send with our solution.
As Figure 9 shows, the average test result was worse for the 10 Mb/s network than for the other two. As shown in Figure 9, the average QoS test results for the 100 Mb/s and 1Gb/s networks are almost identical. This may be because our current system is able to deliver a high-resolution network stream to the user even when using the 100 Mb/s network.
3.5. Managing Multiple Connected Users on the Server
The central goal of the part of our research that dealt with server-side management of multiple users was to be able to create a 3D virtual space that could be shared by doctors. In this space, doctors/researchers would be able to jointly evaluate medical image data and make a common diagnosis. In the shared 3D space provided by the server, each user can move freely by sending the data of the movement they want to perform to the central server, which will then send the next transmitted image to the client from a new perspective based on the received movement data.
Our software is designed around two main guidelines. The first is to eliminate the high hardware resource requirements for evaluating digitized medical samples. The second is to provide the user with a multi-user software that, when used, can evaluate 3D medical samples in a three-dimensional space. In Section 3.5, we present the implementation of our second objective.
Our server application is designed to be able to store the data of different connected users, to be able to transmit image data to all clients, and to be able to display medical samples in 3D. By implementing these three basic requirements, we have created a server capable of transmitting 3D data to clients at the appropriate resolution and speed. Each connected user on the server has their own camera and their own 3D avatar. Each user can view the 3D space created by the server, and the 3D medical sample displayed in it, from the perspective of their own camera. This can be seen in Figure 10. Every user has the ability to move his/her own camera, in which case the camera will be moved to a new position on the server. In the case of a PC client, users can move using the keyboard, while in the case of a smartphone and tablet, they can use the touch screen. If the user presses the movement button, the client software sends a signal to the server, indicating that the user’s server-side camera must be moved in a specific way. This enables the user to receive the image data from the camera in the new position when the subsequent data are sent. This allows the client to view the displayed medical samples from a new perspective.
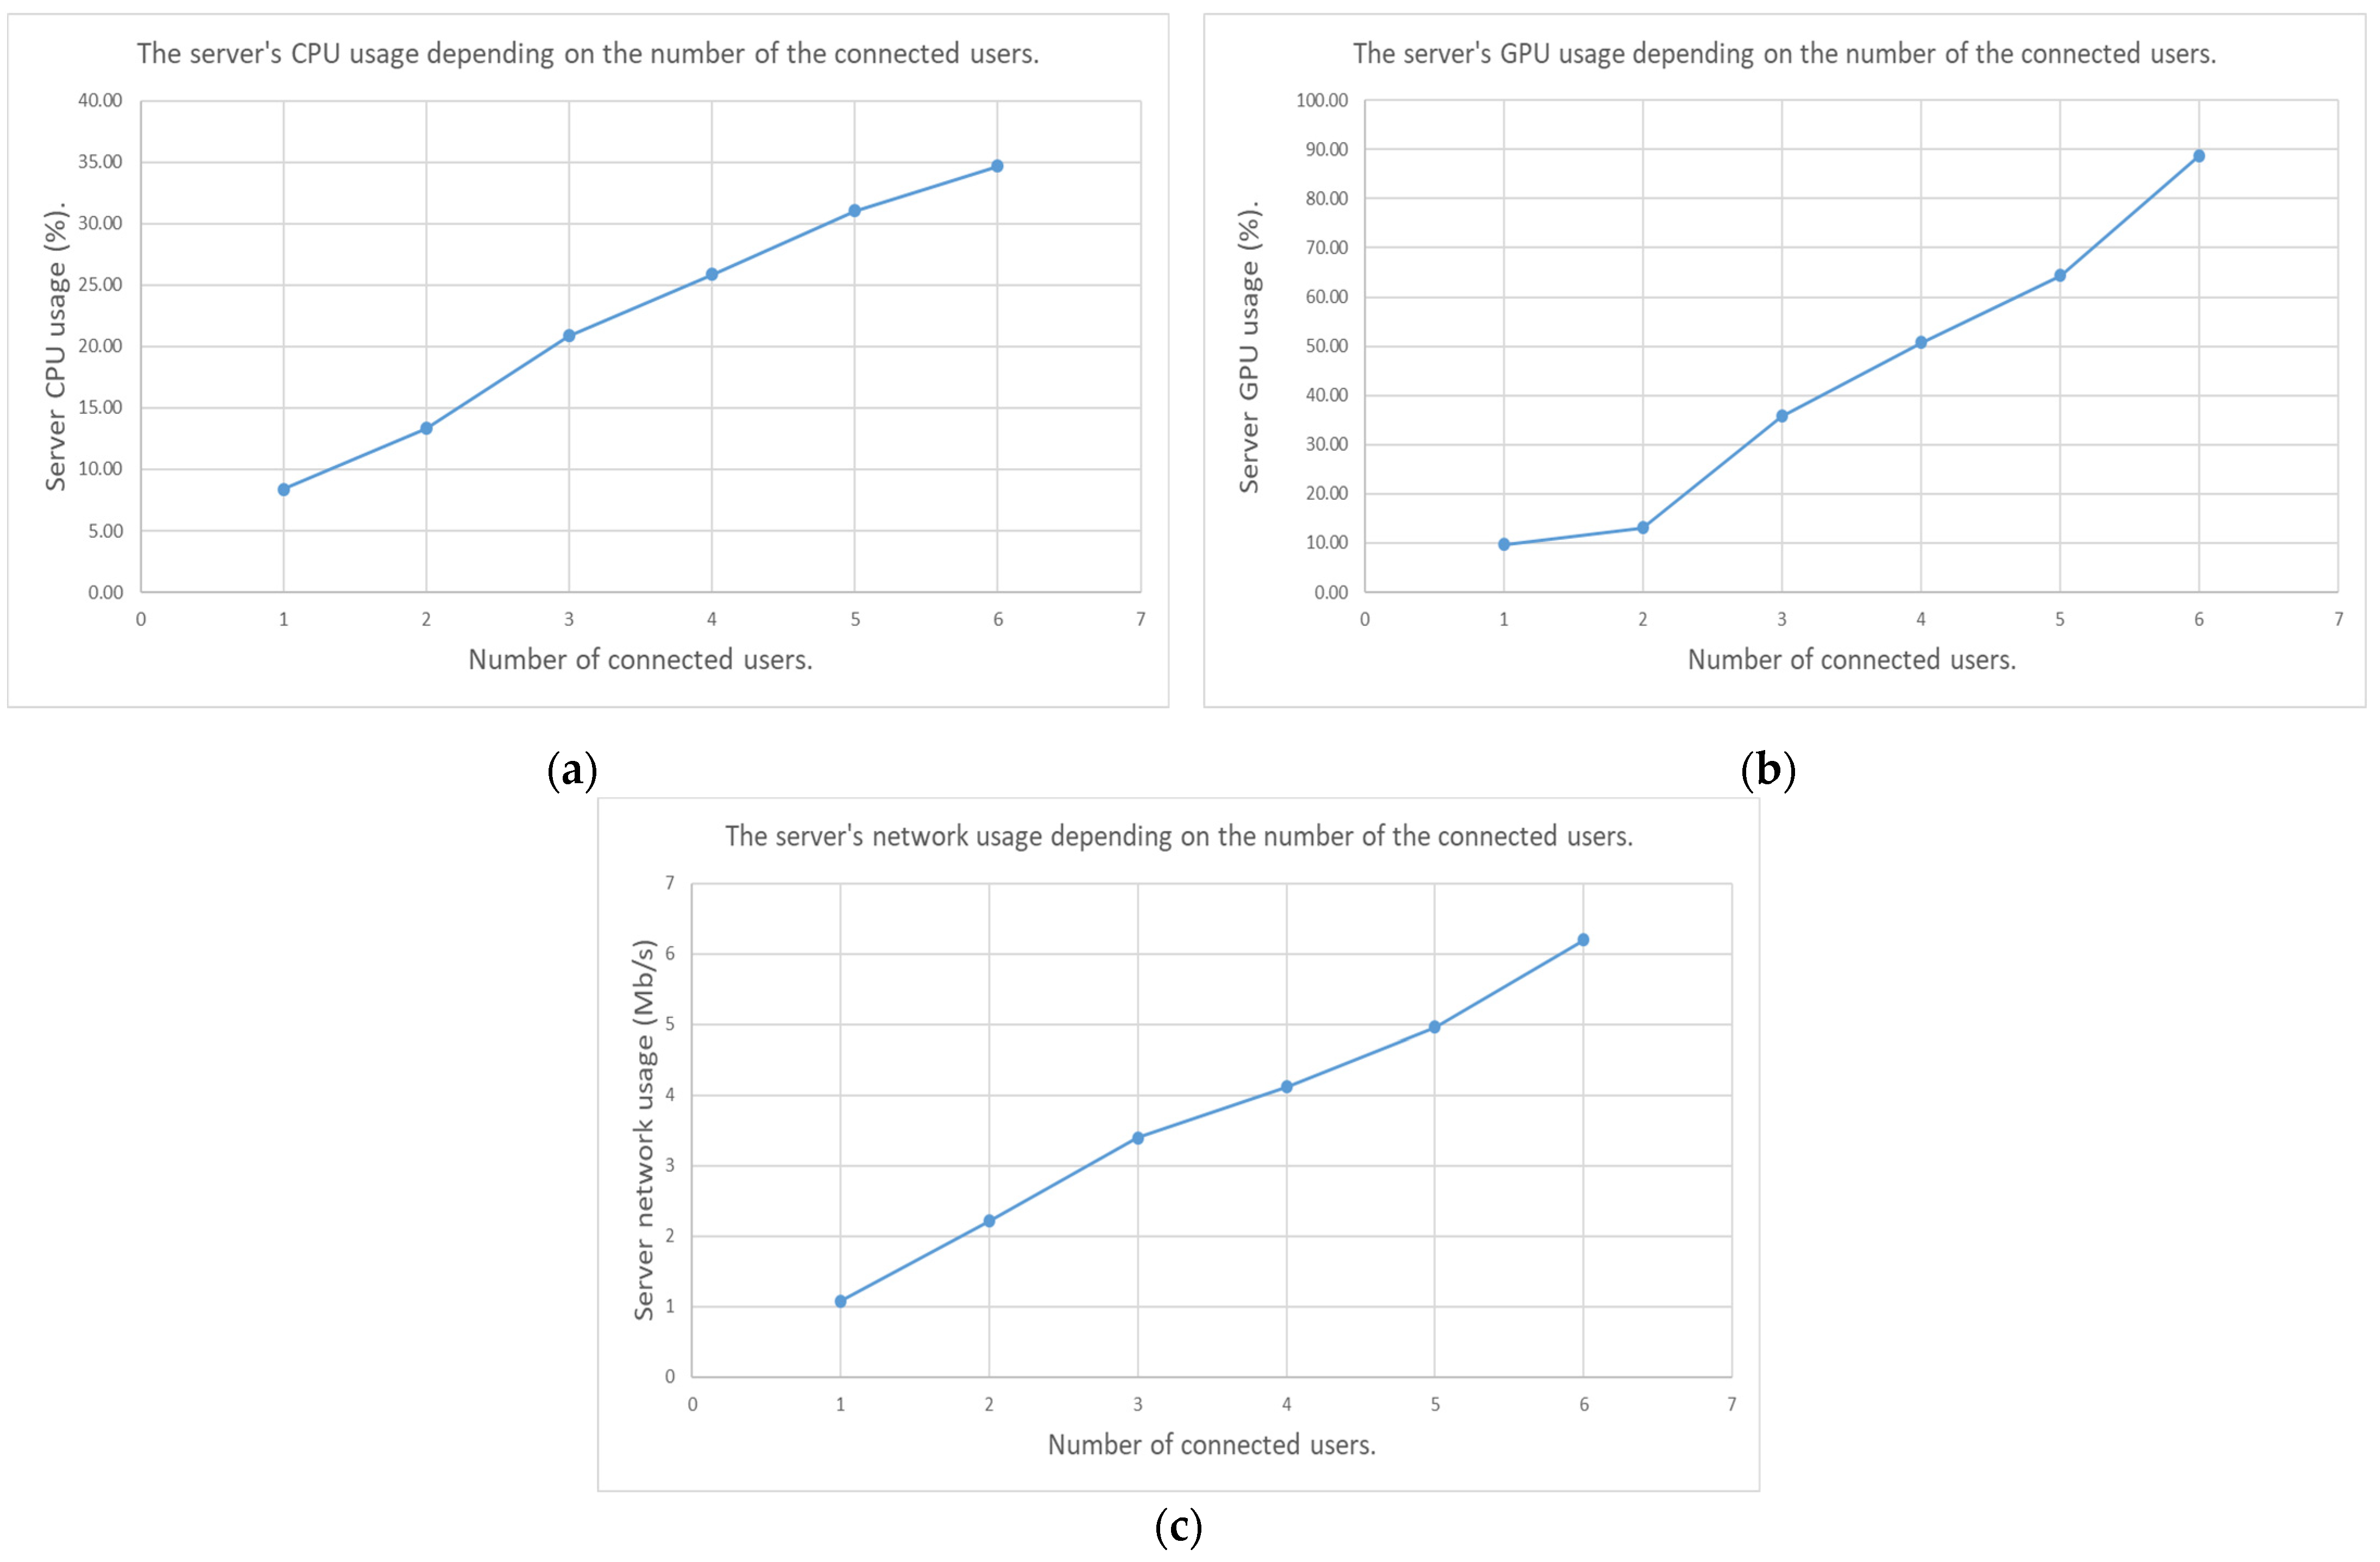
In our solution, the server does not have to deal with the client-side buffering rules mentioned in Section 3.2. This may be because that parameter is defined on the client side. However, the buffering rules may vary the sending rate for each client. The server stores this separately for each connected client. Therefore, the central server must always be aware of delivering the right camera image to the right user at the right moment. Since the central server performs resource-intensive computations, we had to test how much the current resource is used for different numbers of users. The test results can be seen in Figure 11. It is important to note in relation to the test performed that a fixed resolution and transmission rate was used for all users. In practice, this meant that all users received 320 × 180 resolution images and 10 images per second.
Before running the test, the expected result was that as the number of users increased, the server would need to use more hardware resources to serve the clients. As we can see in Figure 11, our expectation came true. As can be seen in Figure 11, the CPU and the GPU usage increase, depending on the number of connected clients. The situation is similar regarding the network usage of the server. In this case, the server has to forward image data to more and more users, so an increase in network traffic was to be expected.
In Section 3, we presented the most important functionalities and test results that we achieved during our latest research. In addition, the reader can get a closer look at what new research results we have achieved in terms of the entire system compared to those previously published. In the next paragraph, the reader can get an overall picture of what we have achieved, how our presented solution can be used in the future, and what future developments we plan to implement.
4. Discussion
During our research presented in the paper, we achieved new theoretical and practical results. We have successfully formulated the mathematical relationships with which our streaming client–server architecture can be created and maintained in a stable state. In the course of our research, we successfully created a system capable of providing doctors with a 3D medical data display on devices with low computing capacity. With the solution presented in the paper, the 3D display of high-resolution digitized medical samples may become available in the future, even on devices with low computing capacity.
Nowadays, 3D visualization and evaluation of digitized medical samples is a resource-intensive task, but not all researchers/physicians have the hardware tools to do it. This fact, and the factor that medicine is a consultative profession where asking for the opinion of a colleague is part of everyday work, led us to develop software in our research that could provide a solution to these problems. Using our solution, digitized medical samples can be evaluated in an interdisciplinary virtual 3D environment. Users can connect to this environment using their smartphone, tablet, or laptop. The only requirement is a network connection between server and client.
With our solution presented in the paper, doctors from different medical fields can examine the same digitized medical sample in a common space using different hardware devices. By doing this, they are able to establish a common diagnosis. As we experienced during the recent COVID-19 pandemic, no matter how difficult it is, medical work must continue. The 3D virtual environment that we developed during our research can help with this. In this environment, researchers and doctors are able to connect and continue working together, even across great distances. With the solution presented in the paper, doctors can interactively examine medical samples together at high resolution on devices with low computing power.
In our research, we designed and built a system that can operate stably under varying network conditions. This allows the user to receive image data from the server at all times, so that 3D evaluation of medical samples can remain continuous. The equations and classification rules defined in our solution allow our system to easily adapt to the fundamentally unreliable environment of the Internet. The implemented latency-based stream resolution change allows the user to use our system without any lag. Thanks to this feature, if the latency became too high, the server would automatically decrease the resolution. This functionality is similar to what other video sharing sites use. Our tests during the research show that the presented functionalities work and that they can be used to provide the user with continuous data transfer from the server.
In the future, we want to continue our research in order to add functionality to our solution that is essential for everyday use. This includes authentication and voice-based communication between users. Since our software deals with the processing and transmission of medical data, it is particularly important that only authorized persons have access to the data. The future implementation of authentication will help to improve the security of the software. Voice-based communication would be important because, in this way, users could quickly share data with each other, which could speed up the time it takes to establish a diagnosis. As a continuation of our research, we plan to carry out user tests. These tests will show how usable our software is for the target group of users. In the future, we plan to further develop our solution based on the results of these tests.
In the paper, the reader can see the results of research that provides a practical solution to a problem that is currently unsolved. With the presented results, we were able to create a system that enables users to display 3D medical data regardless of location and device. We have created a 3D virtual environment that users can share with each other, so that a joint diagnosis can even take place in a virtual 3D environment.
Author Contributions
Conceptualization, M.V.; methodology, M.V.; software, M.V.; validation, M.V.; formal analysis, M.V. and M.K.; investigation, M.V.; resources, B.M. and M.K.; data curation, M.V.; writing—original draft preparation, M.V.; writing—review and editing, M.V.; visualization, M.V.; supervision, B.M. and M.K.; project administration, M.K.; funding acquisition, M.K. All authors have read and agreed to the published version of the manuscript.
Funding
The research received funding from the 2019-1.3.1-KK-2019-00007 “Innovációs szolgáltató bázis létrehozása diagnosztikai, terápiás és kutatási célú kiberorvosi rendszerek fejlesztésére” national project.
Institutional Review Board Statement
Not applicable.
Informed Consent Statement
Not applicable.
Data Availability Statement
The medical serial sections and images used in this study cannot be made available upon any request.
Acknowledgments
The authors would like to thank AIAM (Applied Informatics and Applied Mathematics) doctoral school of Óbuda University, Budapest, Hungary, for their support in this research.
Conflicts of Interest
Author Bela Molnar was employed by the company 3DHISTECH Ltd. The remaining authors declare that the research was conducted in the absence of any commercial or financial relationships that could be construed as a potential conflict of interest.
References
- Balagalla, U.B.; Sivanatham, S.; Munasinghe, K.; Subasinghe, A.; de Alwis, C.; Wijewardhana, U.; Dharmaweera, M.N. Efficient Medical Video Streaming by Pre-Processing and Network Traffic Prioritization in Real-Time. In Proceedings of the 2019 International Conference on Advanced Technologies for Communications (ATC), Hanoi, Vietnam, 17–19 October 2019; IEEE: New York, NY, USA, 2019; pp. 123–128. [Google Scholar] [CrossRef]
- Cárdenas, A.F.; Pon, R.K.; Cameron, R.B. Management of Streaming Body Sensor Data for Medical Information Systems. In Proceedings of the International Conference on Mathematics and Engineering Techniques in Medicine and Biological Scienes, METMBS ‘03, Las Vegas, NV, USA, 23–26 June 2003; pp. 186–191. [Google Scholar]
- Han, H.; Lv, J. Super-Resolution-Empowered Adaptive Medical Video Streaming in Telemedicine Systems. Electronics 2022, 11, 2944. [Google Scholar] [CrossRef]
- Papakostas, C.; Troussas, C.; Krouska, A.; Sgouropoulou, C. On the Development of a Personalized Augmented Reality Spatial Ability Training Mobile Application. In Frontiers in Artificial Intelligence and Applications; Frasson, C., Kabassi, K., Voulodimos, A., Eds.; IOS Presss: Amsterdam, The Netherlands, 2021. [Google Scholar] [CrossRef]
- Papakostas, C.; Troussas, C.; Krouska, A.; Sgouropoulou, C. PARSAT: Fuzzy logic for adaptive spatial ability training in an augmented reality system. Comput. Sci. Inf. Syst. 2023, 20, 1389–1417. [Google Scholar] [CrossRef]
- Fuller, M.Y.; Mukhopadhyay, S.; Gardner, J.M. Using the Periscope Live Video-Streaming Application for Global Pathology Education: A Brief Introduction. Arch. Pathol. Lab. Med. 2016, 140, 1273–1280. [Google Scholar] [CrossRef] [PubMed]
- Schneider, A.; Wilhelm, D.; Doll, D.; Rauschenbach, U.; Finkenzeller, M.; Wirnhier, H.; Illgner, K.; Feussner, H. Wireless live streaming video of surgical operations: An evaluation of communication quality. J. Telemed. Telecare 2007, 13, 391–396. [Google Scholar] [CrossRef] [PubMed]
- Schüffler, P.J.; Stamelos, E.; Ahmed, I.; Yarlagadda, D.V.K.; Ardon, O.; Hanna, M.G.; Reuter, V.E.; Klimstra, D.S.; Hameed, M. Efficient Visualization of Whole Slide Images in Web-Based Viewers for Digital Pathology. Arch. Pathol. Lab. Med. 2022, 146, 1273–1280. [Google Scholar] [CrossRef] [PubMed]
- Holub, P.; Müller, H.; Bíl, T.; Pireddu, L.; Plass, M.; Prasser, F.; Schlünder, I.; Zatloukal, K.; Nenutil, R.; Brázdil, T. Privacy risks of whole-slide image sharing in digital pathology. Nat. Commun. 2023, 14, 2577. [Google Scholar] [CrossRef] [PubMed]
- Segarra, C.; Muntane, E.; Lemay, M.; Schiavoni, V.; Delgado-Gonzalo, R. Secure Stream Processing for Medical Data. In Proceedings of the 2019 41st Annual International Conference of the IEEE Engineering in Medicine & Biology Society (EMBC), Berlin, Germany, 23–27 July 2019; IEEE: New York, NY, USA, 2019; pp. 3450–3453. [Google Scholar] [CrossRef]
- Lane, J.; Schur, C. Balancing Access to Health Data and Privacy: A Review of the Issues and Approaches for the Future. Health Serv. Res. 2010, 45, 1456–1467. [Google Scholar] [CrossRef] [PubMed]
- Nunez, L.; Toasa, R.M. Performance evaluation of RTMP, RTSP and HLS protocols for IPTV in mobile networks. In Proceedings of the 2020 15th Iberian Conference on Information Systems and Technologies (CISTI), Sevilla, Spain, 24–27 June 2020; pp. 1–5. [Google Scholar] [CrossRef]
- Lei, X.; Jiang, X.; Wang, C. Design and implementation of streaming media processing software based on RTMP. In Proceedings of the 2012 5th International Congress on Image and Signal Processing (CISP), Chongqing, China, 16–18 October 2012; pp. 192–196. [Google Scholar] [CrossRef]
- Aloman, A.; Ispas, A.I.; Ciotirnae, P.; Sanchez-Iborra, R.; Cano, M.D. Performance Evaluation of Video Streaming Using MPEG DASH, RTSP, and RTMP in Mobile Networks. In Proceedings of the 2015 8th IFIP Wireless and Mobile Networking Conference (WMNC), Munich, Germany, 5–7 October 2015; IEEE: New York, NY, USA, 2015; pp. 144–151. [Google Scholar] [CrossRef]
- Durak, K.; Akcay, M.N.; Erinc, Y.K.; Pekel, B.; Begen, A.C. Evaluating the Performance of Apple’s Low-Latency HLS. In Proceedings of the 2020 IEEE 22nd International Workshop on Multimedia Signal Processing (MMSP), Tampere, Finland, 21–24 September 2020; pp. 1–6. [Google Scholar] [CrossRef]
- Schulzrinne, H.; Rao, A.; Lanphier, R. Real Time Streaming Protocol (RTSP); RFC2326; RFC Editor: Marina del Rey, CA, USA, 1998. [Google Scholar] [CrossRef]
- Akhlaq, M.; Sheltami, T.R. RTSP: An Accurate and Energy-Efficient Protocol for Clock Synchronization in WSNs. IEEE Trans. Instrum. Meas. 2013, 62, 578–589. [Google Scholar] [CrossRef]
- Parmar, M.C.K.; Pancholi, K. A Review on Image Compression Techniques. J. Inf. Knowl. Res. Electr. Eng. 2015, 2, 281–284. [Google Scholar]
- Garg, G.; Kumar, R. Analysis of Different Image Compression Techniques: A Review. SSRN J. 2022. [Google Scholar] [CrossRef]
- Kulchandani, J.S.; Pal, S.H.; Dangarwala, K.J. Image Compression: Review and Comparative Analysis. Int. J. Eng. Res. 2014, 3, 586–589. [Google Scholar]
- Niu, H.; Shang, Y.; Yang, X.; Xu, D.; Han, B.; Chen, C. Design and research on the JPEG-LS image compression algorithm. In Proceedings of the 2010 Second International Conference on Communication Systems, Networks and Applications, Hong Kong, China, 29 June–1 July 2010; IEEE: New York, NY, USA, 2010; pp. 232–234. [Google Scholar] [CrossRef]
- Barbhuiya, A.J.I.; Laskar, T.A.; Hemachandran, K. An Approach for Color Image Compression of JPEG and PNG Images Using DCT and DWT. In Proceedings of the 2014 International Conference on Computational Intelligence and Communication Networks, Bhopal, India, 14–16 November 2014; pp. 129–133. [Google Scholar] [CrossRef]
- Jassim, F.A. Increasing Compression Ratio in PNG Images by k-Modulus Method for Image Transformation. arXiv 2013, arXiv:1307.0036. [Google Scholar]
- Raid, A.M.; Khedr, W.M.; El-dosuky, M.A.; Ahmed, W. Jpeg Image Compression Using Discrete Cosine Transform—A Survey. Int. J. Comput. Sci. Eng. Surv. 2014, 5, 39–47. [Google Scholar] [CrossRef]
- Christopoulos, C.; Skodras, A.; Ebrahimi, T. The JPEG2000 still image coding system: An overview. IEEE Trans. Consum. Electron. 2000, 46, 1103–1127. [Google Scholar] [CrossRef]
- Gormish, M.; Lee, D.; Marcellin, M.W. JPEG2000: Overview, architecture, and applications. In Proceedings of the 2000 International Conference on Image Processing (Cat. No.00CH37101), Vancouver, BC, Canada, 10–13 September 2000; IEEE: New York, NY, USA, 2000; Volume 2, pp. 29–32. [Google Scholar] [CrossRef]
- Vincze, M.; Biricz, B.; Kozlovszky, M.; Benhamida, A. Real-time video streaming in medicine using virtual reality. In Proceedings of the 2023 IEEE 17th International Symposium on Applied Computational Intelligence and Informatics (SACI), Timisoara, Romania, 23–26 May 2023; pp. 000183–000188. [Google Scholar] [CrossRef]
- Vincze, M.; Jònàs, V.; Szántó, M.; Benhamida, A.; Paulik, R.; Laczi, A.S.; Szócska, B.; Endre, G.; Kozlovszky, M. 3D video streaming in digital pathology using virtual reality. In Proceedings of the 27th IEEE International Conference on Intelligent Engineering Systems 2023 (INES), Nairobi, Kenya, 26–28 July 2023. [Google Scholar]
- Vincze, M.; Molnar, B.; Kozlovszky, M. 3D Visualization in Digital Medicine Using XR Technology. Futur. Internet 2023, 15, 284. [Google Scholar] [CrossRef]
- Saleh, A.K.; Tjahyaningtijas, H.P.A.; Rakhmawati, L. Quality of Service (QoS) Comparative Analysis of Wireless Network. Indones. J. Electr. Electron. Eng. 2022, 5, 30–37. [Google Scholar]
Figure 1.
The illustration of the operation of the ring buffer.

Figure 2.
The basic structure of our proposed solution.

Figure 3.
The result of client-side 3D rendering based on image data sent by the server. (a) External presentation of the client-side visualization. (b) The image that users actually see when using our software.
Figure 3.
The result of client-side 3D rendering based on image data sent by the server. (a) External presentation of the client-side visualization. (b) The image that users actually see when using our software.

Figure 4.
The operation of the presented solution’s server side.

Figure 5.
The results of testing the buffering rules. (a) The first result of testing the buffering rules. (b) The second result of testing the buffering rules.
Figure 5.
The results of testing the buffering rules. (a) The first result of testing the buffering rules. (b) The second result of testing the buffering rules.

Figure 6.
The result of the adaptive resolution changing image streaming. (a) The resulting image if the latency between the client and server is high. If the latency is high, the resolution of the streamed image is low (320 × 180). (b) The resulting image if the latency is in a medium range. If the latency is in a medium range, the streamed image will be at a medium resolution (960 × 540). (c) The resulting image if the latency between the client and server is low. If the latency is low, the resolution of the streamed image is high (1280 × 720).

Figure 7.
The results of the resolution changing tests based on the latency. (a) The first result of resolution changing tests based on the latency. (b) The second result of resolution changing tests based on the latency.
Figure 7.
The results of the resolution changing tests based on the latency. (a) The first result of resolution changing tests based on the latency. (b) The second result of resolution changing tests based on the latency.

Figure 8.
The results of the Quality of Service testing. (a) The result of the throughput investigation with different types of networks during the Quality of Service calculation. (b) The result of the delay investigation with different types of networks during the Quality of Service calculation. (c) The result of the investigation of the percentage of arrived packages with different types of networks during the Quality of Service calculation. (d) The result of the packet delay variation investigation with different types of networks during the Quality of Service calculation.

Figure 9.
Defining Quality of Service on different networks.

Figure 10.
Using the presented software with 5 users. (a) Using the presented solution with multiple users. Different users connected to the 3D inspection environment on different devices, such as smartphone, tablet, laptop. (b) The video stream seen by the user using the laptop.
Figure 10.
Using the presented software with 5 users. (a) Using the presented solution with multiple users. Different users connected to the 3D inspection environment on different devices, such as smartphone, tablet, laptop. (b) The video stream seen by the user using the laptop.

Figure 11.
The test result of the hardware usage of our server application regarding the number of connected users. (a) The CPU usage of the server regarding the number of connected users. (b) The GPU usage of the server regarding the number of connected users. (c) The network usage of the server regarding the number of connected users.


Table 1.
Table classifying QoS network parameters.
| Throughput (Mbps) | Delay (ms) | Packet Delay Variation (ms) | Packet Loss (%) | Class |
|---|---|---|---|---|
| 5 | ||||
| 13.97 | 4 | |||
| 3 | ||||
| 2 | ||||
| 1 |
Table 2.
The assignment rules between QoS and initial streaming resolution.
| Coefficient | Initial Resolution |
|---|---|
| 1280 × 720 | |
| 4 | 960 × 540 |
| 854 × 480 | |
| 640 × 360 | |
| 320 × 180 |
Disclaimer/Publisher’s Note: The statements, opinions and data contained in all publications are solely those of the individual author(s) and contributor(s) and not of MDPI and/or the editor(s). MDPI and/or the editor(s) disclaim responsibility for any injury to people or property resulting from any ideas, methods, instructions or products referred to in the content. |
© 2023 by the authors. Licensee MDPI, Basel, Switzerland. This article is an open access article distributed under the terms and conditions of the Creative Commons Attribution (CC BY) license (https://creativecommons.org/licenses/by/4.0/).
Share and Cite
MDPI and ACS Style
Vincze, M.; Molnar, B.; Kozlovszky, M. Real-Time Network Video Data Streaming in Digital Medicine. Computers 2023, 12, 234. https://doi.org/10.3390/computers12110234
AMA Style
Vincze M, Molnar B, Kozlovszky M. Real-Time Network Video Data Streaming in Digital Medicine. Computers. 2023; 12(11):234. https://doi.org/10.3390/computers12110234
Chicago/Turabian StyleVincze, Miklos, Bela Molnar, and Miklos Kozlovszky. 2023. "Real-Time Network Video Data Streaming in Digital Medicine" Computers 12, no. 11: 234. https://doi.org/10.3390/computers12110234
Note that from the first issue of 2016, this journal uses article numbers instead of page numbers. See further details here.