
Early Humidity Measurements by Louis Morin in Paris between 1701 and 1711—Data and Metadata


1
Institute of Physics, Department of Astrophysics and Geophysics, University of Graz, 8010 Graz, Austria
2
Wegener Center for Climate and Global Change (WEGC), University of Graz, 8010 Graz, Austria
3
Oeschger Centre for Climate Change Research, University of Bern, 3012 Bern, Switzerland
4
Institute of History, Department of Economic, Social Environmental History (WSU), University of Bern, 3012 Bern, Switzerland
*
Author to whom correspondence should be addressed.
Climate 2023, 11(7), 156; https://doi.org/10.3390/cli11070156
Submission received: 15 June 2023
/
Revised: 18 July 2023
/
Accepted: 20 July 2023
/
Published: 23 July 2023
(This article belongs to the Special Issue The Importance of Long Climate Records)
Abstract
:This paper discusses what is, to our knowledge, the oldest subdaily measurement series of humidity taken over several years. Louis Morin performed the measurements in Paris, three times a day, between May 1701 and June 1711. A correlation analysis of Morin’s humidity measurements with various meteorological variables yields results comparable to those of a parallel analysis of the relative humidity measurements of the E-OBS data: the Spearman correlation coefficient between the humidity and the daily minimum temperature is −0.43 (p < 0.01); with the mean temperature, it is −0.54 (p < 0.01); with the maximum temperature, it is −0.59 (p < 0.01); with the diurnal temperature range, it is −0.65 (p < 0.01); and with the total cloud cover, 0.33 (p < 0.01). However, with a Spearman correlation coefficient of 0.11 (p < 0.01), no correlation is found with the precipitation data. Further evidence for the plausibility of the measurements is shown by a day-by-day analysis of the first half-year of 1709. Here, abrupt changes in the humidity measurements of Morin can be explained by the other measurements/observations of Morin. According to the correlation analysis, indirect notes in his journal, and others, we argue that Morin used the hygrometer developed by Vincenzo Viviani. However, the conversion of the data to common units is not performed and is subject to further research.
1. Introduction
Early measurement series of meteorological variables, among others, serve to reconstruct the climate of the last centuries. Temperature and humidity of the atmosphere were among the first features of the natural world to be quantified using new scientific instruments [1]. In the literature, more attention has been paid to early temperature measurements, early pressure measurements, and early precipitation measurements in order to achieve long-term measurement series that allow conclusions about climate variability, e.g., [2,3,4,5,6,7,8,9,10,11,12,13,14,15]. In comparison, there is little in the literature on hygrometer measurements. The reason for this probably lies in the difficulty of interpreting the humidity data. Hygrometers have varied and still vary in their construction, in the exact element they are designed to measure, and in the materials used as humidity indicators, which can range from human hair or hemp strings to strips of two metals that react differently to the amount of water in the atmosphere [1]. Thus, since humidity measurements are based on different physical principles, comparability is difficult [16]. Moreover, in the early instrumental period from the 15th to 18th century, most instruments had only a qualitative response and/or a strong dependence on both temperature and relative humidity [16]. However, Camuffo et al. [16] were able to calibrate as well as homogenize goose quill hygrometer measurements by Vincenzo Chiminello ranging from 1794 to 1826. Other measurements, such as those by Antoine Galland [1], are still being researched, as they cannot be analyzed in isolation, and the metadata are largely unknown. Thus, to the authors’ knowledge, the sub-daily ten-year time series of humidity measurements made by Louis Morin is exceptional for the early 18th century. Other measurements/observations of Morin have already been analyzed. Previously, we analyzed measurements of the temperature, direction of the movement of the clouds, and cloud cover in Pliemon et al. [17], and precipitation data in Pliemon et al. [18]. Overall, the temperature [17,19,20,21], mean sea-level pressure [11], precipitation [18,21], the direction of the movement of the clouds [17,20,21], and cloud cover [17,20] have been analyzed. Because of the lack of publications concerning early hygrometer measurements, the aim of the present paper is to provide data from a 10-year series of measurements without gaps to highlight the problems caused by the lack of metadata, and to assess the plausibility of the measurements. Section 2 provides an introduction to humidity measurements and shows all known metadata as well as derived metadata. Section 3 briefly presents the quality control of the digitization and the methods used, such as correlation analysis. Section 4 shows the plausibility of the measurements using correlation analysis and day-to-day analysis. The paper closes with Section 5, a comprehensive discussion including considerations about the difficulties when interpreting early hygrometric measurements.
2. Data
2.1. The Observer Louis Morin and His Meteorological Journal
Louis Morin lived from 11 July 1635 to 1 March 1715 in Paris. The majority of Morin’s measurements and observations (e.g., temperature, pressure, direction of the movement of the clouds, and humidity) were performed three times a day. A detailed explanation of his measurements and observations, and his biography, are presented in [17,19,21]. A consequence of his fixed daily routine is that his measurements/observations show almost no gaps. This leads to a consistent record of his meteorological journal, which shows at least one entry for 98.7% of all days [17].
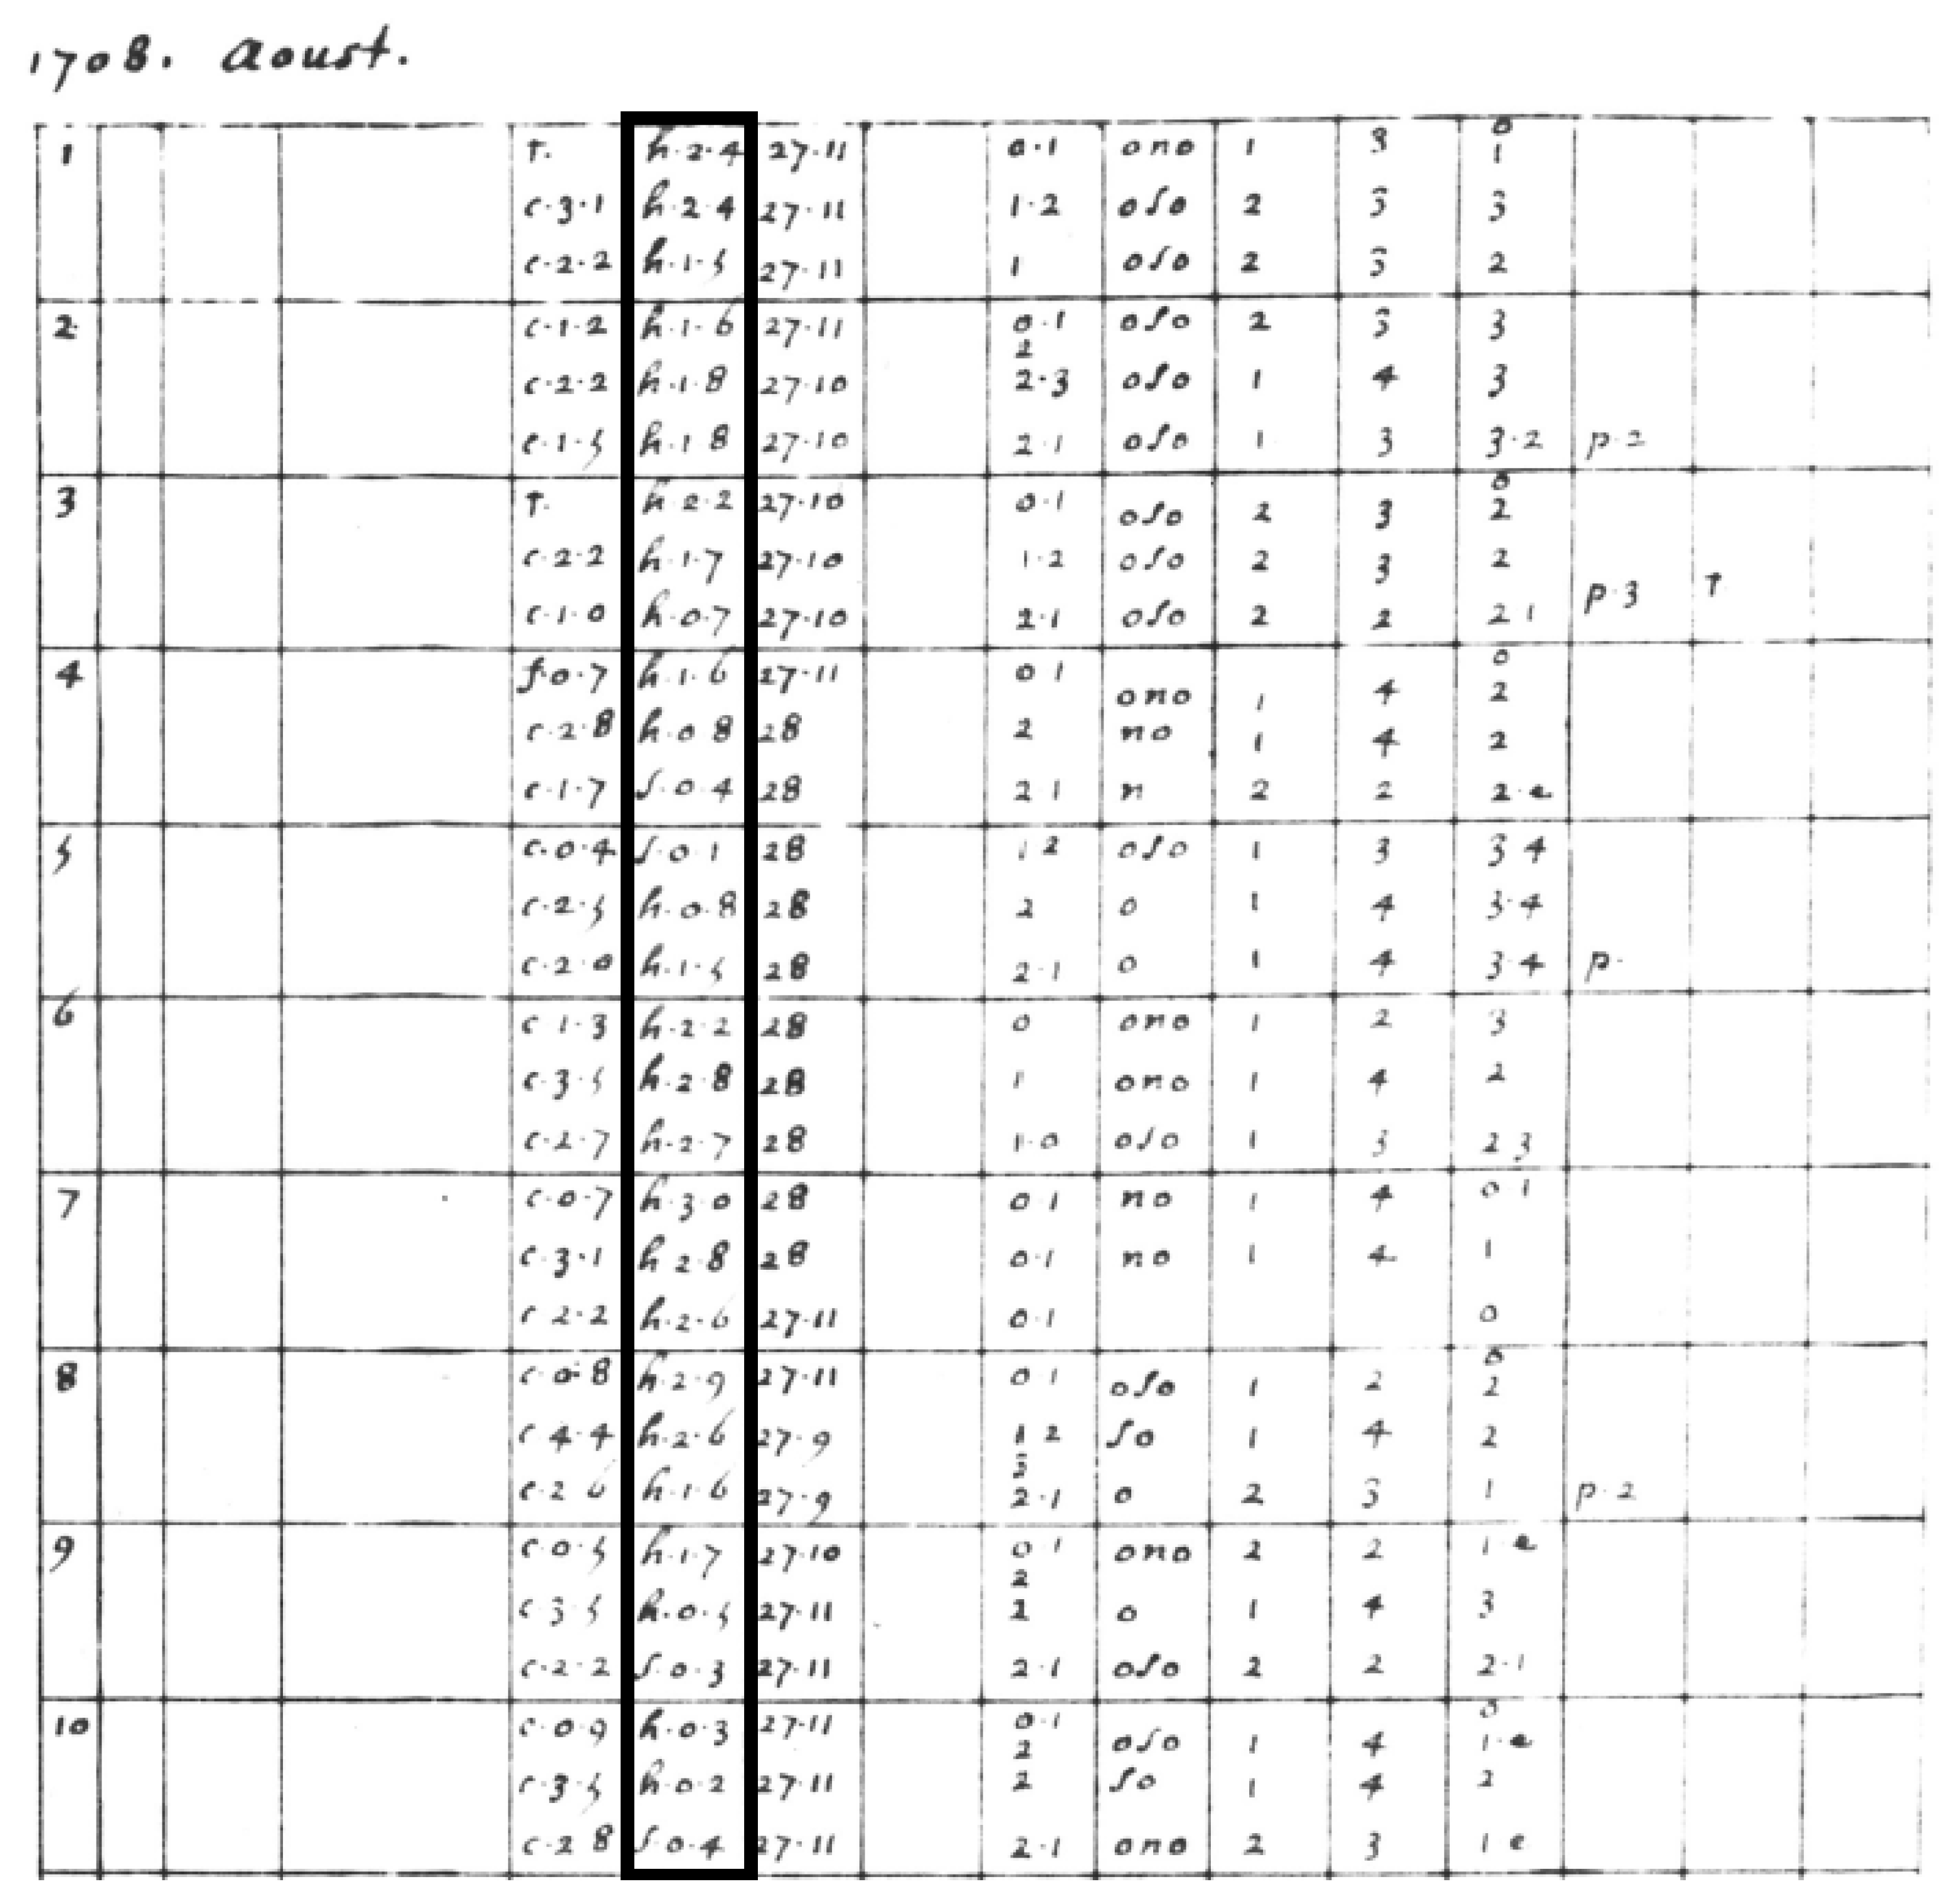
Figure 1 shows an example of Morin’s notes (sources of Morin’s data: Institute of History/Oeschger Centre for Climate Change Research, University of Bern (1701–1709) and Bibliothèque de l’Institut de France (1710–1711)). Column 1 shows the day of the month; column 2, the day of the lunar cycle; column 3, the conjunction, opposition, and other aspects of the moon and the sun; column 4, the conjunction, opposition, and other aspects of the planets; column 5, the thermometer measurements; column 6, the hygrometer measurements; column 7, the barometer measurements; column 8, the wind direction; column 9, the wind strength; column 10, the direction of the movement of the clouds; column 11, the regional origin of the air; column 12, the speed of the clouds; column 13, the cloud cover; column 14, the intensity and duration of rainfall; column 15, fog, snow, small hailstones, thunder, parhelia, and the color of the sky; and column 16 gives miscellaneous observations, such as earthquakes, comets, and halos. For more details, see other publications [17,18,19,20,21]. The hygrometer measurements are highlighted in column 6 of Figure 1. These consist of a letter, where “h” stands for humide (wet) and “s” for sec (dry), and two numbers, which usually range from 0.0 to 8.0, where the higher the number, the wetter/drier, i.e., it can be read as a scale with decimal numbers. Morin’s measurement series ends with consecutive days of dry values with numbers exceeding 8.0 (for instance 11.0). The reason for this trend toward drier values is not known to us but speaks to a measuring device whose scale is in arbitrary units, and departs from a not-well-defined zero, considered more or less representative for the most common situation.
2.2. The Daytime and Time Span of the Measurements
Most of the time, Morin made three measurements per day, but there are a few days on which he noted observations (for instance precipitation) even four, five, or six times. According to Morin’s fixed daily routine, Pfister and Bareiss [21] suggested that these measurements and observations were made at around 6 am, between 11 am and 2 pm, and between 6 and 7 pm [21]. Cornes et al. [10] estimated the observation times at 6 am, 3 pm, and 7 pm. Further evidence of the times of the measurements was provided by Pliemon et al. [17] using a statistical analysis based on the temperature measurements. The analysis suggested measurement times at 6 am to 8 am, 3 pm to 5 pm, and 6 pm to 8 pm.
2.3. The Location of the Measurements
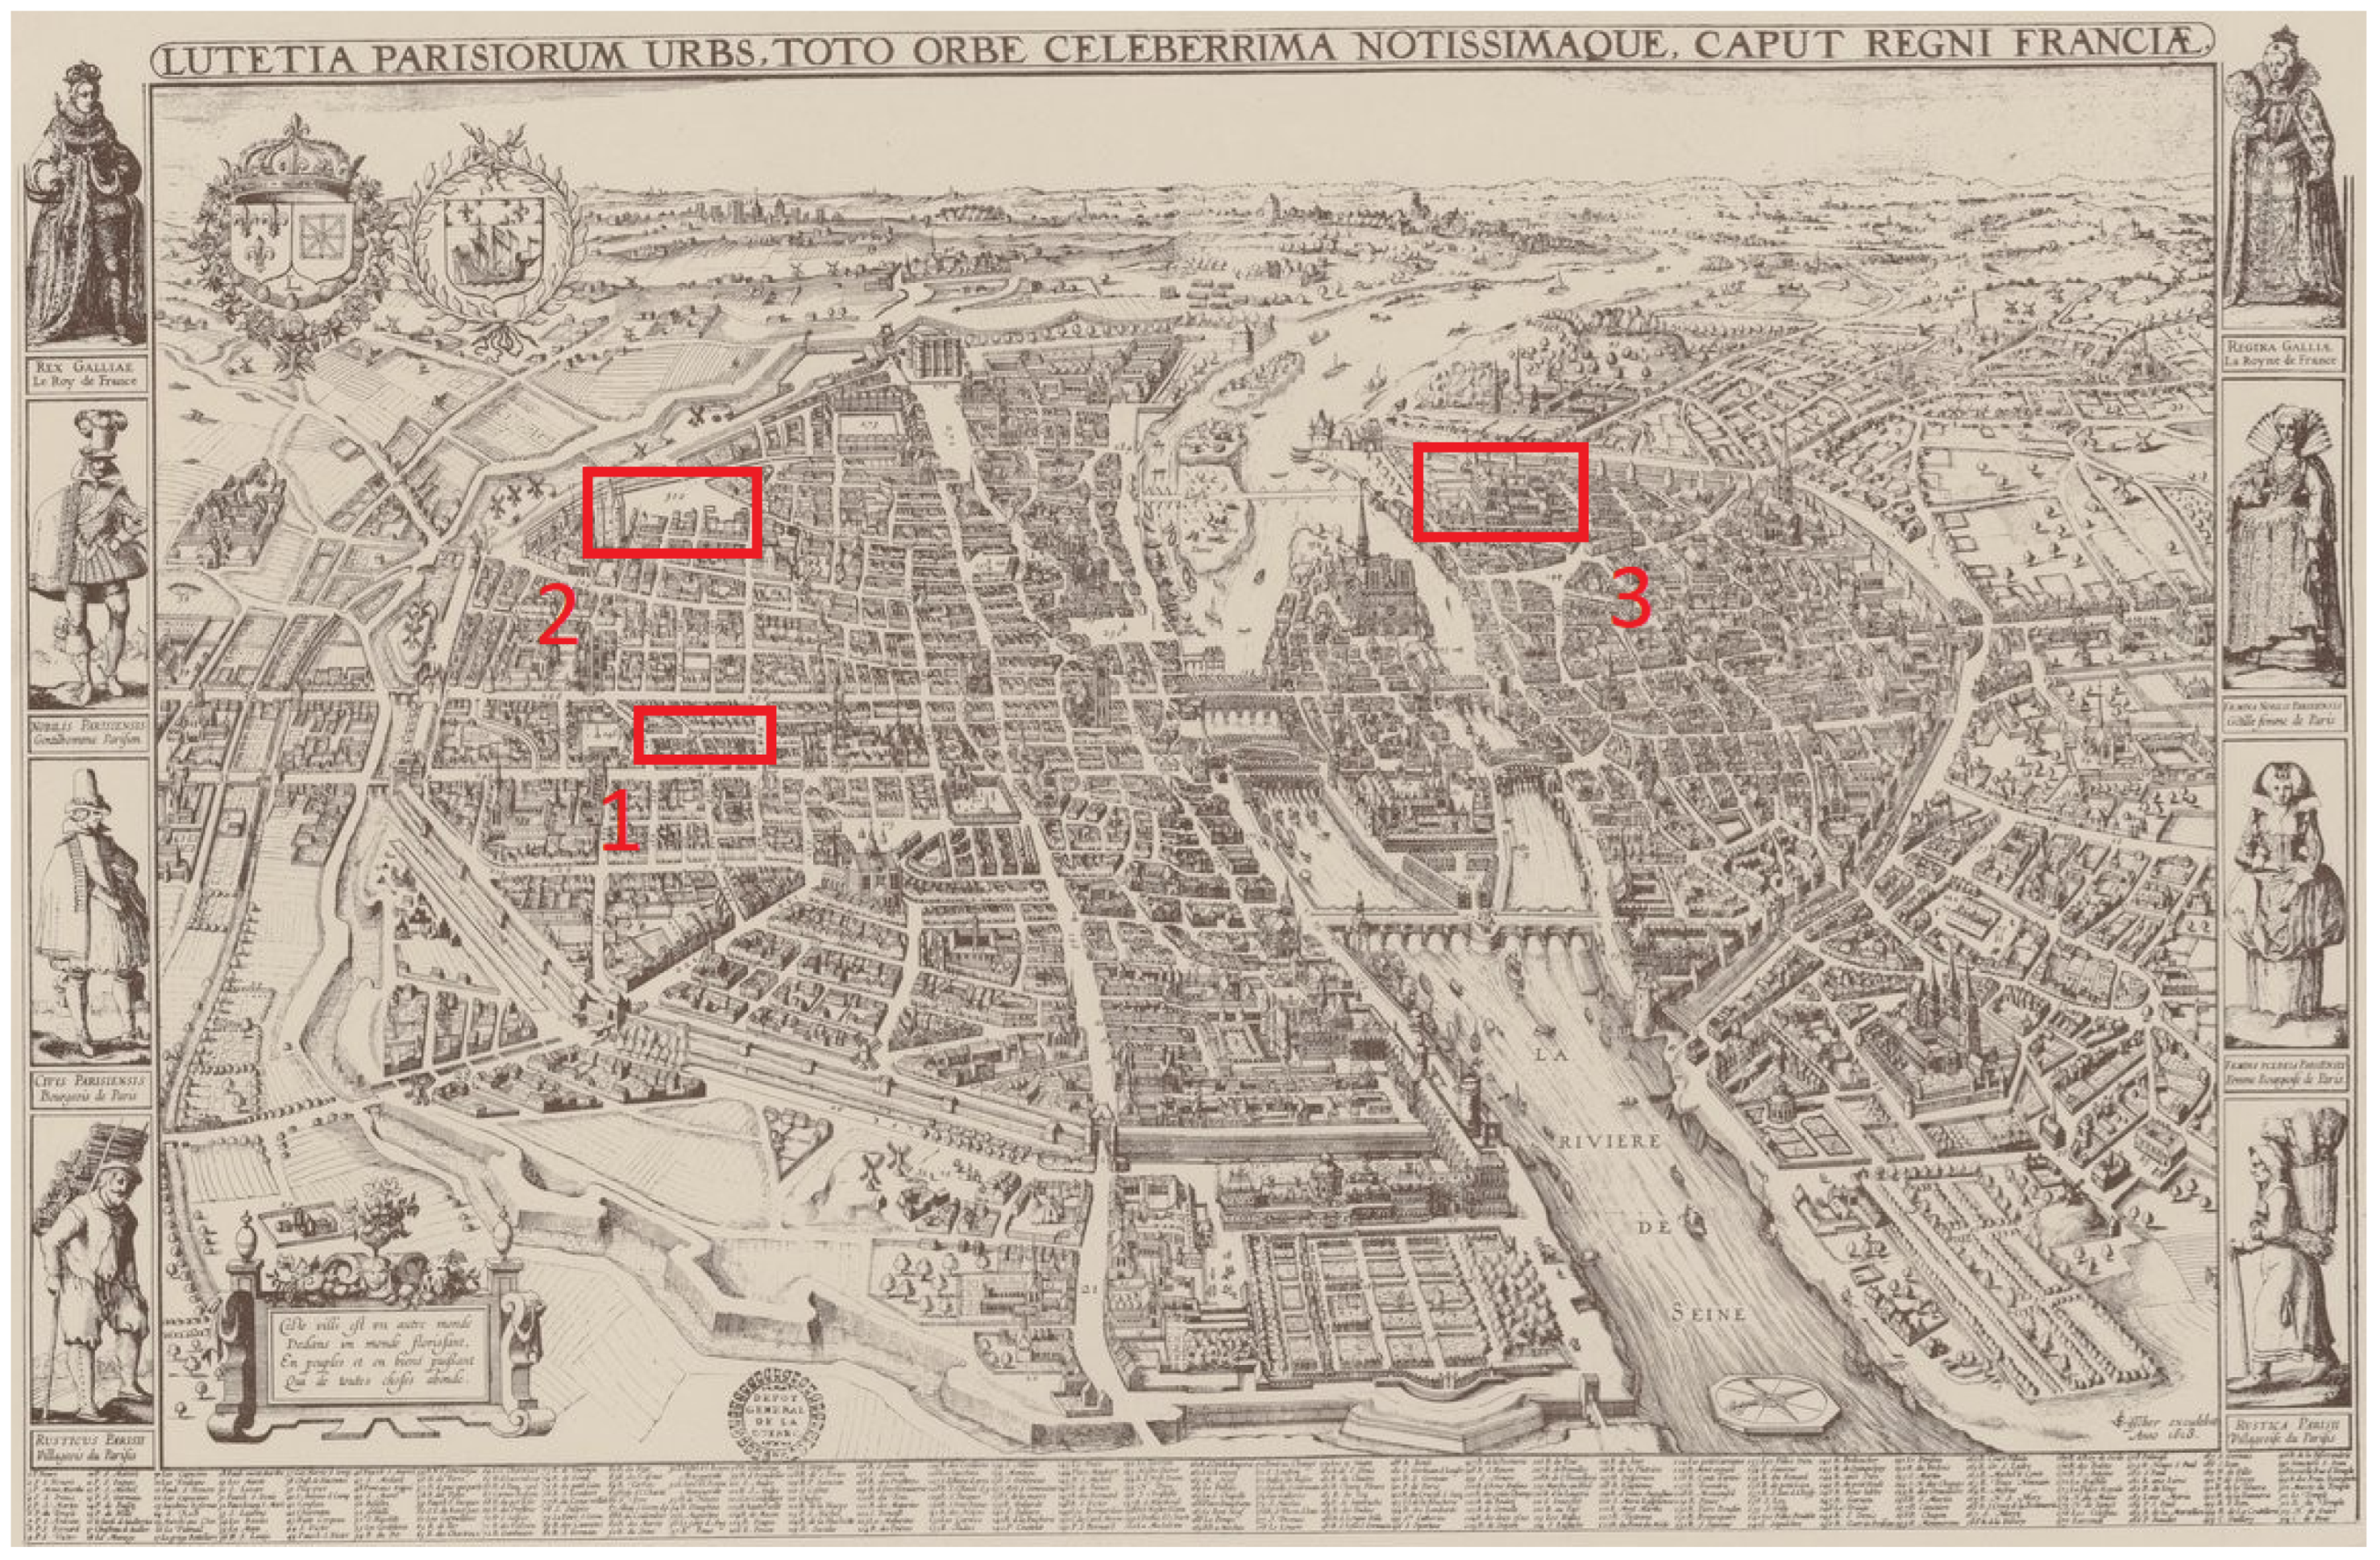
In the map of Paris [22], the marked locations show where Morin lived (see Figure 2). Until October 1685, Morin lived on Quinquempoix Street, then until June 1688 in the Hotel Rohan-Soubisse, where the National Archives are located today. Finally, until his death in 1715, he lived in the abbey of Saint-Victor, which is located at the city’s border next to the Seine [19,21]. This means that the entire series of humidity measurements from 1701 to 1711 were performed at the same location.
2.4. The Measuring Device
The measuring instrument of Morin is not known. At the beginning of the 18th century, there were a variety of different methods for measuring humidity, even though, for example, the definition of relative humidity was not known yet. Already in the 15th century, Nicolaus de Cusanus (1401–1464) and Leon Battista Alberti (1404–1472) used hygrometric fabrics—the former, wool, and the latter, a sponge—to measure the change in weight [23]. Leonardo Da Vinci (1452–1519) is also known to have used cotton to measure humidity [23].
The majority of early hygrometers measured the relative humidity (RH):
where e is the actual water vapor pressure, and is the saturation vapor pressure. The ratio in Equation (1) is not exactly equal but is close to the ratio of moisture in the air to the highest amount of moisture at a particular air temperature. The invention of the first mechanical hygrometer using a human hair is credited to Horace Bénédict de Saussure (1740–1799) [23,24,25]. However, similar methods using different materials had been used before. For instance, Santorio Santorre invented a hygrometer based on the change in length of a ballasted cord or string in 1626 [23]. This hygrometer was further developed by Francesco Folli (see Figure 3) and Vincenzo Viviani (see Figure 4) in the 1660s [23]. In 1687, Guillaume Amontons displayed a hygroscopic hygrometer at the Académie Royale des Sciences; it depended on the change in volume of a vessel/reservoir made of some hygroscopic substance (a leather bag) [23,26]. Another sort of hygrometer grew out of the observation that the awns or “beards” of various seeds twist or untwist as they become dry or moist (for instance, the wild oat) [23]. The invention of an instrument based on this measuring principle is attributed to Emmanuel Maignan (also called Magnanus), who lived in Toulouse from 1601 to 1676 [23]. Robert Hooke improved this instrument further [23]. By at least 1656, it is known that Cardinal Giovanni Carlo de’ Medici had a hygrometer in Rome in which a cord of 4 or 5 m long, fastened at one end, passed horizontally to a pulley and was stretched by a weight [23]. Moreover, condensation hygrometers were already known in the early 18th century. The invention of a condensation hygrometer in 1655 is attributed to Ferdinand II, Grand Duke of Tuscany. This hygrometer collects condensation water, and is therefore not directly related to relative humidity [23]. This short list does not claim to be exhaustive but lists the most significant methods of measuring humidity in the early 18th century. A more comprehensive overview of the history of humidity measurement can be found in Middleton [23] and Camuffo [25].
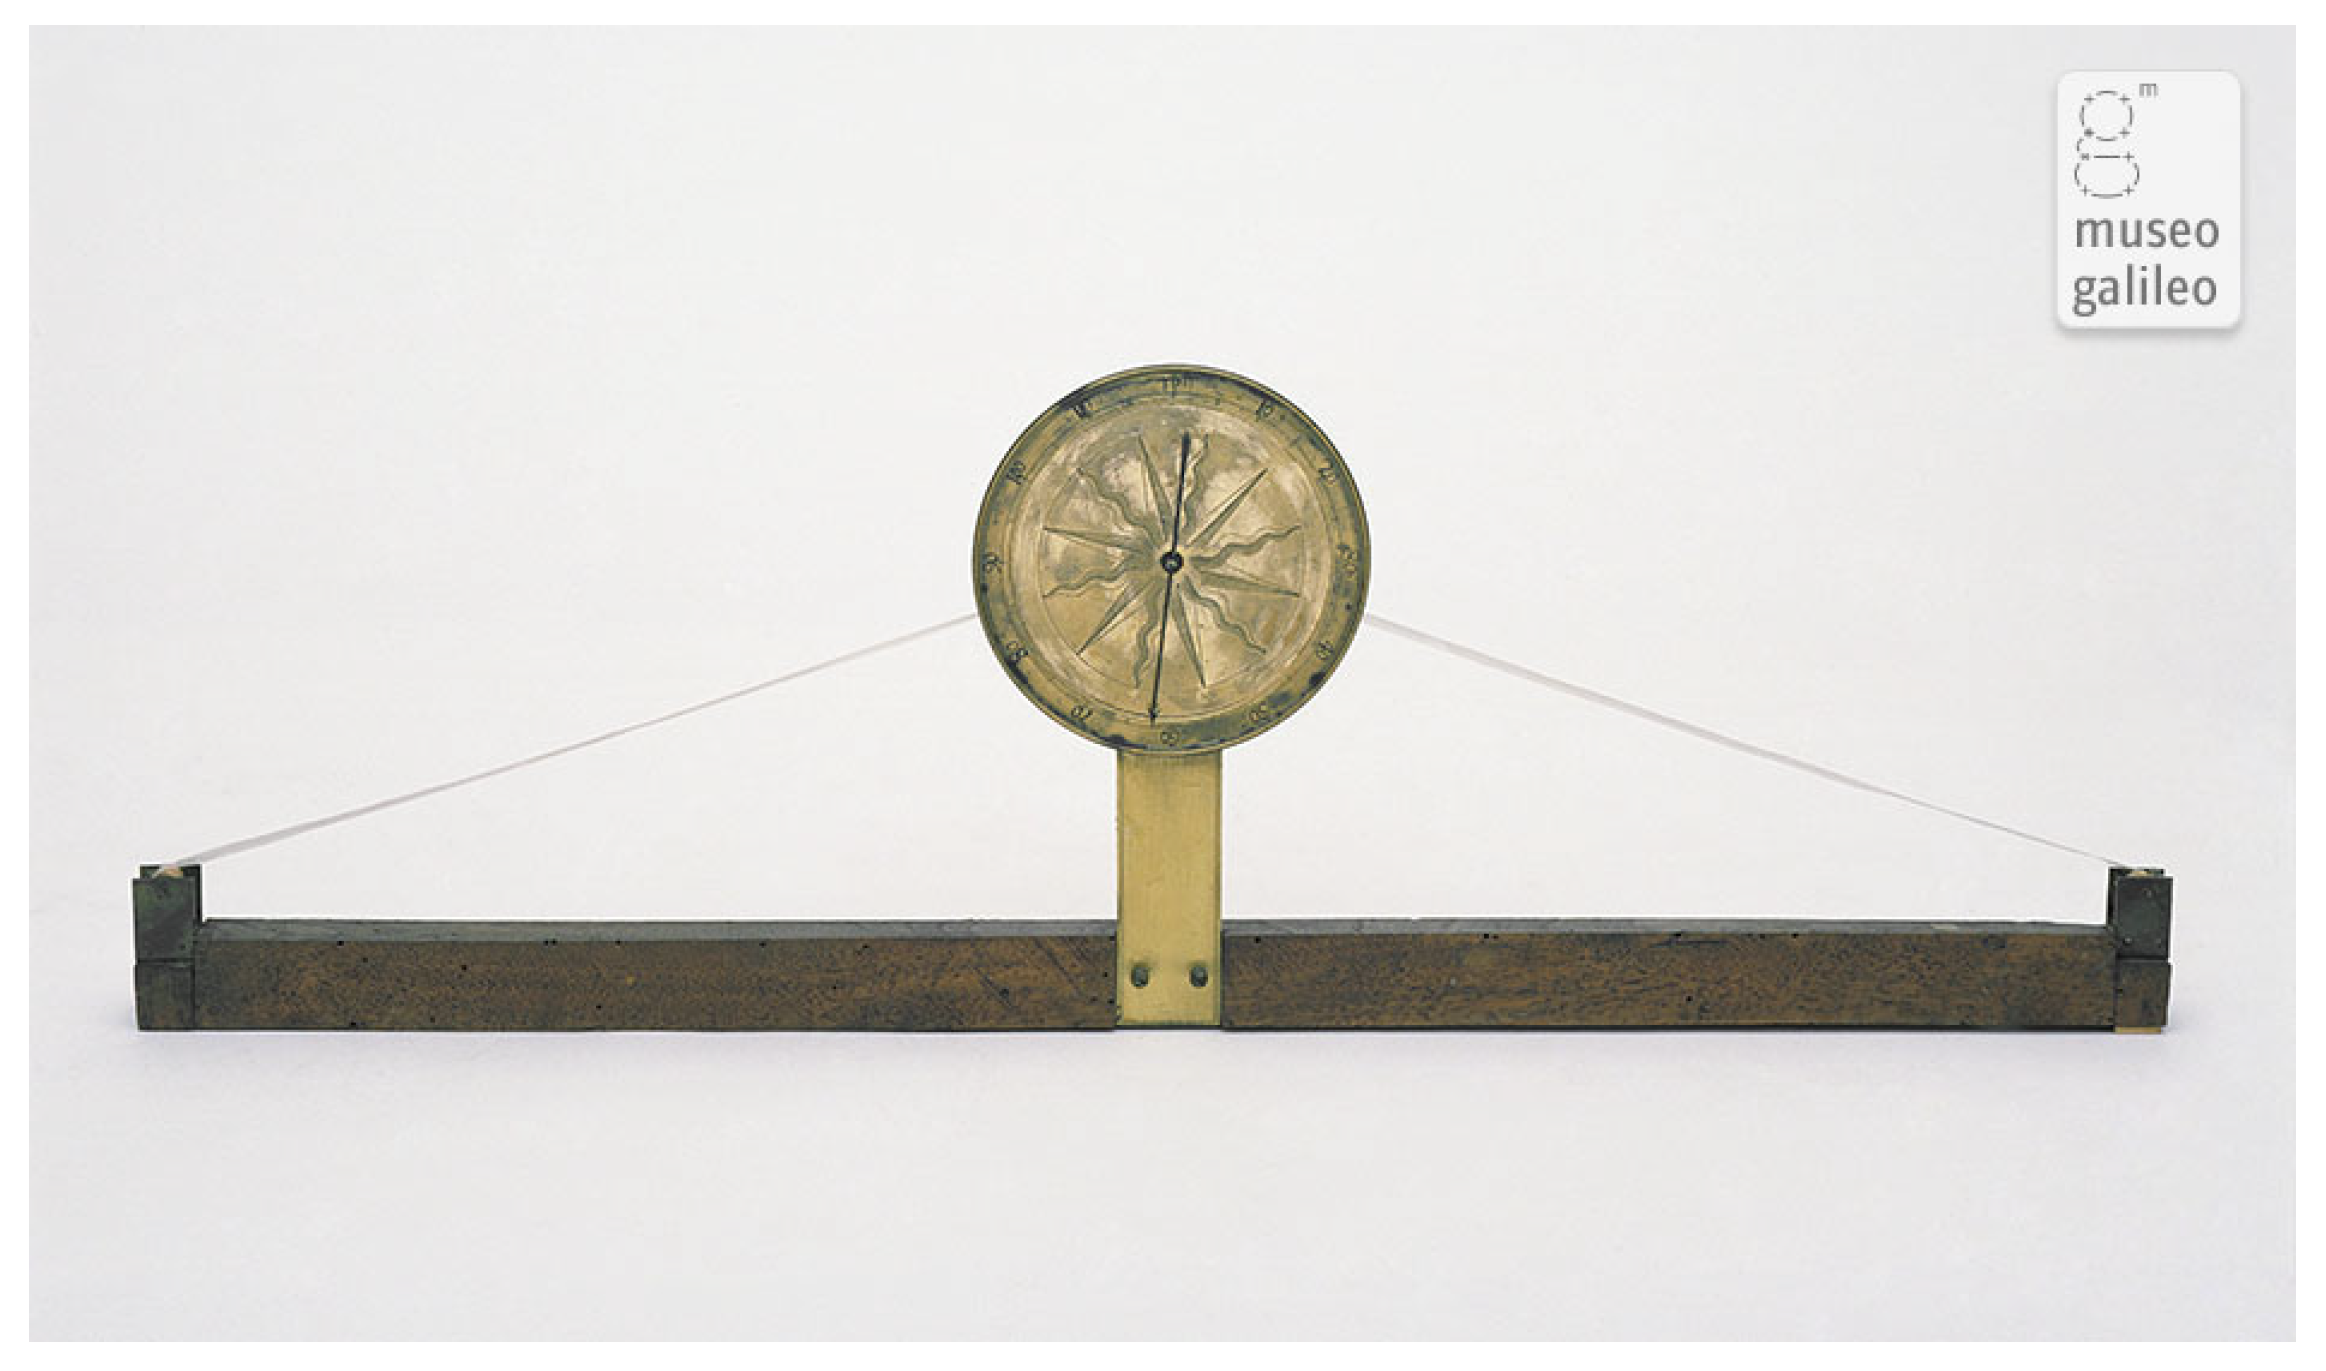
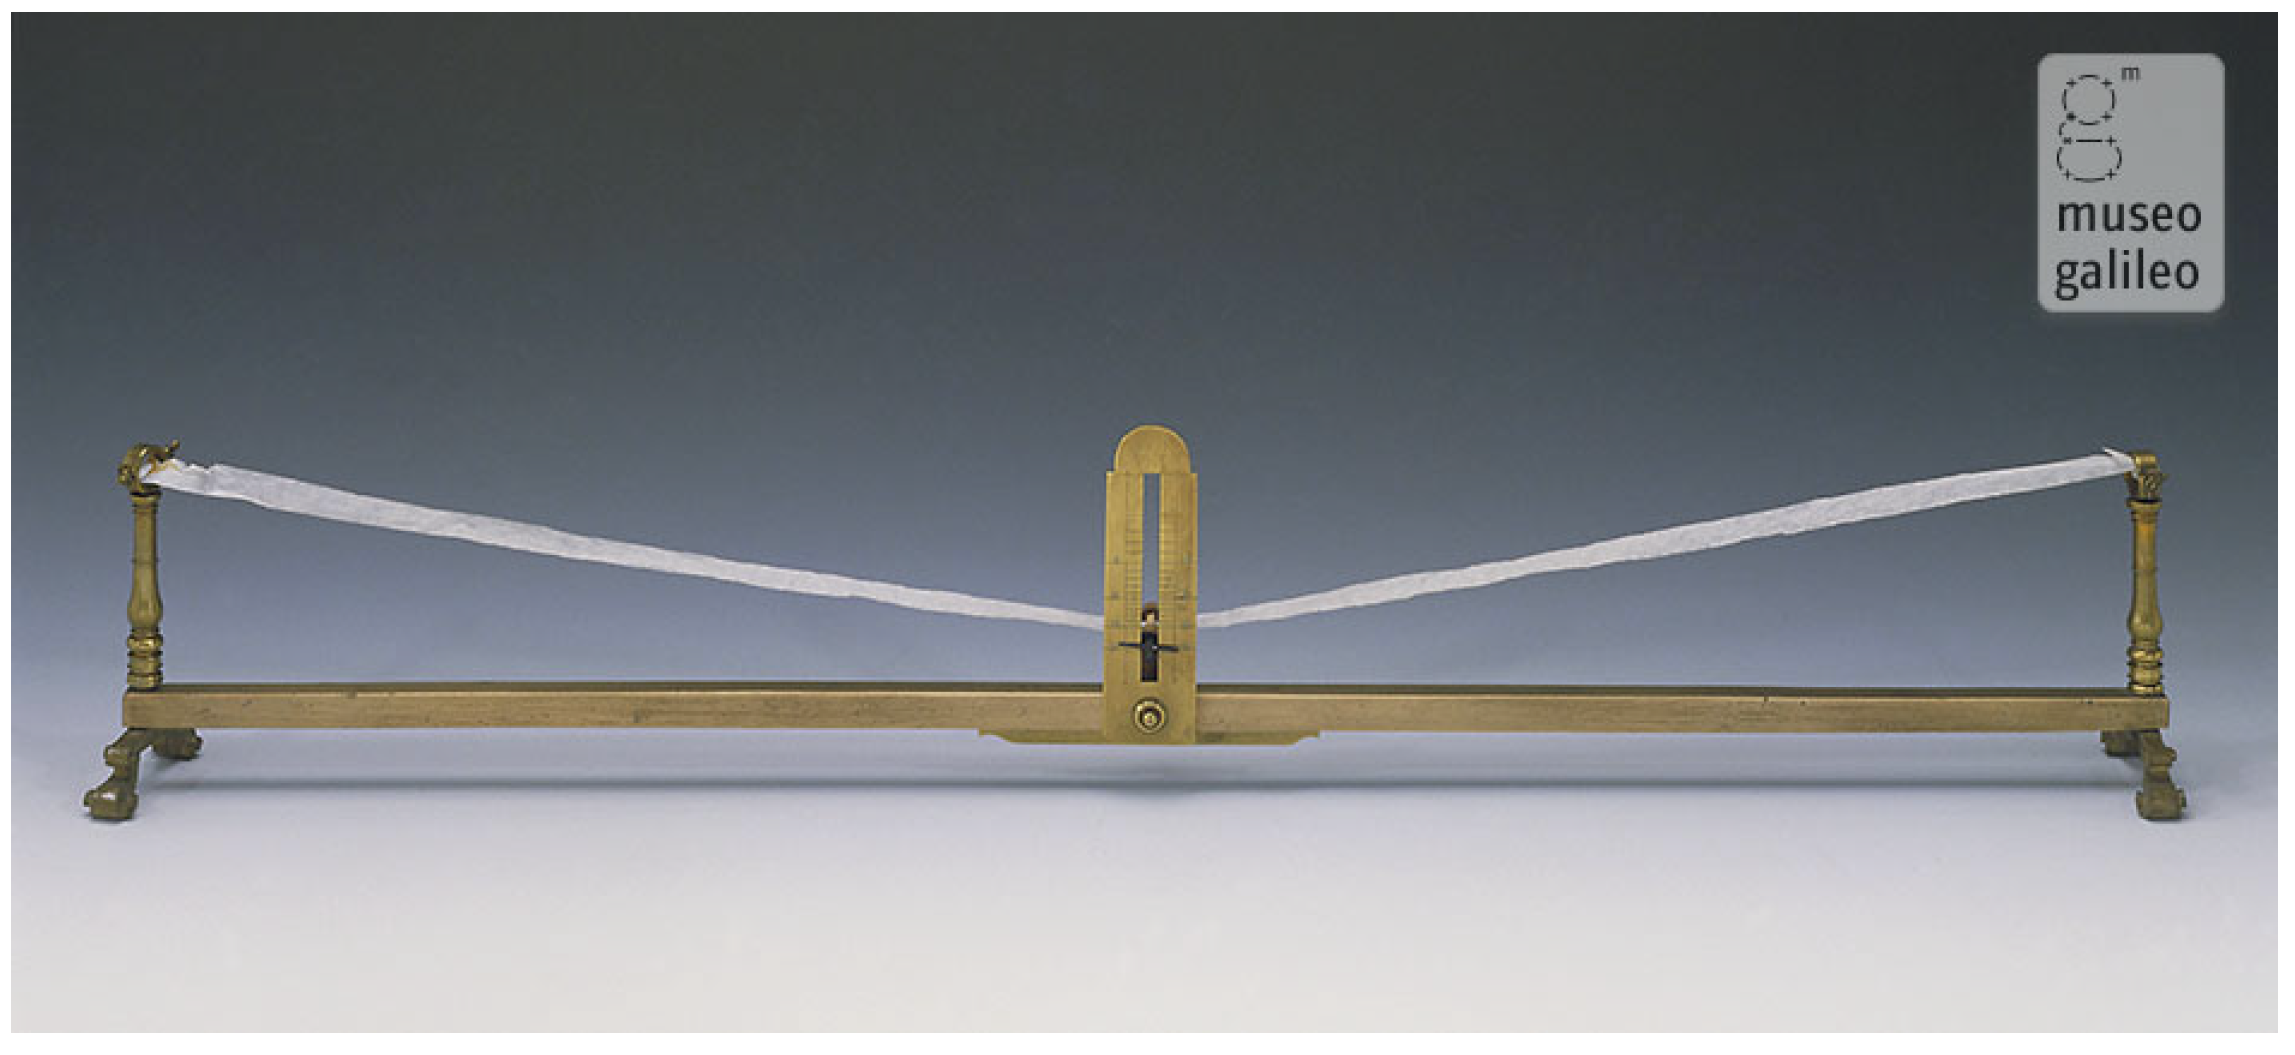
A hint at the measuring instrument that Morin could have used is given only implicitly, namely when he noted, on 11 February 1702, 27 August 1708, 6 January 1709, and 8 October 1709, “papier baisse”, which should mean something like “paper down/decline”. These notes appear in three of four cases after a longer period of exceptionally wet conditions, which leads to a higher probability of ripping, and in all cases a step to dry values follows after the above-mentioned dates. Two of these jumps can be explained by the other measurements/observations. Furthermore, on 1 August 1704, he noted, after a longer period of exceptional dry values, the word “change”. Few instruments used paper for measuring humidity. Among these, to our knowledge, are the measuring instruments invented by Francesco Folli, Vincenzo Viviani and George Adams, Senior. The latter, however, was invented only in the mid-18th century and can be ruled out. Folli’s and Viviani’s instruments use similar principles, namely the shrinkage or swelling of paper, parchment or leather, and are due to the construction meant to be used indoors. It is known that the Medici, who founded the first meteorological network, sent measuring instruments to some cities in Europe. This is how this measuring instrument could have found its way to Paris. This is, in the case of Folli’s instrument, Folli himself explicitly stated “In 1665, having settled in Florence, he (Folli) presented the instrument to Grand Duke Ferdinand II de’ Medici” (1610–1670) who—as Folli himself reported—“seemed to appreciate it, and had some copies made, which he promptly sent to various Princes of Europe” [23,27].
The measuring principle of Folli’s instrument works as follows: A square-sectioned wooden rod carries a small roll at each end. One of the rolls is locked and thus fixes one end of a paper ribbon, while the other end passes over the second roller. It originally supported a small (missing; see page 102 in Camuffo [25]) weight that kept the ribbon in tension. The center of the rod holds a vertical support for a decorated brass dial fitted with a circular graduated scale. On the dial, a pointer is pivoted with a pulley: the ribbon passes over the pulley and its changes in length, in response to change in atmospheric humidity, are indicated by the pointer (Museo Galilei, Florence). It is also stated that the paper tore from time to time and was later replaced by something else. Note that the measurement principle is explained a little differently in Middleton [23]. The measuring principle of Viviani’s instrument worked as follows: It was based on a strip of paper with a small ballast in the middle, forming a V, that was raised in dry conditions (i.e., flatter V) and lowered in wet ones (i.e., sharper V with deeper position of the ballast). The note “papier baisse” (paper down/decline) is very important, because it may suggest that Morin used Viviani’s or Folli’s instrument. Two translations are possible here, namely that the paper fell due to the measuring principle or that the paper ripped and consequently fell. The former translation speaks clearly for Viviani’s instrument because of two reasons: (i) the strip in Figure 3 (except the external ballast missing) always keeps the same shape either while shrinking or swelling; and (ii) the paper is not sufficiently resistant to keep a ballast heavy enough to generate friction and rotate the pivot. The latter translation speaks also for Viviani’s measuring instrument. Although the ripping of the paper may be possible for both instruments, point (ii) speaks again against Folli’s instrument. According to these reasons, we hypothesize that Morin used Viviani’s instrument. Note that for the latter, but not the former, translation, the dates on which “papier baisse” was noted are also to be seen as inhomogeneities since changes were made to the instrument.
The task now is to show whether Morin obtained plausible measurement results in the sense that they correspond to the characteristics of relative humidity measurements, compared with modern measurements.
2.5. Reference Data
We adopted quality-assured daily data from ERA5 (1940–present) to compare the total cloud cover (TCC) to the contemporary conditions [28]. As a reference period for the daily mean temperature, daily minimum temperature, daily maximum temperature, daily precipitation sum, daily mean sea level pressure, and daily mean relative humidity, we used the observations of E-OBS version 27.0e [29]. As reference time period, we used the normal climate from 1991 to 2020. Furthermore, we used pressure data measured by Morin [11].
3. Methods
3.1. Quality Check of Digitization
A great deal of effort was put in to checking the plausibility/correctness of the transliterated data. By means of the guide of Brönnimann et al. [30], a double key entry (double entry by hand and following comparison), followed by post-processing (checking for ureasonable values, sample tests) was chosen for the digitization process. The average error of the sample tests (mean of three time periods of three months each) was 0%.
3.2. Validation
To validate Morin’s measurements, we calculated the Spearman correlations with other measurements/observations. Furthermore, we analyzed a time period of half a year to see if the measurements make sense.
4. Results
4.1. Characteristics of the Measurements
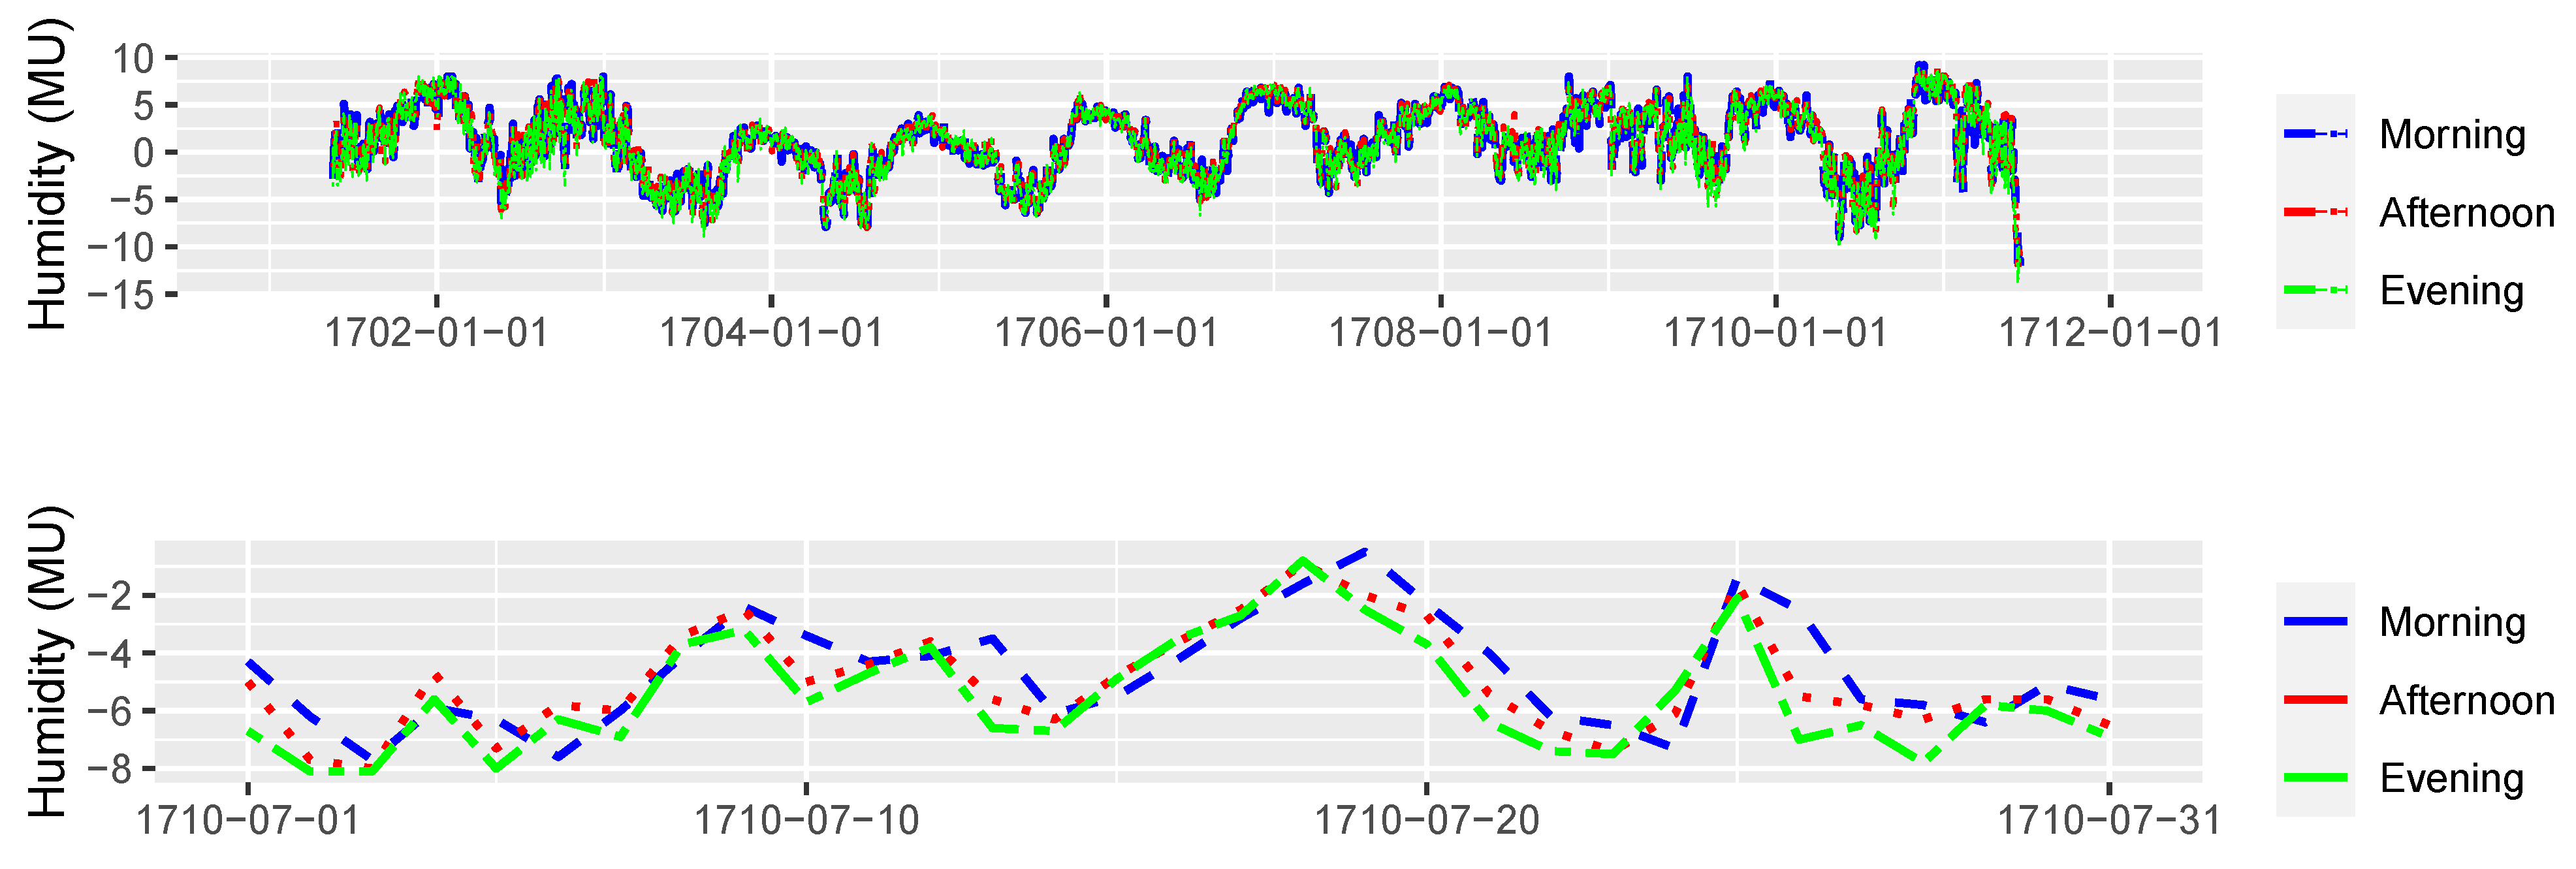
Striking characteristics of the time series can be seen in the upper panel of Figure 5: an unusually strong annual cycle with the highest dry values in summer and the highest wet values in winter as well as the lack of any daily cycle. The lower panel of Figure 5 shows the time series of one month, July 1710. Here, the diurnal variation is easier to see, which is much less pronounced than one would expect for relative humidity. One would expect, when measuring relative humidity, a weak-to-disappearing annual cycle for the morning measurements and a recognizable annual cycle for the afternoon and evening measurements. Note that positive values in Figure 5 mean wet conditions, and negative values mean dry conditions. To the best of the authors’ knowledge, there are no longer humidity measurements from the 18th century for comparison, except those in Domínguez-Castro et al. [31], who discovered humidity measurements, performed with a measuring instrument modified after Folli, from Valencia. These were carried out by Francisco Antonio Espinos and published in the newspaper Diario de Valencia between 1790 and 1835. Although the daily humidity cycle of Valencia differs from Paris due to the circulation of the sea breeze, we were able to find similarities in the characteristics of the raw data using the data made available to us by Domínguez-Castro. Namely, the daily cycle is also weakly pronounced, and an annual cycle is also recognizable for all measurement periods. The fact that a daily cycle is not reflected by the measurements can have several reasons. As a first hypothesis, the instrument could have a very slow response. This is hardly credible for a paper ribbon. As a second hypothesis, the paper ribbon could be substituted with a strip of parchment or leather, of a certain thickness, that would justify the mechanical strength needed to hold the ballast. Since Morin mentioned “papier baisse” four times more or less over the entire measurement period, this hypothesis can also be rejected. As a third hypothesis, the instrument was kept indoors, in a room with thick brick and lime–plaster walls with poor ventilation. The daily cycles could be further reduced if the room had humidity buffers like a wooden floor and furniture, or even paper (e.g., library). This hypothesis seems the most likely for Morin, since, as will be shown later, Morin performed his measurements indoors.
4.2. Correlation with Other Meteorological Variables
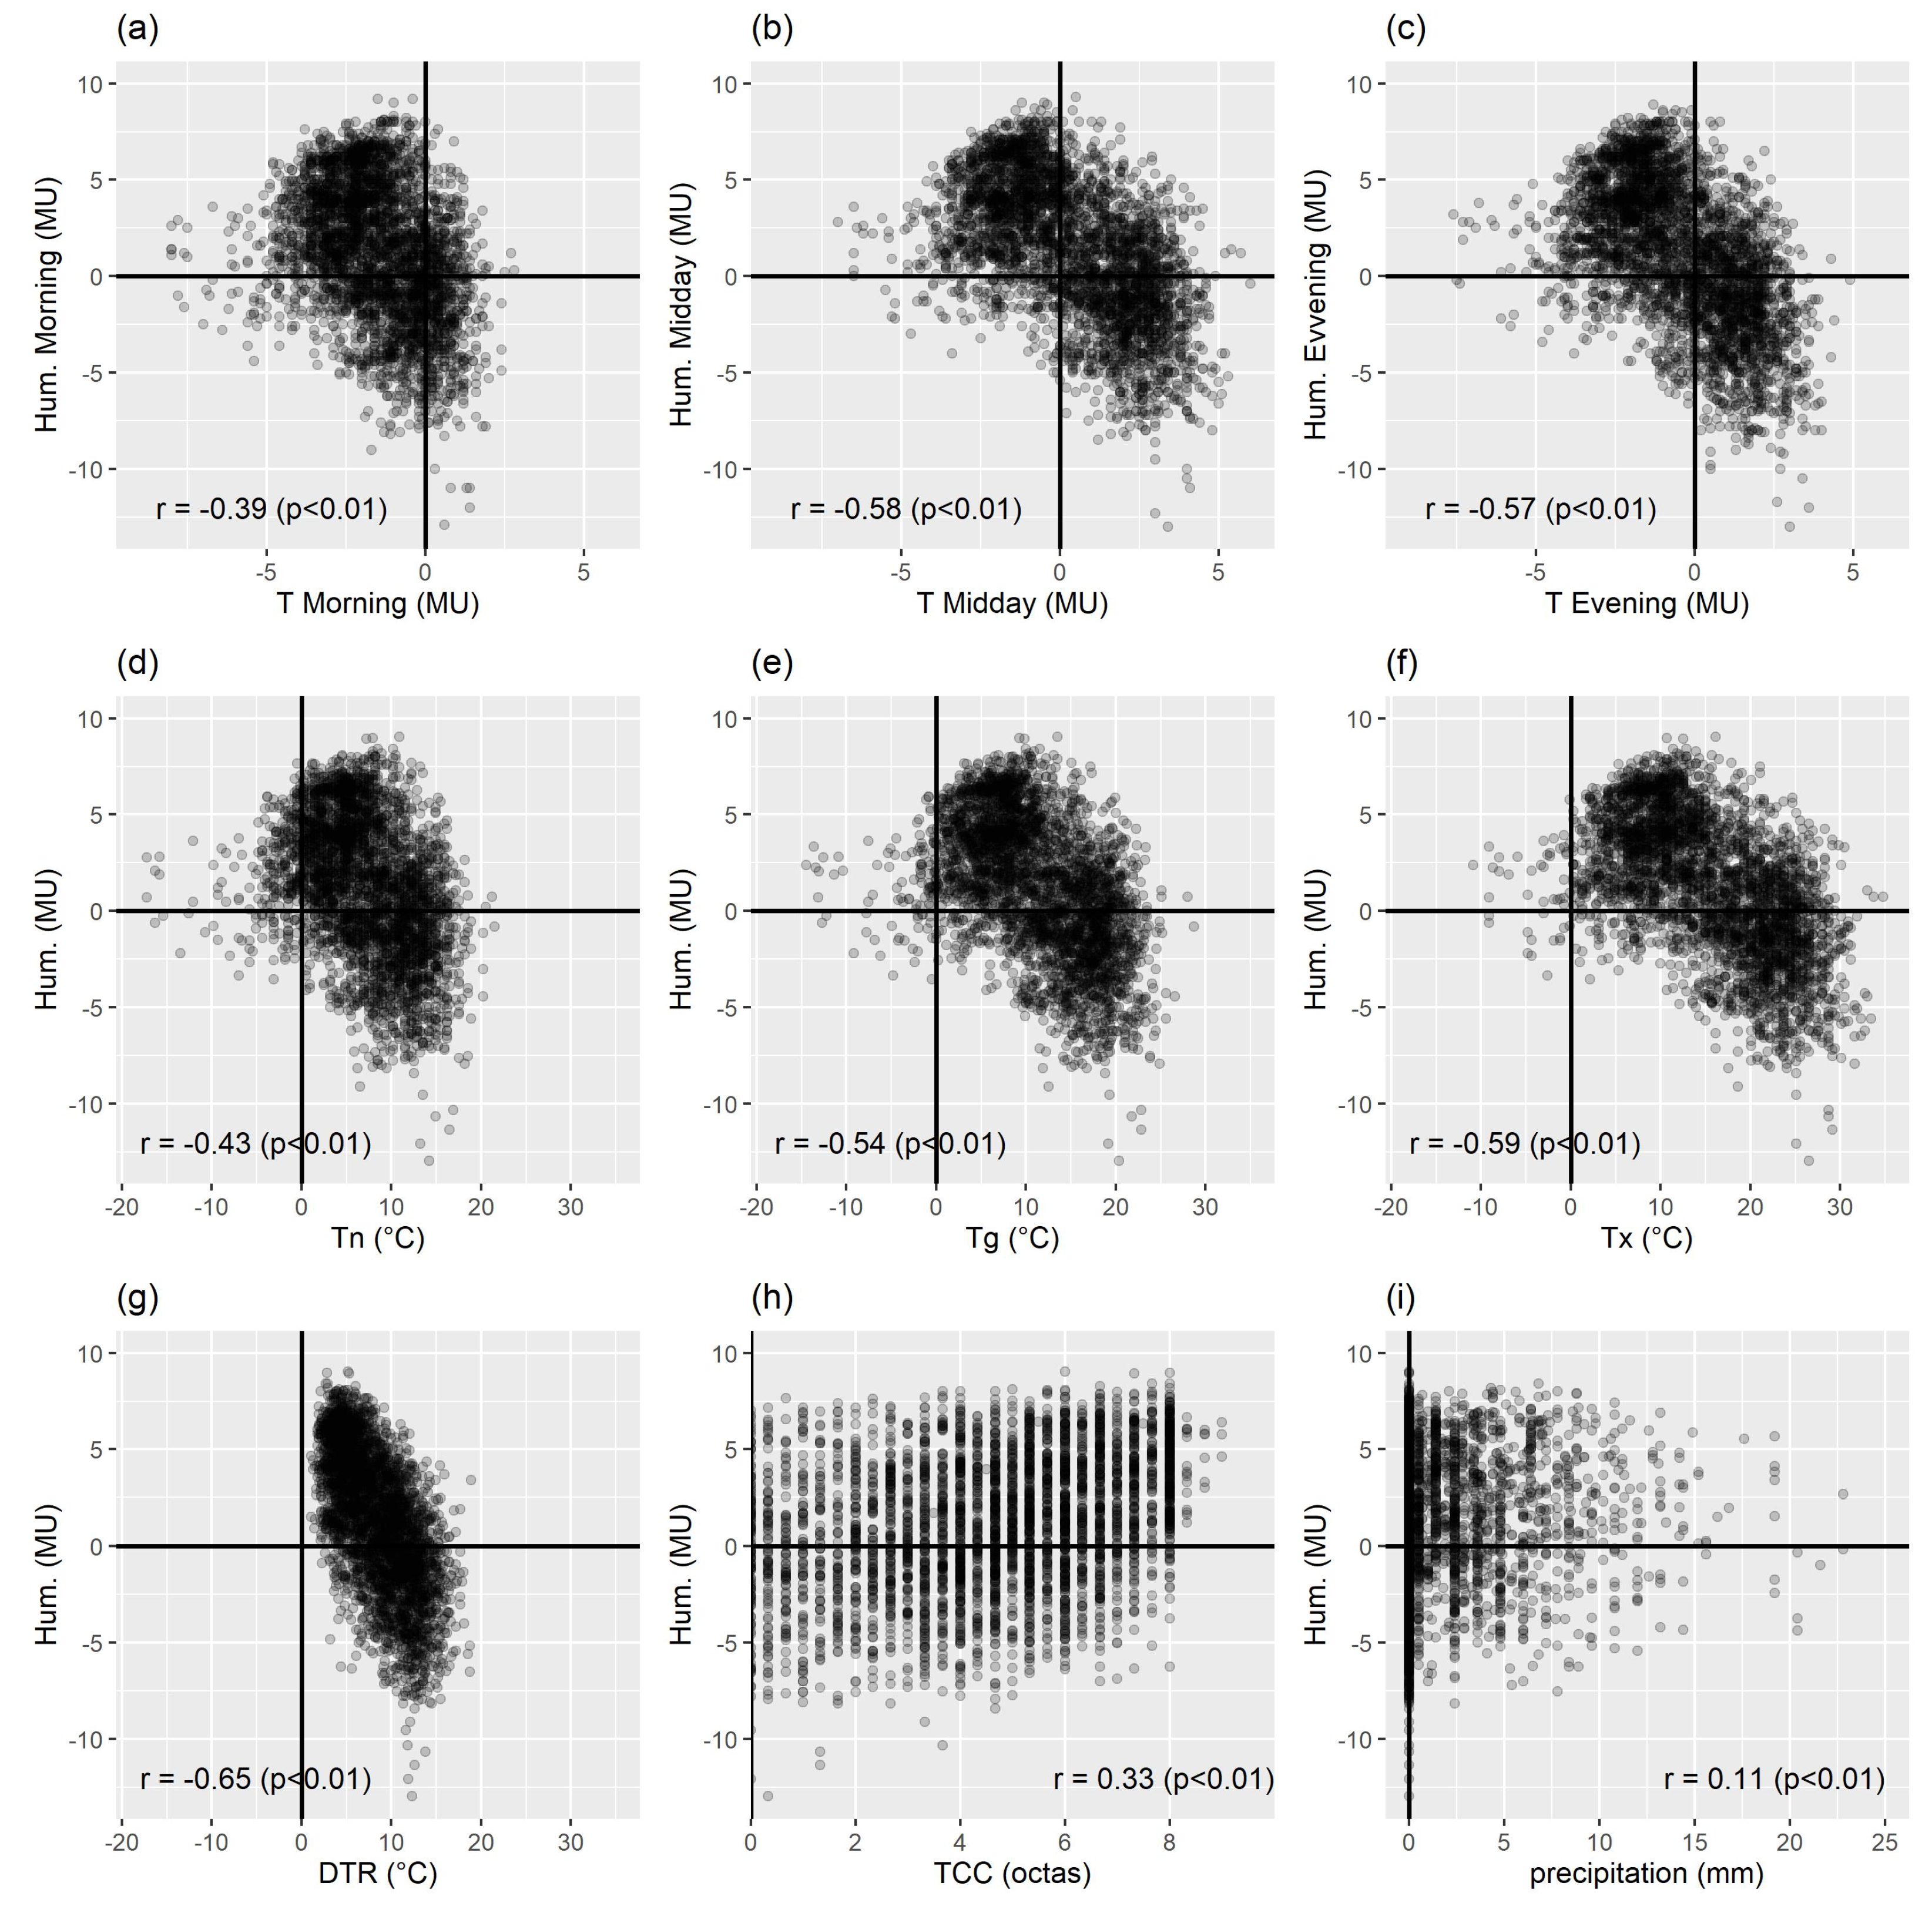
The correlation analysis of the humidity measurements with the different measurements/observations of Morin yields plausible results. The results are summarized in Figure 6, where (a) to (c) show the correlation with the morning, afternoon and evening temperatures; (d) to (f) the correlation with minimum (Tn), mean (Tg), and maximum (Tx) temperatures; (g) the correlation with the diurnal temperature range (DTR); (h) the correlation with the total cloud cover (TCC); and (i) the correlation with precipitation. Figure 6 shows in each case a scatterplot of the correlated variables, and the Spearman correlation coefficient. In (a) to (c), we use the morning, afternoon and evening humidity, and in (d) to (i), the daily mean of humidity for the correlation analysis and visualization. Note that TCC also accounts for foggy days, which are given a number of 9 octas in the data.
In general, drier humidity measurement values can be expected for higher temperatures. This is expressed in a negative Spearman correlation coefficient in (a) to (f) and is fulfilled for all graphs. Furthermore, the Spearman correlation coefficients between humidity and Tn, Tg, and Tx show similar results compared to the E-OBS data. For the Morin measurements, the coefficients are , and . The correlation with the diurnal temperature range is for the Morin data. The Spearman correlation coefficient with total cloud cover is , and is thus a plausible result. But the Spearman correlation coefficient with precipitation, which is only , is unreasonable.
As a comparison, the correlation coefficients for the E-OBS data are , and , , and . In each case, the correlation with the maximum temperature is the highest, and the correlation with the minimum temperature is the lowest. However, the hygrometer data are a little more temperature dependent in Morin’s measurements. The most significant difference occurs in the correlation with precipitation. The lower correlation with cloud cover and precipitation can be explained because Morin took measurements most probably indoors (see later), i.e., abrupt changes in humidity (e.g., thunderstorms) cannot be displayed. The comparable correlations of relative humidity with various climate variables of the E-OBS data clearly show the plausibility of Morin’s humidity measurements.
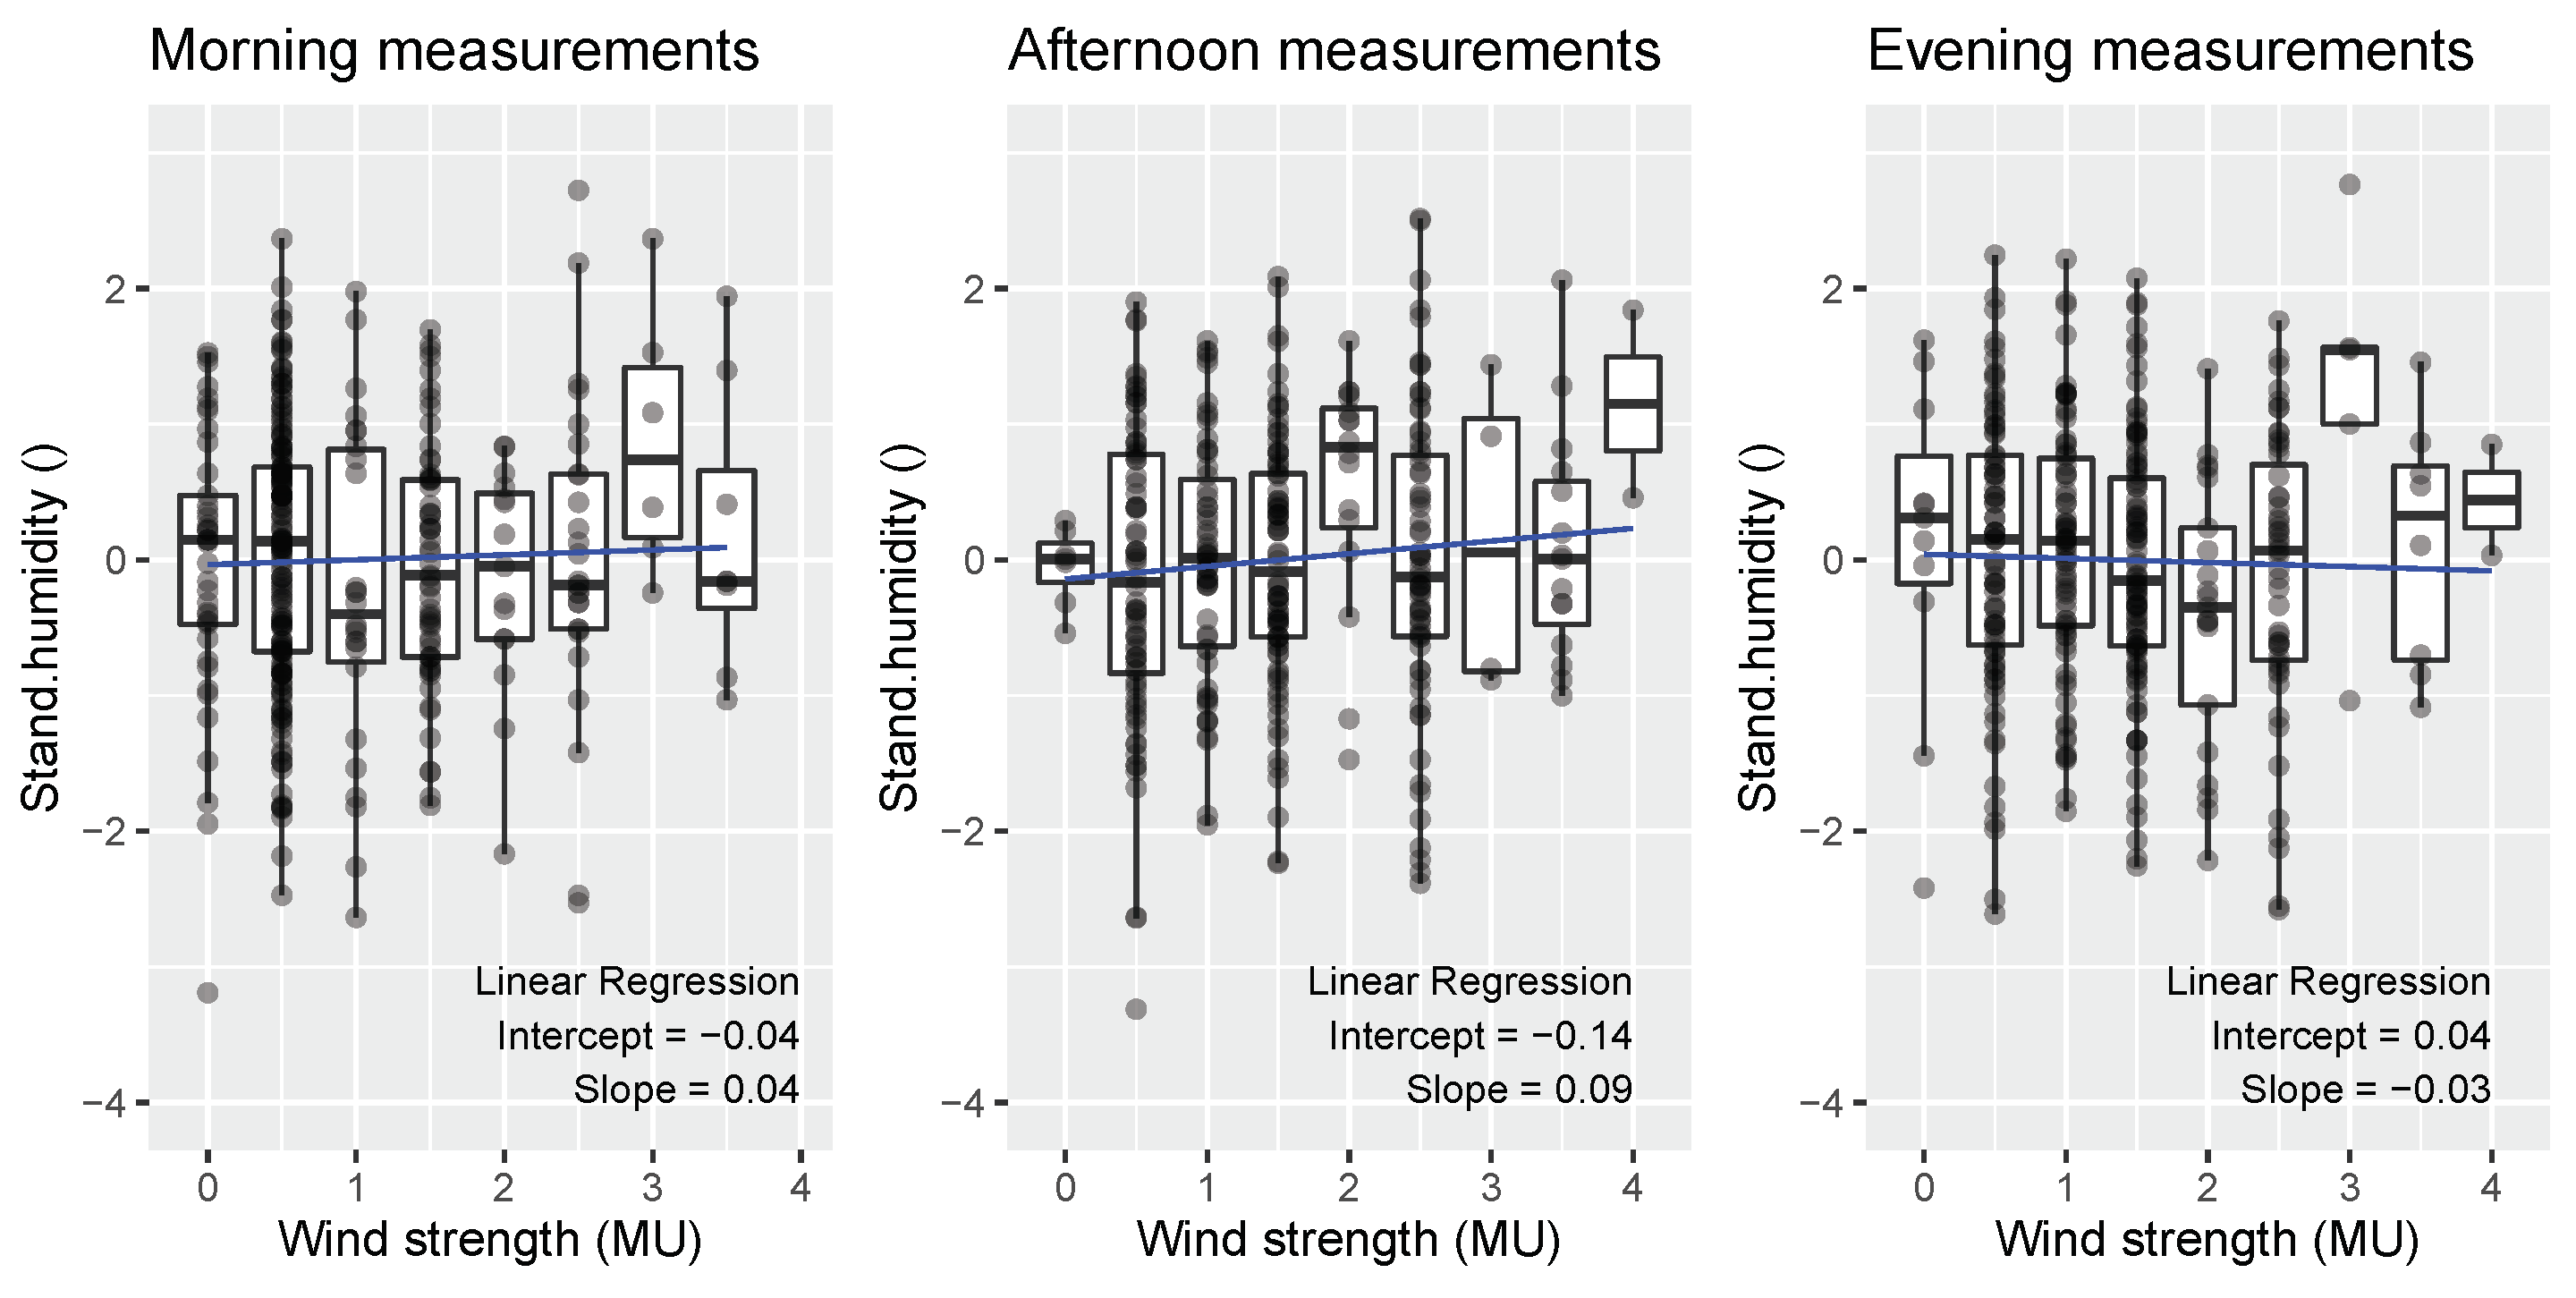
One question which needs to be further discussed is how the measuring instrument was positioned, i.e., whether Morin performed an indoor or outdoor measurement, and if outdoors, whether it was protected from the wind or not. The instruments of Viviani and Folli were conceived for indoor use only. These were built of wood, with decorations and colored items that are not resistant to the outdoors. Wind-borne drops of rain, or dew, or high temperatures in case the instrument was reached by solar radiation would have irreversibly damaged the instrument. This fact is confirmed by the following analysis of the dependence of the humidity measurements with the wind force. Figure 7 shows box plots of the standardized humidity measurements as a function of the wind strength (0 means no wind and 4 means strong wind). We could not find any dependence of wind on the humidity measurements, and so conclude that Morin, also due to the well-matching correlations with the other variables, carried out his measurements indoors. Wind directions are also available from Morin for the year 1707. Interestingly, the annual means of the standardized humidity values show a tendency towards slightly negative values for winds from the north and east and slightly positive values for winds from the south and west. Thus, Morin took measurements indoors, and the comparability of the correlations with the E-OBS data suggests that the ventilation was not so poor.
4.3. Day-by-Day Analysis
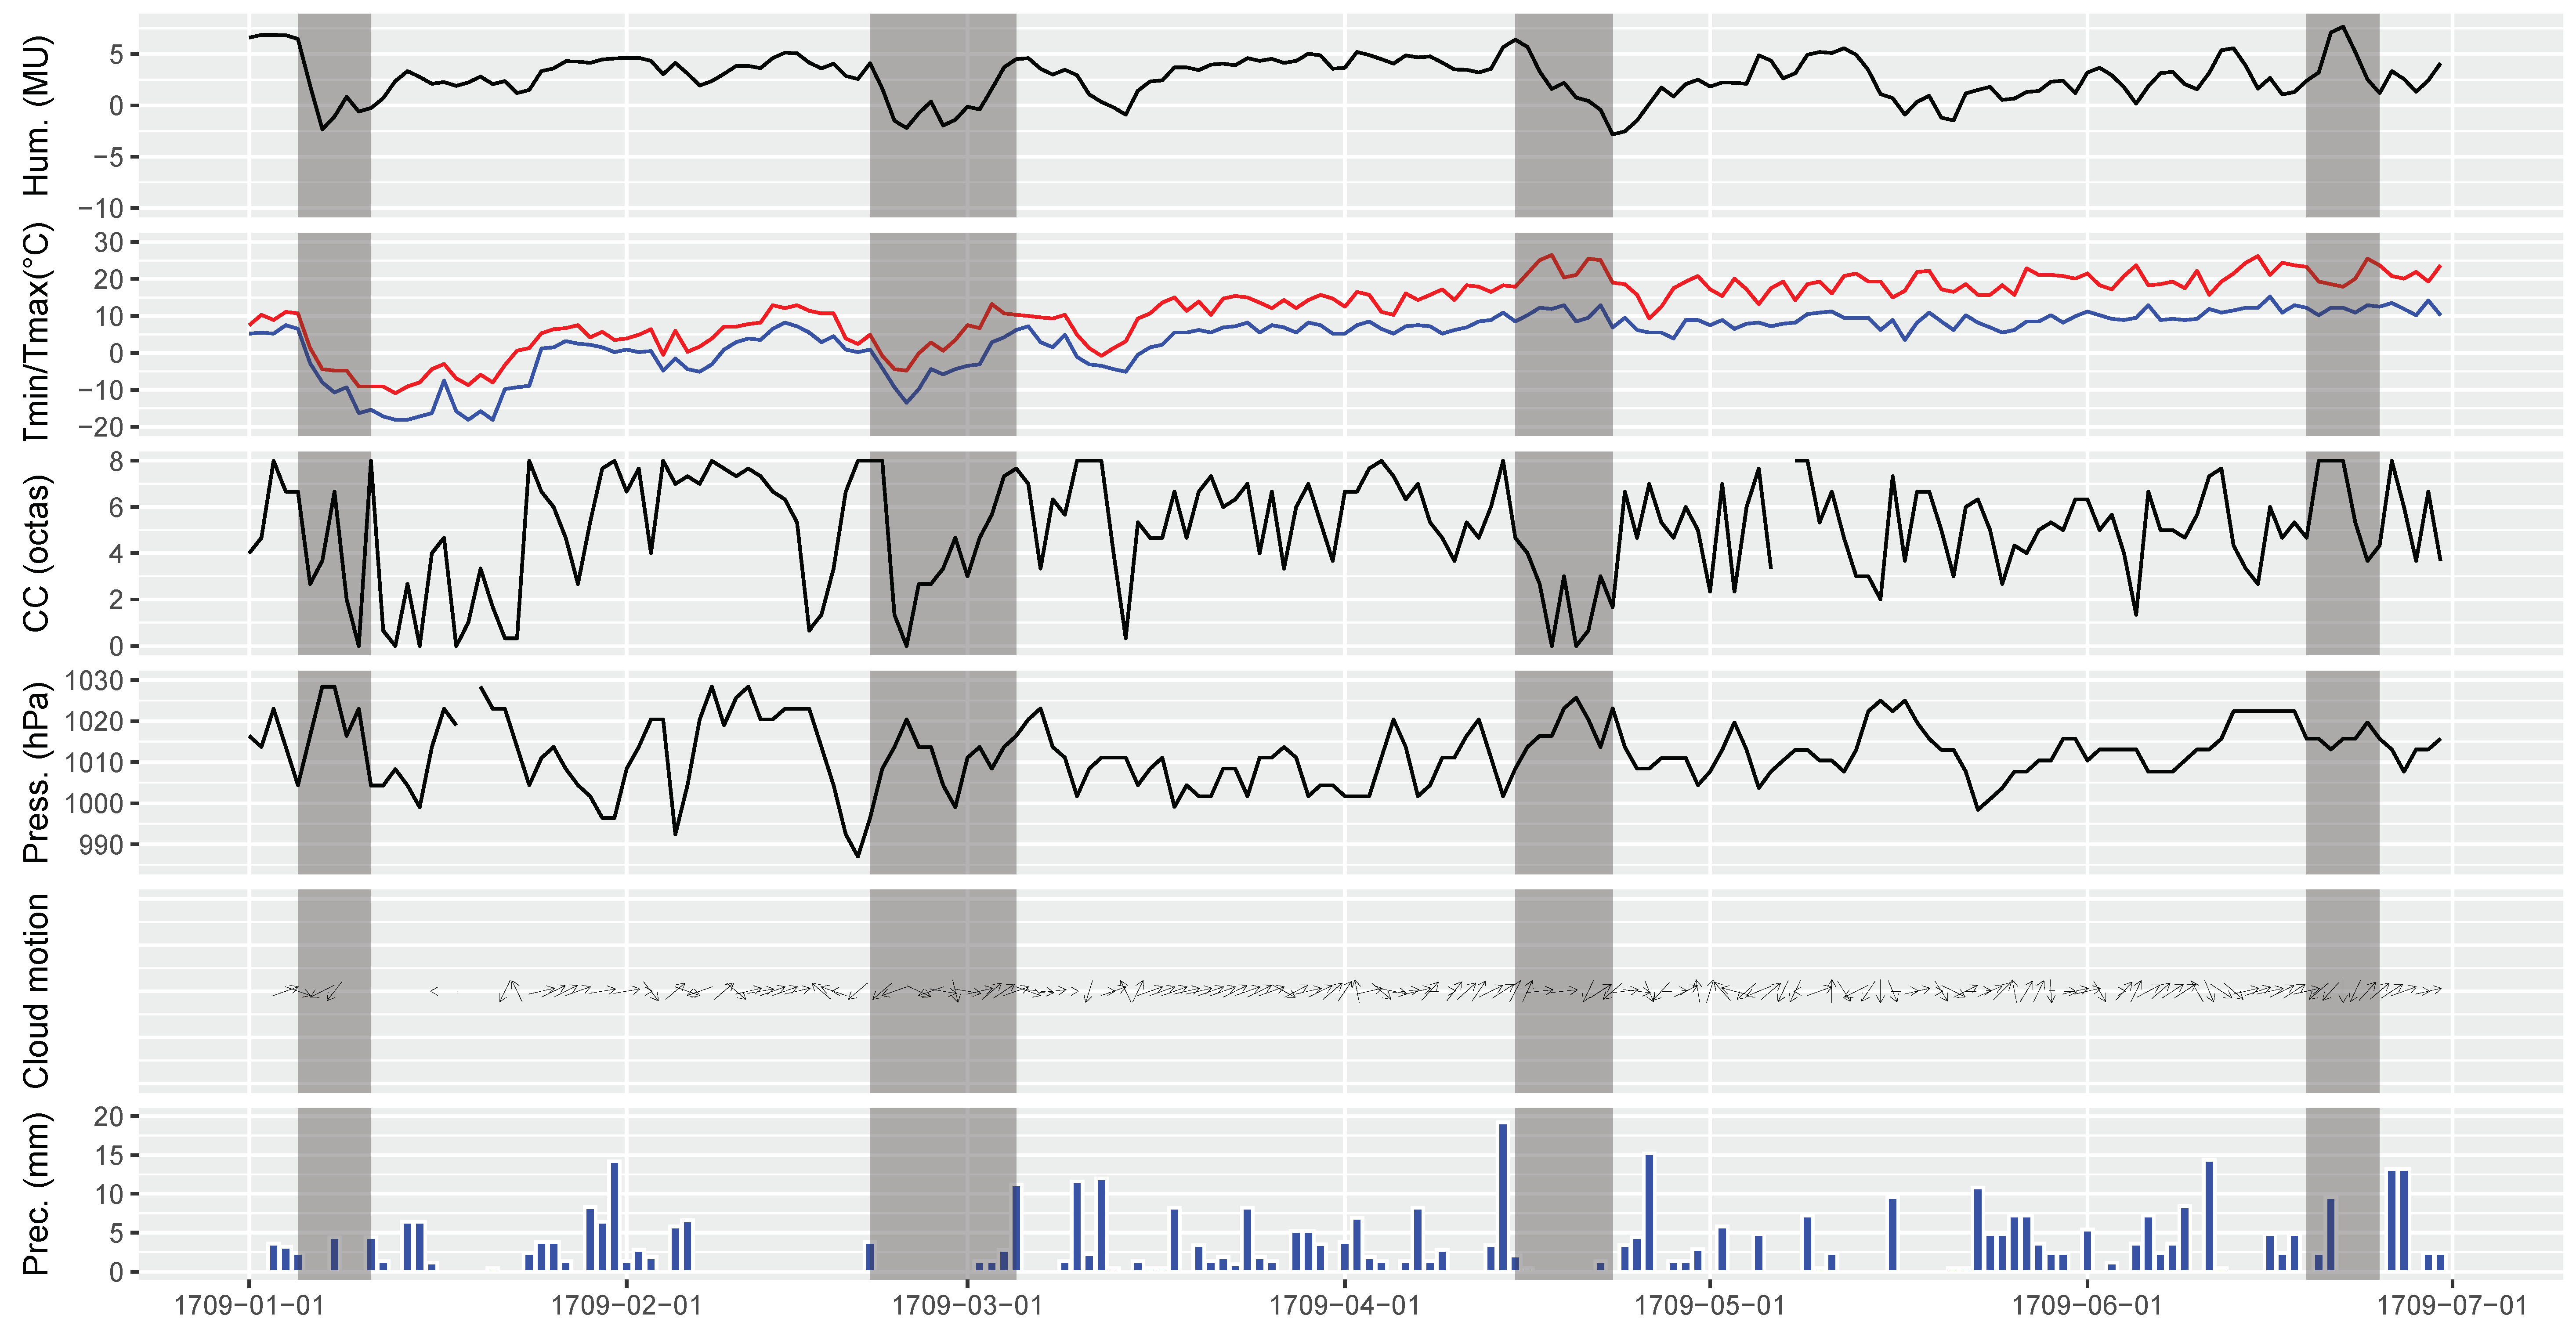
The variety, as well as the temporal resolution of Morin’s recorded climate variables, allows us to assess the hygrometer measurements using a day-by-day analysis. For this purpose, Figure 8 shows the humidity measurements in Morin’s unit, the temperature in degrees Celsius, the cloud cover in octas, the mean sea-level pressure in hPa [11], the direction of the movement of the clouds, and the precipitation in mm over the period from January 1709 to June 1709. We chose the first half of 1709 because it includes the cold winter of 1708/09. In the following lines, we analyze in more detail the time periods in which the hygrometer data undergo strong changes. These are shaded dark gray in Figure 8. In all selected time periods, the changes in the values of the hygrometer measurements can be explained on the basis of the other measurements/observations.
The first period marks the beginning of what is considered in the literature to be an extremely cold winter. On 6 January 1709, the wind direction on the ground changed from west to east (not shown in the graph), with winds of maximum strength according to Morin’s scale being recorded until 7 January in the evening. The direction of cloud movement changed on 7 January, from west to east. Temperatures dropped drastically, with a minimum of −18 degree Celsius first on 13 January and on the following days. The mean sea-level pressure was 1010 hPa on 5 January and 1029 hPa on 7 January. Light precipitation occurred on 5 and 8 January. The humidity measurement values show a sudden drop towards the dry values. These individual measurements/observations describe the movement of cold air from the east, and thus, the hygrometer measurements are plausible in this time period. It should be noted, however, that Morin noted “papier baisse” on 6 January between the morning and afternoon measurements (see Section 2).
The second period, from 21 February to 5 March 1709, suggests a flow of cold air at the beginning of this period (between 21 and 23 February): direction of cloud movement from the northeast, temperature drop, heavy cloudiness followed by clearing, pressure increase and light rain. From 24 February 1709, the temperature rose, the cloudiness increased, and the direction of the cloud movement changed to the east in the following days. This caused a drop in the values of the humidity measurement at the beginning of the period and an increase later.
The third time period extends from 15 to 23 April 1709. In this period, the humidity measurement shows a strong decrease to dry values. The other measurements/observations indicate an area of high pressure: consistently high temperatures, low cloud cover, high pressure, and almost no precipitation.
The fourth period extends from 19 to 25 June 1709. Characteristic in this period is the unimodal peak of humid conditions. The explanation for this is a persistent cloud cover between 20 and 22 June, which led to a low diurnal range in temperature (low maximum temperature), rain, and consequently wetter conditions. However, an expected low pressure is only slightly pronounced in the records.
5. Summary and Conclusions
The analysis reveals that Louis Morin recorded meaningful values, and it is likely that he used a paper ribbon measuring instrument based on the measuring principle of Vincenzo Viviani. This is supported by the fact that Morin’s instrument measures relative humidity, the note “papier baisse” (paper down/decline), which indicates an instrument that used paper, and the fact that this instrument could be sent to several cities in Europe by the Florentine Meteorological Network. Even though there is nothing in the analysis that speaks against this hypothesis, it should be noted that the evidence is still weak. We cannot show if and when how strongly temperature dependent the measurement is. A temperature dependence would create spurious correlations and make the analyzed correlations probably invalid. Nonetheless, the correlation analysis of Morin’s humidity measurements with various meteorological variables yields comparable results to a parallel analysis of the relative humidity measurements of the E-OBS data, e.g., the Spearman correlation coefficient of the humidity measurements with the minimum temperatures is −0.43 (p < 0.01), that with the mean temperatures is −0.54 (p < 0.01), and with the maximum temperatures, it is −0.59 (p < 0.01). The Spearman correlation coefficient with the diurnal temperature range is −0.65 (p < 0.01) for the Morin data and −0.61 (p < 0.01) for the E-OBS data. Furthermore, the Spearman correlation coefficient with total cloud cover is 0.33 (p < 0.01) for the Morin data and 0.53 (p < 0.01) for the E-OBS data. The most significant difference can be seen in the correlation with precipitation. Here, the Spearman correlation coefficient is only 0.11 (p < 0.01) for the Morin data and 0.39 (p < 0.01) for the E-OBS data. Further evidence for the plausibility of the measurements is shown by the day-by-day analysis. Here, we analyze marked changes in the humidity measurements in the first half of 1709, each of which can be explained by the other meteorological variables.
One problem is that we do not explicitly know how the measurement device was placed and performed. Indoor and outdoor measurements give significantly different results. An indication for this is the analysis of the wind strength, where no correlation could be found. Thus, we conclude, also due to the comparable correlation results with the other meteorological variables, that Morin used his instrument indoors but ventilated.
Although Morin’s measurements make it possible to compare humidity measurements with other meteorological variables, the calibration and conversion to a common unit seems difficult. More measurement series as well as empirical measurements of the early hygrometer measuring devices are needed to find a calibration and to obtain values in common units.
Therefore, we did not transform Morin’s measurements into common units but rather kept his units for the analysis. The conversion of the data to common units is subject to further research. The exact dimensions (thickness, width and length), and the composition of the ribbon are unknown. The elongation of a ribbon may be measured with tensile tests. The test sample changes length until it breaks. The elongation depends on several factors, including the paper composition, relative humidity, previous microclimate history (e.g., dryness, dampness, hysteresis, exposure time, tension load, temperature and other factors). Creep is connected to paper elongation, and it is the property responsible for why the elongation increases with time when a specimen is maintained at a constant load (see Figure 5). In conclusion, the instrument used by Morin constitutes an interesting prototype. It provides quantitative readings, but they are in arbitrary units and are affected by severe bias, and the error band increases with aging and sorbed moisture.
Author Contributions
T.P. was responsible for conceptualization, data curation, formal analysis, investigation, methodology, resources, software, validation, visualization, and writing (original draft preparation, as well as review and editing). U.F. was responsible for conceptualization, funding acquisition, project administration, resources, supervision, validation, and writing (review and editing). C.R. was responsible for resources and writing (review and editing). C.P. was responsible for resources and writing (review and editing). All authors have read and agreed to the published version of the manuscript.
Funding
This research was funded by the Austrian Science Fund (FWF) grant Clim_Hist_LIA number P31088-N29.
Data Availability Statement
The data presented in this study are openly available in zenodo.org at https://doi.org/10.5281/zenodo.8041969.
Acknowledgments
We acknowledge the E-OBS dataset from the EU-FP6 project UERRA (accessed on 20 May 2023). (http://www.uerra.eu/) and the Copernicus Climate Change Service, as well as the data providers in the ECA&D project (https://www.ecad.eu/). Furthermore, we acknowledge the Copernicus Climate Change Service (C3S) Climate Data Store [28] (accessed on 20 May 2023). Neither the European Commission nor ECMWF is responsible for any use that may be made of the Copernicus information or data it contains. Moreover, we thank PRF (www.proof-reading-service.com/en/) for the conscientious proofreading. And finally, we thank Dario Camuffo for the careful review, which raised the quality of the paper.
Conflicts of Interest
The authors declare no conflict of interest. The funders had no role in the design of the study, in the collection, analyses, or interpretation of data, in the writing of the manuscript, or in the decision to publish the results.
Abbreviations
The following abbreviations are used in this paper:
| Tn | minimum temperature |
| Tg | mean temperature |
| Tn | maximum temperature |
| DTR | diurnal temperature range |
| TCC | total cloud cover |
References
- Slonosky, V.C.; Bauden, F.; Waller, R. LES OBSERVATIONS DU TEMPS AU XVIII SIÈCLE.: GALLAND, MORIN, DE LA HIRE ET LE CLIMAT DU « PETIT DU GLÂCIAIRE ». In Antoine Galland (1646–1715) et son Journal: Actes du Colloque International Organise a l’Universite de Liege (16–18 fevrier 2015) a l’occasion du Tricentenaire de sa Mort; Bauden, F., Waller, R., Eds.; Peeters Publishers: Leuven, Belgium, 2020; Volume 12, pp. 497–518. [Google Scholar] [CrossRef]
- Manley, G. Central England temperatures:monthly means, 1659 to 1973. Q. J. R. Meteorol. Soc. 1974, 100, 389–405. [Google Scholar] [CrossRef]
- Auer, I.; Böhm, R.; Schöner, W. Austrian Long-Term Climate 1767–2000: Multiple Instrumental Climate Time Series from Central Europe; Zentralanstalt für Meteorologie und Geodynamik: Wien, Austria, 2001; Volume 25. [Google Scholar]
- Camuffo, D.; Jones, P. Improved Understanding of Past Climatic Variability from Early Daily European Instrumental Sources; Springer: Dordrecht, The Netherlands, 2002; Volume 53, pp. 1–4. [Google Scholar] [CrossRef]
- Bergström, H.; Moberg, A. Daily air temperature and pressure series for Uppsala. Clim. Chang. 2002, 53, 213–252. [Google Scholar] [CrossRef]
- Moberg, A.; Bergström, H.; Krigsman, J.R.; Svanered, O. Daily air temperature and pressure series of Stockholm (1756–1998). Clim. Chang. 2002, 53, 171–212. [Google Scholar] [CrossRef]
- Können, G.P.; Brandsma, T. Instrumental pressure observations from the end of the 17th Century: Leiden (The Netherlands). Int. J. Climatol. 2005, 25, 1139–1145. [Google Scholar] [CrossRef]
- Auer, I.; Böhm, R.; Jurkovic, A.; Lipa, W.; Orlik, A.; Potzmann, R.; Schöner, W.; Ungersböck, M.; Matulla, C.; Briffa, K.; et al. HISTALP—Historical instrumental climatological surface time series of the Greater Alpine Region. Int. J. Climatol. 2007, 27, 17–46. [Google Scholar] [CrossRef]
- Rousseau, D. Les températures mensuelles en région parisienne de 1676 à 2008. La Météorologie 2009, 67, 43–55. [Google Scholar] [CrossRef] [Green Version]
- Cornes, R.C.; Jones, P.D.; Briffa, K.R.; Osborn, T.J. A daily series of mean sea-level pressure for London, 1692–2007. Int. J. Climatol. 2012, 32, 641–656. [Google Scholar] [CrossRef]
- Cornes, R.C.; Jones, P.D.; Briffa, K.R.; Osborn, T.J. A daily series of mean sea-level pressure for Paris, 1670–2007. Int. J. Climatol. 2012, 32, 1135–1150. [Google Scholar] [CrossRef]
- Brönnimann, S.; Allan, R.; Ashcroft, L.; Baer, S.; Barriendos, M.; Brázdil, R.; Brugnara, Y.; Brunet, M.; Brunetti, M.; Chimani, B.; et al. Unlocking pre-1850 instrumental meterologoical records: A global inventory. Bull. Am. Meteorol. Soc. 2019, 100, ES389–ES413. [Google Scholar] [CrossRef]
- Camuffo, D.; Becherini, F.; della Valle, A. The Beccari series of precipitation in Bologna, Italy, from 1723 to 1765. Clim. Chang. 2019, 155, 359–376. [Google Scholar] [CrossRef]
- Camuffo, D.; della Valle, A.; Becherini, F.; Zanini, V. Three centuries of daily precipitation in Padua, Italy, 1713–2018: History, relocations, gaps, homogeneity and raw data. Clim. Chang. 2020, 162, 923–942. [Google Scholar] [CrossRef]
- Lundstad, E.; Brugnara, Y.; Pappert, D.; Kopp, J.; Samakinwa, E.; Hürzeler, A.; Andersson, A.; Chimani, B.; Cornes, R.; Demarée, G.; et al. The global historical climate database HCLIM. Sci. Data 2023, 10, 44. [Google Scholar] [CrossRef] [PubMed]
- Camuffo, D.; Bertolin, C.; Bergonzini, A.; Amore, C.; Cocheo, C. Early hygrometric observations in Padua, Italy, from 1794 to 1826: The Chiminello goose quill hygrometer versus the de Saussure hair hygrometer. Clim. Chang. 2014, 122, 217–227. [Google Scholar] [CrossRef]
- Pliemon, T.; Foelsche, U.; Rohr, C.; Pfister, C. Subdaily meteorological measurements of temperature, direction of the movement of the clouds, and cloud cover in the Late Maunder Minimum by Louis Morin in Paris. Clim. Past 2022, 18, 1685–1707. [Google Scholar] [CrossRef]
- Pliemon, T.; Foelsche, U.; Rohr, C.; Pfister, C. Precipitation reconstructions for Paris based on the observations of Louis Morin, 1665–1713 CE. EGUsphere 2023, 2023, 1–32. [Google Scholar] [CrossRef]
- Legrand, J.P.; Le Goff, M. Louis Morin et les observations météorologiques sous Louis XIV. La Vie des Sciences 1987, 4, 251–281. [Google Scholar]
- Legrand, J.P.; Le Goff, M. Les Observations Météorologiques de Louis Morin; Direction de la Météorologie Nationale: Paris, France, 1992. [Google Scholar]
- Pfister, C.; Bareiss, W. The climate in Paris between 1675 and 1715 according to the Meteorological Journal of Louis Morin. In Climatic Trends and Anomalies in Europe 1675–1715: High Resolution Spatio-Temporal Reconstructions from Direct Meteorological Observations and Proxy Data: Methods and Results; Frenzel, B., Pfister, C., Gläser, B., Eds.; Gustav Fischer Verlag: Stuttgart, Germany; Jena, Germany; New York, NY, USA, 1994; pp. 151–171. [Google Scholar]
- Visscher, J.C. Lutetia Parisiorum urbs, toto orbe Celeberrima Notissimaque, Caput Regni Franciae. Bibliotheque Nationale de France, Paris. Source: Gallica.bnf.fr/Bibliothèque nationale de France. 1618. Available online: https://gallica.bnf.fr/ark:/12148/btv1b530580657.r=Paris%201618%20visscher?rk=21459;2 (accessed on 25 May 2023).
- Middleton, W.E.K. Invention of the Meteorological Instruments; Johns Hopkins Press: Baltimore, MD, USA, 1969. [Google Scholar]
- De Saussure, H. Essais sur l’hygrométrie; Samuel Fauche: Neuchâtel, Switzerland, 1783. [Google Scholar]
- Camuffo, D. Microclimate for Cultural Heritage: Measurement, Risk Assessment, Conservation, Restoration, and Maintenance of Indoor and Outdoor Monuments, 3rd ed.; Elsevier: Amsterdam, The Netherlands, 2019. [Google Scholar]
- Amontons, G. Remarques et Expériences Phisiques sur la Construction d‘une Nouvelle Clepsidre sur les Baromètres, Termomètres, & Higromètres; Chez Jean Jombert: Paris, France, 1695. [Google Scholar]
- Folli, F.; Cecchi, G. Stadera medica: Nella quale oltre la medicina infusoria, ed altre novità si bilanciano le ragioni favore voli: E le contrarie alla trasfusion del sangue: Già inventata da Francesco Folli et ora dal medesimo descritta, e dedicata al ser.mo principe Francesco Maria di Toscana; Ad Instanza di Gio. Filippo Cecchi, 1680. [Google Scholar]
- Hersbach, H.; Bell, B.; Berrisford, P.; Biavati, G.; Horányi, A.; Muñoz Sabater, J.; Nicolas, J.; Peubey, C.; Radu, R.; Rozum, I.; et al. ERA5 Hourly Data on Single Levels from 1940 to Present. Copernicus Climate Change Service (C3S). Climate Data Store (CDS). 2023. Available online: https://cds.climate.copernicus.eu/cdsapp#!/dataset/reanalysis-era5-single-levels?tab=overview (accessed on 16 May 2023). [CrossRef]
- Cornes, R.C.; van der Schrier, G.; van den Besselaar, E.J.M.; Jones, P. An ensemble version of the E-OBS temperature and precipitation datasets. J. Geophy. Res. Atmos. 2018, 123, 9391–9409. [Google Scholar] [CrossRef] [Green Version]
- Brönnimann, S.; Annis, J.; Dann, W.; Ewen, T.; Grant, A.N.; Griesser, T.; Krähenmann, S.; Mohr, C.; Scherer, M.; Vogler, C. A guide for digitising manuscript climate data. Clim. Past 2006, 2, 137–144. [Google Scholar] [CrossRef] [Green Version]
- Domínguez-Castro, F.; Vaquero, J.M.; Rodrigo, F.S.; Farrona, A.M.M.; Gallego, M.C.; García-Herrera, R.; Barriendos, M.; Sanchez-Lorenzo, A. Early Spanish meteorological records (1780–1850). Int. J. Climatol. 2014, 34, 593–603. [Google Scholar] [CrossRef]
Figure 1.
Example of Morin’s notes from August 1708 (Source: Institute of History/Oeschger Centre for Climate Change Research, University of Bern). The hygrometer measurements are highlighted in column 6. These consist of a letter, where “h” stands for humide (wet) and “s” for sec (dry), and two numbers, which usually range from 0.0 to 8.0. The other columns are briefly explained in the text.

Figure 2.
A map of Paris from 1618 [22]; the marked locations show where Morin lived. Until October 1685, he lived on Quinquempoix Street (1); then, until June 1688, in the Hotel Rohan-Soubisse (2), where the National Archives are located today; finally, until his death in 1715, he lived in the abbey of Saint-Victor (3), which is located at the city’s border next to the Seine. (source: https://gallica.bnf.fr/, last access: 25 May 2023/Bibliothéque nationale de France).

Figure 3.
The so-called paper ribbon hygrometer invented by Francesco Folli (source: Museo Galileo, Firenze. Photo: Franca Principe). Note that for the hygrometer to function, a weight, which misses in the figure, must be attached to one side of the paper strip, which is passed over a roller. On the other side, the paper must be fixed.

Figure 4.
The paper ribbon hygrometer invented by Vincenzo Viviani (source: Museo Galileo, Firenze).
Figure 4.
The paper ribbon hygrometer invented by Vincenzo Viviani (source: Museo Galileo, Firenze).

Figure 5.
A time-series plot of the raw data from the morning, afternoon, and evening measurements given in Louis Morin’s unit of humidity (positive values mean wet conditions and negative values mean dry conditions) for the whole measurement period (top) and one month (bottom).
Figure 5.
A time-series plot of the raw data from the morning, afternoon, and evening measurements given in Louis Morin’s unit of humidity (positive values mean wet conditions and negative values mean dry conditions) for the whole measurement period (top) and one month (bottom).

Figure 6.
Scatterplot and Spearman correlation coefficient of humidity with (a) morning temperature, (b) afternoon temperature, (c) evening temperature, (d) minimum temperature (Tn), (e) mean temperature (Tg), (f) maximum temperature (Tx), (g) diurnal temperature range (DTR), (h) total cloud cover (TCC), and (i) precipitation. Note that in (a–c), the measured humidity value for the time of day and in (d–i), the daily mean of humidity is shown.

Figure 7.
Box plots of standardized humidity measurements as a function of wind strength for the year 1707. The blue line shows for illustration the linear regression.
Figure 7.
Box plots of standardized humidity measurements as a function of wind strength for the year 1707. The blue line shows for illustration the linear regression.

Figure 8.
From top to bottom: humidity measurements in Morin’s unit, temperature in degrees Celsius, cloud cover in octas, mean sea-level pressure in hPa, direction of the movement of the clouds, and precipitation in mm in the period from January 1709 to June 1709. Dark gray areas mark time periods, in which hygrometer measurements undergo marked changes.

Disclaimer/Publisher’s Note: The statements, opinions and data contained in all publications are solely those of the individual author(s) and contributor(s) and not of MDPI and/or the editor(s). MDPI and/or the editor(s) disclaim responsibility for any injury to people or property resulting from any ideas, methods, instructions or products referred to in the content. |
© 2023 by the authors. Licensee MDPI, Basel, Switzerland. This article is an open access article distributed under the terms and conditions of the Creative Commons Attribution (CC BY) license (https://creativecommons.org/licenses/by/4.0/).
Share and Cite
MDPI and ACS Style
Pliemon, T.; Foelsche, U.; Rohr, C.; Pfister, C. Early Humidity Measurements by Louis Morin in Paris between 1701 and 1711—Data and Metadata. Climate 2023, 11, 156. https://doi.org/10.3390/cli11070156
AMA Style
Pliemon T, Foelsche U, Rohr C, Pfister C. Early Humidity Measurements by Louis Morin in Paris between 1701 and 1711—Data and Metadata. Climate. 2023; 11(7):156. https://doi.org/10.3390/cli11070156
Chicago/Turabian StylePliemon, Thomas, Ulrich Foelsche, Christian Rohr, and Christian Pfister. 2023. "Early Humidity Measurements by Louis Morin in Paris between 1701 and 1711—Data and Metadata" Climate 11, no. 7: 156. https://doi.org/10.3390/cli11070156
Note that from the first issue of 2016, this journal uses article numbers instead of page numbers. See further details here.