Experimental Records from Blast Tests of Ten Reinforced Concrete Slabs


1
Research and Development Division, Institute of Operational Applications, Pca. Mal. Eduardo Gomes 50, São José dos Campos, SP 12228-970, Brazil
2
Civil, Environmental, and Infrastructure Engineering, George Mason University, 4400 University Drive, MS 6C1, Fairfax, VA 22030, USA
3
Defense and Sensitive Technologies Division, Aeronautics and Space Institute, Pca. Mal. Eduardo Gomes 50, São José dos Campos, SP 12228-904, Brazil
4
Fundamental Sciences Division, Chemistry Department, Technological Institute of Aeronautics, Pca. Mal. Eduardo Gomes 50, São José dos Campos, SP 12228-900, Brazil
*
Author to whom correspondence should be addressed.
CivilEng 2020, 1(2), 51-74; https://doi.org/10.3390/civileng1020005
Submission received: 20 May 2020
/
Revised: 19 June 2020
/
Accepted: 24 June 2020
/
Published: 29 June 2020
Abstract
:The design and evaluation of structures subjected to blast loads has increased steadily since the 11 September 2001 terrorist attacks. While shock tube testing has filled some of the data gap by replicating blast waves in a controlled fashion, there is only scant field explosion data that is easily accessible for the structural engineering community for hypothesis testing or model validation. This paper summarizes experimental design, pre-test sensor verification, and data collection from 10 reinforced concrete slabs subjected to field explosions using a modest budget. The experimental record contains pressure, displacement, and acceleration measurements of each slab except in a few cases where the sensors have failed. The data is archived at George Mason Dataverse. Following detailed description of the experimental record for each slab, an example is provided in which the data can be utilized for finite element model verification.
1. Introduction
Explosions continue to be a threat to civilian and military buildings. Blast loads emanating from deliberate or accidental explosions may cause significant structural damage [1]. To mitigate this damage, reinforced concrete has been used as a material of choice for blast protective design around the world. Development of protective technologies for reinforced-concrete structures and inhabitants are reported in [2,3,4]. Most of the existing research in protective design of retrofitted or unretrofitted reinforced-concrete structures relies on computational modeling with scant experimental data available for verification. For example, Hajek et al. [5] presented results of a full scale blast test using 8.0 kg of equivalent TNT explosive charge with stand-off distances of 1.9 m, 5.0 m, and 12.5 m, against a reinforced concrete wall retrofitted with foam pyramid-shaped and steel angled extension panel. Their results showed significant injury risk reduction with validation efforts using finite element modeling (FEM). Their experiment also verified reduction of reflected pressure from the explosion using foam retrofit [6]. Reductions of acceleration developed in structures due to blast effect using a foam retrofit was also reported in [7]. It was shown that acceleration reduction of up to 80% is possible. Comparison of retrofitted reinforced-concrete slabs subjected to blast was also presented in [8,9]. Experimental researches conducted by Syed et al. [10] demonstrated different behavior of reinforced-concrete slabs subjected to far-field and near-field blast effects. Far-field blast tests produced more uniform distribution of front wave pressure than results in near-field tests. This paper presents preparation and data obtained from 10 field blast tests, with and without EPS (expanded polystyrene) foam retrofit. The experiments were conducted to evaluate the performance of different reinforcing and retrofitting arrangements for guiding protective design of bridge decks in the city of São José dos Campos in Brazil. Stand-off distance considered for this study was 1.3 to 2.0 m, developing scaled distances between 0.93 to 1.46 m/kg1/3, which characterize the experiments as a near-field blast test [10]. The data includes pressure, acceleration and displacement readings from sensors. The experimental data is available at George Mason Dataverse for free and can help researchers to validate FEM models and help provide insights in developing new protective design technologies. An example of simulation using Abaqus® finite element software is presented. The experimental findings are applicable to cylindrical charges that are detonated near the surface of the slabs.
2. Materials and Methods
Ten blast tests were conducted on reinforced-concrete slabs, measuring 1.0 m × 1.0 m and 0.08 m thick, at the Science and Technology Aerospace Department (DCTA) blast test site in São José dos Campos, São Paulo, Brazil using a modest budget. The slabs were made with varying characteristics compressive strength of concrete and varying reinforcement ratio. Table 1 shows the details of the blast tests. The experimental program targeted a scaled distance (Z) of 1 m/kg1/3 for the first slab test. After the performance of the slab 1 test, which is described later, the stand-off distance was adjusted to target a scaled distance of 1.4 m/kg1/3 for slabs 2–9. A scaled distance 1.2 m/kg1/3 was targeted for slab 10 to capture a data point between 1 and 1.4 m/kg1/3. The actual Z values determined in the field were slightly different from the targeted values as shown in Table 1.
Each slab was simply supported on two sides and the cylindrical shape of non-confined explosive was suspended above the slab as shown in Figure 1 [11]. Three stand-off distances, h, were considered for the 10 tests: h = 1.30 m (slab 1), h = 1.60 m (slab 10), and h = 2.0 m (slabs 2–9). The reinforcement was placed near the bottom of the slabs to carry positive moment. Figure 2 shows two different reinforcement arrangements employed in the tests. Slabs 2, 3, 5 and 6 have the reinforcement arrangement shown in Figure 2a. Slabs 1, 4, 7–10 have the reinforcement arrangement shown in Figure 2b. The reinforcement ratio in each of the slabs is reported in Table 1 above.
Figure 3 shows the setup of the blast test for slabs without additional top foam retrofit. Three of the 10 slabs (slabs 3, 6 and 8) were additionally retrofitted with 50 mm thick unsandwiched foam on the top of the slab to determine if the foam has any capacity to reduce the blast effect on the slabs. The slabs were not constructed in closed boxes and the explosive cylindrical shape measured 20 cm × 10.5 cm. There is a specific control of the explosive production process.
Figure 4 shows five pressure sensors that were positioned in contact with a representative slab to measure reflected pressure. There were three additional pressure sensors positioned away from the slab and towards the explosive to measure incident pressure. These were piezoelectric sensors with a capacity of measuring up to 50 bar (5000 kPa). In all 10 tests, the explosive used was PBX (plastic bonded explosive). The weight of the explosives used for each test is shown in Table 1. The explosive was triggered by an electric fuse that was attached to wires located at a distance of 250 m in a bunker where the research team was housed during the detonation [11].
2.1. Concrete
The slabs were made from cast-in-place concrete and static compressive strength tests were conducted according to Brazilian Norms, NBR 12,655 [12], using 10 × 20 cm concrete test cylinders by the Qualitec Company. The concrete with nominal 40 MPa and 50 MPa strengths were used to construct the supporting beams in a local bridge in São José dos Campos. The results of the static compressive test showed that the f’ck values were 42 and 53 MPa, respectively. The concrete with nominal f’ck of 60 MPa was made by adding silica and it was expected to improve blast resistance of the slab. The nominal 60 MPa concrete was used to construct a bridge deck in São José dos Campos and was donated to the research team. The result of Qualitec material tests showed that f’ck was 62 MPa. The slabs were cured according to Brazilian Norms, NBR 6118 [13] and NBR 14931 [14], keeping the slab surface wet within three days of casting. Figure 5 shows representative slabs fifteen days after casting.
2.2. Reinforcement
The main objective of the research was to study the effect of the reinforcement ratio on the behavior of the slabs when subjected to blast waves. The reinforcement was held in place in the formworks before the concrete was cast with a 2.5 cm cover on the lower face of the slab (positive reinforcement). Figure 6 shows the formwork and the reinforcement before concrete was cast.
2.3. Field Measurements and Pre-Test Verification
Accelerometers, displacement gages, strain gages and pressure gages were used in order to measure blast wave parameters and global response of the slabs. We note that measurements of acceleration, displacement and pressure are not synchronized with each other in time. However, pressure sensors were synchronized with each other and displacement sensors were also synchronized with each other. That is, the systems started at a different initial time reading and have different time steps [15]. The explosion events were also captured by high-speed digital camera.
2.3.1. Accelerometers
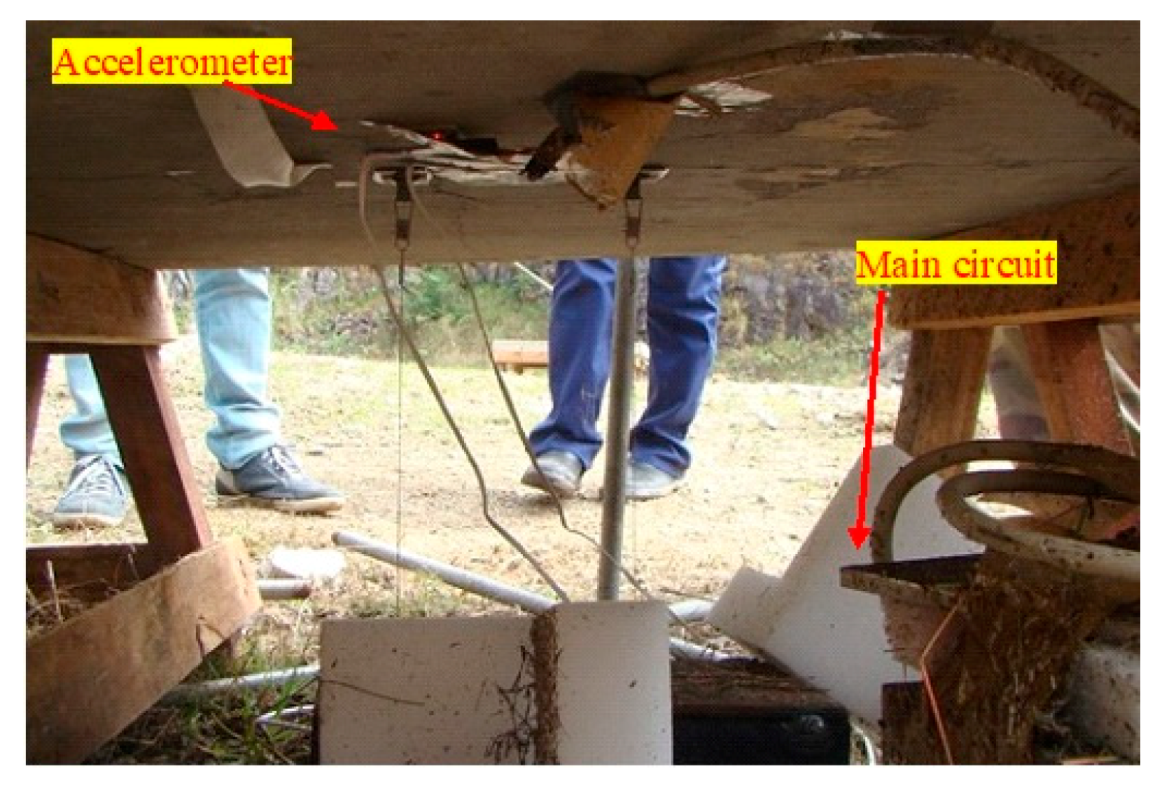
The accelerometers were assembled in the Electronic Engineering Laboratory at ITA (Technological Institute of Aeronautics) in Brazil. They were made from an Arduino System consisting of a circuit with 9 V direct current (DC) battery supply, a memory card, and an accelerometer as shown in Figure 7a. Sampling rate of the sensor was 24 ms and had sensitivity of 2048 LBS/g, which was not able to verify if the peak is the highest peak, because of the time step. Figure 7b shows the circuit placed in a lead box surrounded internally by a foam to protect it from the blast wave and surrounding debris generated during the explosion event. The accelerometers were attached to the bottom of the slab, as shown in Figure 8, to measure the resulting acceleration generated due to the blast wave. The sensor was calibrated using a turntable calibrator.
2.3.2. Displacement Meters
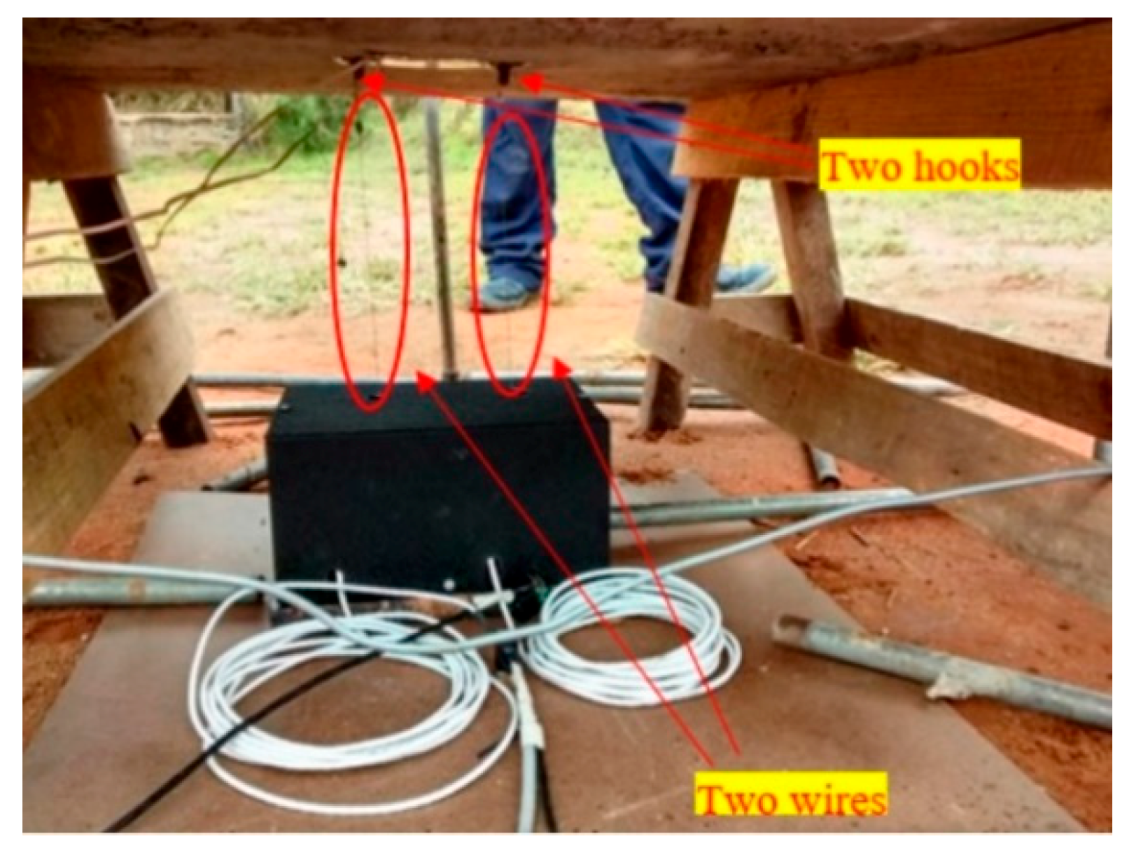
Displacement meters were used to measure the displacement of the slabs near the center due to the blast. The displacement meters were attached to the bottom surface of the slab by a wire emanating from a potentiometer that records the upward or downward movement of the wire during the explosion. The sampling rate of the sensors was 0.42 ms, and had sensitivity of 1.1 × 10⁻⁶ m, which was able to record slab movements due to the blast effect. For each of the 10 tests, two hooks with two potentiometers were attached to increase the likelihood of data collection in case there was a failure of the sensors during the experiment. The hook was needed to hold the wire in place [16]. A steel box was used to protect the potentiometers against surrounding debris or pieces of the slab during the explosion. The displacement meter setup is shown in Figure 9.
2.3.3. Strain Gages
Two perpendicular 10 mm strain gages were attached to the center of the lower face of each slab using a two-part epoxy-resin. Figure 10 shows the strain gages in both planar directions.
2.3.4. Pressure Sensors
Piezoelectric pencil pressure sensors were mounted to measure the blast pressure waves. The pressure sensors pointing to the explosive as shown in Figure 11 were used to measure the incident pressure. The pressure sensors on the top of slab as shown in Figure 4 were used to measure the reflected pressure. Sampling rate of the sensors was 0.01 ms, had sensitivity of 0.1 bar (10 kPa) being able to record the highest peak pressure and were able to measure up to 5 MPa.
2.3.5. Imaging
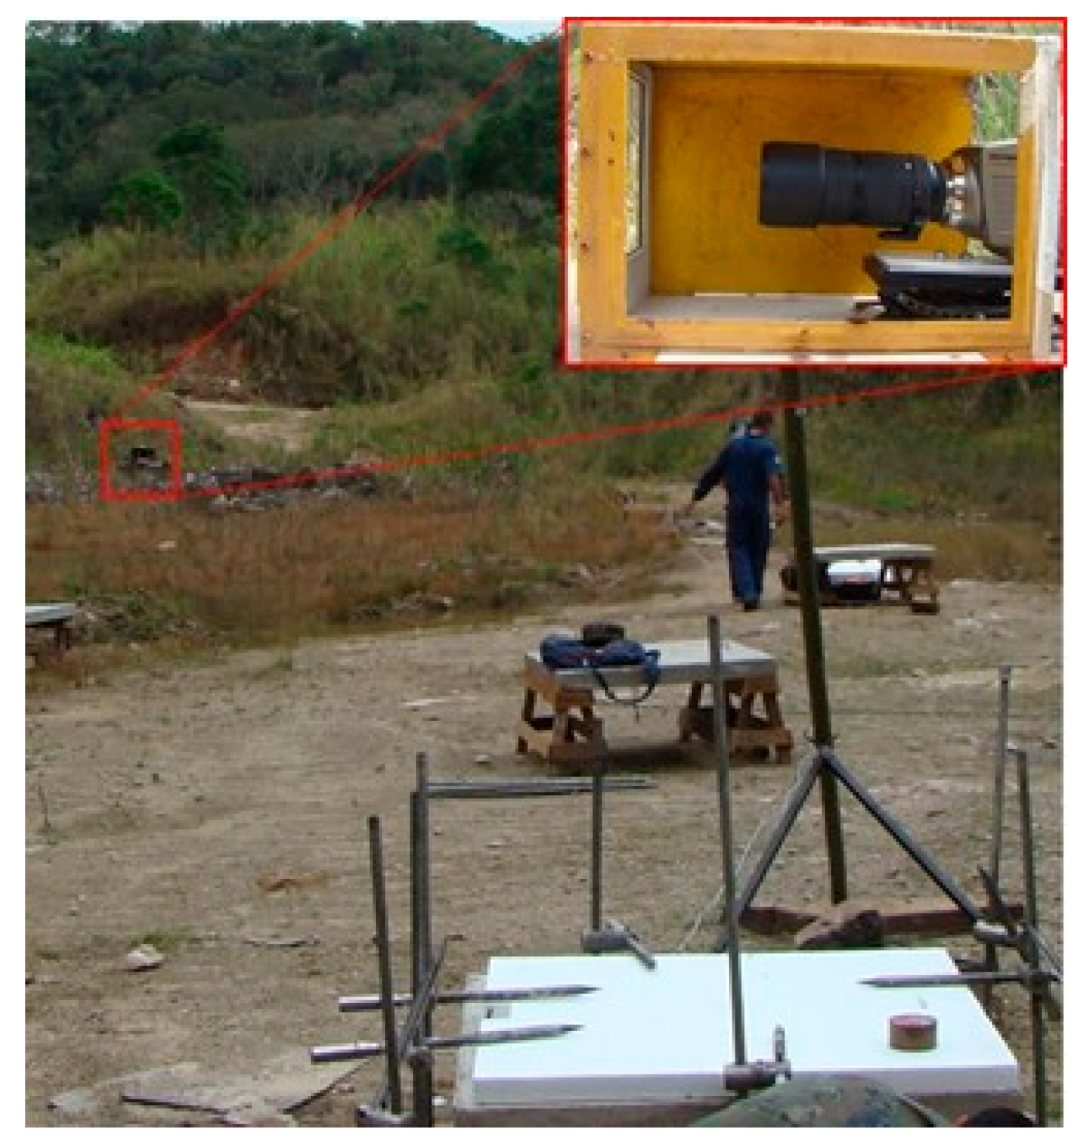
Olympus® high-speed digital camera was used to capture images from the explosion event in conjunction with a Toshiba® rugged notebook as shown in Figure 12. The camera was able to record up to 2500 frames per second (fps) and was placed 180 m away from the test. The camera was protected by a steel box to avoid the impact of debris on it.
2.3.6. Verification of Measurement Sensors
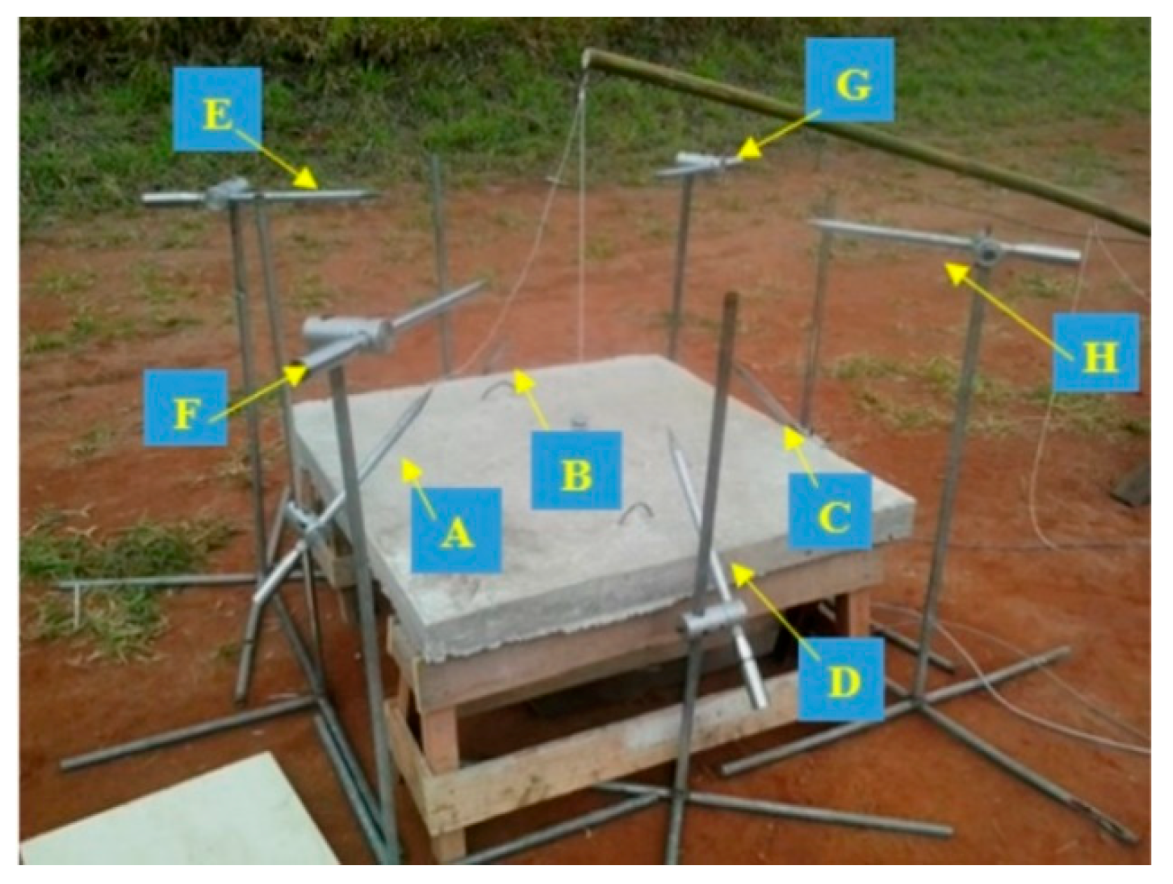
Before the planned 10 tests were conducted, a verification test was conducted in order to determine if the measurement devices were working properly [17]. A small explosive charge weighing 0.19 kg of equivalent TNT was detonated at 0.60 m stand-off distance from a representative slab targeting a Z value of 1. This charge corresponds to a scaled distance of Z = 1.046 m/kg1/3, which is the same order of magnitude as the scaled-distance values in the 10 planned test shown in Table 1. During the verification test, the accelerometers were found to be disconnected. This implied that the accelerometers for the 10 tests had to be placed in a strong protection device. There were four pressure sensors (sensors A–D) in contact with the representative slab used for the verification test and four additional non-contact pressure sensors pointing to the explosive (sensors E–H) as shown in Figure 13. The respective heights of the pressure sensors from the explosives are shown in Table 2. The predicted overpressure (Pso) values obtained using empirical equations for blast wave parameter determination are also shown in Table 2 [18,19,20]. Note that the empirical equations that were used to predict blast pressure at a very small scaled distance (Z) give only approximate results because of the complex involved when an explosion is detonated close to a structure.
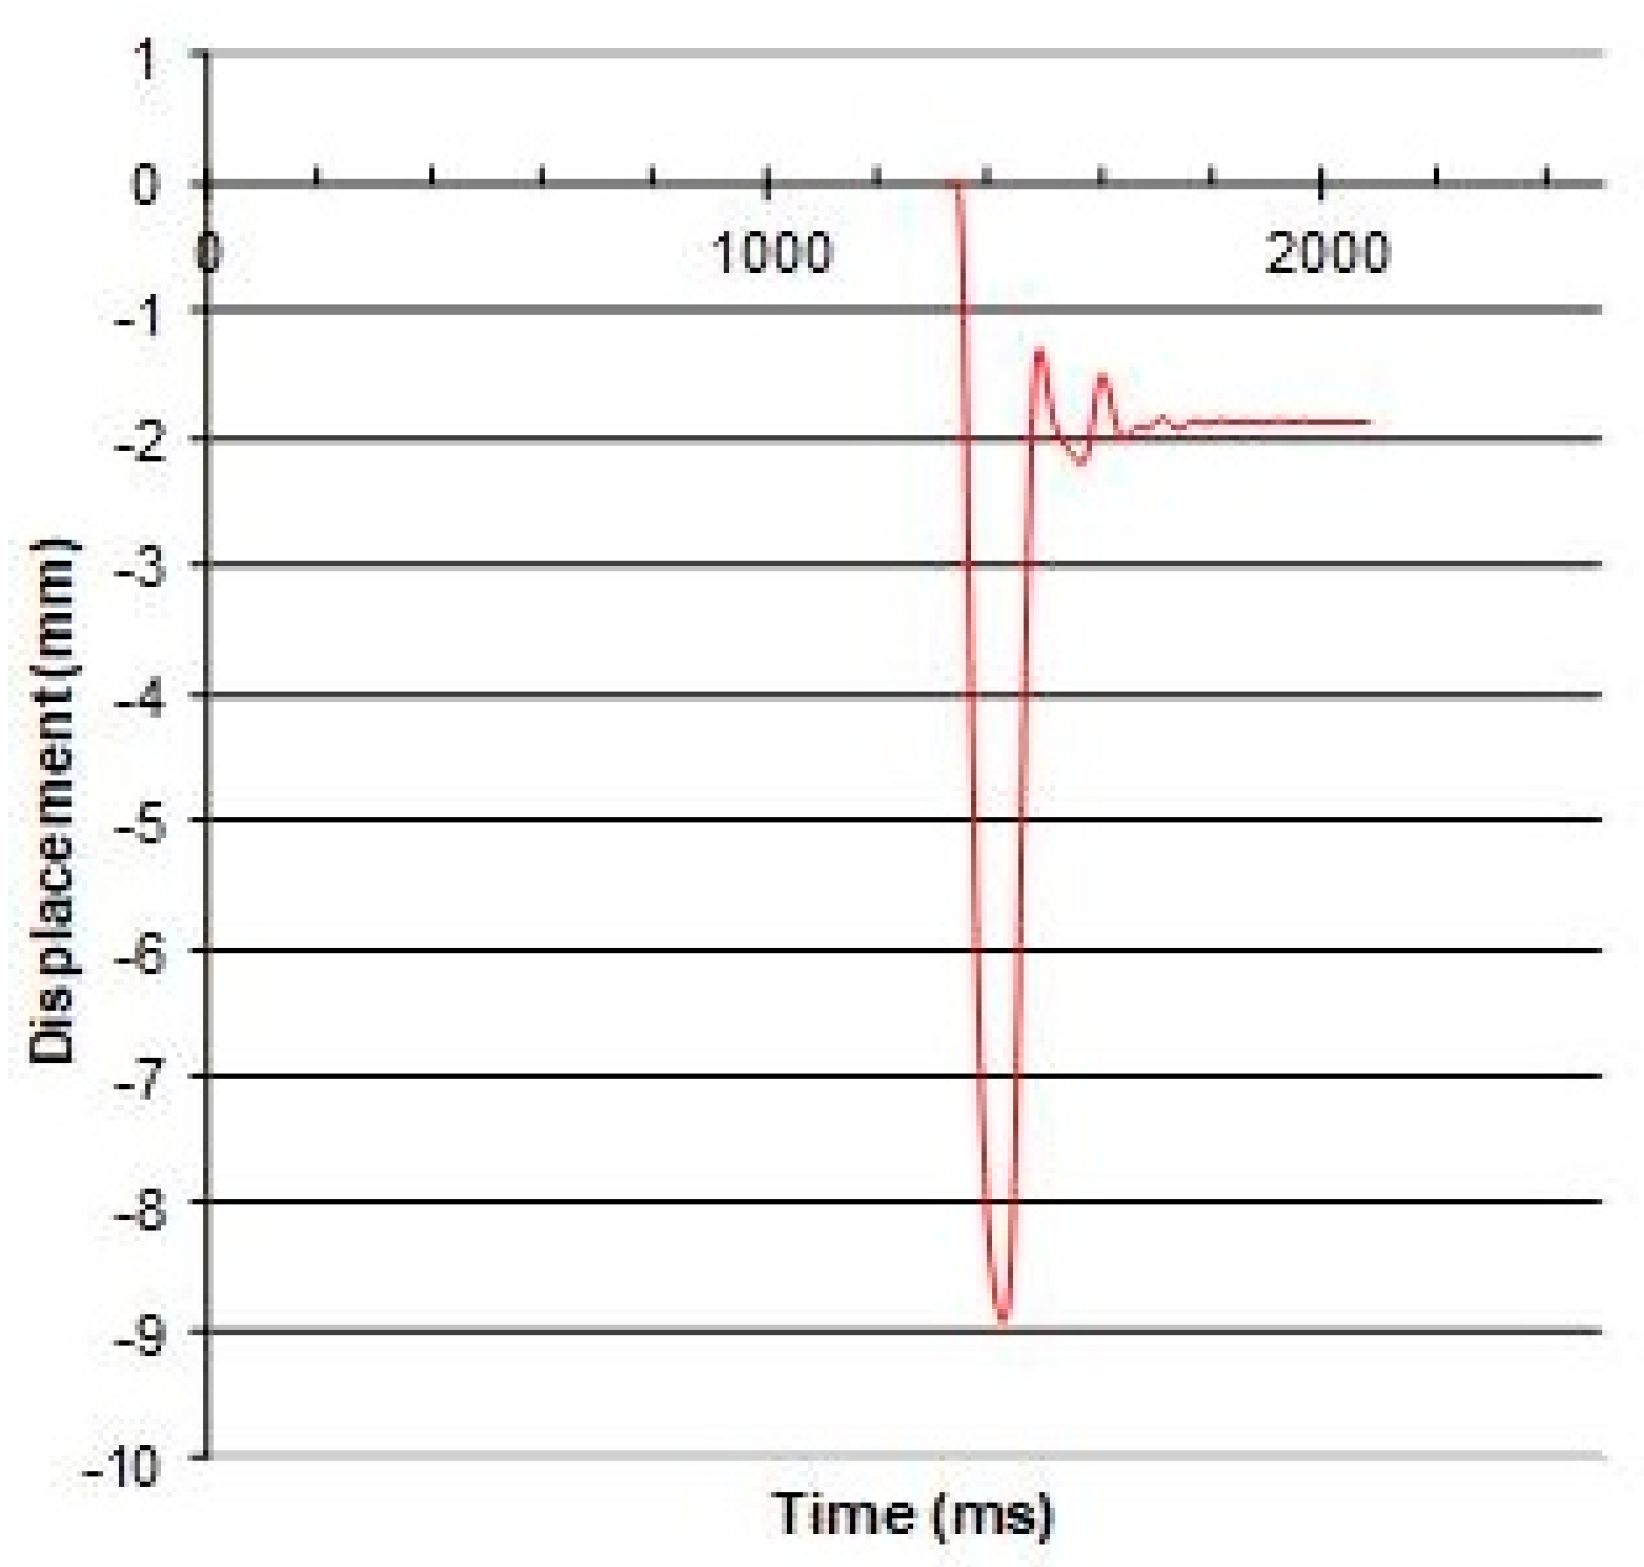
The displacement meters registered a maximum displacement of 8.9 mm with a residual displacement of 2 mm on the center of the slab as shown in Figure 14. The slab returned to its original position after the explosion event was over. The residual shown in Figure 14 was observed due to support displacement in the surrounding clay soil. The strain gages were also able to register strain values during this small explosion. The highest value recorded was around 120 μm/m. The slab had no cracks due to this verification test and kept its integrity.
2.4. Finite Element Analysis
The simulation was conducted in the Abaqus® FEM software (Dassault Sytèmes, Vélizy-Villacoublay, France) [21], considering the dynamics of the problem with Explicit Calculation Module. The concrete slab was modeled with C3D8R hexahedral Lagrangian deformable elements using the JH2 [22] and HJC [23] constitutive models. The reinforcing steel was modeled with B31 one-dimensional beam Lagrangian elements using the Johnson and Cook model [24]. The rebars were fixed to the enveloped concrete using the EMBEDDED ELEMENT command [25]. The wooden easels were implemented with C3D8R Lagrangian elements, purely elastic and orthotropic [25], taking into account the characteristics of the used wood. The CONWEP® [26] plug-in in the Abaqus® was used to simulate the air blast load of the PBX explosive on the slab. The easels were simply supported on a surface simulated with R3D4 shell elements, representing the soil surface. Similarly, the concrete slab was simply supported on such easels. The shell surface had no degree of freedom in translation or rotation and was considered perfectly rigid, representing that the soil was non-deformable and stationary. The effect of gravity was considered and the interaction between the elements was implemented using a frictionless general contact routine [25].
3. Experimental Results
Field-scale blast tests were conducted on 10 reinforced concrete slabs based on the test matrix provided in Table 1. For each test, blast wave parameters and structural responses were reported. Whenever possible, visual inspection of the crack patterns was also included.
3.1. Slab 1 Results
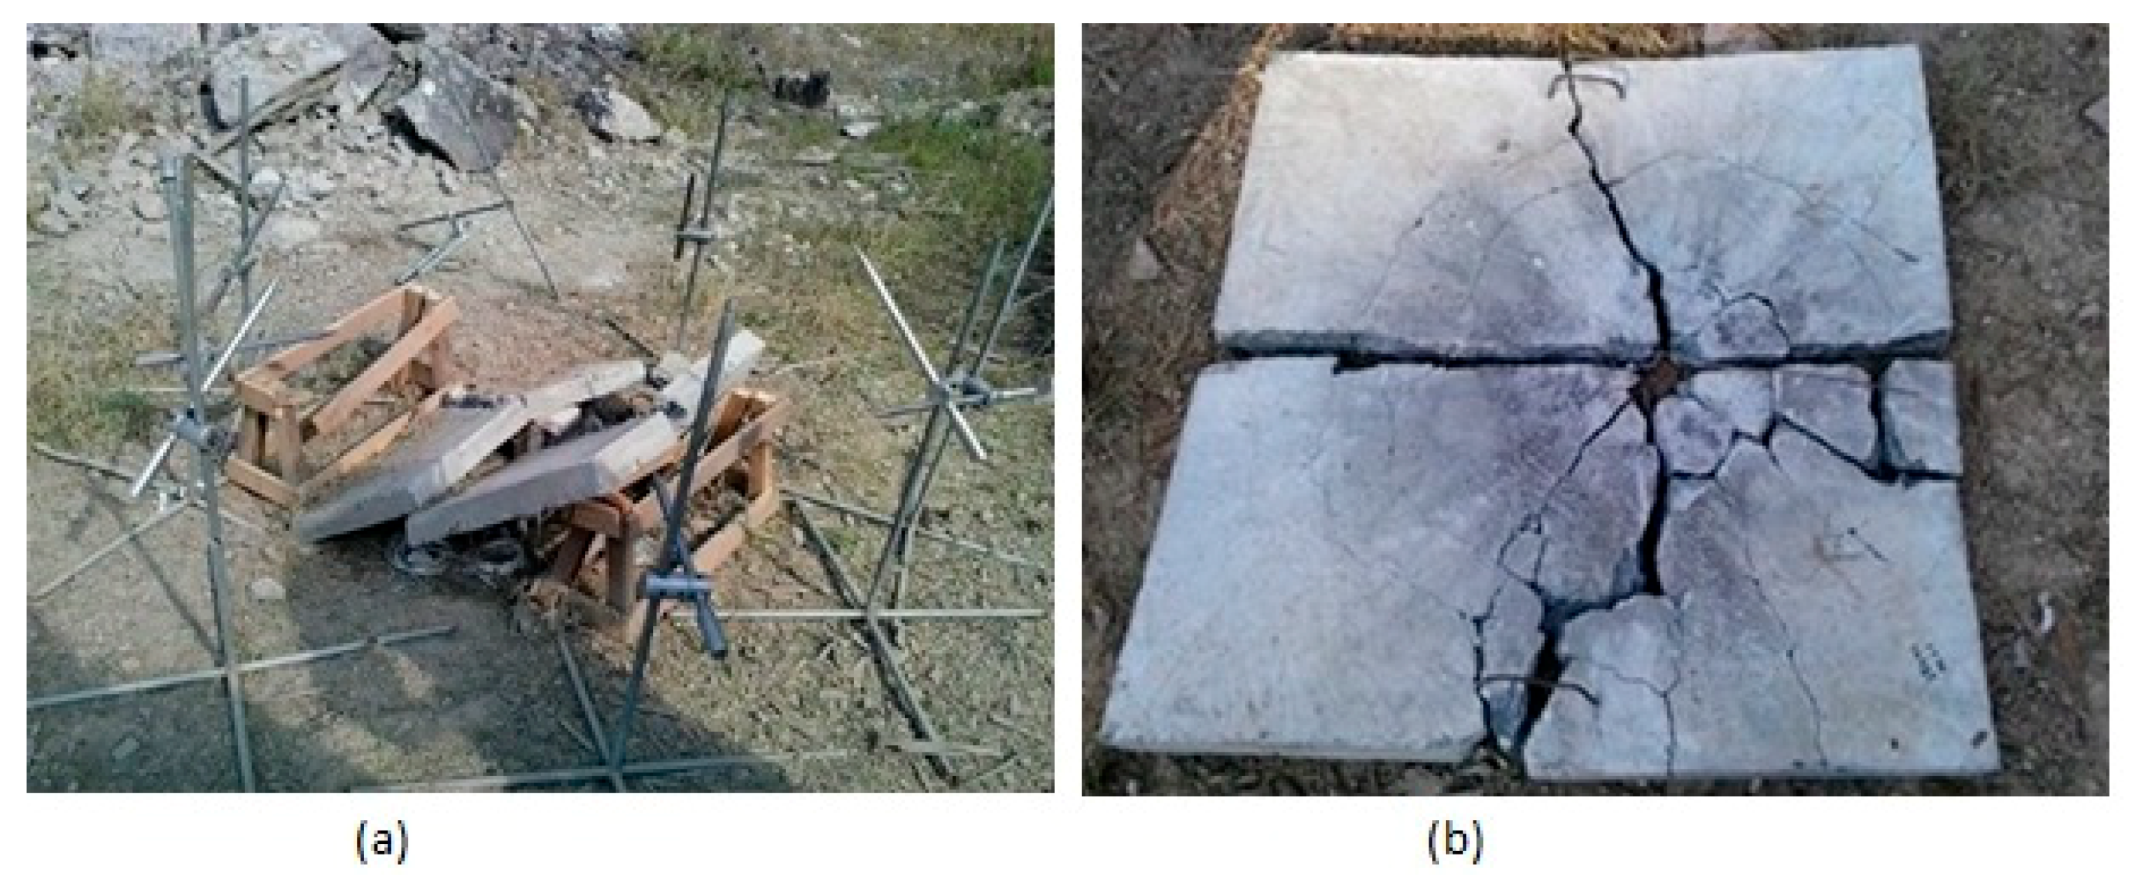
Slab 1 was subjected to an explosive with a scaled-distance of Z = 0.93 m/kg1/3. It was expected that the surface of the blast wave front expands in all directions due to the expansion of gases, and will become planar after a threshold distance, according to Wang et al. [27] and Dharma Rao et al. [28]. However, for near-field blast tests a non-uniform distribution is expected [10]. Slab test 1 verified that assertion, once the stand-off distance was small. Figure 15a shows the post-test picture of the test, and Figure 15b shows the assembled slab pieces after the test for visual inspection of the crack patterns. The circular concentric crack patterns on the top of the slab follow the spherical wave front generated by the blast.
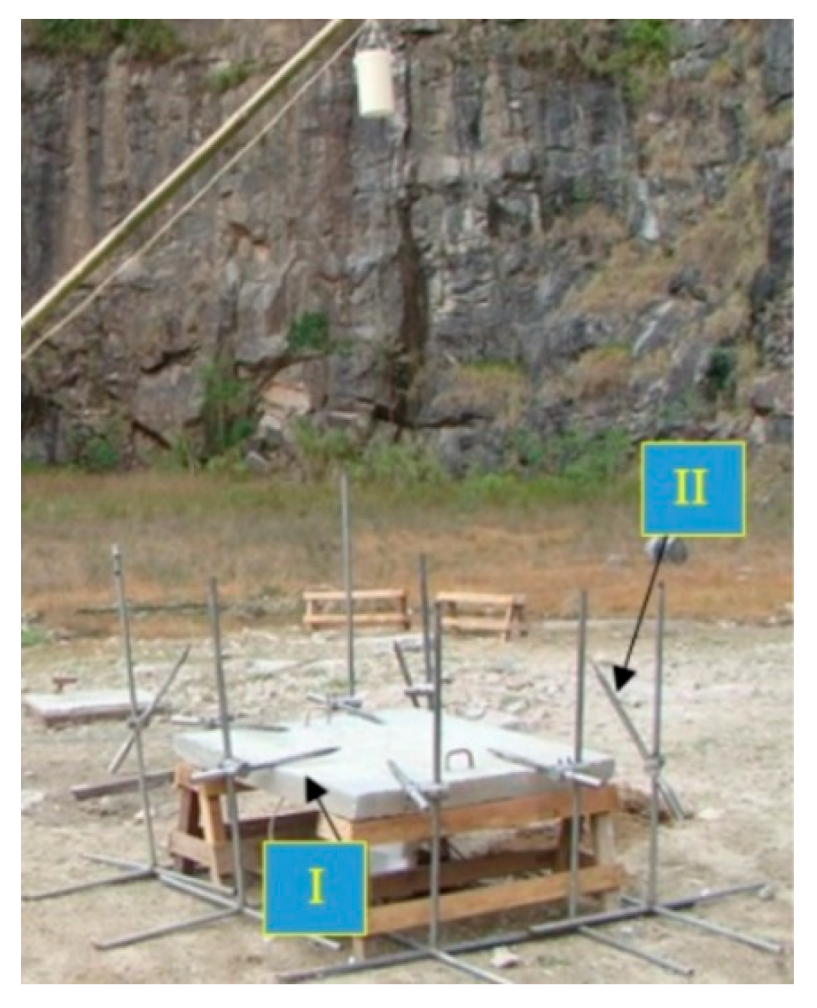
The integration of the area under the curve of the pressure-time history in the positive phase duration gives the positive specific impulse. The greater the area under the curve, the greater the impulse against the target and the larger the damage. Table 3 provides the values of peak overpressure recorded by each sensor, the time of duration of the positive phase and the positive specific impulse. Two positions were adopted for the sensors, close to the slab surface (position I) and pointing to the explosive (position II), as shown in Figure 16. The predicted time of duration of positive phase was 1.87 ms following Kingery and Bulmash’s equation [29]. Position I was selected to capture the effect of the reflected pressure and impulse, whereas position II was selected to determine how an incident pressure and impulse would be at a certain distance from the structure and before the blast hits the structure.
The reflected pressure is another parameter that is important in assessing the damage of the slabs [30,31]. Slab 1 has the smallest reinforcement ratio of the entire test and it was subjected to higher pressure because of its small stand-off distance. Figure 17a shows the piezoelectric sensor that recorded the reflected blast pressure history (sensor 5). The accelerometer registered a maximum value of 2.025 g (19.63 m/s2) as shown in Figure 17b. Reflected pressure influences the acceleration of the slab, as the detonation height is 1.3 m and the distance of the slab from the ground is 40 cm. The velocity-time history can be determined by integrating acceleration-time history.
Slab 1 completely collapsed and the displacement meter failed to measure any values. Hence, the maximum displacement of the slab was not reported. Results from slab 1 revealed that the scaled distance (Z) had to be increased for the remaining tests. Hence, the scaled distances used in testing slabs 2 to 10 were higher than slab 1. The incident overpressure (Pso) measured during the test was compared with empirical values obtained from literature [18,19,20,32]. Table 4 shows the empirical equations.
The average maximum pressure value measured from the eight sensors during the test was 1100 kPa. This compares reasonably well with the values obtained from the empirical equations.
3.2. Slab 2 Results
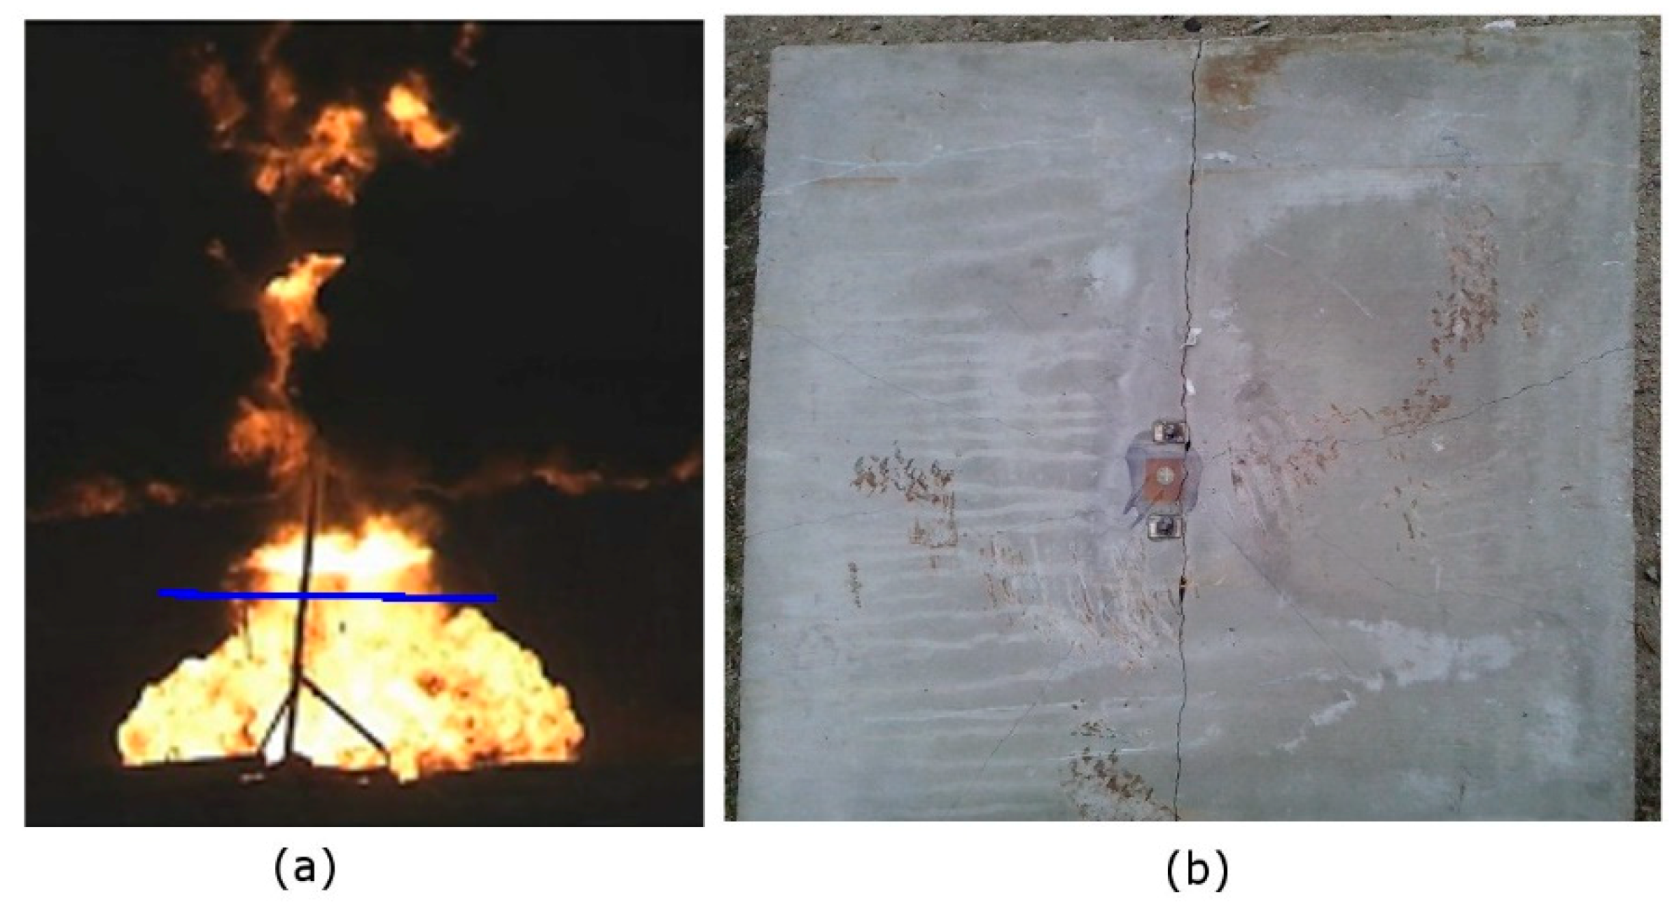
After slab 1 collapsed, the stand-off distance was increased for slab 2 resulting in a scaled distance value of Z = 1.43 m/kg1/3. Slab 2 also had a higher reinforcement ratio in one direction as shown in Table 1. The peak incident pressure was 496 kPa whereas the value predicted from empirical equations was 451 kPa [18]. The peak reflected pressure measured was 3801 kPa from sensor 4. The reflected wave going towards the slab can be seen in Figure 18a. This wave is traveling up and merging with a second wave heading towards the slab. A main crack was observed in the bottom surface of the slab as shown in Figure 18b.
The first value above ambient pressure read by the sensors are included in Table 5. Empirical values of incident pressure are shown in Table 6. Sensor 1 failed during the experiment.
It is worth noting changes in Henrych and Abrahamson’s equation compared to Table 4 because the new value of Z is now higher than 1.0 m/kg1/3.
The experimental specific impulse was given by the pressure curve integration of the positive phase and can be seen in Table 7. Theoretical time duration of positive phase is 1.17 ms [18] determined from Equation (1). Table 7 summarizes blast parameters from the slab 2 test.
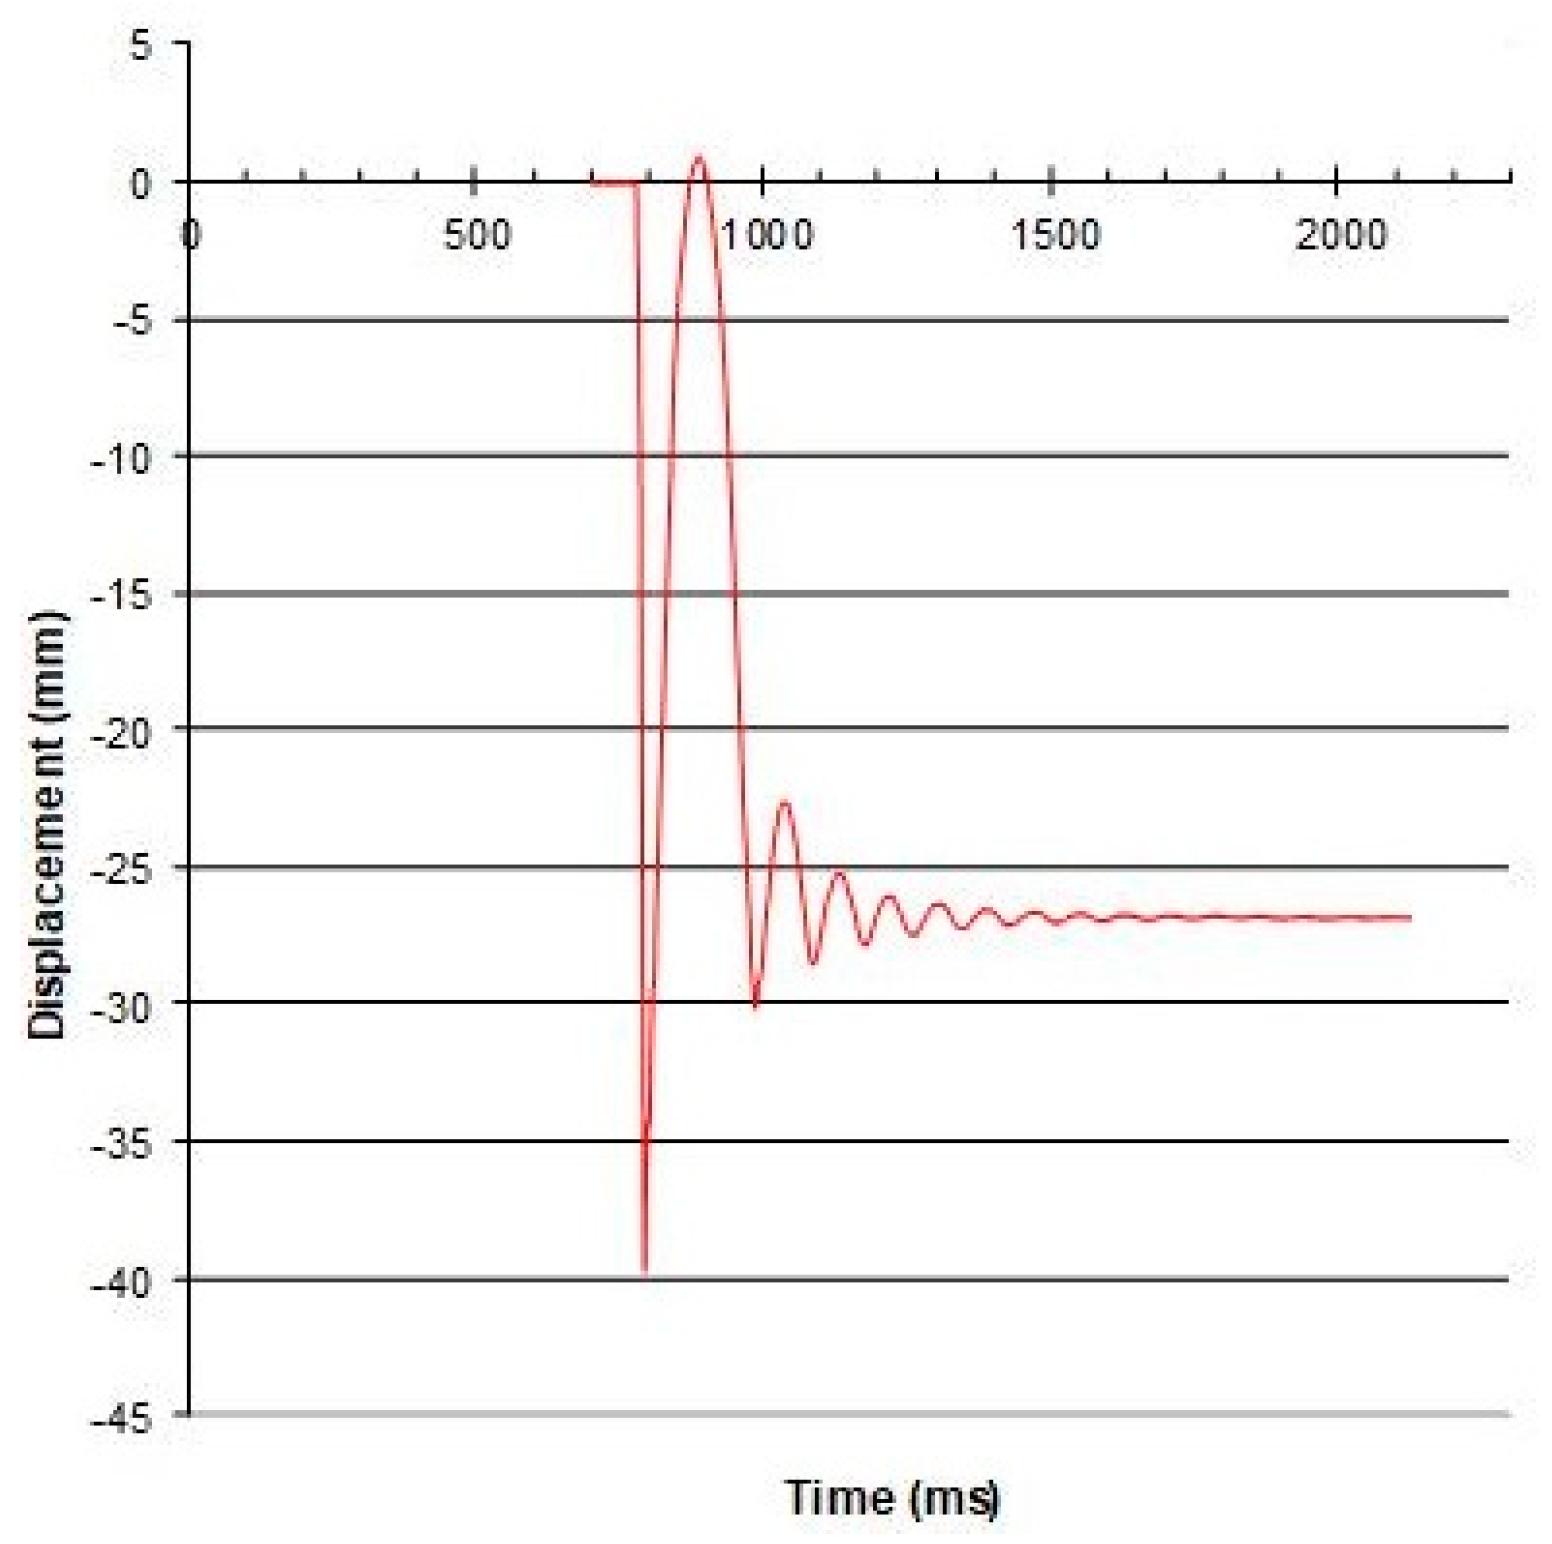
The displacement meter recorded 39.7 mm on the center of the slab bottom surface (Figure 19). The residual displacement of approximately 2.5 cm was associated with support displacements. The accelerometer in test 2 failed and no record was added on the database.
3.3. Slab 3 Results
Slab 3 had the same reinforcement ratio as slab 2 with an additional top 5 cm EPS (expanded polystyrene) foam retrofit [6] as shown in Figure 20a. Slab 3 collapsed completely as can be seen in Figure 20b. The foam was not sandwiched between plates and the explosion heat burned the foam and dispersed into air.
The highest pressure value measured was 1934 kPa. This value compared very well with predicted reflected pressure values (1940 kPa) from Kinney and Graham equation [18]. Table 8 shows the first value above ambient pressure read by the sensors.
Integration of experimental pressure curve during positive phase gives the positive specific impulse that can be seen in Table 9, with peak overpressure and time duration of positive phase for each sensor. The acceleration-time history is shown in Figure 21 with a peak of 4.36 g and reflected pressure influences due to the small detonation height (2.0 m) and the distance of 40 cm from the slab to the ground. The displacement meters recorded simply the final position of the displacement meters, since the slab filed.
3.4. Slab 4 Results
Slab 4 has the highest concrete compressive strength (60 MPa) with 0.25% reinforcement ratio in two-ways. The slab did not fail even though a pressure value as high as 4073 kPa was recorded. Measurement for the first value above ambient pressure read by the sensors is provided in Table 10.
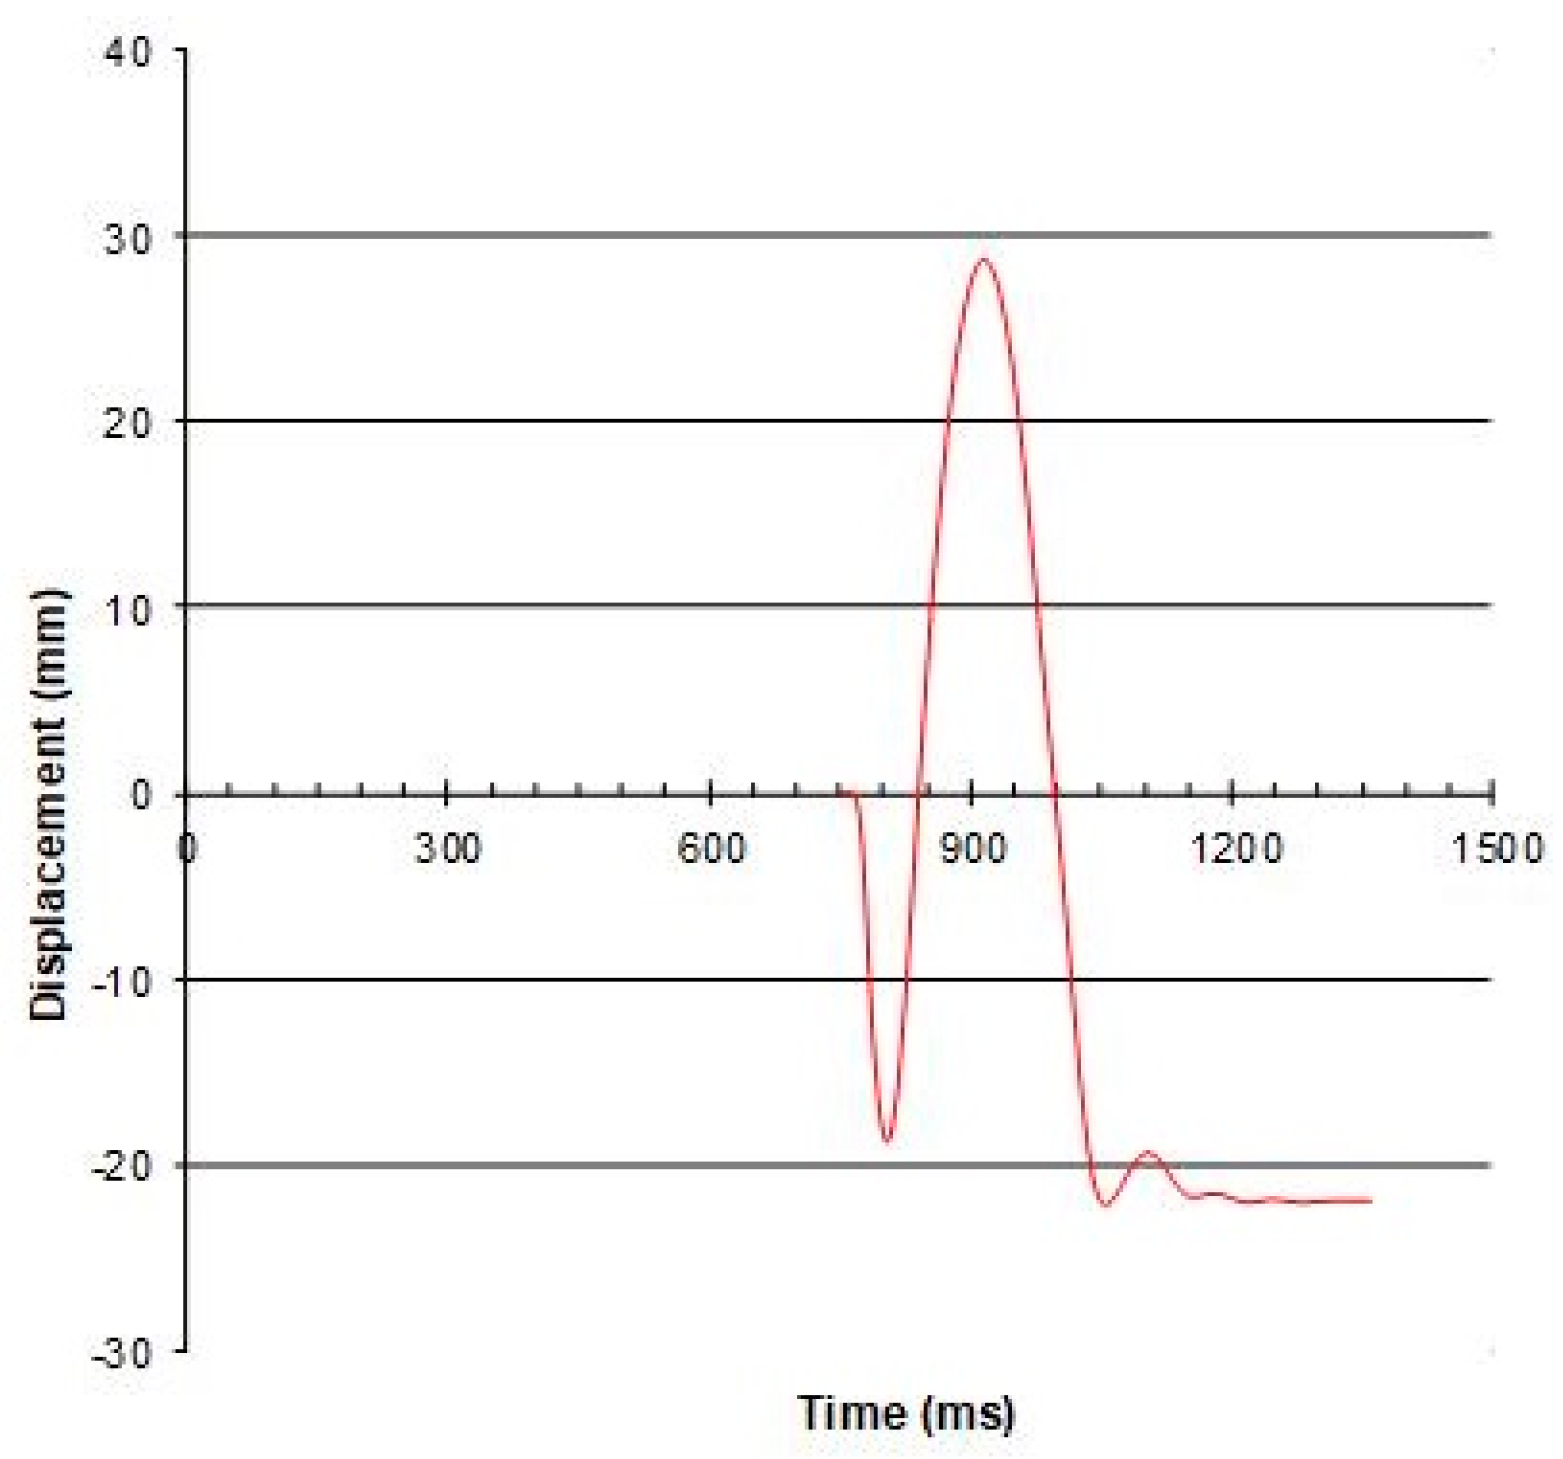
The comparison of each Pso value given by equations listed in Table 6 are close to first peak pressure shown in Table 11. Although the reflected pressure reached very high values, the slab did not fail. The blast wave parameters are shown in Table 11. Even though sensor 3 measured the highest peak overpressure, sensors such as 4 and 5 with peak overpressure around 50% lower generated very similar specific positive impulse because of the larger duration of time. The displacement meters recorded the data shown in Figure 22, where some rebounding were observed due to the slabs were not constructed in closed boxes. Slab 4 performed very well in resisting the blast load.
3.5. Slab 5 Results
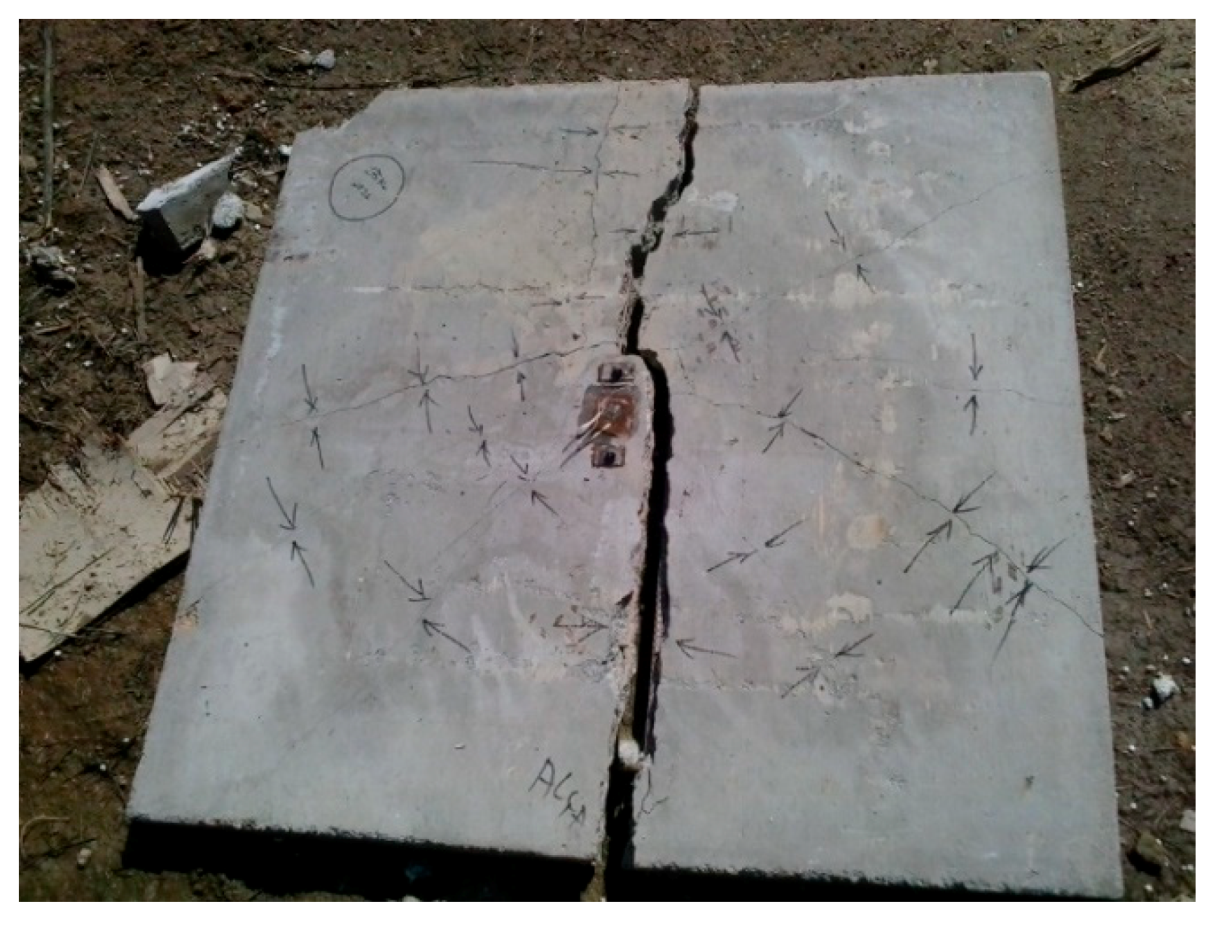
Slab 5 is similar to slab 2 in concrete strength and reinforcement ratio. The slab did not collapse completely as shown in Figure 23a. Large radial cracks were observed in the bottom surface of the slab as shown in Figure 23b, indicating that the reinforcement could withstand blast pressure and the highest pressure recorded was 2114 kPa.
The incident pressure values predicted using the equations in Table 6 are close to recorded Pso values. The first value above ambient pressure read by the sensors can be seen in Table 12. The blast wave parameters are shown in Table 13. The displacement meter measured 24.63 mm as the highest displacement of the center of the slab. The acceleration-time history recorded a peak of 7.26 g.
3.6. Slab 6 Results
This test was similar to test 3. As can be seen in Table 1, the slabs had the same Z value, standoff distance and equivalent TNT charge. In addition, they had an additional EPS foam on the upper face that was burned and the slab collapsed as shown in Figure 24. The burning of the foam was very similar to what was observed in the slab 3 test. The first value above ambient pressure read by the sensors is provided in Table 14. Table 15 shows blast wave parameters. Note that sensor 5 shows a long time duration. That implies the impulse was high leading to damage of the slab. The acceleration-time history recorded a peak of 8.06 g.
3.7. Slab 7 Results
This slab was made from concrete with a 60 MPa of compressive strength and 0.25% of reinforcement ratio. The slab did not collapse, but it had many cracks on the bottom surface, as shown in Figure 25. The highest pressure recorded by the sensors was 2654 kPa from sensor 3. The first value above ambient pressure read by the sensors are provided in Table 16. These values are close to predicted values obtained from equations listed in Table 6. Table 17 shows blast wave parameters. The displacement meters recorded the data above and below the initial position. The acceleration-time history recorded a peak of 15 g.
3.8. Slab 8 Results
This slab was made from 60 MPa of concrete compressive strength with 0.25% of reinforcement ratio each way and 5.0 cm EPS foam on the upper surface. It was possible to verify that there was concrete rupture by compression on the upper surface. The main cracks developed on the bottom surface of the slab and can be seen in Figure 26. The slab did not collapse completely. The highest pressure was 1984 kPa measured by sensor 8. The incident pressure measured from the piezoelectric sensors gave an average value slightly close to theoretical predicted value using Table 6 equations. Table 18 gives the first value above ambient pressure read by the sensors. Table 19 shows the blast wave parameters. The displacement meters recorded the highest values observed in all tests. There are no data for acceleration because the sensors failed during this test.
3.9. Slab 9 Results
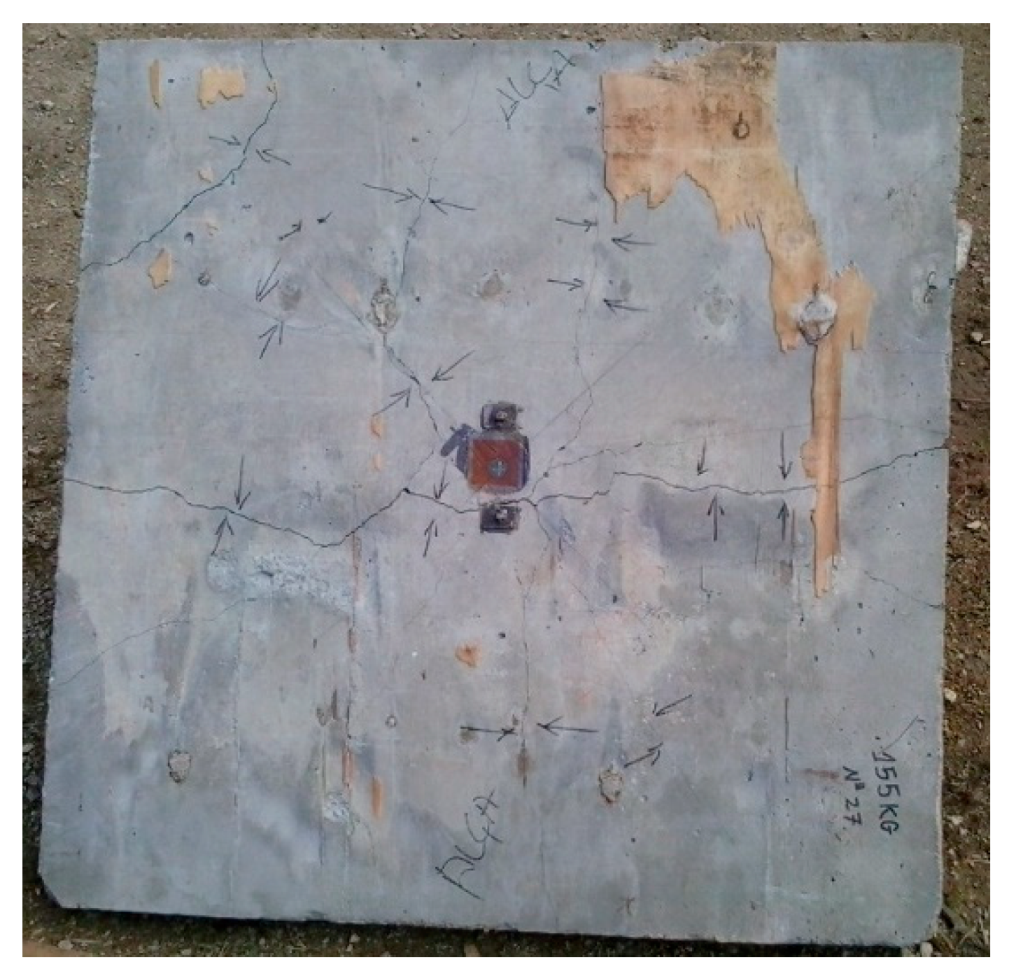
This slab was made from 60 MPa compressive strength concrete and 0.25% reinforcement ratio each way. Similar to slab 7, this slab did not collapse, but developed many cracks on the bottom surface as shown in Figure 27. The highest recorded pressure was 2029 kPa by sensor 3. The first value above ambient pressure read by the sensors is shown in Table 20. The blast wave parameters, including specific positive impulse values obtained by integrating the pressure-time histories, are provided in Table 21. The displacement meters recorded the data close to 25 mm as highest peak. The acceleration-time history recorded a peak of 4 g.
3.10. Slab 10 Results
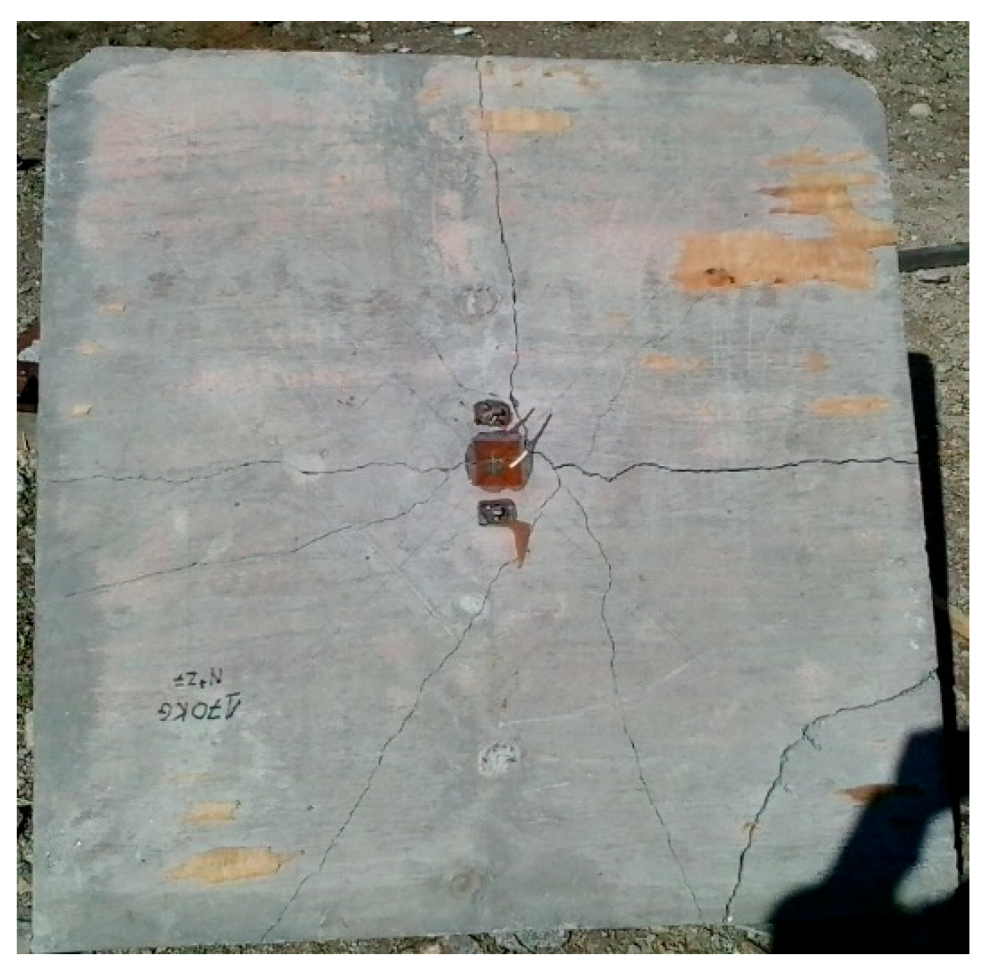
This slab was made from 40 MPa compressive strength concrete and 0.175% reinforcement ratio. The standoff distance of interest for this slab was 1.6 m. Figure 28 shows the collapse of the slab. The highest recorded pressure was 3084 kPa by sensor 7.
The first values above ambient pressure read by the sensors are shown in Table 22. The blast wave parameters, including specific positive impulse values obtained by integrating the pressure-time histories, are provided in Table 23. The displacement meters recorded only one peak, since the slab failed. There are no data for acceleration because the sensors failed during this test.
4. Discussion
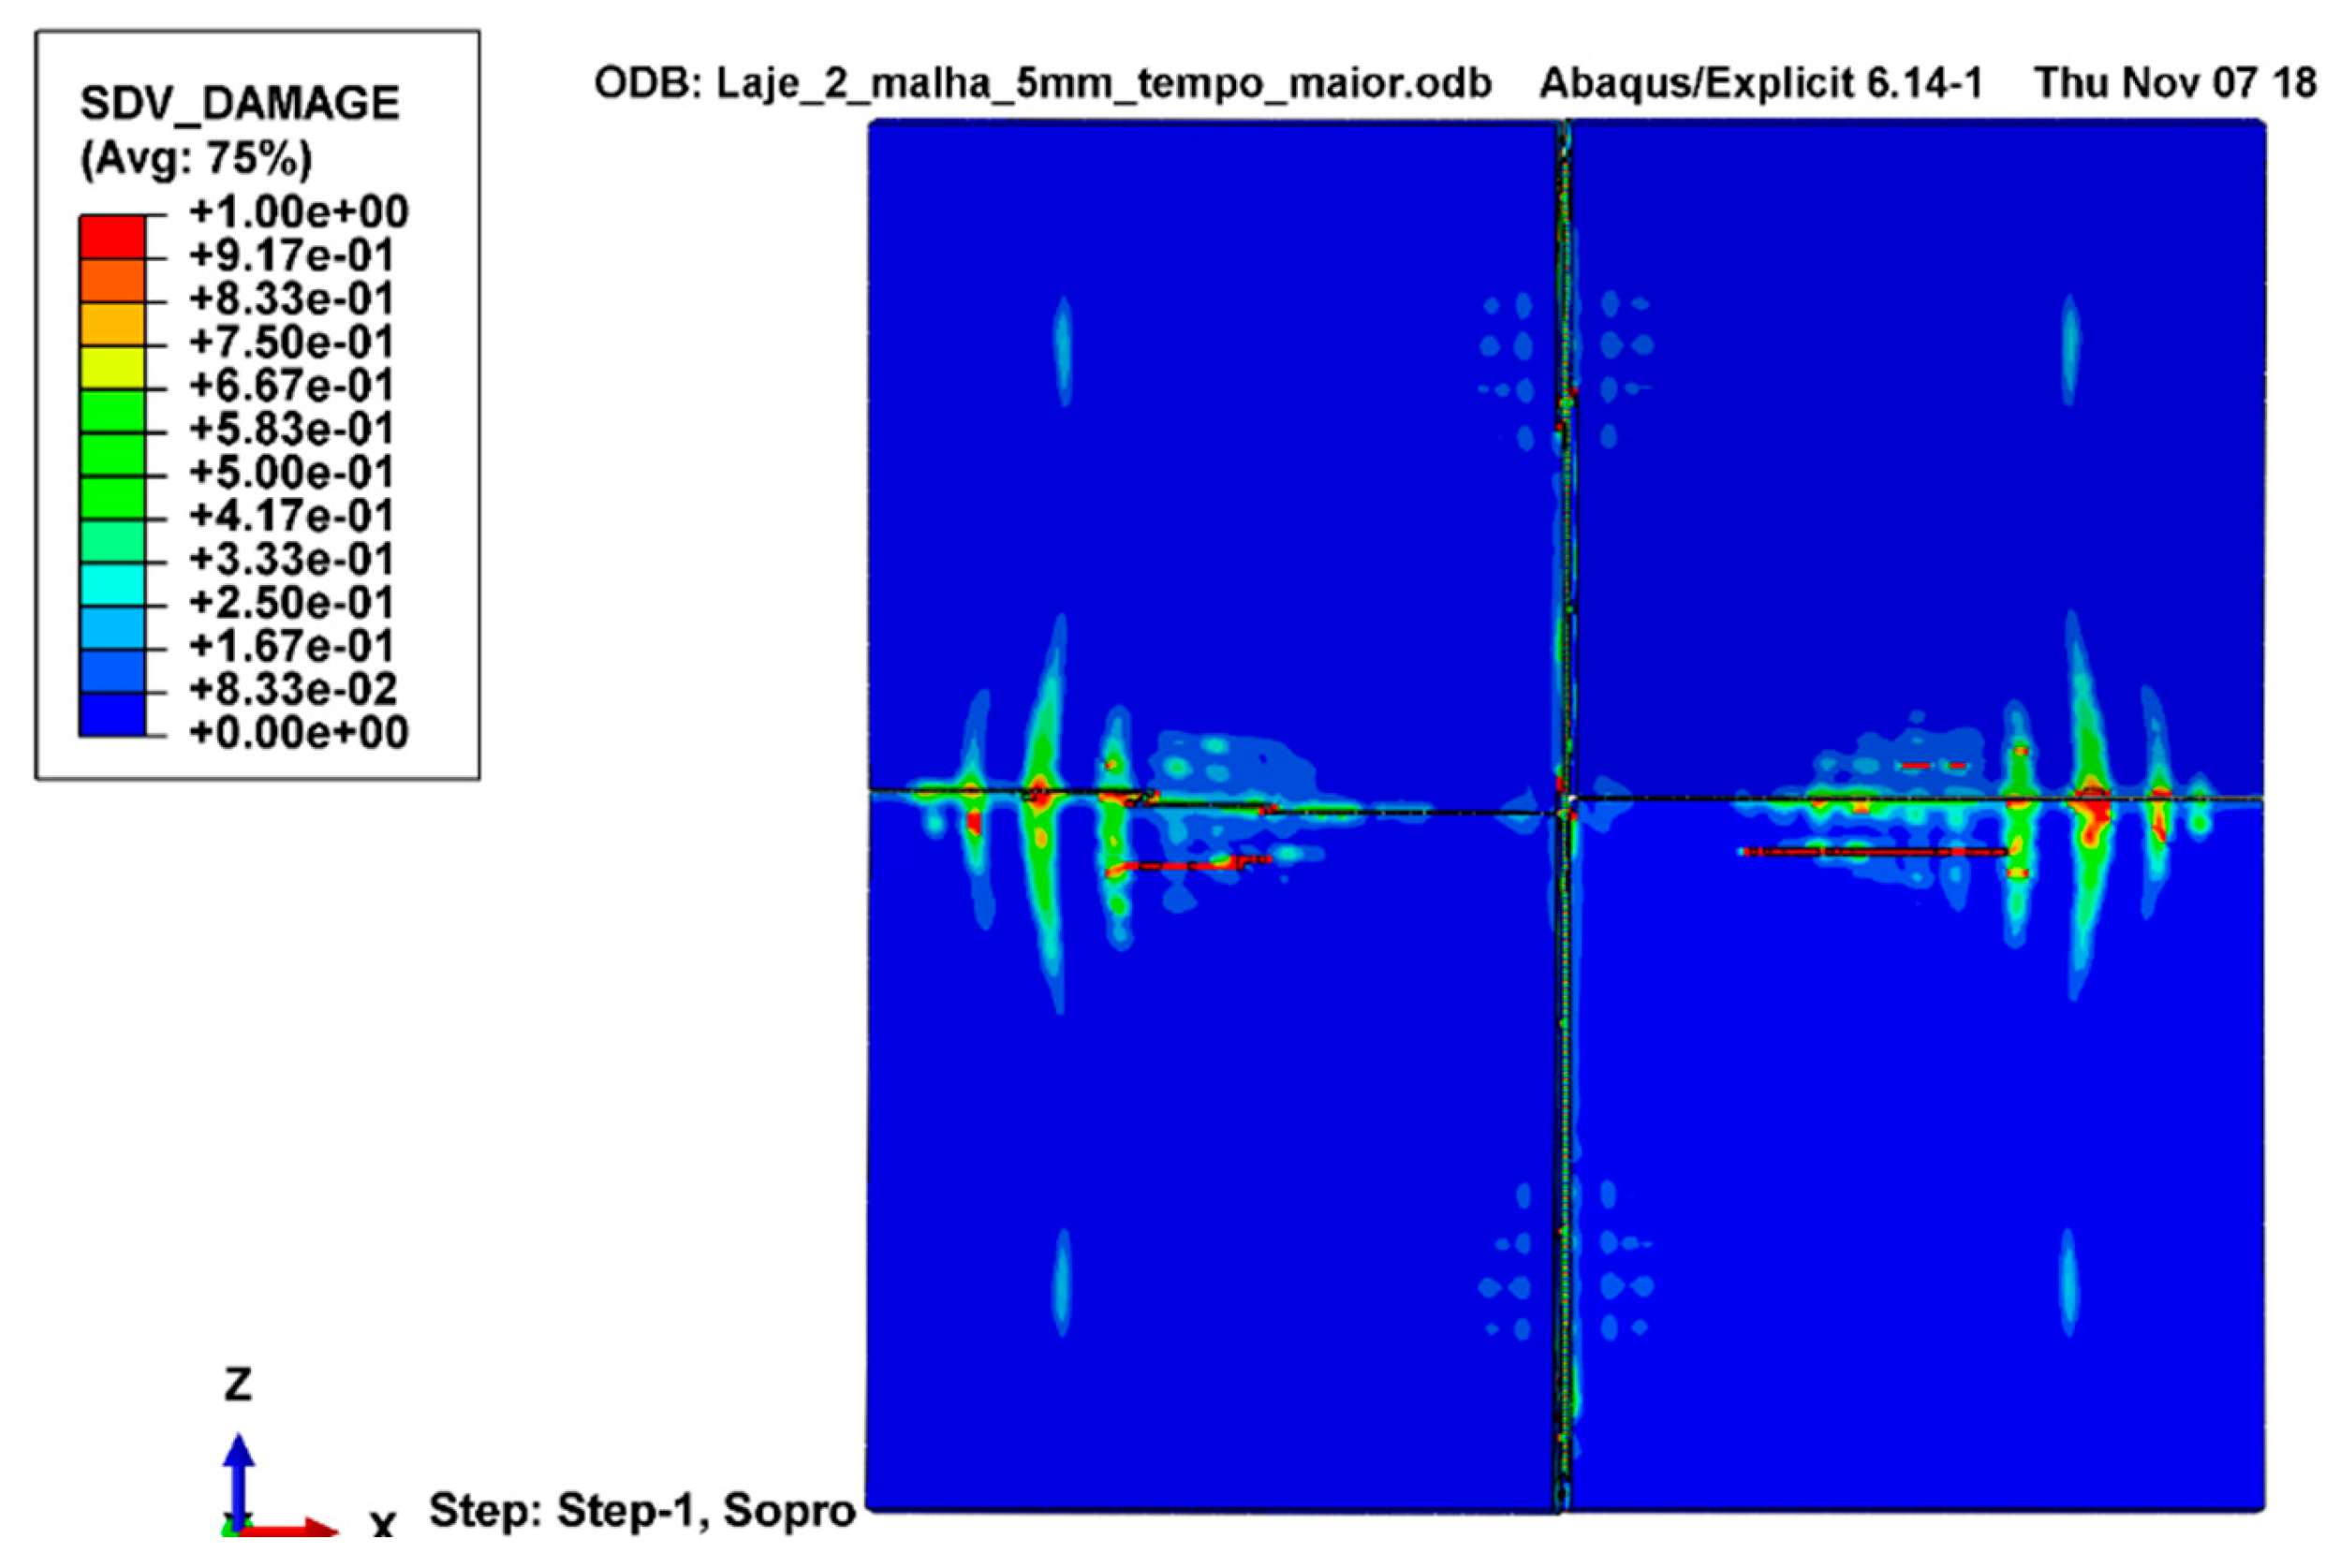
The availability of this test data is beneficial to the structural engineering community, particularly those interested in blast and impact effects on structures. First, the authors did not find curated data published in the ASCE Journal of Structural Engineering involving blast loading of structures. As such, this may motivate others to publish unclassified data from field scale blast tests. Second, the data can be used to verify finite element models. The major limitation of finite element models is the lack of an extensive database to verify model assumptions and the validation of results. As such, this data can be used for validation purposes. For example, Figure 29 and Figure 30 show the prediction of damage for slabs 5 and 10. Figure 31 shows the prediction of cracks on the underside face in slab 2.
Figure 29 shows the lateral view of slab 5. Comparing this to Figure 23a, similar damage patterns can be observed. Figure 30 shows that slab 10 collapsed. This damage was verified in the field test, as shown in Figure 28. Third, this paper presented a detailed explanation of the field test, instrumentation and pre-test verification. This will be beneficial for researchers who are contemplating designing experimental programs in the area of the blast response of structures with modest budgets.
5. Conclusions
This paper summarizes the experimental design, pre-test sensor verification, and data collection from 10 reinforced concrete slabs subjected to field explosions. The experimental record contains pressure, displacement, and acceleration measurements of each slab except in a few cases where the sensors failed. Post-test damage pictures are provided to highlight the crack and damage patterns. Still pictures from the explosion event are provided to describe selected parameters. The data are archived at George Mason Dataverse for future use by the structural engineering community. The benefits of the data to the structural engineering community include identifying blast damage patterns, providing insight into future blast test designs, and finite element model validation efforts.
6. Data Availability Statement
The experimental data discussed in this paper are archived at the George Mason Dataverse https://doi.org/10.15139/S3/98QQ9Q. The repository contains pressure, displacement, and acceleration time-history measurements of the ten reinforced concrete slabs.
Author Contributions
Conceptualization, F.B.M. and J.A.F.F.R.; methodology, J.A.F.F.R.; software, A.S.A.; validation, F.B.M., A.S.A. and G.S.U.; formal analysis, G.S.U.; investigation, F.B.M.; resources, J.A.F.F.R.; data curation, F.B.M., J.A.F.F.R. and G.S.U.; writing—original draft preparation, F.B.M.; writing—review and editing, F.B.M. and A.S.A.; visualization, F.B.M. and A.S.A.; supervision, J.A.F.F.R.; project administration, J.A.F.F.R. and G.S.U.; funding acquisition, G.S.U. All authors have read and agreed to the published version of the manuscript.
Funding
Brazilian Air Force and George Mason University funded this research.
Acknowledgments
The authors acknowledge the funding provided by the Science and Technology Aerospace Department (DCTA) of Brazil. The support received from the Brazilian Air Force during the field blast set-up and testing is recognized. Furthermore, the support provided by George Mason University during the primary author’s PhD international residency program is acknowledged.
Conflicts of Interest
The authors declare no conflict of interest.
References
- ASCE. Design of Blast-Resistant Buildings in Petrochemical Facilities, 2nd ed.; ASCE: Reston, VA, USA, 2010. [Google Scholar]
- Mostert, F.J. Challenges in blast protection research. Def. Technol. 2018, 14, 426–432. [Google Scholar] [CrossRef]
- Chiquito, M.; Castedo, R.; López, L.M.; Santos, A.P.; Mancilla, J.M.; Yenes, J.I. Blast Wave Characteristics and TNT Equivalent of Improvised Explosive Device at Small-scaled Distances. Def. Sci. J. 2019, 69, 328–335. [Google Scholar] [CrossRef] [Green Version]
- Elshenawy, T.; Seoud, M.A.; Abdo, G.M. Ballistic Protection of Military Shelters from Mortar Fragmentation and Blast Effects using a Multi-layer Structure. Def. Sci. J. 2019, 69, 538–544. [Google Scholar] [CrossRef] [Green Version]
- Hajek, R.; Foglar, M.; Fladr, J. Influence of barrier material and barrier shape on blast wave mitigation. Constr. Build. Mater. 2016, 120, 54–64. [Google Scholar] [CrossRef]
- Mendonça, F.B.; Urgessa, G.S.; Dutra, R.L.; Boschi, R.F.; Iha, K.; Rocco, J.A.F.F. EPS foam blast attenuation in full-scale field test of reinforced concrete slabs. Acta Sci. Civ. Eng. 2020, 42, 1–7. [Google Scholar] [CrossRef]
- Sandhu, I.S.; Thangadurai, M.; Alegaonkar, P.S.; Saroha, D.R. Mitigation of Blast Induced Acceleration using Open Cell Natural Rubber and Synthetic Foam. Def. Sci. J. 2019, 69, 53–57. [Google Scholar] [CrossRef]
- Kong, X.; Qi, X.; Gu, Y.; Lawan, I.A.; Qu, Y. Numerical evaluation of blast resistance of RC slab strengthened with AFRP. Constr. Build. Mater. 2018, 178, 244–253. [Google Scholar] [CrossRef]
- Augusto, A.S. Modelagem Computacional do Efeito de Onda de Choque de Alto Explosivo Sobre Laje de Concreto Armado. Master’s Thesis, Aeronautical Institute of Technology, São José dos Campos, São Paulo, Brazil, 2020. [Google Scholar]
- Syed, Z.I.; Raman, S.N.; Ngo, T.; Mendis, P.; Pham, T. The Failure Behaviour of Reinforced Concrete Panels Under Far-field and Near-field Blast Effects. Structures 2018, 14, 220–229. [Google Scholar] [CrossRef]
- Mendonça, F.B.; Urgessa, G.S.; Rocco, J.A.F.F. Blast Response of 60 MPa Reinforced Concrete Slabs Subjected to Non-Confined Plastic Explosives. In Proceedings of the Structures Congress 2017—ASCE, Denver, CO, USA, 6–8 April 2017; pp. 15–26. [Google Scholar] [CrossRef]
- ABNT, NBR 12655/96. Concreto-Preparo, Controle e Recebimento; ABNT: Rio de Janeiro, Brazil, 1996; p. 7. [Google Scholar]
- ABNT, NBR 6118/14. Projeto de Estruturas de Concreto-Procedimento; ABNT: Rio de Janeiro, Brasil, 2014; p. 256. [Google Scholar]
- ABNT, NBR 14931/04. Execução de Estruturas de Concreto-Procedimento; ABNT: Rio de Janeiro, Brasil, 2004; p. 53. [Google Scholar]
- Urgessa, G.; Mendonca, F.B.; Rocco, J.A.F.F. Experimental Records from Blast Tests of Ten Reinforced Concrete Slabs; George Mason University: Fairfax, VA, USA, 2020. [Google Scholar] [CrossRef]
- Mendonca, F.B.; Urgessa, G.; Iha, K.; Rocha, R.J.; Rocco, J.A.F.F. Comparison of Predicted and Experimental Behaviour of RC Slabs Subjected to Blast using SDOF Analysis. Def. Sci. J. 2018, 68, 138–143. [Google Scholar] [CrossRef]
- Mendonça, F.B.; Urgessa, G.S. Pre-Test and Analysis of a Reinforced Concrete Slab Subjected to Blast from a Non-Confined Explosive. In Energetic Materials Research, Applications and New Technologies, 1st ed.; Gonçalves, R.F.B., Rocco, J.A.F.F., Iha, K., Eds.; IGI Global: Hershey, PA, USA, 2017; pp. 272–287. [Google Scholar] [CrossRef]
- Kinney, G.F.; Graham, K.J. Explosive Shocks in Air, 2nd ed.; Springer Science: New York, NY, USA, 1985. [Google Scholar]
- Silva, W.C.L. Blast–Efeitos da Onda de Choque no ser Humano e Nas Estruturas. Master’s Thesis, Aeronautical Institute of Technology, São José dos Campos, São Paulo, Brazil, 2007. [Google Scholar]
- Goel, M.D.; Matsagar, V.A.; Gupta, A.K.; Marburg, S. An abridged review of blast wave parameters. Def. Sci. J. 2012, 62, 300–306. [Google Scholar] [CrossRef] [Green Version]
- Simulia. Abaqus. Dassault Systèmes, Vélizy-Villacoublay. 2014. Available online: https://www.3ds.com/products-services/simula/products/abaqus (accessed on 8 February 2020).
- Johnson, G.; Holmquist, T. An Improved Computational Constitutive Model for Brittle Materials. In Proceedings of the AIP Conference Proceedings 309, American Institute of Physics, Melville, NY, USA, 28 June–2 July 1993; pp. 981–984. [Google Scholar] [CrossRef]
- Holmquist, T.; Johnson, G.; Cook, W. A Computational Constitutive Model for Concrete Subjected to Large Strains, High Strain Rates, and High Pressures. In Proceedings of the International Symposium on Ballistics 14, International Ballistics Society, Quebec City, QC, Canada, 26–29 September 1993; pp. 591–600, ISBN 0961815681. [Google Scholar]
- Johnson, G.; Cook, W. A Constitutive Model and Data for Metals Subjected to Large Strains, High Strain Rates and High Temperatures. In Proceedings of the Seventh International Symposium on Ballistics, International Ballistics Society, The Hague, South Holland, The Netherlands, 19–21 April 1983; pp. 541–547. Available online: https://archive.org/details/AConstitutiveModelAndDataForMetals/mode/2up (accessed on 10 February 2020).
- Simulia Abaqus Theory Manual; Dassault Systèmes: Vélizy-Villacoublay, France, 2014.
- Hyde, D.W. Conventional Weapons Effect (CONWEP)—Application of TM5-855-1; Department of the Army: Vicksburg, MS, USA, 1988.
- Wang, W.; Zhang, D.; Lu, F.; Wang, S.C.; Tang, F. Experimental study and numerical simulation of the damage mode of a square reinforced concrete slab under close-in explosion. Eng. Fail. Anal. 2013, 27, 41–51. [Google Scholar] [CrossRef]
- Dharma Rao, V.; Srinivas Kumar, A.; Venkateswara Rao, K.; Krishna Prasad, V.S.R. Theoretical and experimental studies on blast wave propagation in air. Propellants Explos. Pyrotech. 2015, 1, 138–143. [Google Scholar] [CrossRef]
- Kingery, C.N.; Bulmash, G. Airblast Parameters from TNT Spherical Air Bursts and Hemispherical Surface Bursts. US Technical Report ARBRL-TR-02555; US Army: Harford, MD, USA, 1984.
- Wu, C.; Sheikh, H. A finite element modelling to investigate the mitigation of blast effects on reinforced concrete panel using foam cladding. Int. J. Impact Eng. 2013, 55, 24–33. [Google Scholar] [CrossRef]
- Dusenberry, D.O. Handbook for Blast-Resistant Design of Buildings, 1st ed.; John Wiley and Sons: Hoboken, NJ, USA, 2010. [Google Scholar]
- Smith, P.D.; Hetherington, J.G. Blast and Ballistic Loading of Structures, 1st ed.; Butterworth-Heinemann: London, UK, 1994. [Google Scholar]
- Brode, H.L. Numerical solutions of spherical blast waves. J. Appl. Phys. 1955, 26, 766–775. [Google Scholar] [CrossRef]
- Henrych, J.; Abrahamson, G.R. The Dynamics of Explosion and Its Use, 1st ed.; Elsevier Ltd: Amsterdam, The Netherlands, 1979; Volume 47. [Google Scholar] [CrossRef]
Figure 1.
Schematic of the test setup.

Figure 2.
Cross-section of the slabs: (a) two-way with additional two 10 mm rebars in one-way; (b) two-way only.
Figure 2.
Cross-section of the slabs: (a) two-way with additional two 10 mm rebars in one-way; (b) two-way only.

Figure 3.
Test setup.

Figure 4.
Five pressure sensors positioned close to the slab indicated by arrows.

Figure 5.
Representative slabs 15 days after casting.

Figure 6.
Two-way rebars, 5.0 mm in diameter at 15 cm.

Figure 7.
(a) Accelerometer circuit; (b) circuit shielded by lead box with foam.

Figure 8.
Accelerometer and main circuit.

Figure 9.
Setup of the displacement meters with potentiometers in the black box.

Figure 10.
Strain gages.

Figure 11.
Pressure sensor pointing to the explosive.

Figure 12.
Camera placed 180 m from the test location.

Figure 13.
Pressure sensors used for verification test.

Figure 14.
Verification of displacement sensors.

Figure 15.
(a) Slab 1 collapsed. (b) Crack patterns.

Figure 16.
Position of the sensors.

Figure 17.
(a) Representative pressure-time history. (b) Acceleration-time history.

Figure 18.
(a) The reflected blast wave shown above the blue line; (b) bottom surface after test.

Figure 19.
Readings from displacement meters—slab 2.

Figure 20.
(a) Slab 3 with foam retrofit; (b) slab 3 collapsed after test.

Figure 21.
Acceleration-time history for slab 3.

Figure 22.
Readings from displacement meters—slab 4.

Figure 23.
Slab 5 (a) upper surface after explosion. (b) Bottom surface.

Figure 24.
Bottom surface of slab 6 after test. Arrows point to radial cracks.

Figure 25.
Bottom surface of slab 7 after test.

Figure 26.
Bottom surface of slab 8 after test.

Figure 27.
Bottom surface of slab 9 after test.

Figure 28.
Slab 10 after test. Arrows point to the radial cracks.

Figure 29.
Slab 5 damage 21.5 ms after blast impact.

Figure 30.
Finite element modeling (FEM) of the collapse of slab 10.

Figure 31.
Slab 2 underside 50 ms after blast impact.


Table 1.
Blast test details. Slabs with asterisk (*) have additional 50 mm foam retrofit on the top.
Table 1.
Blast test details. Slabs with asterisk (*) have additional 50 mm foam retrofit on the top.
| Slab | fck (MPa) | Bar Diam. (mm) | Rebar Spacing (cm) | Rebar Direct. | Reinforc. Ratio | TNT Mass (kg) | Stand-off Distance (m) | Z (m/kg1/3) |
|---|---|---|---|---|---|---|---|---|
| 1 | 40 | 5 | 15 | Two way | 0.17% | 2.76 | 1.3 | 0.93 |
| 2 | 50 | 5 | 15 | Two way | 0.17% | 2.72 | 2 | 1.43 |
| 10 | 10 | One way | 0.37% | |||||
| 3 * | 50 | 5 | 15 | Two way | 0.17% | 2.71 | 2 | 1.43 |
| 10 | 10 | One way | 0.37% | |||||
| 4 | 60 | 5 | 10 | Two way | 0.25% | 2.69 | 2 | 1.44 |
| 5 | 50 | 5 | 15 | Two way | 0.17% | 2.58 | 2 | 1.46 |
| 10 | 10 | One way | 0.37% | |||||
| 6 * | 50 | 5 | 15 | Two way | 0.17% | 2.72 | 2 | 1.43 |
| 10 | 10 | One way | 0.37% | |||||
| 7 | 60 | 5 | 10 | Two way | 0.25% | 2.60 | 2 | 1.45 |
| 8 * | 60 | 5 | 10 | Two way | 0.25% | 2.76 | 2 | 1.42 |
| 9 | 60 | 5 | 10 | Two way | 0.25% | 2.72 | 2 | 1.43 |
| 10 | 40 | 5 | 15 | Two way | 0.17% | 2.60 | 1.6 | 1.16 |
Table 2.
Pressure sensor measurements for the verification test.
| Sensor | Distance from Explosive (cm) | Pso (Measured) (kPa) | Pso (Predicted) (kPa) |
|---|---|---|---|
| A | 66 | 917 | |
| B | 66 | 866 | |
| C | 62 | 746 | |
| D | 65 | 1052 | |
| Average | 895 | 780 | |
| E | 56 | 1365 | |
| F | 57 | 961 | |
| G | 59 | 637 | |
| H | 56 | 879 | |
| Average | 960 | 1025 |
Table 3.
Blast wave parameters—slab 1.
| Sensor | Position | Peak Pressure (kPa) | Time of Duration (ms) | Impulse (kPa-ms) |
|---|---|---|---|---|
| 1 | II | 1578 | 0.5 | 462 |
| 2 | I | 844 | 1.01 | 485 |
| 3 | II | 1310 | 0.53 | 379 |
| 4 | II | 1012 | 0.93 | 505 |
| 5 | I | 1997 | 1.35 | 1112 |
| 6 | II | 821 | 0.43 | 319 |
| 7 | I | 847 | 0.92 | 633 |
| 8 | I | 686 | 0.93 | 481 |
Table 4.
Incident pressure prediction for slab 1 experiment.
| Equation | Reference | Pso Value (kPa) |
|---|---|---|
| [18] | 1187 | |
| [33] | 1007 | |
| [34] | 898 | |
| Blast wave curves | [29] | 1105 |
Table 5.
First recorded pressure for each piezoelectric sensor in test 2.
| Sensors First Recorded Pressure Value (kPa) | |||||||
|---|---|---|---|---|---|---|---|
| S 01 | S02 | S 03 | S 04 | S 05 | S 06 | S 07 | S 08 |
| Failed | 257 | 696 | 938 | 279 | 233 | 292 | 632 |
Table 6.
Incident pressure prediction for slab 2 experiment.
| Equation | Reference | Pso Value (kPa) |
|---|---|---|
| [18] | 451 | |
| [33] | 335 | |
| [34] | 353 | |
| Blast wave curves | [29] | 414 |
Table 7.
Blast wave parameters—slab 2.
| Sensor | Position | Peak Pressure (kPa) | Time of Duration (ms) | Impulse (kPa-ms) |
|---|---|---|---|---|
| 1 | II | - | - | - |
| 2 | II | 718 | 0.62 | 310 |
| 3 | I | 2634 | 1.07 | 842 |
| 4 | I | 3801 | 2.24 | 1966 |
| 5 | II | 1303 | 3.00 | 1363 |
| 6 | I | 2215 | 0.76 | 789 |
| 7 | I | 2159 | 0.63 | 856 |
| 8 | I | 1327 | 0.73 | 568 |
Table 8.
First recorded pressure for each piezoelectric sensor in test 3.
| Sensors First Recorded Pressure Value (kPa) | |||||||
|---|---|---|---|---|---|---|---|
| S 01 | S02 | S 03 | S 04 | S 05 | S 06 | S 07 | S 08 |
| 227 | 226 | 407 | 600 | 279 | 370 | 567 | 416 |
Table 9.
Blast wave parameters—slab 3.
| Sensor | Position | Peak Pressure (kPa) | Time of Duration (ms) | Impulse (kPa-ms) |
|---|---|---|---|---|
| 1 | II | 579 | 0.93 | 352 |
| 2 | II | 496 | 0.63 | 263 |
| 3 | I | 1440 | 1.37 | 767 |
| 4 | I | 1934 | 0.99 | 839 |
| 5 | II | 881 | 2.59 | 1245 |
| 6 | I | 1130 | 1.20 | 632 |
| 7 | I | 1850 | 1.37 | 1150 |
| 8 | I | 1070 | 46.54 | 3652 |
Table 10.
First recorded pressure for each piezoelectric sensor in test 4.
| Sensors First Recorded Pressure Value (kPa) | |||||||
|---|---|---|---|---|---|---|---|
| S 01 | S02 | S 03 | S 04 | S 05 | S 06 | S 07 | S 08 |
| 231 | 294 | 568 | 410 | 267 | 172 | 541 | 403 |
Table 11.
Blast wave parameters—slab 4.
| Sensor | Position | Peak Pressure (kPa) | Time of Duration (ms) | Impulse (kPa-ms) |
|---|---|---|---|---|
| 1 | II | 913 | 0.82 | 389 |
| 2 | II | 755 | 0.60 | 295 |
| 3 | I | 4073 | 1.13 | 929 |
| 4 | I | 2374 | 1.33 | 912 |
| 5 | II | 986 | 1.75 | 908 |
| 6 | I | 3593 | 0.64 | 835 |
| 7 | I | 2317 | 0.92 | 912 |
| 8 | I | 1986 | 0.76 | 456 |
Table 12.
First recorded pressure for each piezoelectric sensor in test 5.
| Sensors First Recorded Pressure Value (kPa) | |||||||
|---|---|---|---|---|---|---|---|
| S 01 | S02 | S 03 | S 04 | S 05 | S 06 | S 07 | S 08 |
| 292 | 352 | 498 | 748 | 372 | 382 | 985 | 370 |
Table 13.
Blast wave parameters—slab 5.
| Sensor | Position | Peak Pressure (kPa) | Time of Duration (ms) | Impulse (kPa-ms) |
|---|---|---|---|---|
| 1 | II | 799 | 0.67 | 381 |
| 2 | II | 937 | 0.61 | 385 |
| 3 | I | 1390 | 0.76 | 633 |
| 4 | I | 2000 | 0.84 | 753 |
| 5 | II | 1497 | 1.60 | 947 |
| 6 | II | 933 | 0.71 | 384 |
| 7 | I | 2114 | 0.77 | 1084 |
| 8 | I | 1691 | 1.16 | 556 |
Table 14.
First recorded pressure for each piezoelectric sensor in test 6.
| Sensors First Recorded Pressure Value (kPa) | |||||||
|---|---|---|---|---|---|---|---|
| S 01 | S02 | S 03 | S 04 | S 05 | S 06 | S 07 | S 08 |
| 262 | 271 | 334 | 332 | 278 | 352 | 602 | 268 |
Table 15.
Blast wave parameters—slab 6.
| Sensor | Position | Peak Pressure (kPa) | Time of Duration (ms) | Impulse (kPa-ms) |
|---|---|---|---|---|
| 1 | II | 480 | 0.46 | 257 |
| 2 | II | 307 | 0.54 | 145 |
| 3 | I | 998 | 0.63 | 388 |
| 4 | I | 1026 | 1.08 | 709 |
| 5 | II | 1071 | 5.40 | 2453 |
| 6 | II | 413 | 1.21 | 385 |
| 7 | I | 1219 | 2.67 | 1393 |
| 8 | I | 961 | 1.62 | 597 |
Table 16.
First recorded pressure for each piezoelectric sensor in test 7.
| Sensors First Recorded Pressure Value (kPa) | |||||||
|---|---|---|---|---|---|---|---|
| S 01 | S02 | S 03 | S 04 | S 05 | S 06 | S 07 | S 08 |
| 215 | 245 | 336 | 297 | 209 | 275 | 515 | 244 |
Table 17.
Blast wave parameters—slab 7.
| Sensor | Position | Peak Pressure (kPa) | Time of Duration (ms) | Impulse (kPa-ms) |
|---|---|---|---|---|
| 1 | II | 821 | 0.84 | 430 |
| 2 | II | 495 | 0.74 | 241 |
| 3 | I | 2654 | 0.74 | 960 |
| 4 | I | 1687 | 0.62 | 603 |
| 5 | II | 1543 | 1.65 | 1001 |
| 6 | II | 956 | 0.95 | 367 |
| 7 | I | 2239 | 2.34 | 1203 |
| 8 | I | 2180 | 0.41 | 654 |
Table 18.
First recorded pressure for each piezoelectric sensor in test 8.
| Sensors First Recorded Pressure Value (kPa) | |||||||
|---|---|---|---|---|---|---|---|
| S 01 | S02 | S 03 | S 04 | S 05 | S 06 | S 07 | S 08 |
| 234 | 226 | 285 | 253 | 267 | 243 | 533 | 363 |
Table 19.
Blast wave parameters—slab 8.
| Sensor | Position | Peak Pressure (kPa) | Time of Duration (ms) | Impulse (kPa-ms) |
|---|---|---|---|---|
| 1 | II | 740 | 0.28 | 202 |
| 2 | II | 596 | 0.44 | 176 |
| 3 | I | 825 | 0.47 | 258 |
| 4 | I | 1057 | 2.41 | 841 |
| 5 | II | 1296 | 2.75 | 1821 |
| 6 | II | 763 | 0.47 | 341 |
| 7 | I | 1450 | 2.41 | 1477 |
| 8 | I | 1984 | 1.39 | 839 |
Table 20.
First recorded pressure for each piezoelectric sensor in test 9.
| Sensors First Recorded Pressure Value (kPa) | |||||||
|---|---|---|---|---|---|---|---|
| S 01 | S02 | S 03 | S 04 | S 05 | S 06 | S 07 | S 08 |
| 245 | 316 | 300 | 403 | 314 | 268 | 221 | 506 |
Table 21.
Blast wave parameters—slab 9.
| Sensor | Position | Peak Pressure (kPa) | Time of Duration (ms) | Impulse (kPa-ms) |
|---|---|---|---|---|
| 1 | II | 1052 | 0.31 | 299 |
| 2 | II | 442 | 0.78 | 291 |
| 3 | I | 2029 | 0.65 | 844 |
| 4 | I | 1874 | 0.66 | 883 |
| 5 | II | 1216 | 1.55 | 1116 |
| 6 | II | 746 | 0.92 | 472 |
| 7 | I | 1831 | 2.23 | 1069 |
| 8 | I | 1490 | 0.37 | 355 |
Table 22.
First recorded pressure for each piezoelectric sensor in test 9.
| Sensors First Recorded Pressure Value (kPa) | |||||||
|---|---|---|---|---|---|---|---|
| S 01 | S02 | S 03 | S 04 | S 05 | S 06 | S 07 | S 08 |
| 314 | 217 | 1000 | 876 | 327 | 364 | 913 | 309 |
Table 23.
Blast wave parameters—slab 10.
| Sensor | Position | Peak Pressure (kPa) | Time of Duration (ms) | Impulse (kPa-ms) |
|---|---|---|---|---|
| 1 | II | 1107 | 0.45 | 286 |
| 2 | II | 538 | 0.72 | 206 |
| 3 | I | 2944 | 0.34 | 533 |
| 4 | I | 3066 | 2.26 | 1779 |
| 5 | II | 971 | 1.47 | 964 |
| 6 | II | 2472 | 2.43 | 1416 |
| 7 | I | 3084 | 2.35 | 1481 |
| 8 | I | 1699 | 0.35 | 443 |
© 2020 by the authors. Licensee MDPI, Basel, Switzerland. This article is an open access article distributed under the terms and conditions of the Creative Commons Attribution (CC BY) license (http://creativecommons.org/licenses/by/4.0/).
Share and Cite
MDPI and ACS Style
Mendonça, F.B.; Urgessa, G.S.; Augusto, A.S.; Rocco, J.A.F.F. Experimental Records from Blast Tests of Ten Reinforced Concrete Slabs. CivilEng 2020, 1, 51-74. https://doi.org/10.3390/civileng1020005
AMA Style
Mendonça FB, Urgessa GS, Augusto AS, Rocco JAFF. Experimental Records from Blast Tests of Ten Reinforced Concrete Slabs. CivilEng. 2020; 1(2):51-74. https://doi.org/10.3390/civileng1020005
Chicago/Turabian StyleMendonça, Fausto B., Girum S. Urgessa, Anselmo S. Augusto, and José A. F. F. Rocco. 2020. "Experimental Records from Blast Tests of Ten Reinforced Concrete Slabs" CivilEng 1, no. 2: 51-74. https://doi.org/10.3390/civileng1020005