1. Introduction
Currently, in the food industry, organoleptic profile (appearance, color, texture, flavor, and taste) is based on the examination of a product through the evaluation of the attributes perceptible by the five sense organs (sight, touch, smell, taste, and hearing) [
1]. As such, they play an important role in evaluating the food quality, developing new products, and establishing standards to determine the acceptability of products by consumer perception. For example, the presence of a bad taste, odor, or color changes due to a lack of efficient control and monitoring systems in food production, is evidence of food insecurity which can reveal a problem for both consumption and commercialization of the products [
2,
3]. However, the analysis based on the sense organs (sensory analysis) is a subjective method because it depends on the perception of the consumer; for instance, one person may describe a sample as unpleasant while another may consider the selection acceptable [
4,
5]. This variation in food perception is based on distinctive food cues, cultural background, habits, social environment, and emotions [
2]. That is why, in order to obtain more objectivity in sensory analysis, a group of panelists must be trained to acquire a level of sensory acuity and to provide reproducible results [
6,
7]. However, sensory evaluation has some disadvantages as it is often time-consuming, expensive, inappropriate for timely measurements, inconsistent, and unpredictable due to various human factors. Furthermore, training sensory panelists can be complicated as protocols and training parameters should be carefully designed based on a food matrix, and any possible variations between samples caused by formulation, processing, packaging, and storage conditions of the food in question should be taken into consideration [
8,
9].
To overcome the disadvantages of the sensory evaluation method, different analytical techniques such as mass spectrometry (MS) coupled with liquid chromatography (LC) or gas chromatography (GC) are also used in the food industry to evaluate food quality. Likewise, capillary electrophoresis (CE), infrared (IR) spectroscopy, and nuclear magnetic resonance (NMR) spectroscopy can further help in the analysis by providing precise analytical information [
10,
11,
12,
13]. However, these techniques have some drawbacks, such as high operating costs, the need for pre-treatment of the samples, the requirement of highly trained personnel, and the insufficiency of online monitoring. Therefore, it is necessary to develop alternative analytical methods that provide fast and reproducible results, are portable, and have low operating costs to partially replace traditional methods, thus achieving reliable and non-destructive measurements of the samples [
14,
15]. For this reason, a new trend has emerged to replace human sensory organs with artificial senses such as the Electronic Nose (eNose), Electronic Tongue (eTongue), and Electronic Eyes (eEyes), which are devices designed to the perceive smell, taste, and appearance of the samples. Electronic senses have been used in various industries such as food, cosmetics, and pharmaceuticals, among others. Among these, the food industry has benefitted the most, where research has focused on quality control and monitoring of the production process to guarantee food quality, food safety, evaluation of shelf life, and detection of adulteration, among others [
1,
16,
17].
The eNose is inspired by the sense of smell; it is an instrument that comprises a series of non-selective chemical sensors that interact with volatile molecules, more specifically volatile organic compounds (VOCS), generating a signal that constitutes a kind of characteristic odor fingerprint, and with an appropriate pattern recognition system, it is capable of recognizing simple or complex odors [
18,
19]. On the other hand, the eTongue is an electronic device designed to mimic the human tongue. Using non-selective electrochemical sensors and pattern recognition methods, the eTongue device can detect specific chemical substances in liquid samples [
20,
21,
22,
23]. The eEyes is an electronic device composed of an array of optical sensors whose spectrum can reveal essential material properties of the sample in question. It is an electronic device designed to imitate the human visual perception system and acquires information related to the color spectrum and its associated wavelengths, which can be used to decode the appearance of a sample, thus providing an objective evaluation of the material properties of an object [
16,
17,
24].
Herbal tea is a traditional and popular drink consumed worldwide for its health benefits since it is made from dried leaves, flowers, seeds, fruits, stems, and plant roots [
25]. To take advantage of the sensory characteristics of herbal teas, such as aroma, flavor (mint, fruit, savory, sage, thyme, etc.), and color (black, brown, red, green, etc.), which vary depending on the components of each one, an artificial sensory analysis is required.
This study proposes to demonstrate the applicability of combining the information of different E-Senses systems such as eNose, eTongue, and eEyes to classify Colombian herbal tea brands (
Albahaca,
Frutos Verdes,
Jaibel,
Toronjil, and
Toute). In the literature, studies have been reported focused on evaluating the quality of tea, degrees of fermentation, identification of the origin of green tea, detection of the optimal fermentation time for black tea, and evaluation of different qualities of green tea, among others, using an eNose [
26,
27,
28,
29,
30,
31,
32,
33,
34,
35,
36,
37], eTongue [
37,
38,
39,
40,
41,
42,
43], and eEyes [
44,
45,
46,
47,
48], as individual techniques. Therefore, experimental tests were carried out with the electronic perception systems individually to verify the performance in classifying herbal teas. Besides, to develop the data analysis through the information acquired with the E-senses systems, different machine learning methods were implemented to determine the performance of each one in classifying the herbal tea categories. Machine learning technology or automatic learning is the process in which artificial intelligence (AI) learns using algorithms that convert a dataset into a training model to analyze several patterns and classify them. During this study, it was possible to extract information from large volumes of data. For instance, a large amount of data acquired from an eNose or eTongue were pre-processed previously with pattern recognition methods (PCA or LDA) for reducing the dataset, and then supervised machine learning models were used to get the accuracy of each system.
Finally, data fusion was conducted by combining their information and verifyingperformance.
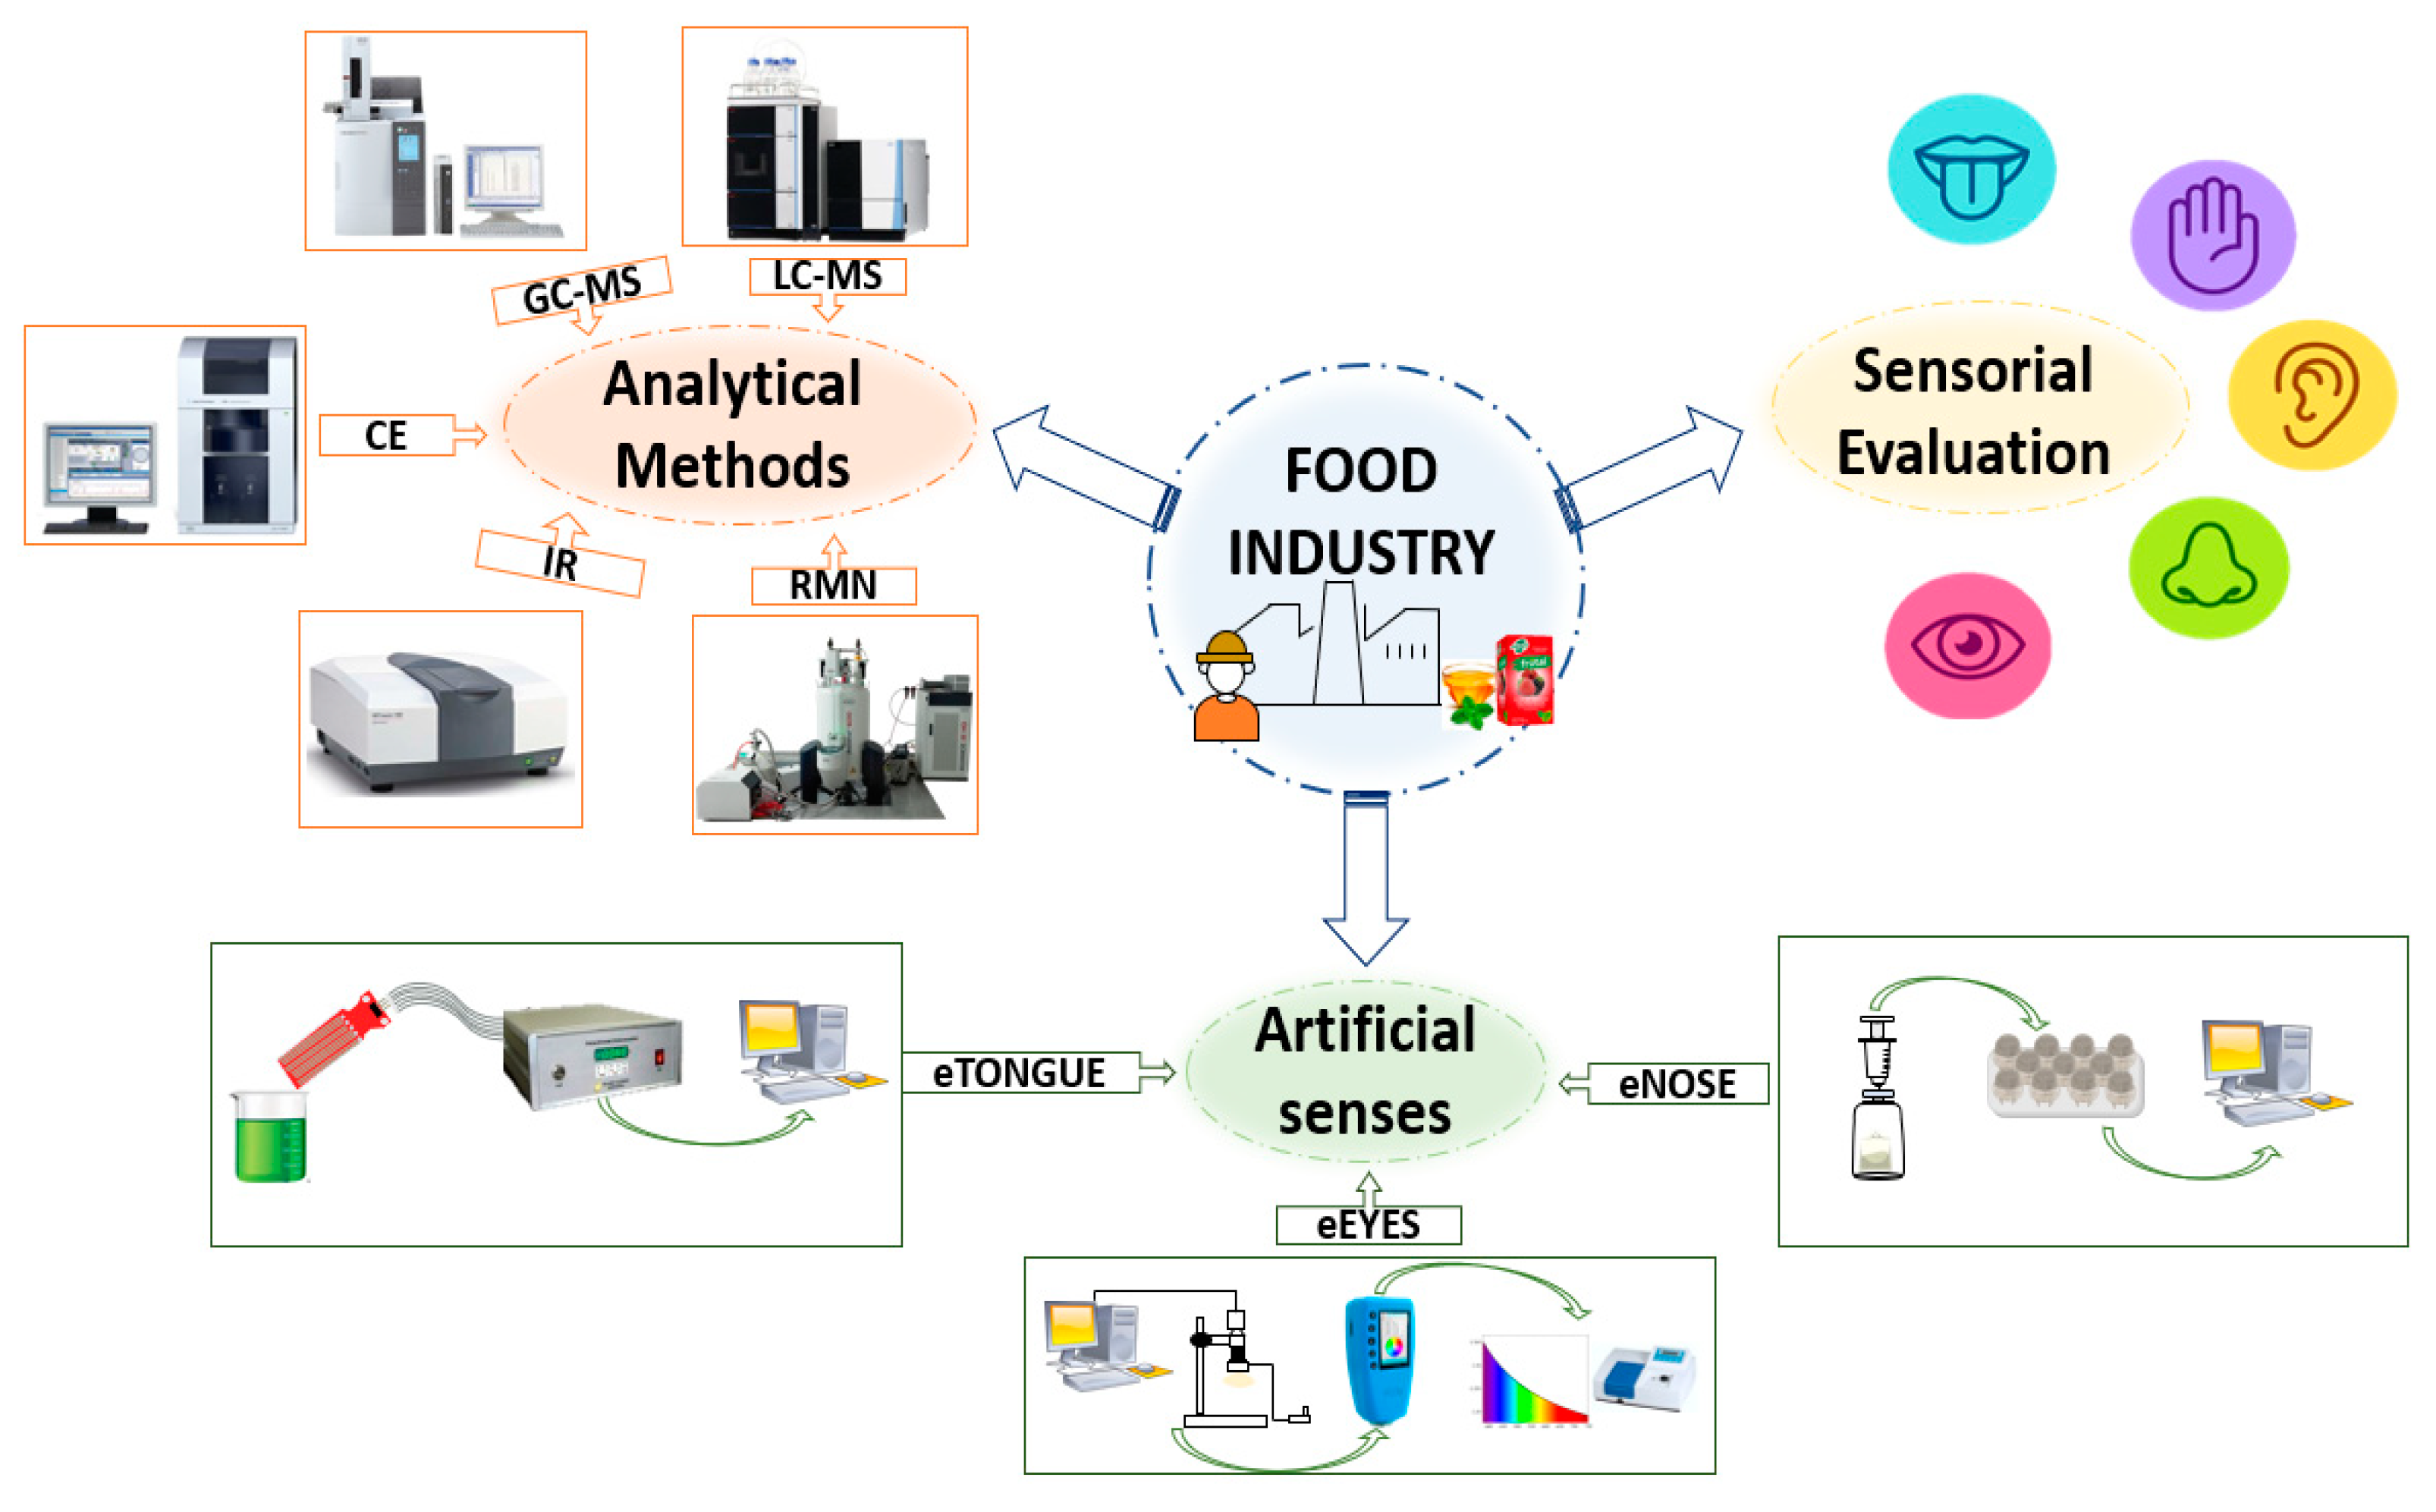
Figure 1 illustrates a scheme of traditional methods against the artificial perception methods, where the latter can support and contribute to the sensory evaluation of food.
2. Materials and Methods
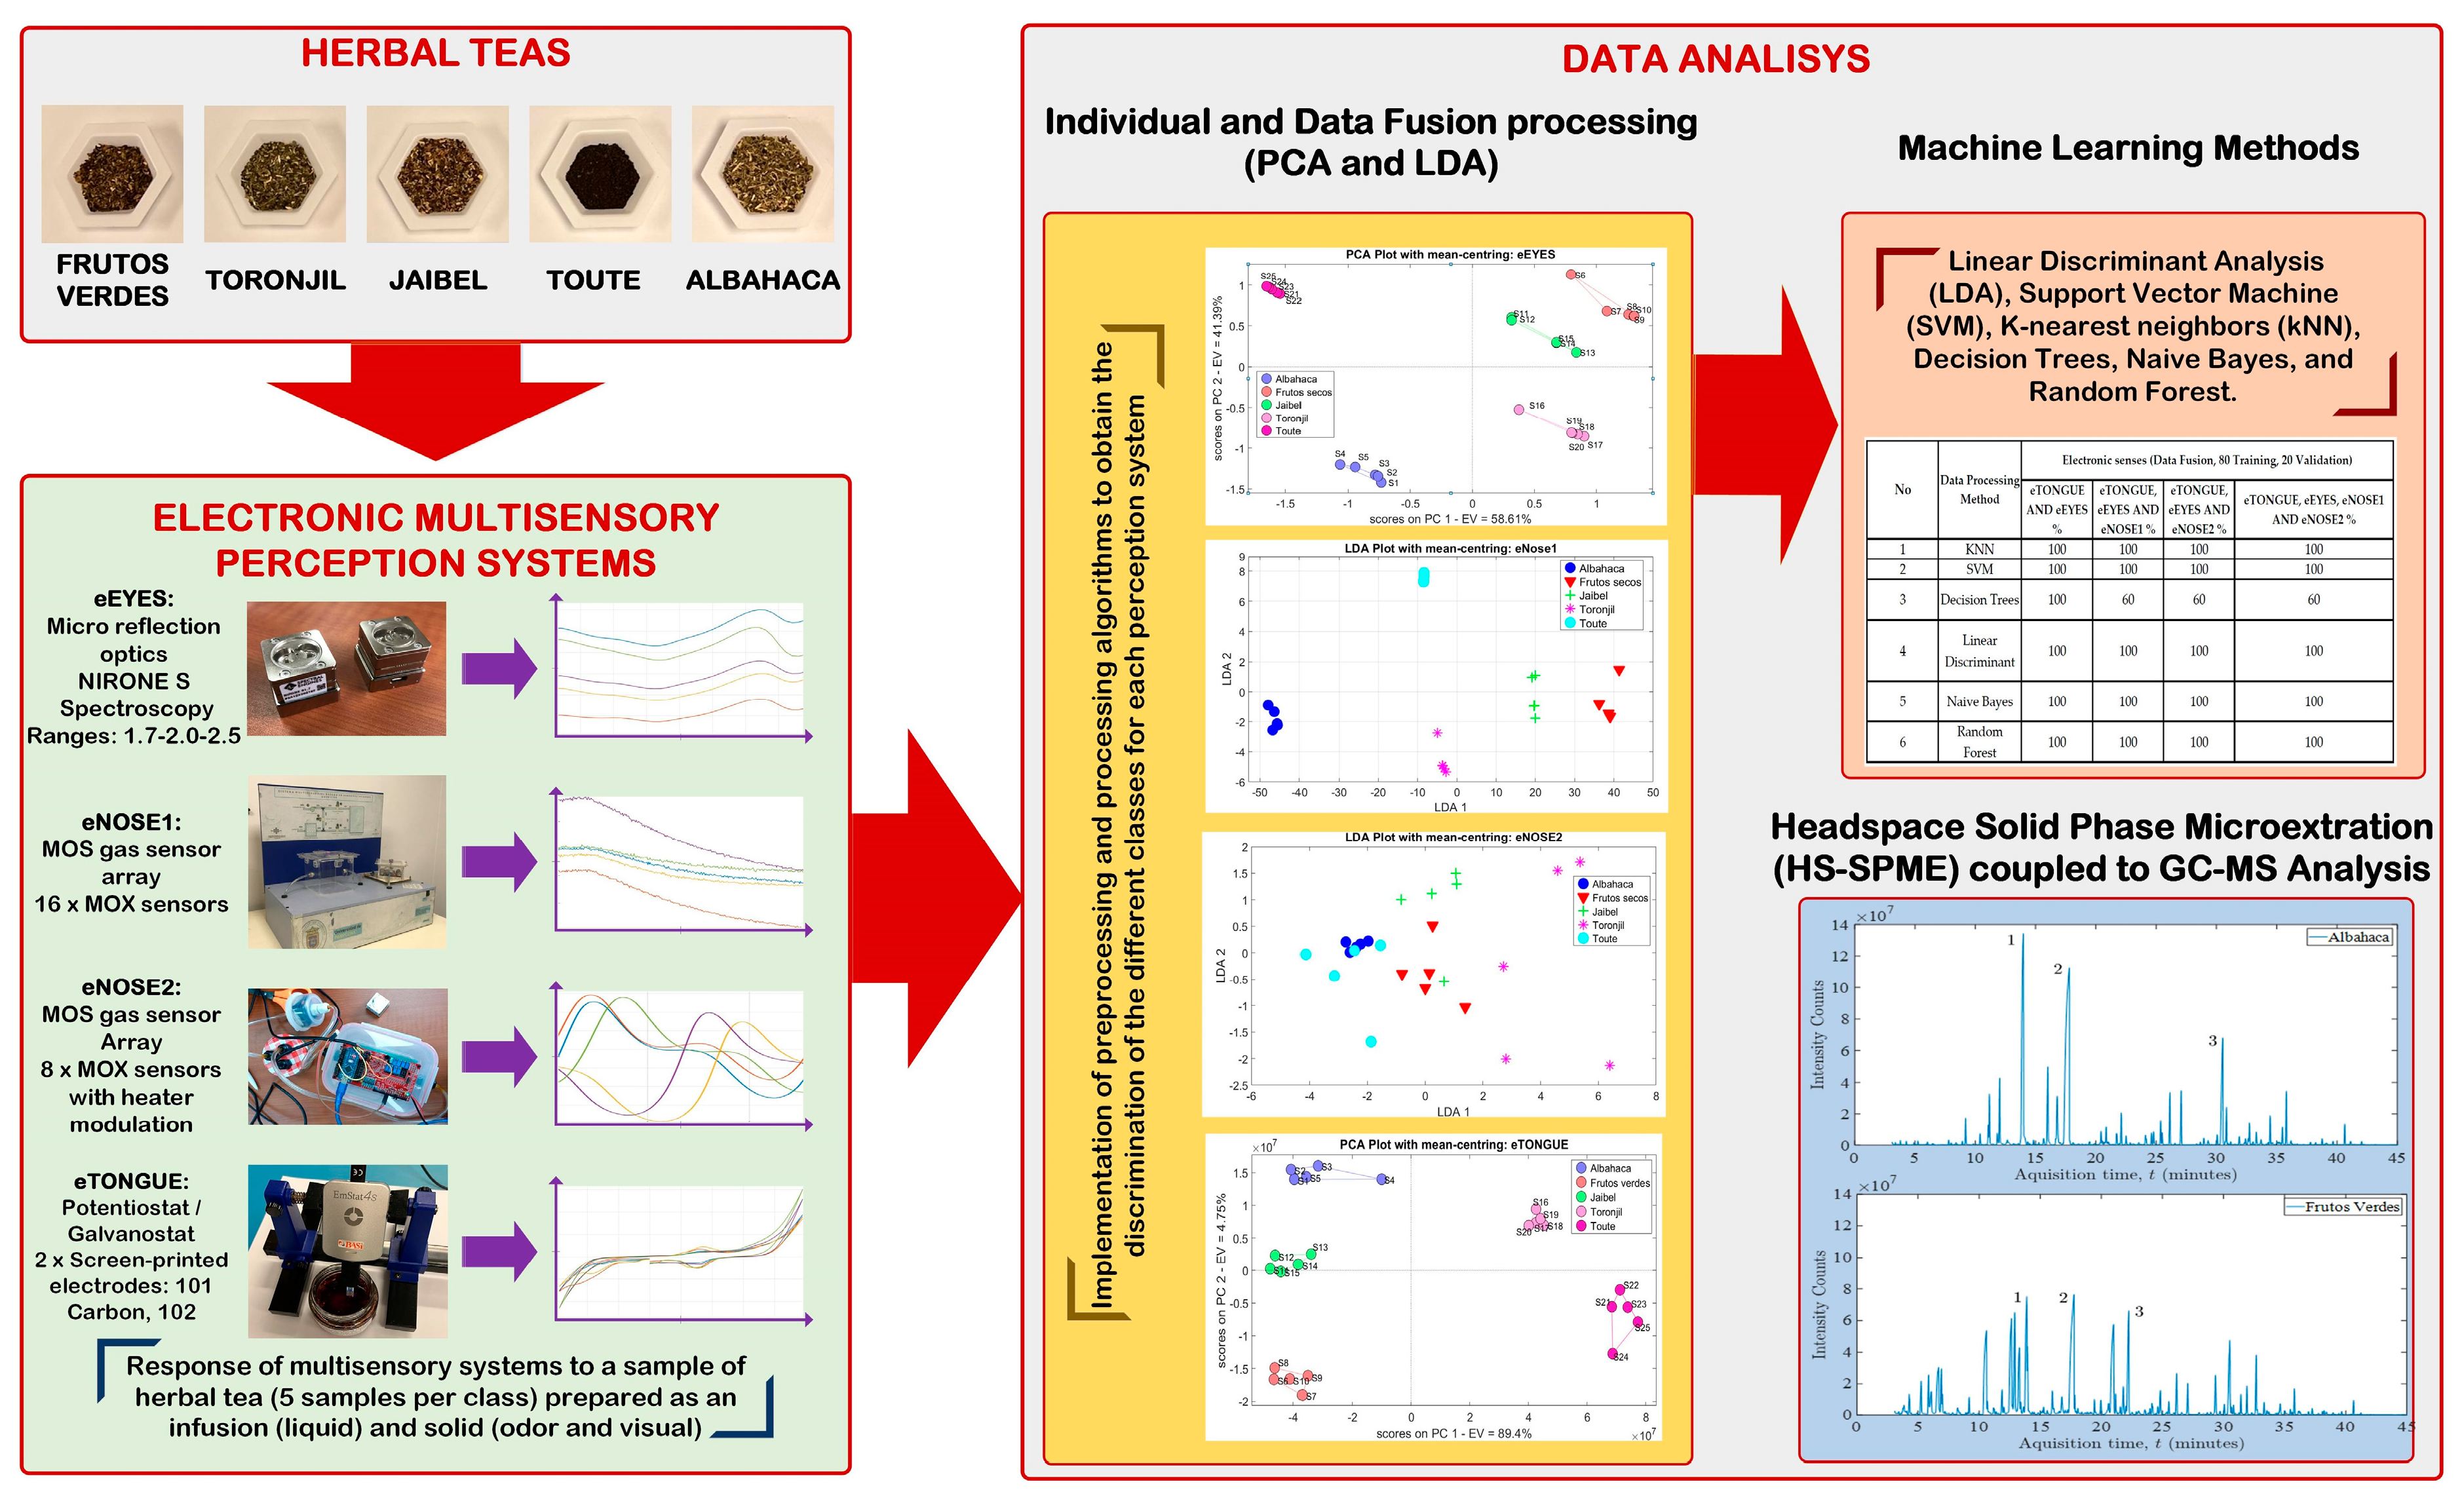
Figure 2 illustrates the methodological scheme used to conduct the different tests to classify the herbal tea samples.
To conduct the experiments, three different stages were developed to determine the E-senses’ performance: (1) conditioning of herbal teas samples, (2) E-senses’ calibration and implementation, and (3) data analysis using pattern recognition methods for the data fusion, machine learning algorithms for data classification, and GC-MS for COVs identification.
2.1. eNose1
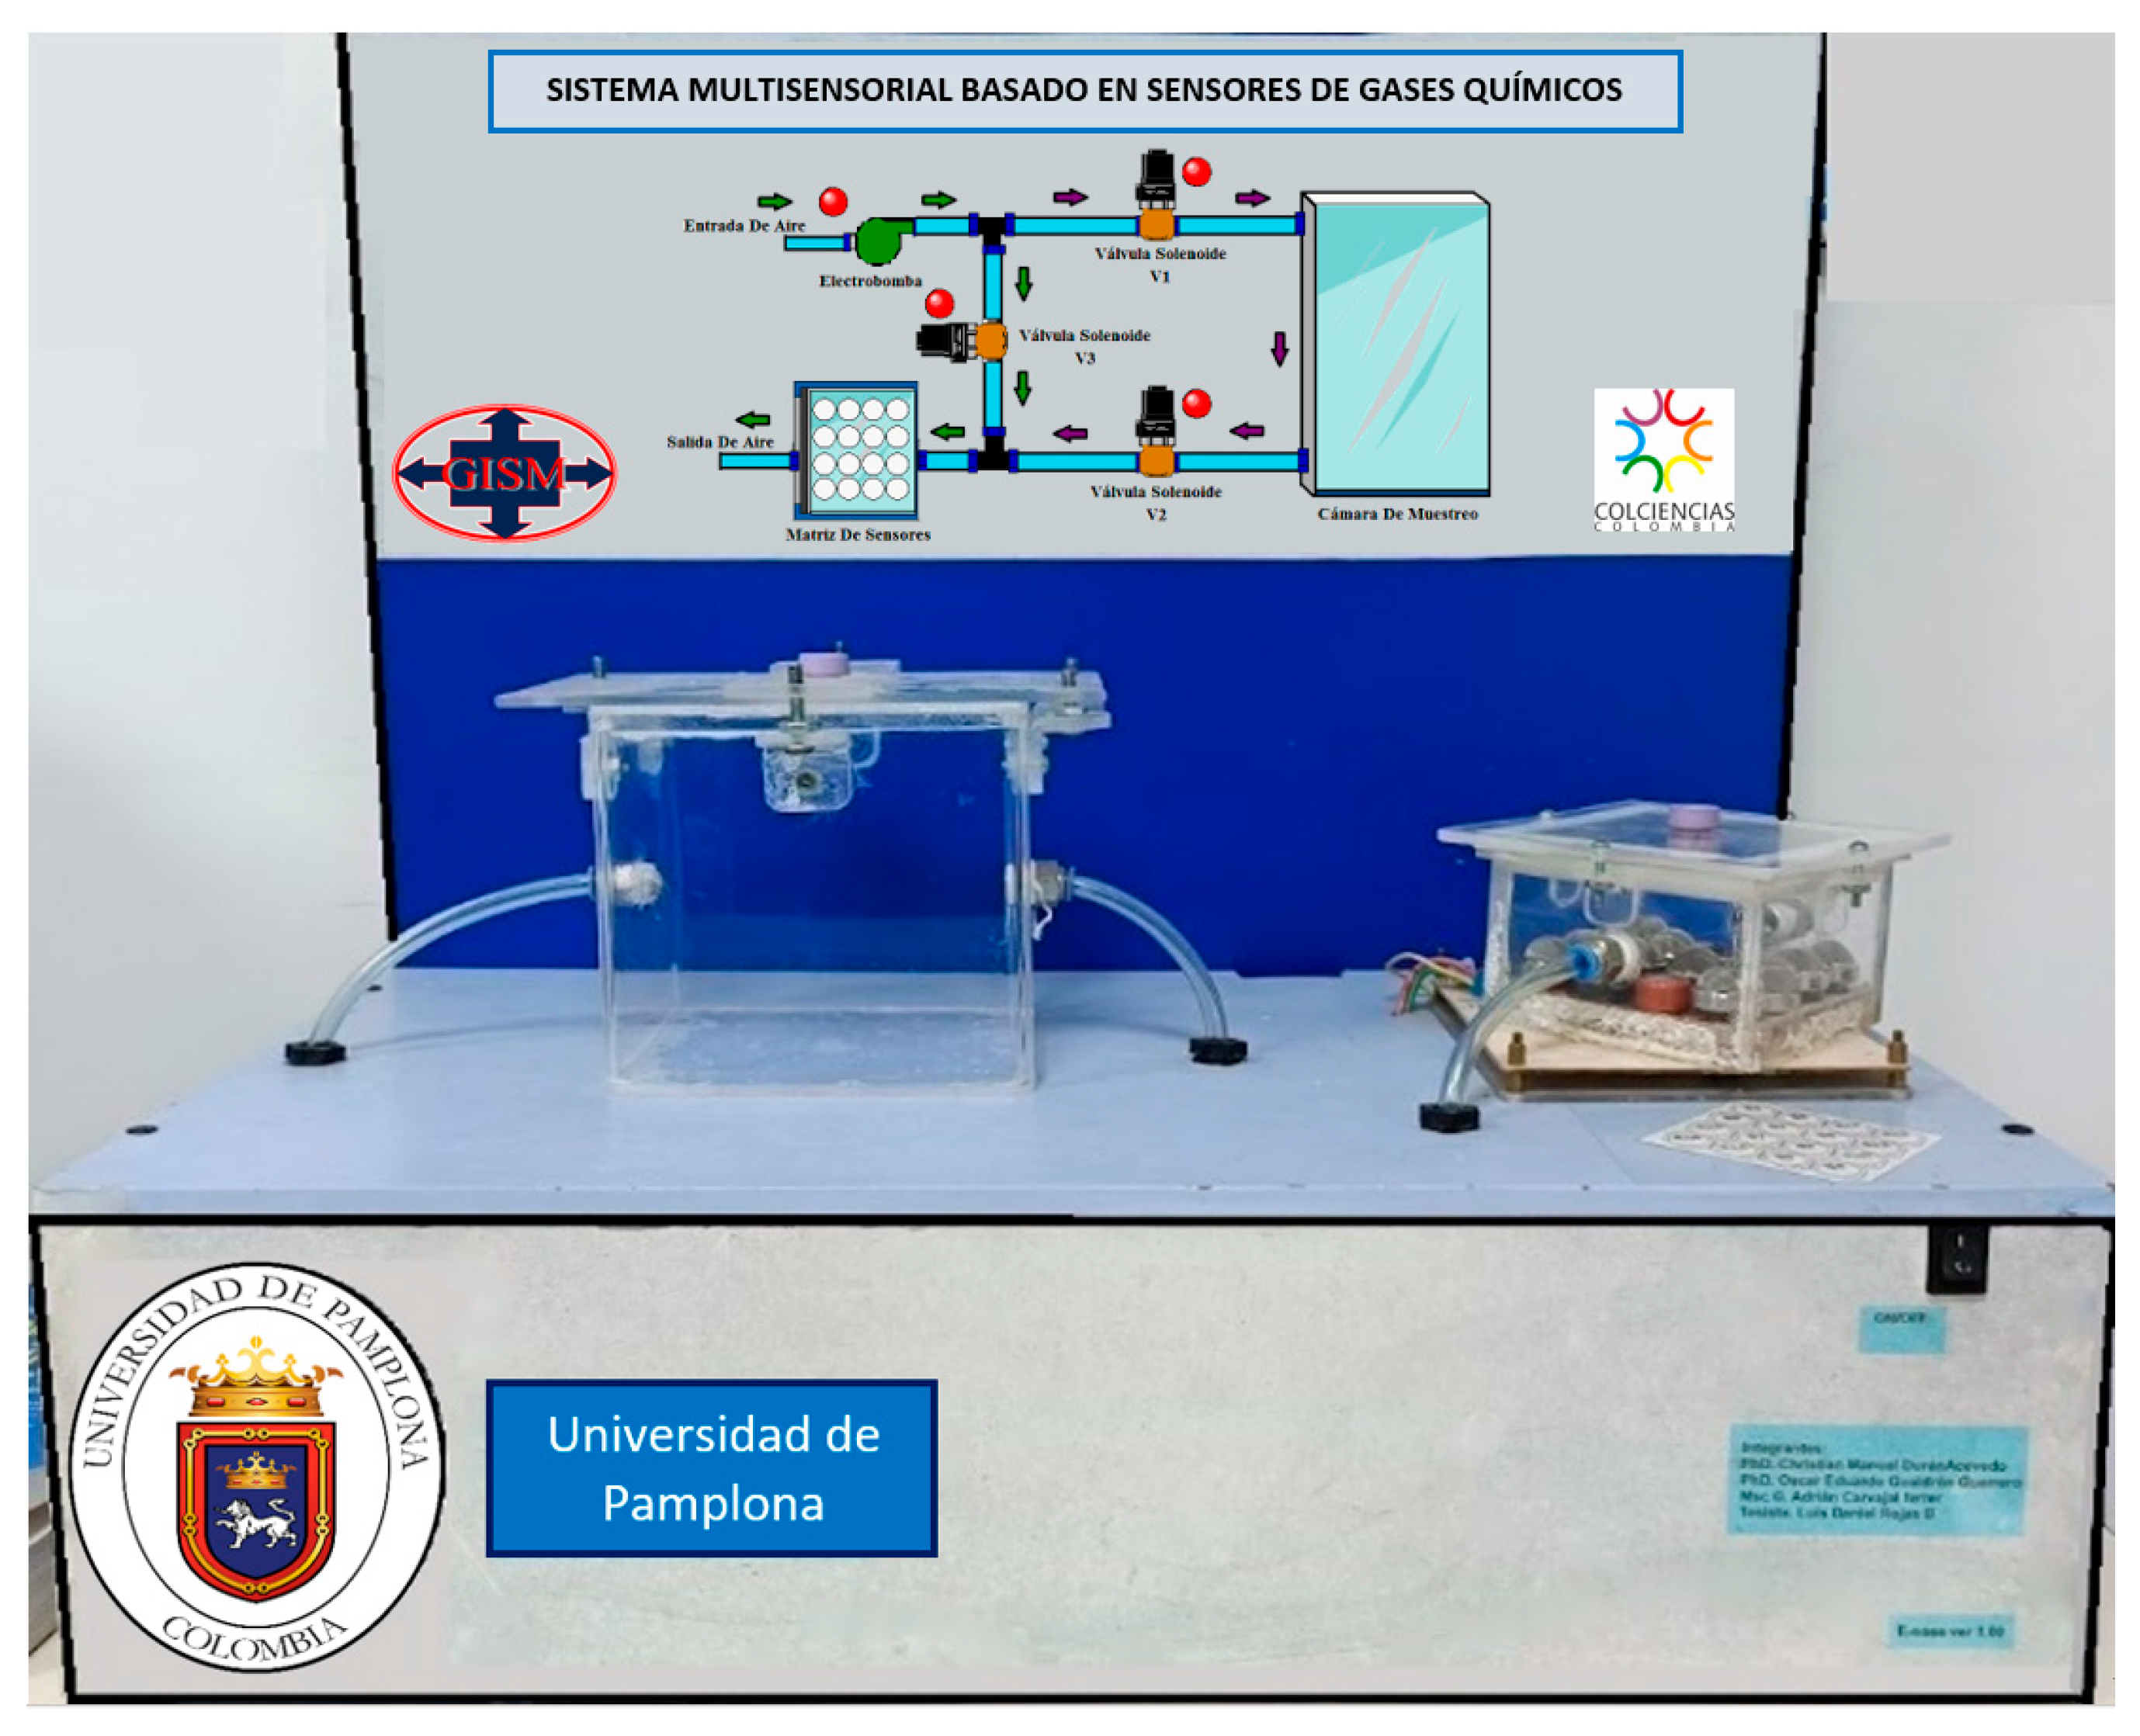
Figure 3 shows the general scheme of the electronic nose system manufactured in the laboratory of the GISM group at the University of Pamplona, Colombia. This multi-sensory device comprises a sampling chamber, a measurement chamber containing an array of gas sensors, and a computer for the acquisition and processing of the signals acquired from the sensors.
Table 1 illustrates the gas sensors array that makes up the measurement chamber, TGS type from the manufacturer Figaro USA. Inc, which were previously selected for applications in food quality control, are non-selective and can be used to classify different categories of herbal teas.
As can be seen, the type of gas, application, and reference are described. The acquisition and control software was developed in Matlab version 2020b and provided a graphical user interface to perform the synchronization functions through a data acquisition (DAQ) card and a power control board to activate the electronic valves and pump.
The data acquisition was made through a 16-Bit and 250 kS/s USB-6210 reference multifunction card from National Instruments, used in “single-ended” mode for reading and recording data in real time. The card was implemented to condition a total of 16 analog inputs with a sampling rate of approximately 1 sample/second.
Before carrying out the tests with the aromatic herbs, the measurement chamber was initially purged through the activation of a 12 VDC air pump and the control of solenoid valve 3 for a period of 20 min, followed by a flow of ambient air applied to the sensor chamber. To carry out the cleaning process, the behavior of each sensor was monitored through the baseline, verifying its stability and the value of the resistances (Rs) by reading the voltage values.
Once the operation of each sensor was confirmed, the process of measuring the herbal tea samples began through the measurement protocol, where the samples were extracted from the product package of the herbal tea category and placed into the vessels. The time used for each measurement was 12 min, of which 7 min were for the recovery or purging of the sensors and 5 min for the data acquisition.
This module is based on the generation and control of airflow that directs the volatiles from the concentration (sampling) chamber to the measurement chamber. In addition, the sampling system is made up of three solenoid valves and an air pump, where all three solenoid valves are either activated or deactivated for the measurement of the samples and cleaning of the sensors.
The concentration or sampling chamber is an airtight acrylic container that houses solid and liquid objects such as fruits, tubers, wines, alcohols, etc. The chamber has an air inlet and outlet that allows the volatiles to be transferred to the measurement chamber at the appropriate time. If these inlets are closed by the solenoid valves, the interior of the chamber is isolated. In this way, after some time, a concentration of volatiles will have been created that will later be dragged by the airflow to the measurement chamber where the sensors are located. In addition, this chamber has a lid through which we can introduce objects. It consists of butterfly-type threads that are screwed around its perimeter to be able to close it hermetically. The top surface has a septum to extract substances with a syringe and inject them directly into the sensor chamber. The concentration chamber, developed in transparent acrylic, has the dimensions 17.7 cm wide × 26.3 cm long × 15.5 cm high, with a total volume of 7215.4 cm
3. The measuring chamber is 8.7 cm long × 8.7 cm wide × 5.3 cm high for a total volume of 401.157 cm
3 and is developed from transparent acrylic material. As in the concentration chamber, the measurement chamber has an air inlet and outlet through which a constant air flow circulates, which in the measurement phase transports the volatiles coming from the concentration chamber. A fiber base plate was conditioned through the sensors, which were electrically powered with their respective connectors and indicators. The measurement procedure in the module consists of three main stages: (1) the concentration phase, (2) the measurement phase, and (3) the rest phase; in each stage, the airflow through the measurement chamber remains constant.
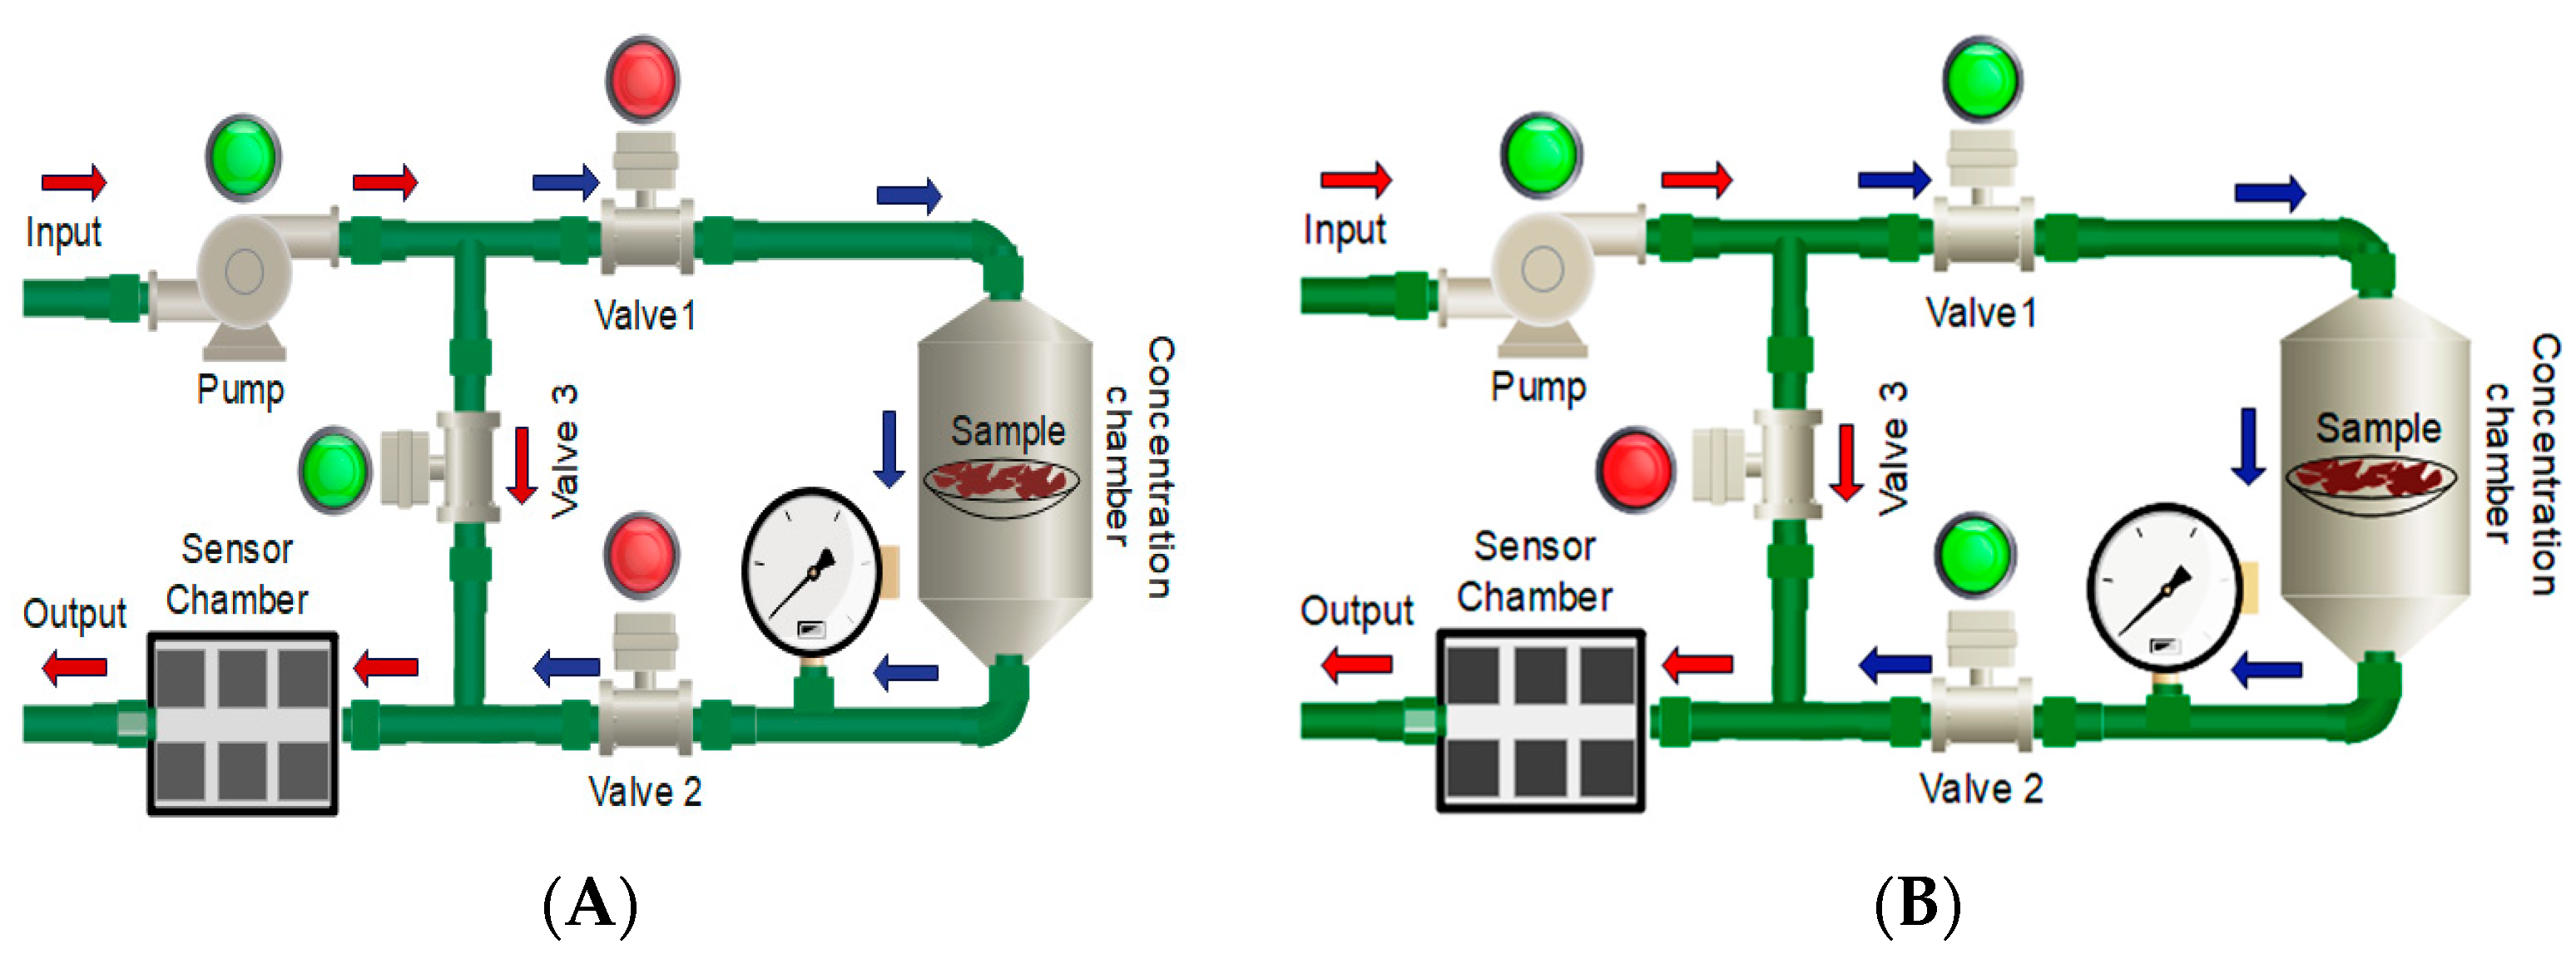
Figure 4 shows a diagram of the sampling module in which the directions followed by the airflow in each stage can be clearly observed.
When the eNose1 system is in the concentration phase (A), the pump is activated to take the ambient air from the laboratory since the solenoid valves V1 and V2 are OFF, while valve V3 is ON, and the volatiles circulates from the measurement chamber to the outside. The airflow keeps flowing from input to output (outside) without circulating through the concentration chamber, and the volatiles that are accumulated inside the measurement chamber are being purged. This is observed in
Figure 4A following the red arrows. This phase lasts about 10 min; meanwhile, the sampling chamber uses this time to collect a high concentration of volatiles, generating a strong signal to be sent to the sensors. During the measurement phase (B), the air pump draws the volatiles through a closed circuit from the concentration chamber to the measurement chamber. During this stage, the outside air circulates through the sampling chamber with valves V1 and V2 in the ON position, while V3 is in the OFF position, and the volatiles are transported to the measurement chamber. The compounds are then expelled to the outside, represented by blue arrows. For this phase, which lasts 7 min, the sample is acquired since this time interval allows the sensors to reach a stable value (saturation). When the measurement is finished, the system changes to the recovery time phase for 5 min. In this stage, the measurement circuit is purged, and the response of the sensors is restored. At this stage, the air is taken from the laboratory, where it circulates through the measurement chamber and finally drags the VOCs that may have been left out of the pneumatic circuit.
Supplementary Figure S1 shows the overlapping signals acquired with the eNose1 to classify the herbal tea categories.
2.2. eNose2
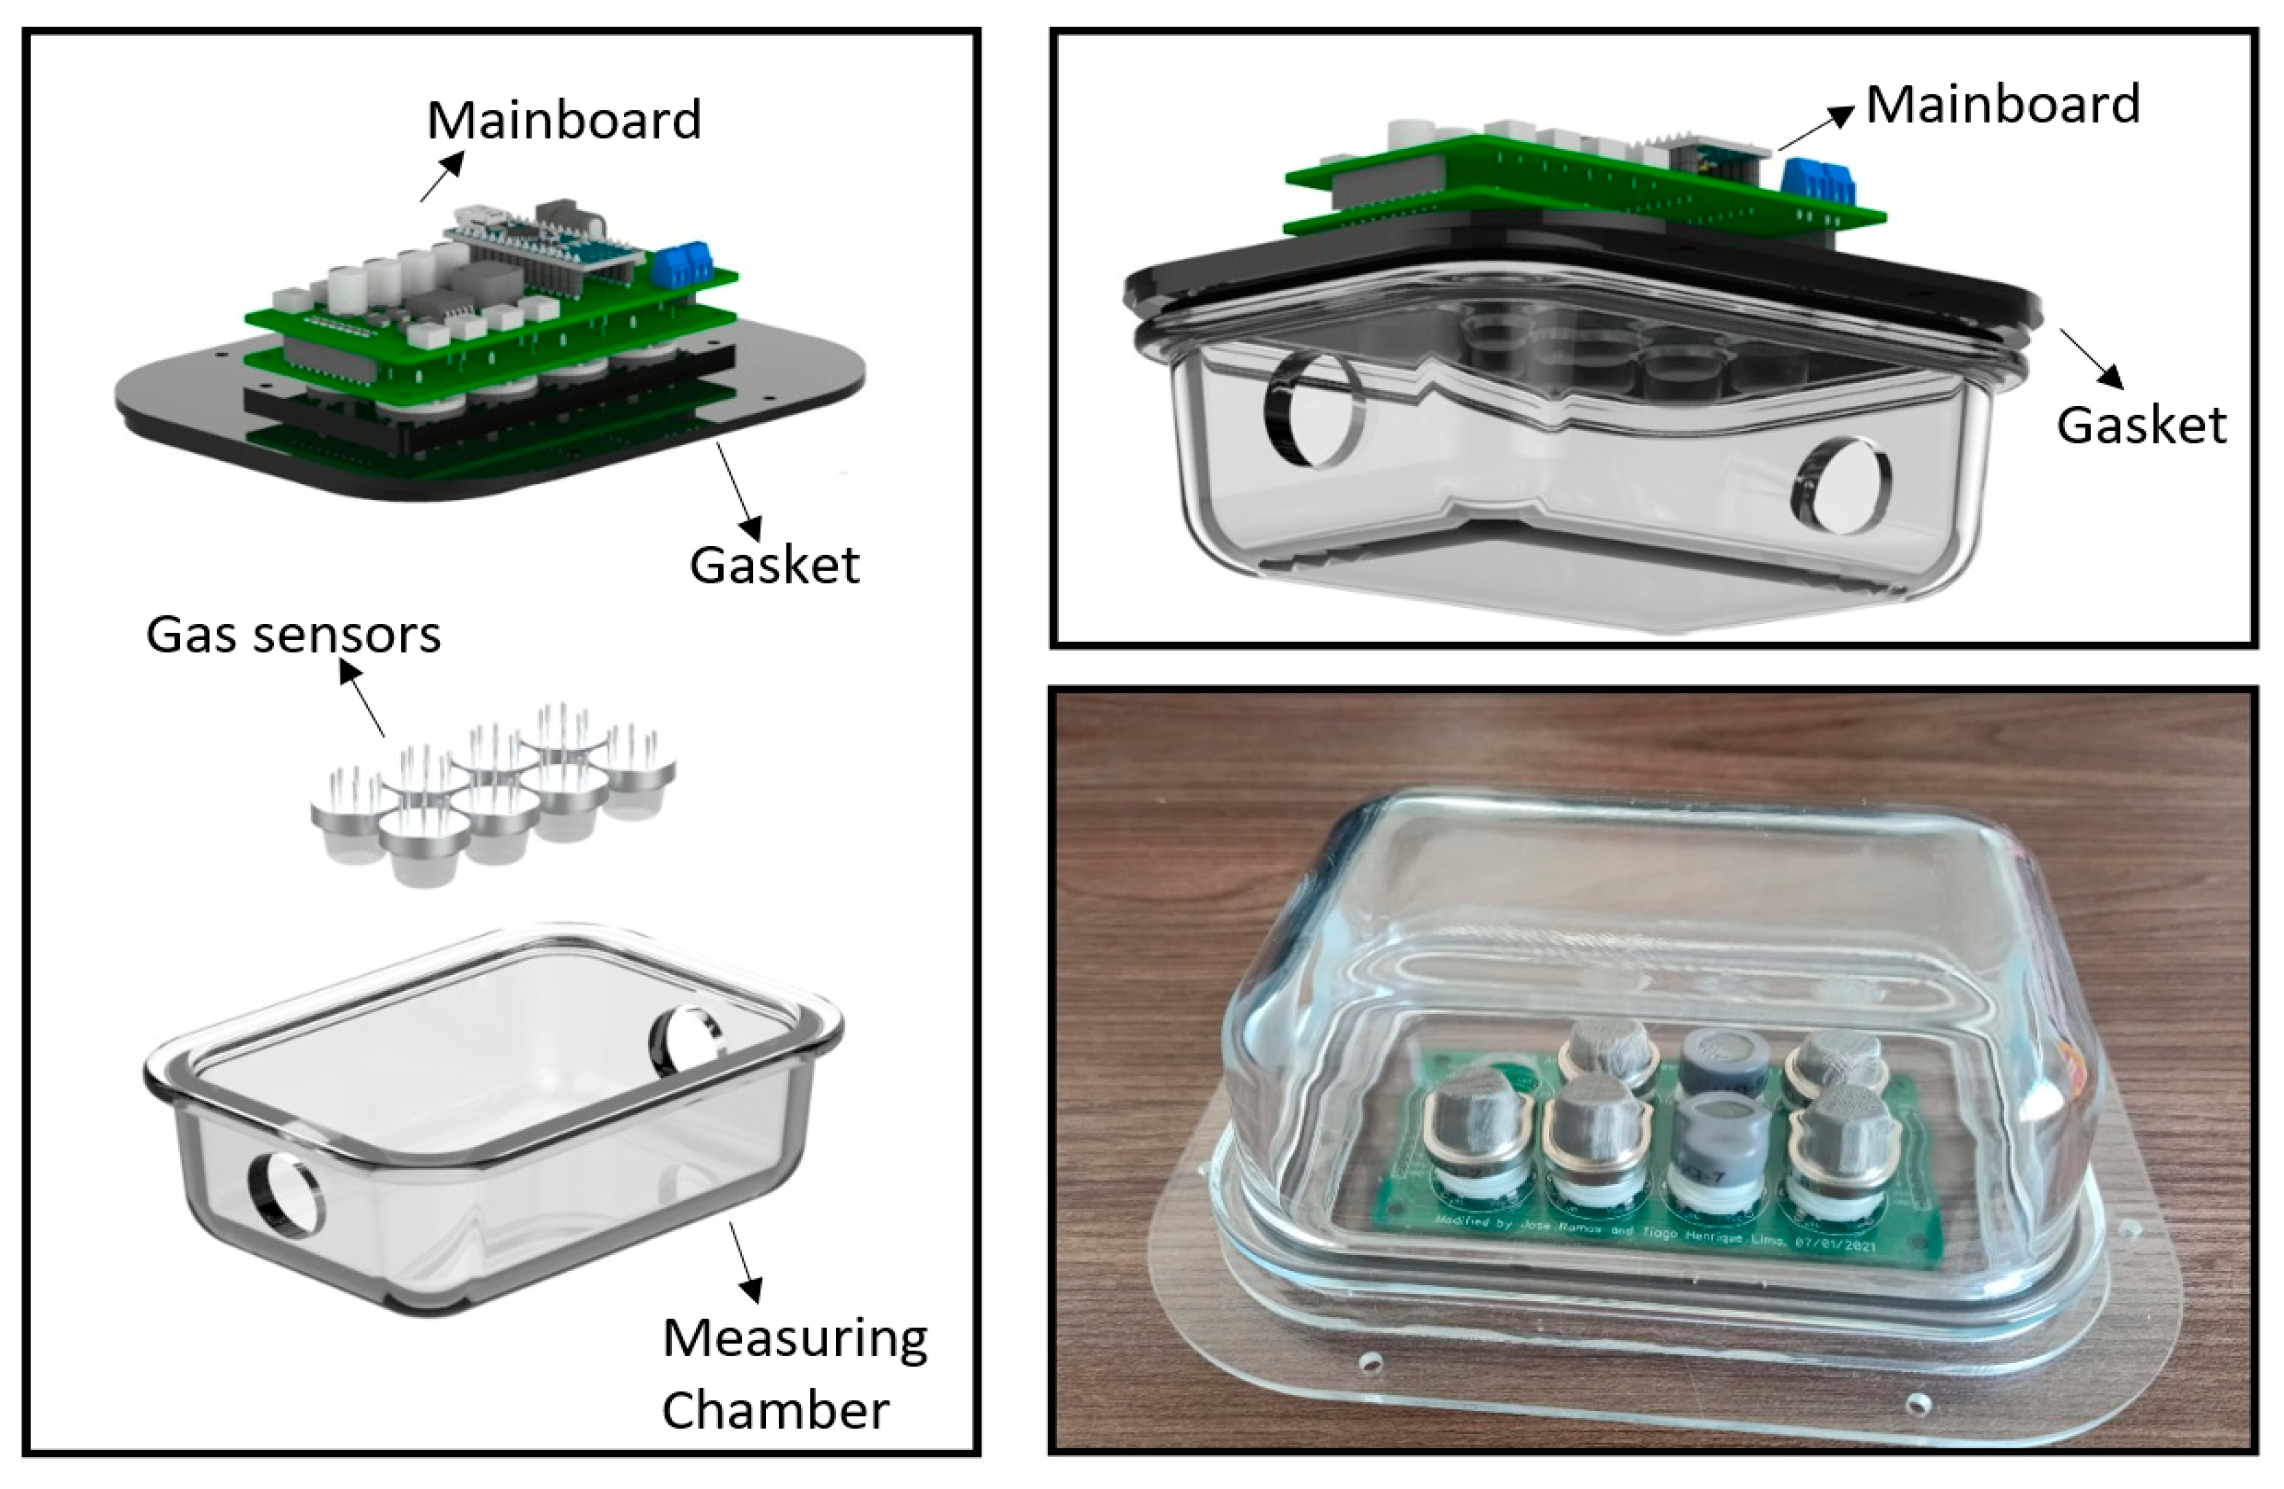
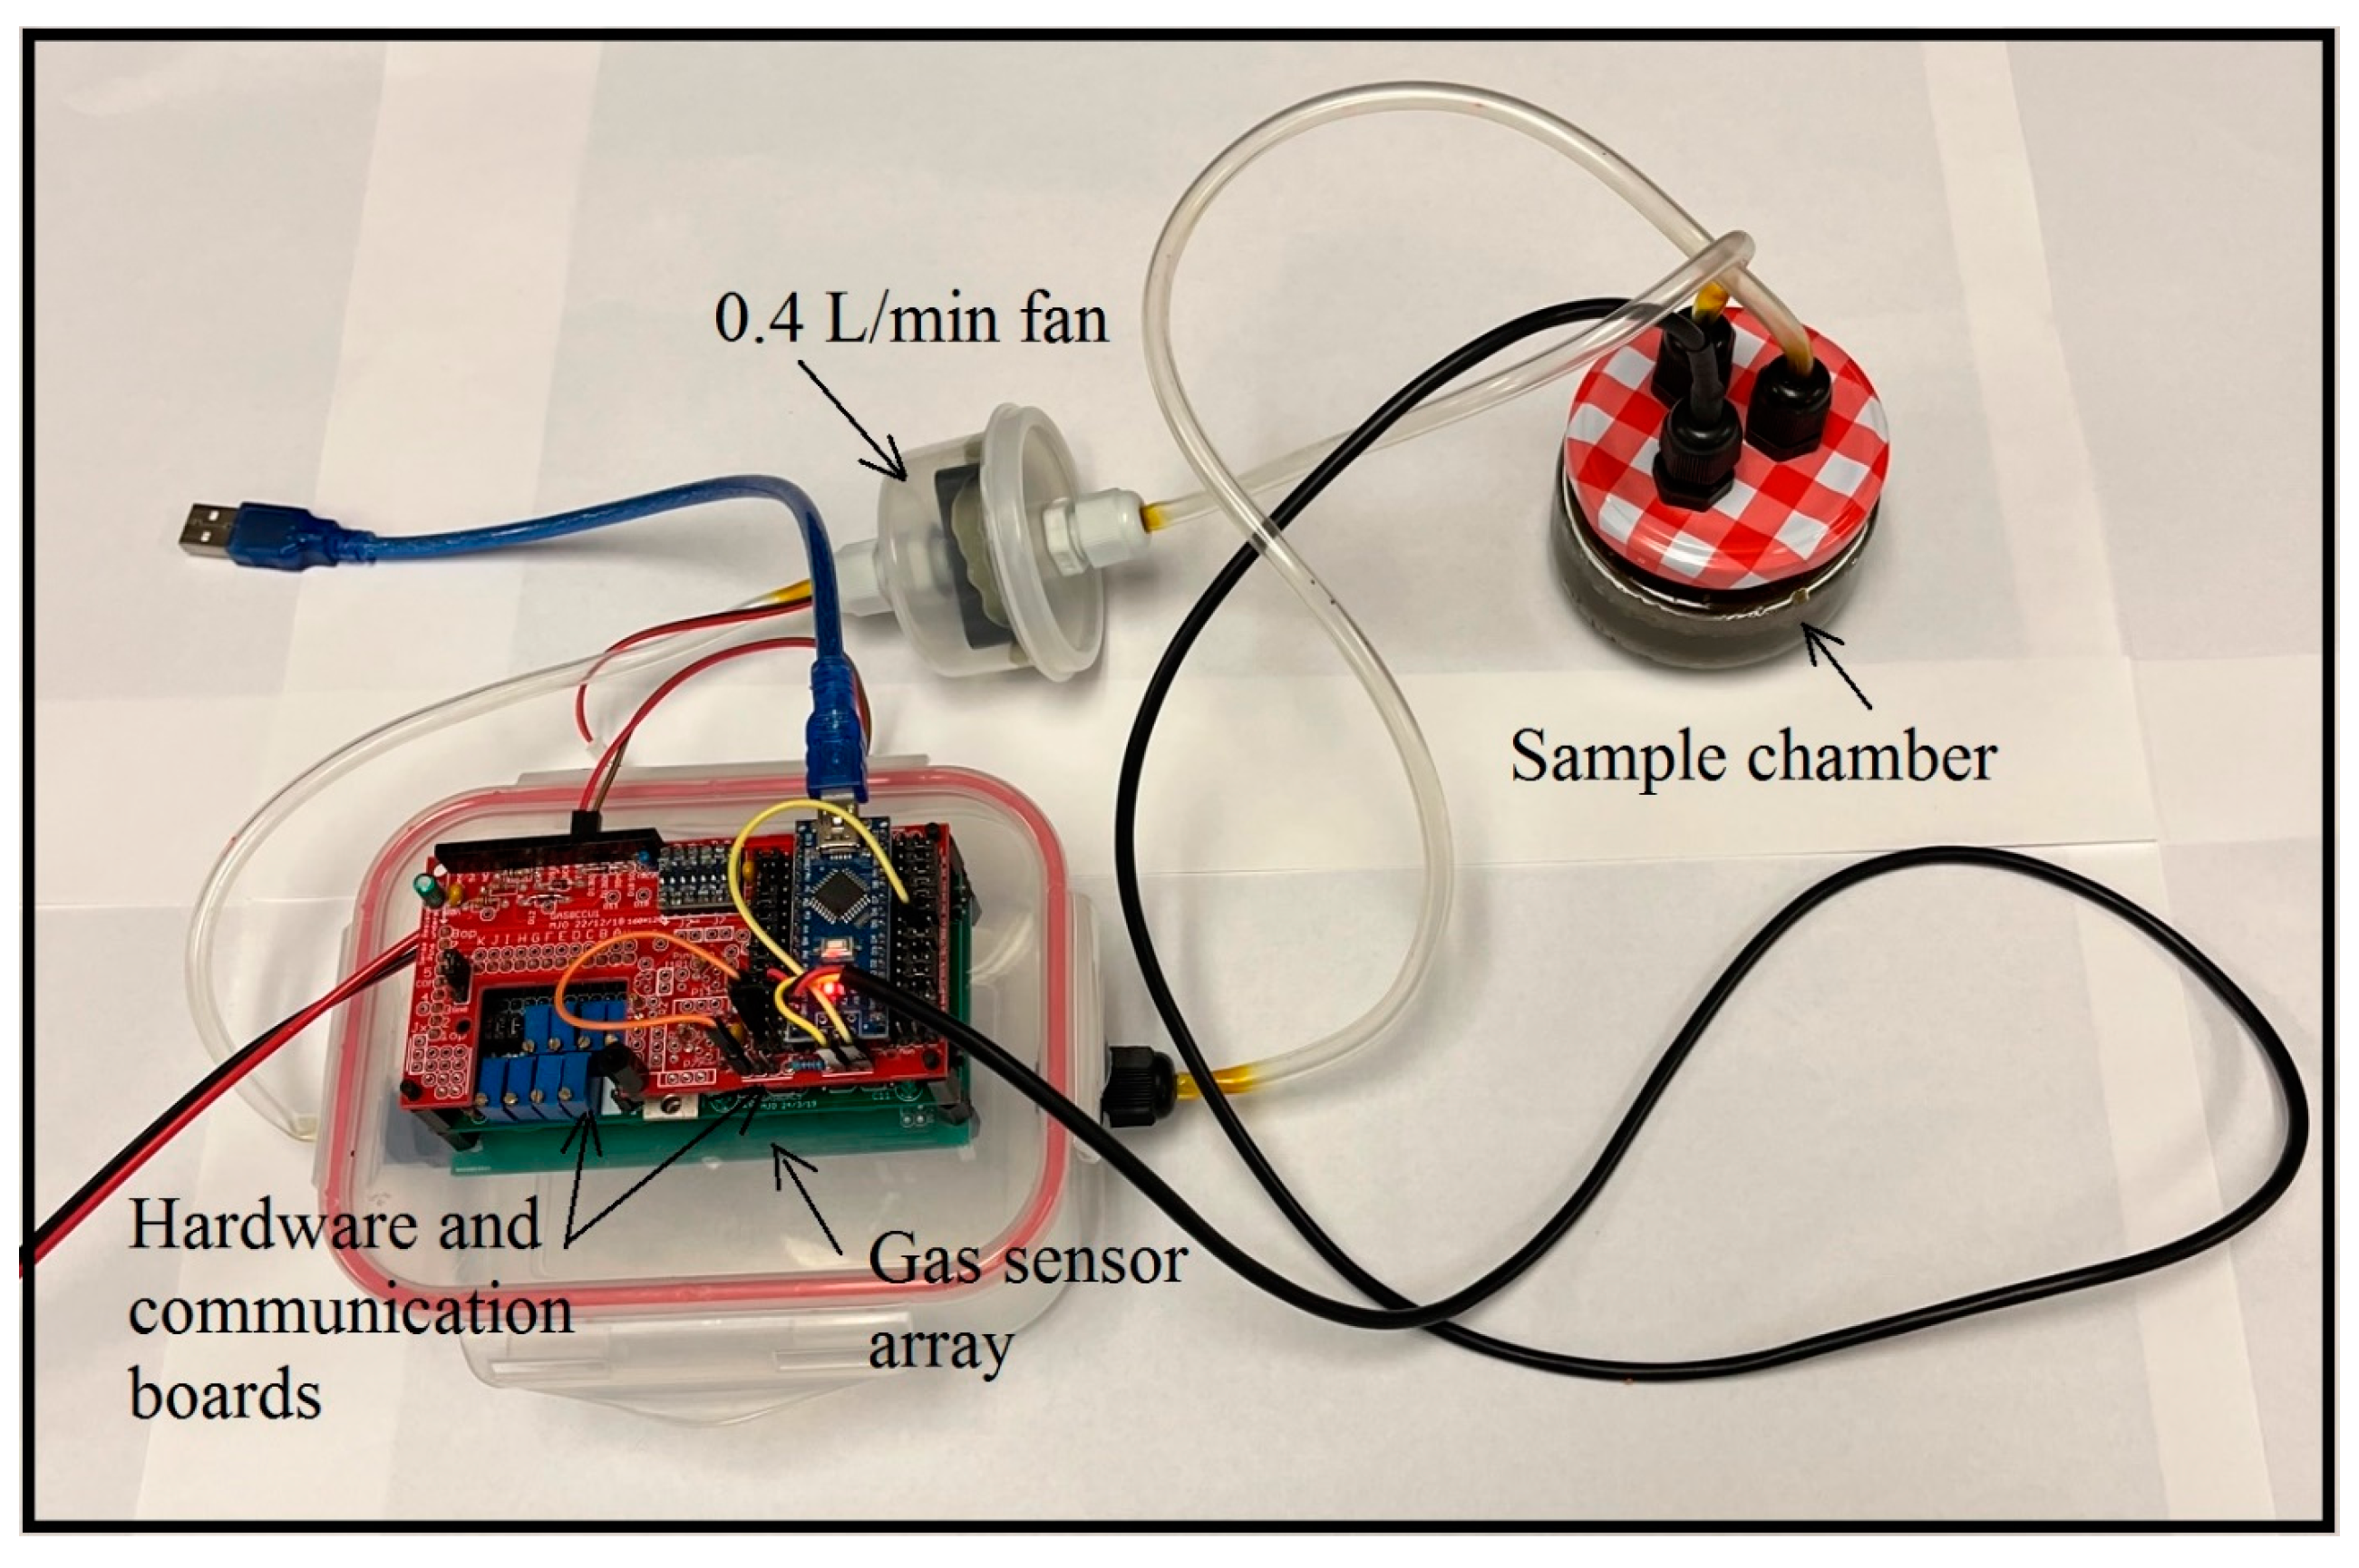
The eNose2 is a low-cost system composes of an array of eight MQ series gas sensors (MQ135, MQ2, MQ3, MQ4, MQ5, MQ9, MQ7, and MQ8), along with an Arduino Nano microcontroller. In a similar way to eNose1, these gas sensors selected to developed the eNose2 are widely available, and they can detect a broad range of gases as emissions of herbal tea categories. The Arduino Nano has eight analog-to-digital converters (ADCs), which is the main reason for using an array of eight sensors. A scheme and picture of the experimental eNose2 system are shown in
Figure 5 and
Figure 6, where there are three main compartments in the system: a 135 mL glass sampling chamber (70 mm diameter), for placing the samples; a 700 mL PP5 (food-grade polypropylene) measuring chamber holding two printed circuit boards (PCBs), the bottom one containing two rows of four sensors each (see
Figure 5), while the top one includes the mainboard with an Arduino Nano microcontroller; and an air fan to generate 0.4 L/min airflow that circulates the sample gases from the sampling chamber to the measuring chamber (see
Figure 6), thus forming a closed loop.
It should be clarified that there was not contamination risk in the electronic components as the mainboard was coupled outside with a gasket placed on the lid of the measuring chamber. Consequently, only the sensor array was exposed to the gas emitted by the sample inside the measuring chamber (see
Figure 5). The three eNose2 compartments are connected via a 6 mm outer diameter (4 mm inner diameter) polyvinyl chloride (PVC) pipe.
The MQ gas sensors are made up of aluminum oxide (Al2O3)-based ceramic and are coated with tin dioxide (SnO2), which acts as the gas sensing layer forming a ceramic tube connected to six legs. A nickel-chromium (Ni-Cr) alloy inside the ceramic tube forms the heater coil, which is connected to two of the legs. The other four legs are made of platinum wires, thus forming the sensing layer. The electrical resistance changes when the sensors are exposed to gaseous emissions from a sample. When gas emissions interact with the sensor, the heat ionizes the gas. Such ionization allows the SnO2 layer to absorb the gas, thus causing a change in the sensor resistance. The four platinum legs sense this resistance value, which is then recorded by the microcontroller. The resistance changes according to the concentration of the gas that is exposed to the sensor, the higher the gas concentration, the lower the resistance, and vice-versa. Furthermore, the sensitivity to different gases depends on the heating element temperature in the sensor.
A difference between the eNose1 and eNose2 systems is that the latter is capable of modulating the sensor heater signal. The sensor responds to a current being passed through the lattice, and the voltage across it is read. However, when the heater power supply is a direct current (DC) voltage source, the MQ gas sensor response is known to be susceptible to “drift” over a time period ranging between several minutes to days. In Reference [
49], it has been observed that comparisons of absolute sensor readings are of little value over such time scales. Furthermore, the baseline recovery times can be prolonged upon removal of the sample, while recovery times can be reduced at higher temperatures [
50]. Thermal modulation has been demonstrated to improve selectivity [
51,
52,
53,
54]. Thus, in this study, as well as in References [
55,
56], we applied a sinusoidal voltage to the MQ sensor heaters of the eNose2 system.
The MQ gas sensors inside the eNose2 device were burned-in at least 48 h prior to the start of the experiments, and the supplied heater voltages were sinusoidally varying ranging from 1.6 to 5 V, cycling over a 128-s period. The Arduino Nano generated the sinusoid in 256 discrete time steps, which was then fed to a PCF8591 8 bits digital-to-analog converter (DAC). The resulting signal was then fed to an LM272 operational amplifier (Op-Amp) configured in unity gain mode for each sensor heater. Since the nominal impedance of each sensor heater is 32 Ω, the Op-Amps were required to provide up to 160 mA per sensor. The full operation of the device is thoroughly described in Reference [
57].
After each sample was placed in the sampling chamber of the eNose2 device, we let it run for 5 min (2.34375 sinusoidal cycles) with 5 min of fresh air allowed to flush through the system between samples. This led to 600 samples per channel. We then retained two full cycles for further investigation. This was done to get rid of the transients. Each of the five tea samples was exposed five times in different trials so that 10 sinusoidal cycles of data were retained for every tea sample, as well as when air was being flushed through the system between cycles. After applying the sinusoidal sensor heater signal to the eNose2 system, the gas sensor response signals appeared as distorted waveforms from the fundamental sinusoidal waveform. When exposed to different Colombian herbal tea aromas, the sensors presented different cyclical deformed waveforms, and to quantify this deformation, the results were subjected to a discrete Fourier transform (DFT) analysis.
Figure S2 shows the overlapping signals acquired with the eNose2 system to classify the herbal tea samples.
After recording the raw herbal tea sensor data, the retained sinusoidal cycles were subjected to 256-element DFT analysis. The main purpose of a DFT analysis is to obtain a DC component and pairs of sine and cosine amplitudes for a number of increasing harmonic frequency components. The DC offset was ignored, but the resulting sine and cosine coefficient amplitudes and frequencies were kept for further analysis. In Reference [
56], this technique proved to be effective in reducing sensor drift, and thus can improve recovery times as well as sensitivity and selectivity [
57].
2.3. eEyes
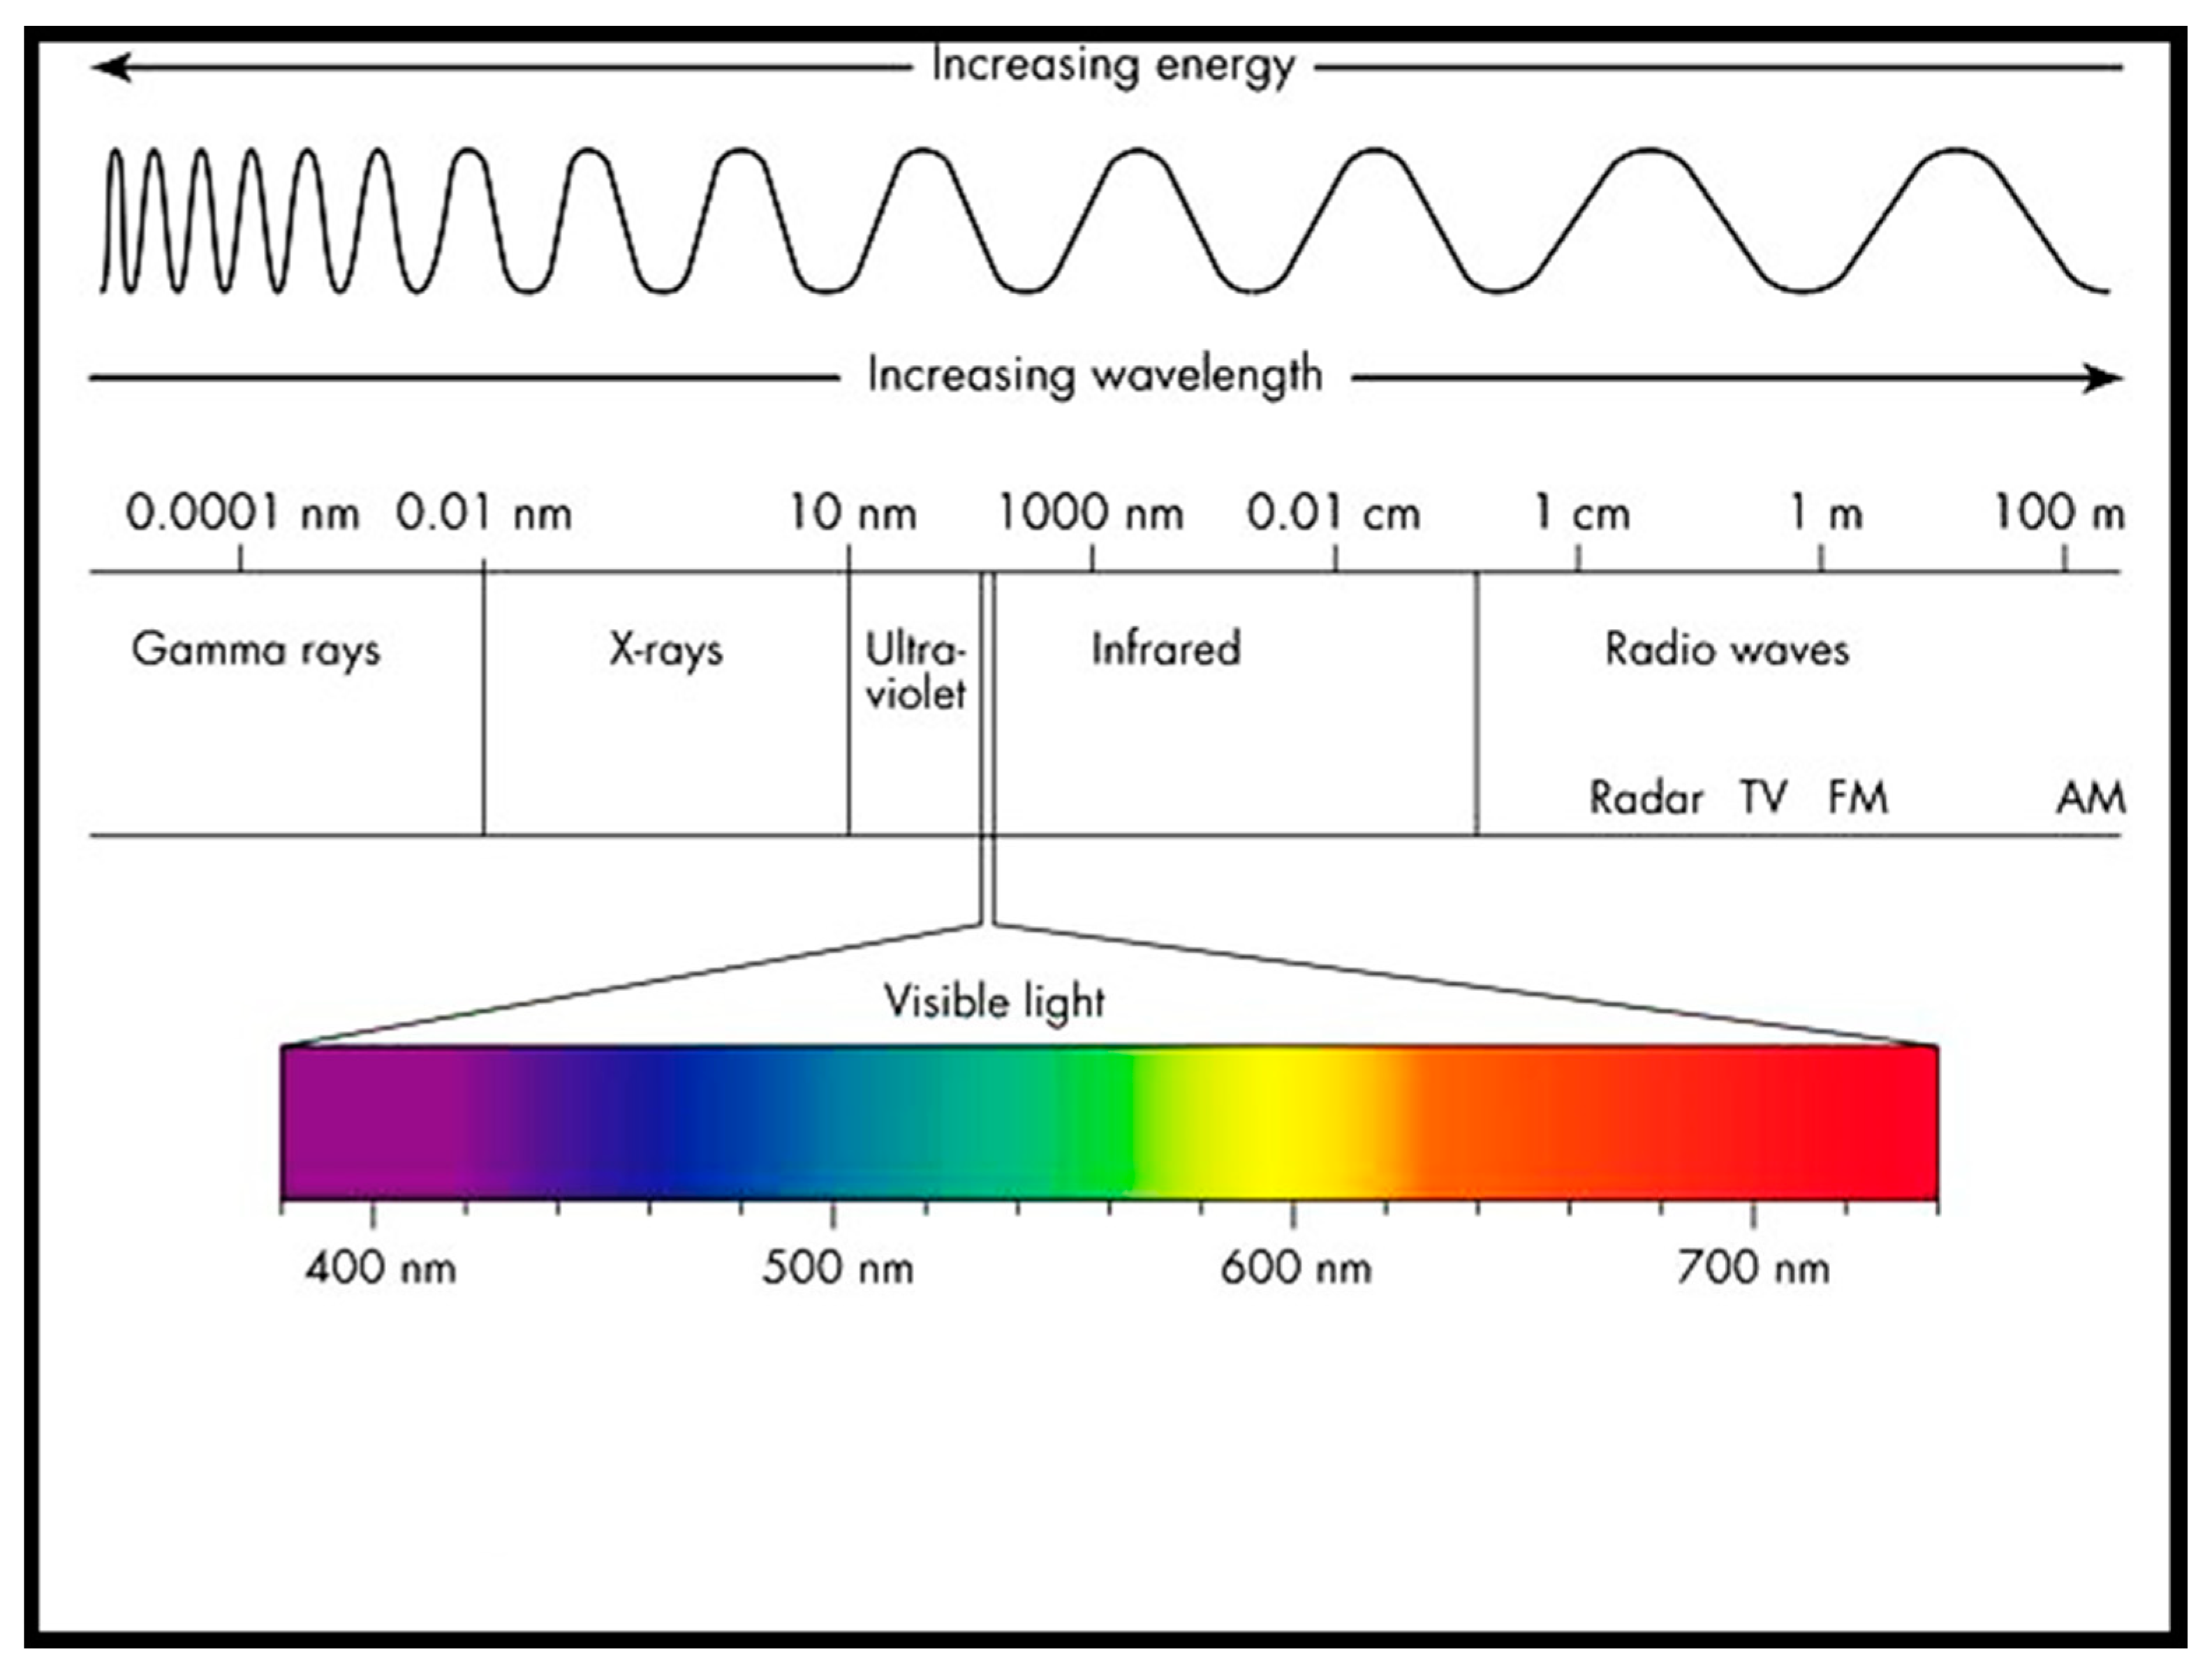
To develop an Electronic Eye system, we used three near-infrared (NIR) optical sensors, developed by Spectral Engines and coupled with different machine learning methods, which have been called eEyes. In the electromagnetic spectrum (see
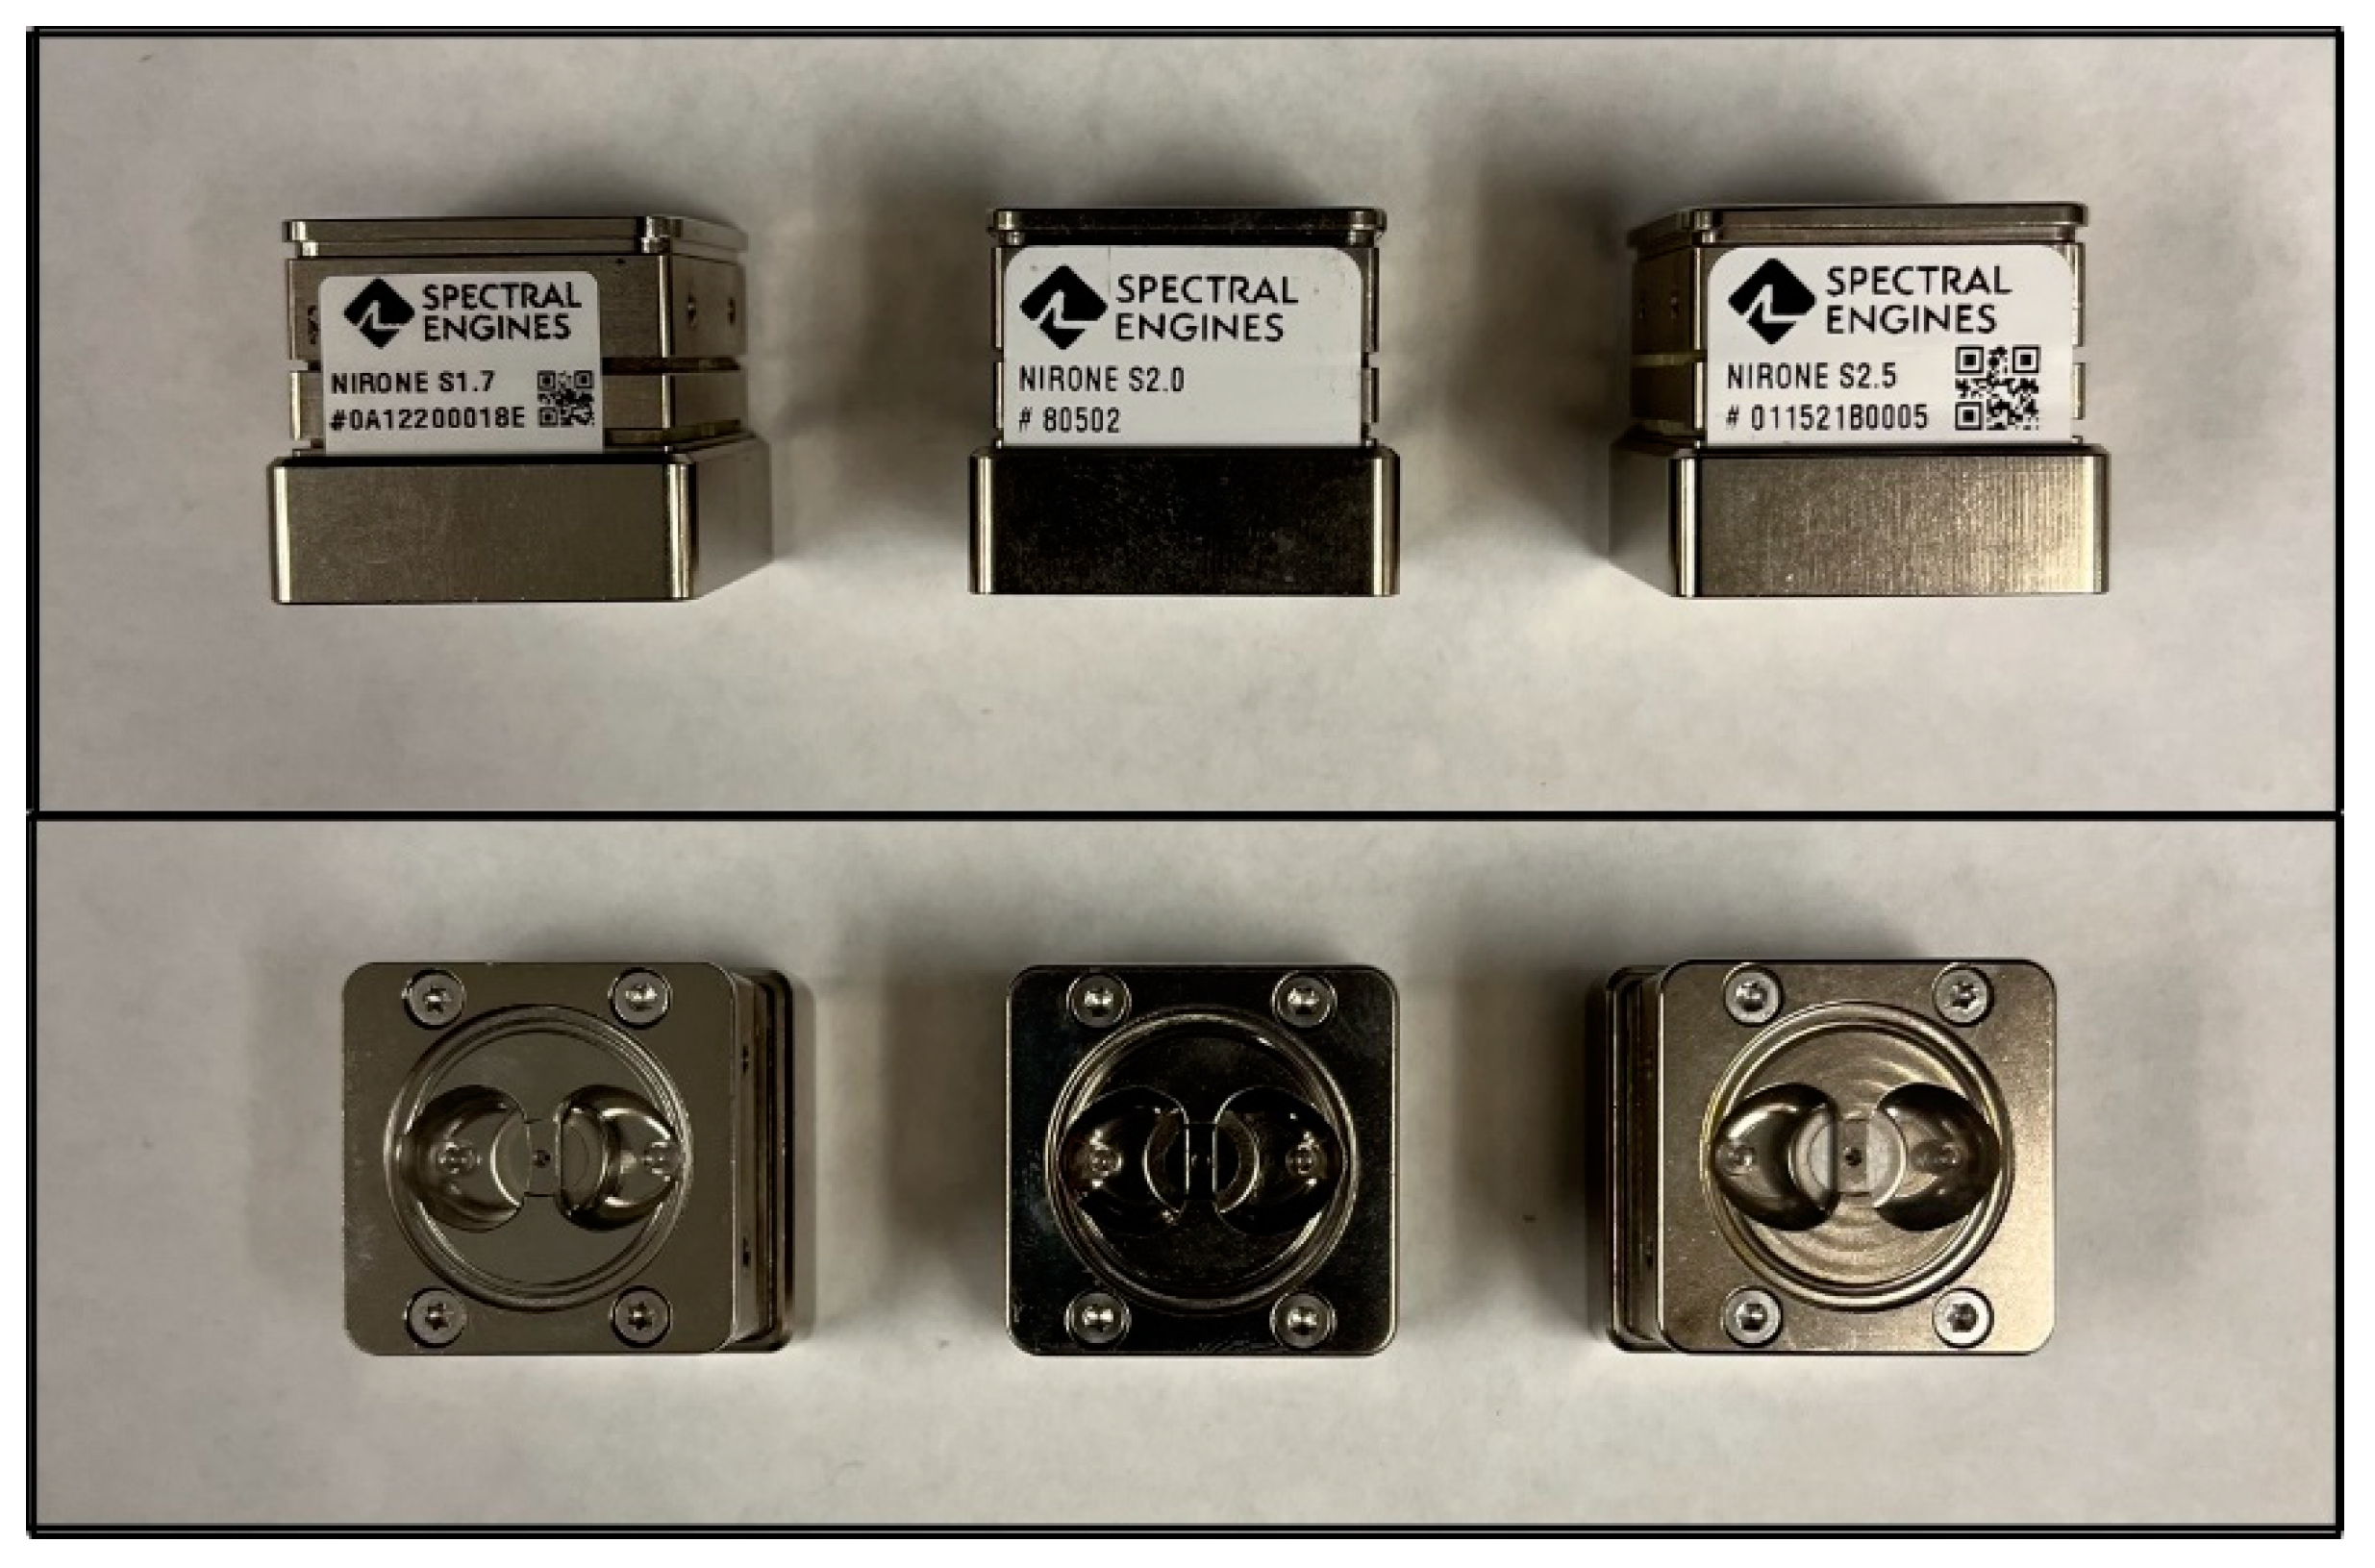
Figure 7), NIR is a form of light in the wavelength range of 750–2500 nm, whereas the visible (VIS) region of light is in the wavelength range of 400–700 nm. The eEyes system used here is composed of the three Spectral Engines NIRONE sensors, S1.7, S2.0, and S2.5, covering a range of wavelengths from 1359 nm to 2450 nm. Each sensor comes with its optics and electronics built into an aluminum enclosure with dimensions W = 25 mm, L = 25 mm, and H = 25 mm (see
Figure 8 for details). Each sensor consumes 1.1 W of peak power and less than 300 mW of nominal power, and has two tungsten vacuum lamps as its illumination source. The optical interface is a micro reflection optics or SMA connector. The weight varies between 31 g with the micro reflection optics and 38 g with the SMA connector. All three sensors have a signal-to-noise ratio (SNR) equivalent to 31.8–41.8 dB. Specific information on the sensors is shown in
Table 2 below.
The NIRONE sensors have an InGaAs photodiode detector which provides great selectivity and sensitivity. Before the signal gets to the detector, light passes through the aperture; it is then band-pass filtered and sent to a microelectromechanical system (MEMS) Fabry–Perot interferometer, which is a fully programmable optical filter. The sensor can be driven across the whole wavelength range, or it can operate only at selected wavelengths (See
Figure 7).
The wavelength switching time is of the order of 1 ms and has a step size ranging from a minimum of 0.1 nm and up to 512 total. The supply voltage is 5 V and 3.3 V for UART and I2C. The optical interface is easy to modify for different reflectance, transflectance, and transmission measurements.
Figure 8 shows the three NIRONE sensors—S1.7, S2.0, and S2.5—and their associated optics.
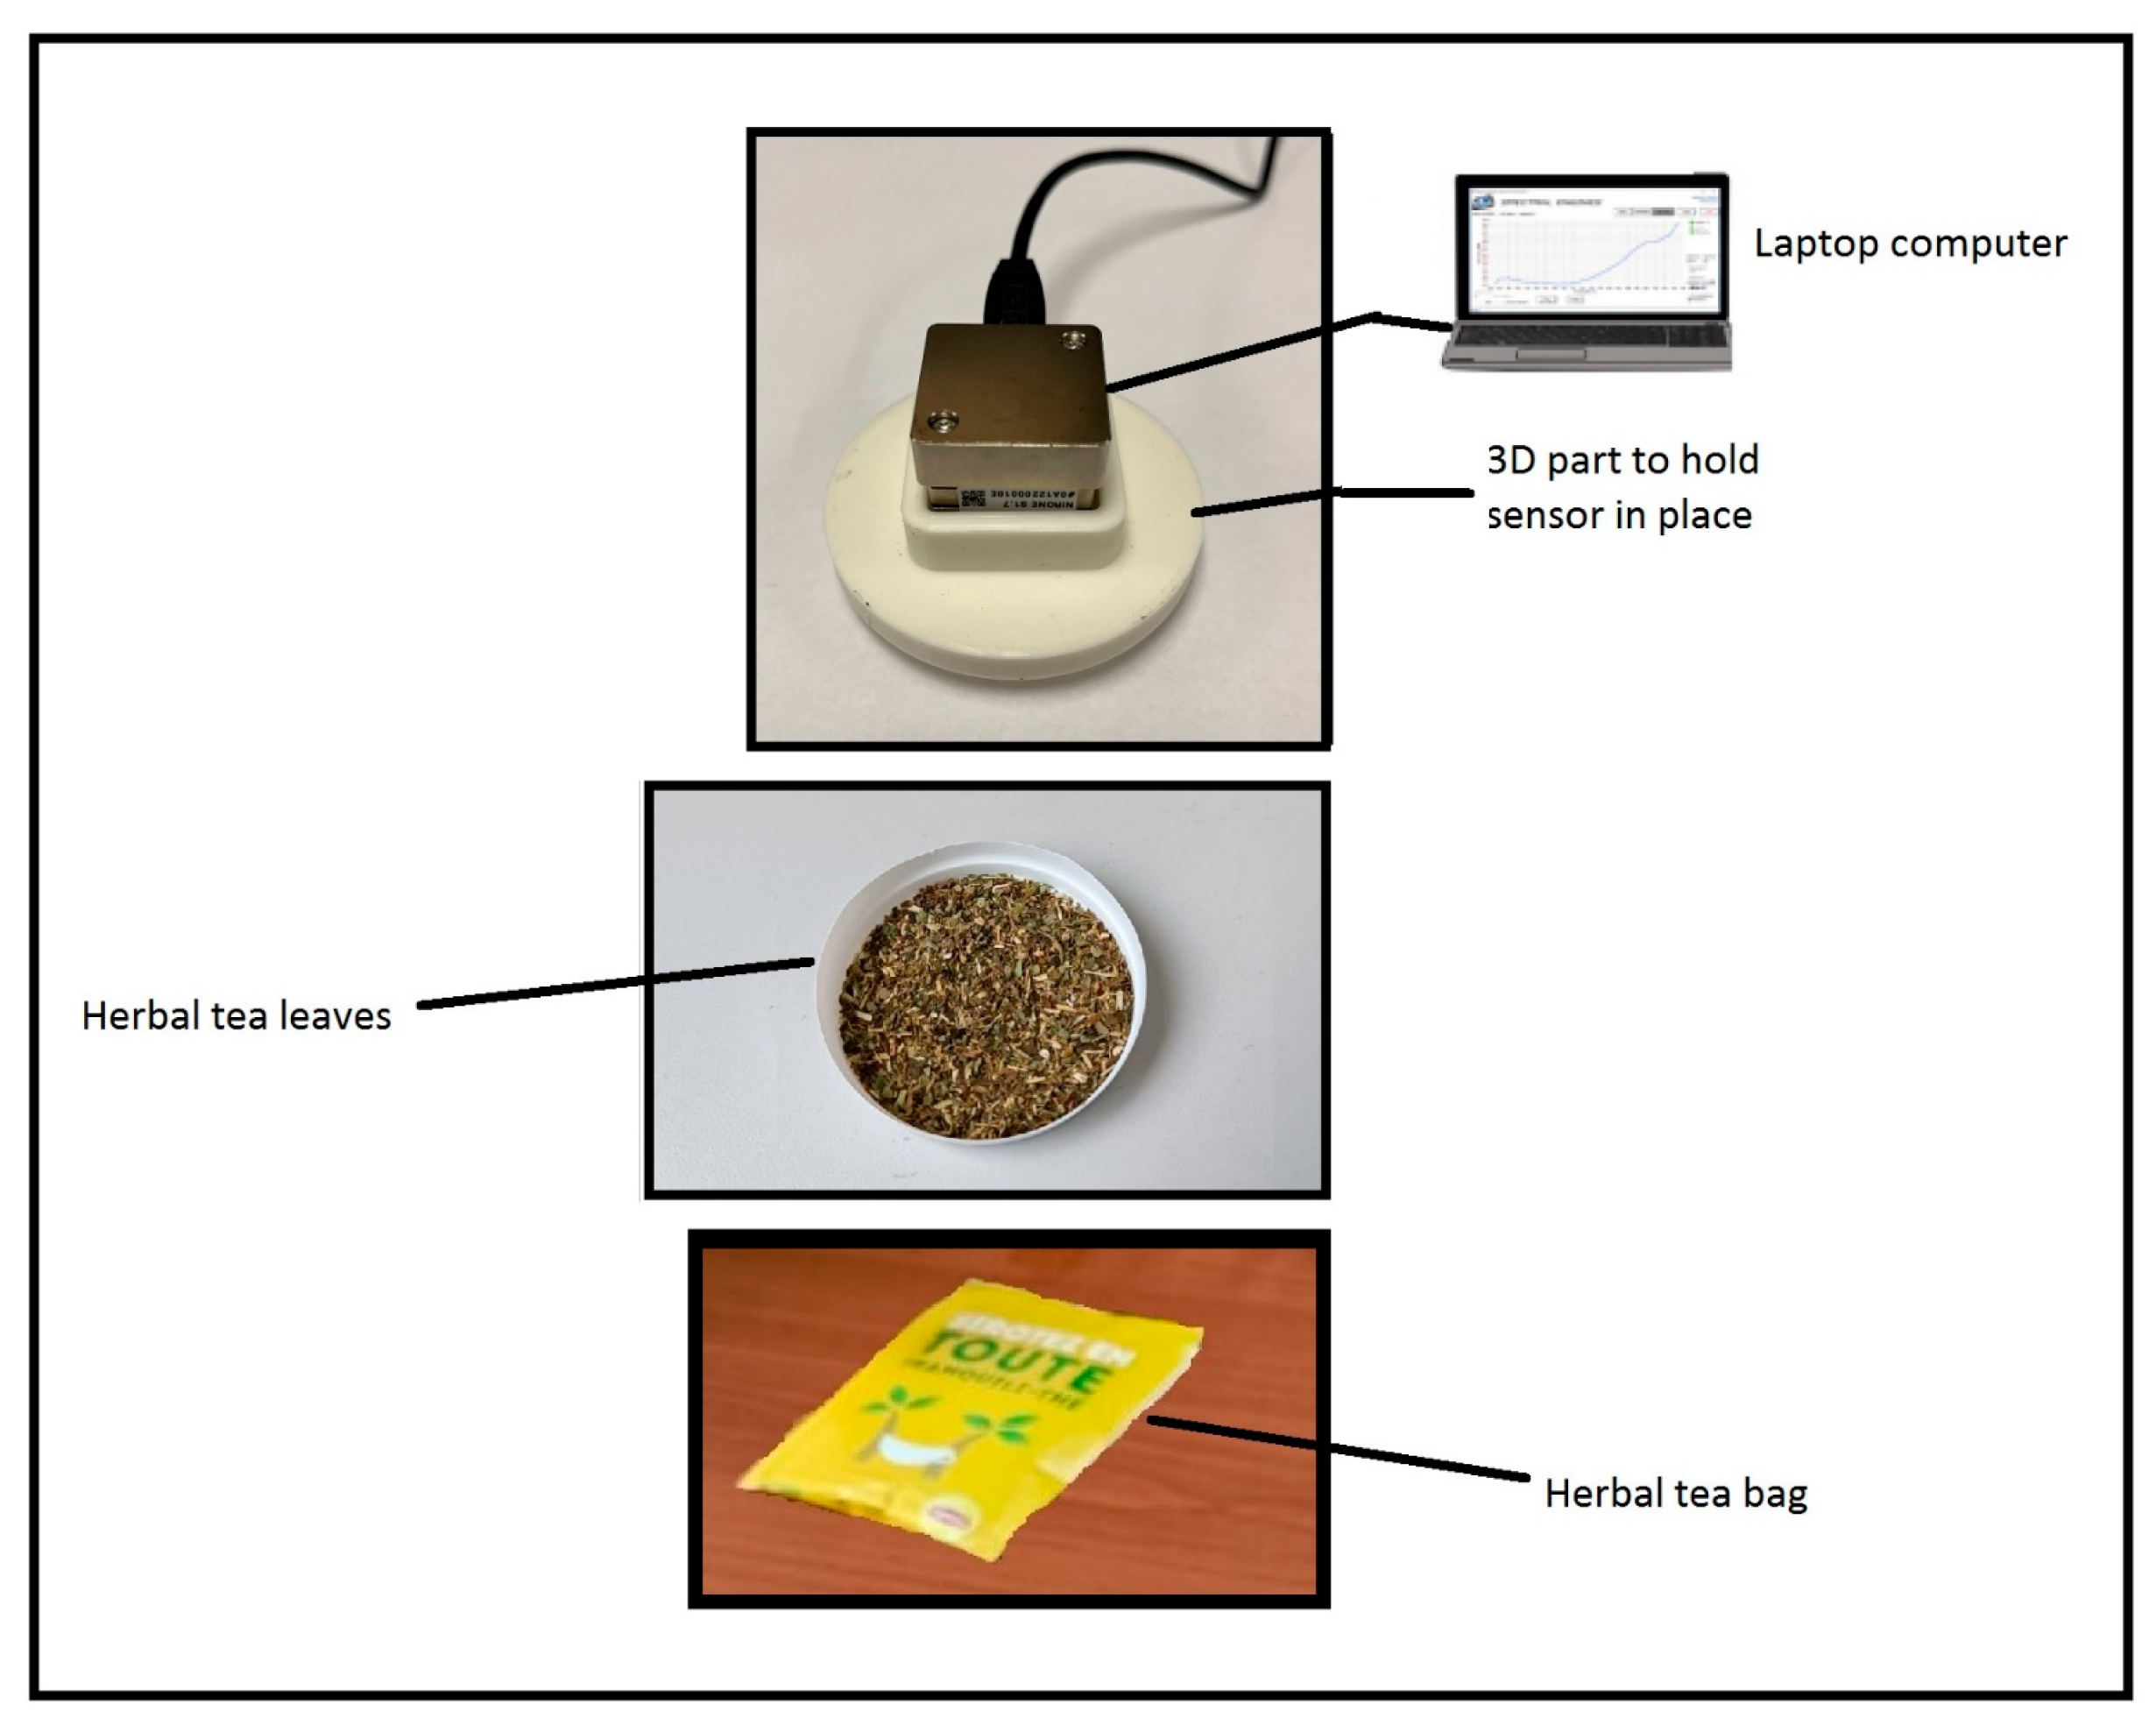
Figure 9 shows how the sensors were used to capture the herbal tea samples. The contents of a tea bag were placed in a plastic container similar to a petri dish, then a template with an orifice in the middle was placed above the sample, which would then hold the sensor in place at a fixed distance from the sample. As was mentioned above, a solid substance analysis based on the use of an array of spectrometer sensors called eEye, was used here to classify herbal tea samples in a qualitative and quantitative way from a machine learning and pattern recognition perspective. The NIRONE sensors are characterized by having high selectivity and sensitivity. The signals from the spectrometer sensors are transformed into a data matrix, thus requiring a multivariate data analysis for proper identification and classification.
Figure S3 illustrates the signals of the different categories of herbal teas acquired by the eEyes device. Significant differences were observed among all tea samples.
Twenty-five signals total (five for each brand of herbal tea) were obtained with the eEyes (See
Figure 8). This was achieved for each sensor (S1.7, S2.0, and S2.5), which yielded 75 signals altogether. These were then used in the machine learning data analysis. We would like to point out that the use of an array of spectrometers as an electronic eye is relatively new and has been used in applications ranging from textiles, food industry, pharmaceuticals, and law enforcement, but more specifically, References [
59,
60,
61,
62,
63,
64,
65] use an array of NIRONE sensors in applications ranging from sugarcane analysis, drug detection, and law enforcement, analysis of liver disease, to assess leaf water content, to analyze protein and fat in milk, and in the detection and quantification of peanut contamination in garlic powder. On the other hand, Reference [
65] proposes a structural optimization transmission framework for classification of hyperspectral images and LiDAR data, while Reference [
66] proposes a new method for the classification of cross-scene hyperspectral image data.
2.4. eTongue
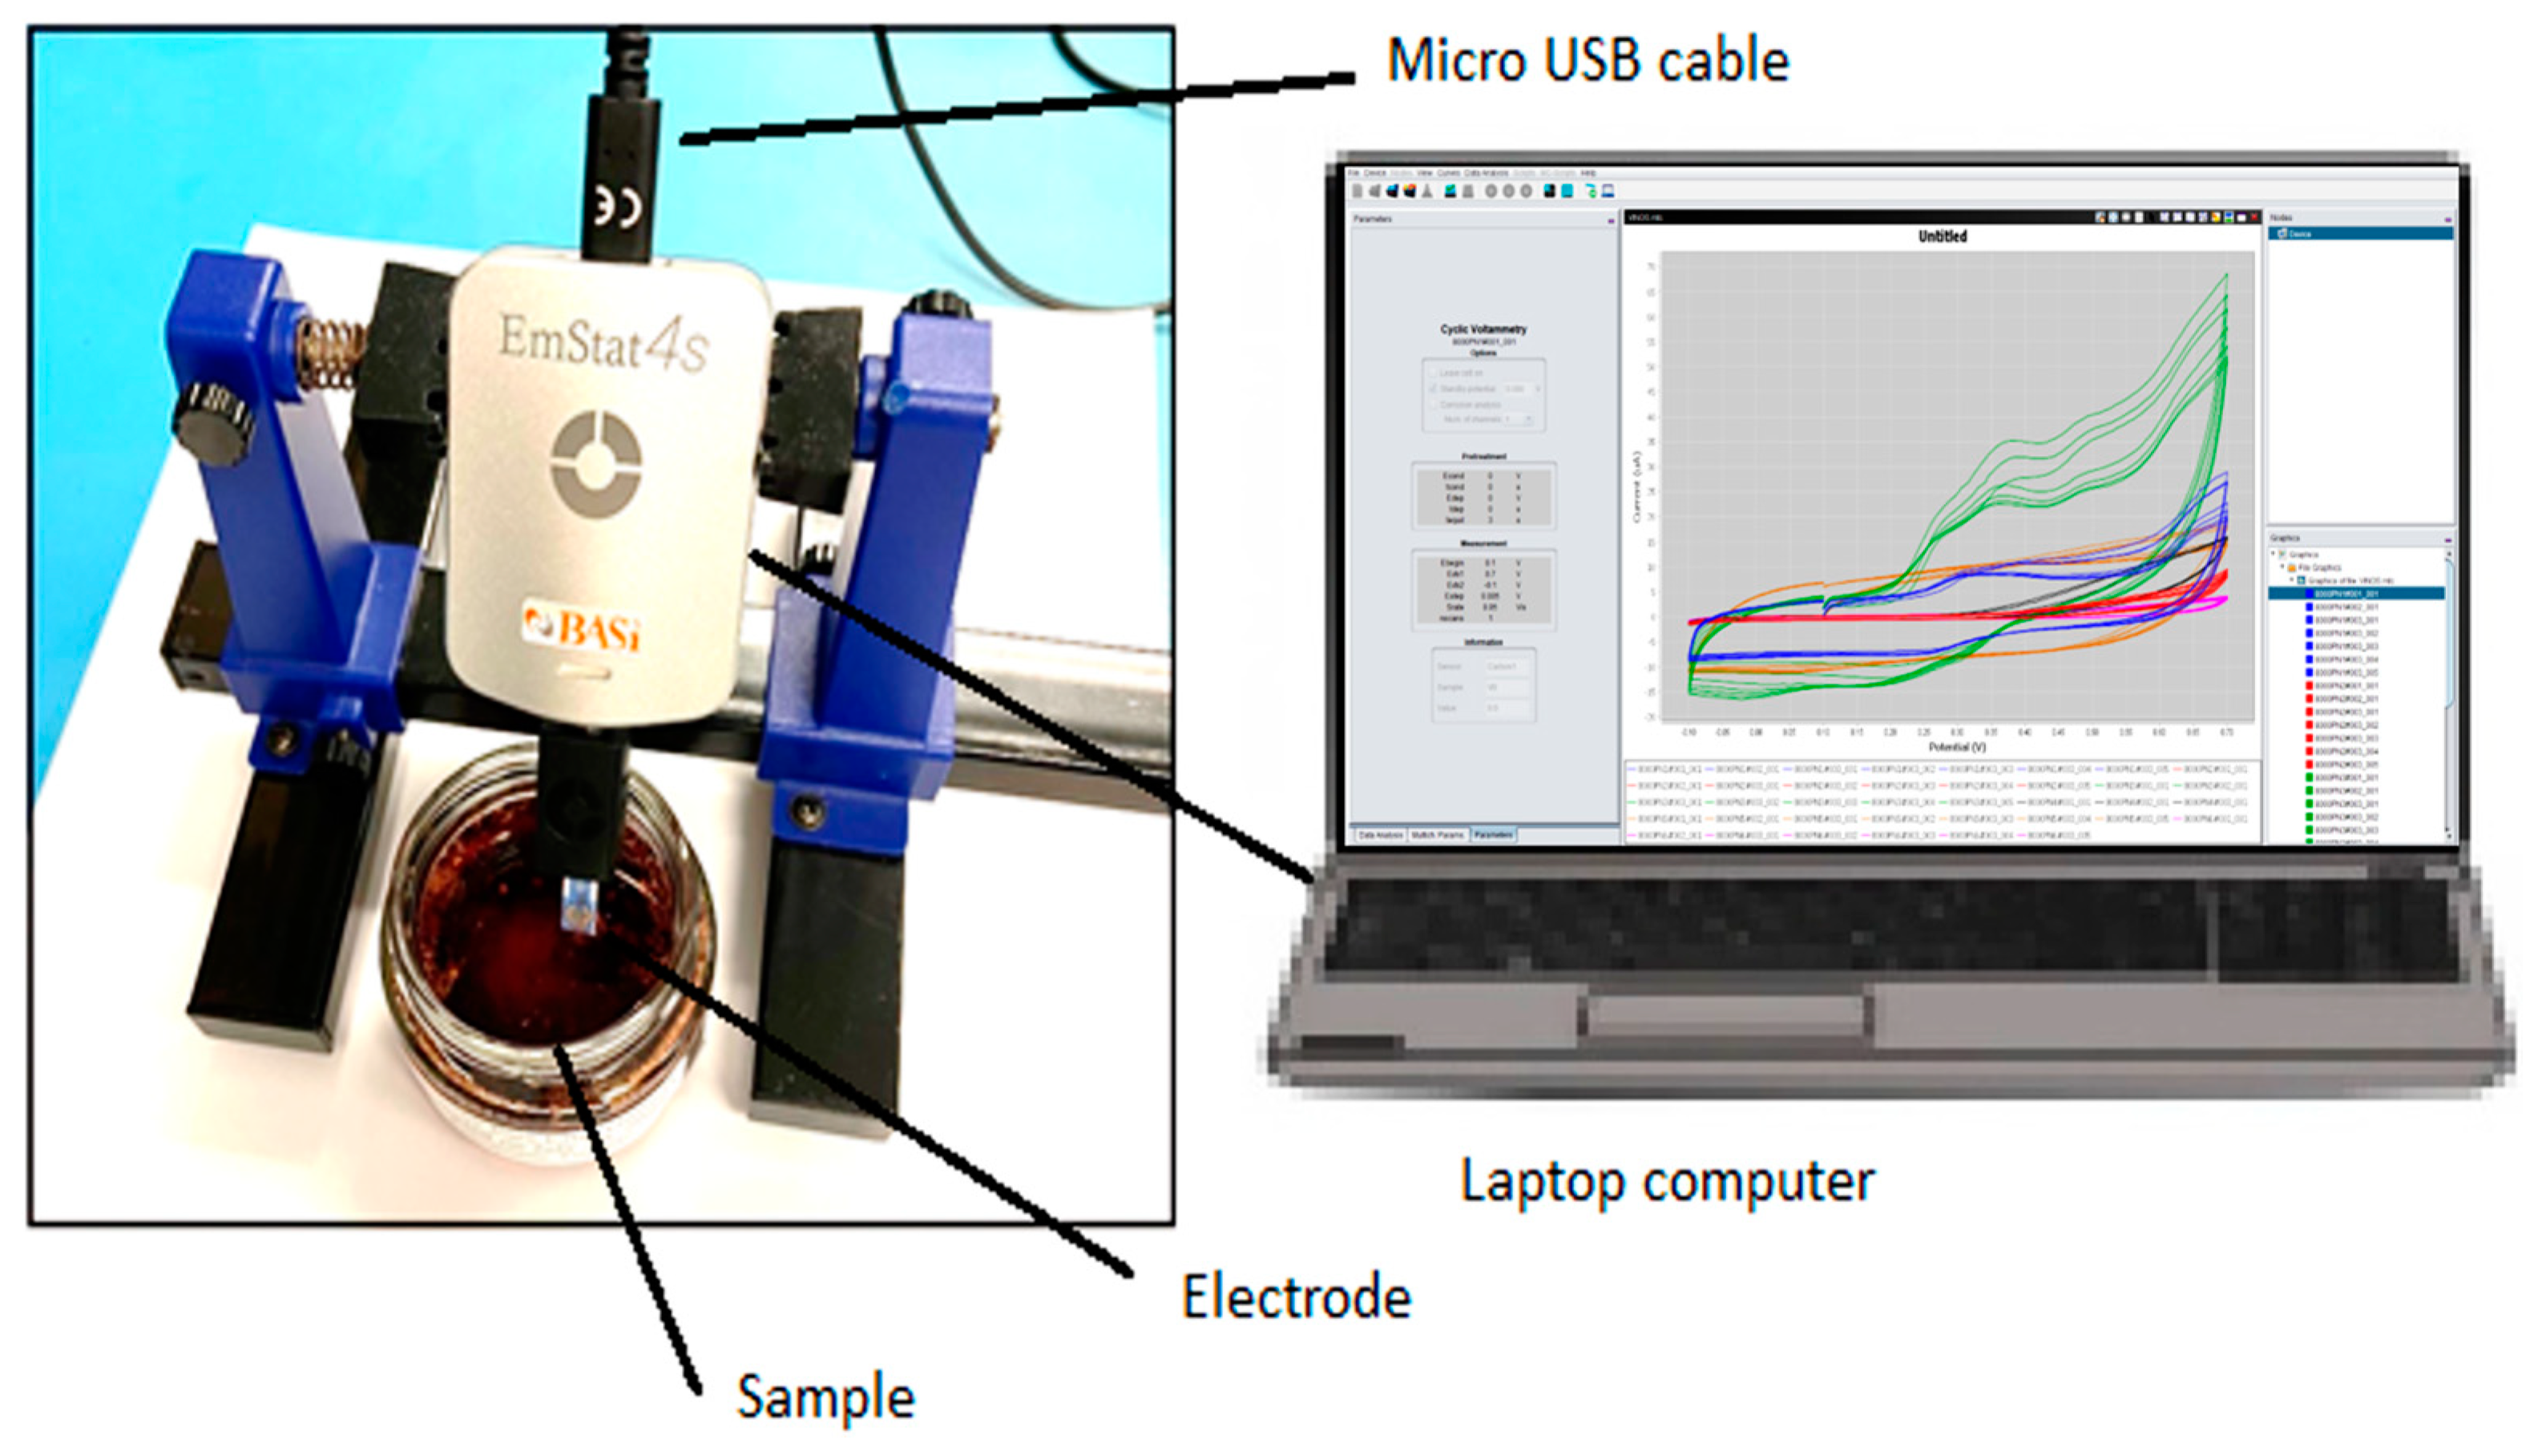
The electronic tongue system, called eTongue, is an EmStat 4S potentiostat by PalmSens and was used in voltammetric mode with different machine learning methods to classify herbal teas. As shown in
Figure 10, the device uses a commercial disposable electrode that integrates the working electrode (WE), reference electrode (RE), and counter electrode (CE) into one strip. In addition, the device comes with its own software, PSTrace, that can perform a wide range of experiments from linear sweep voltammetry to square wave voltammetry, electrochemical impedance spectroscopy, etc.
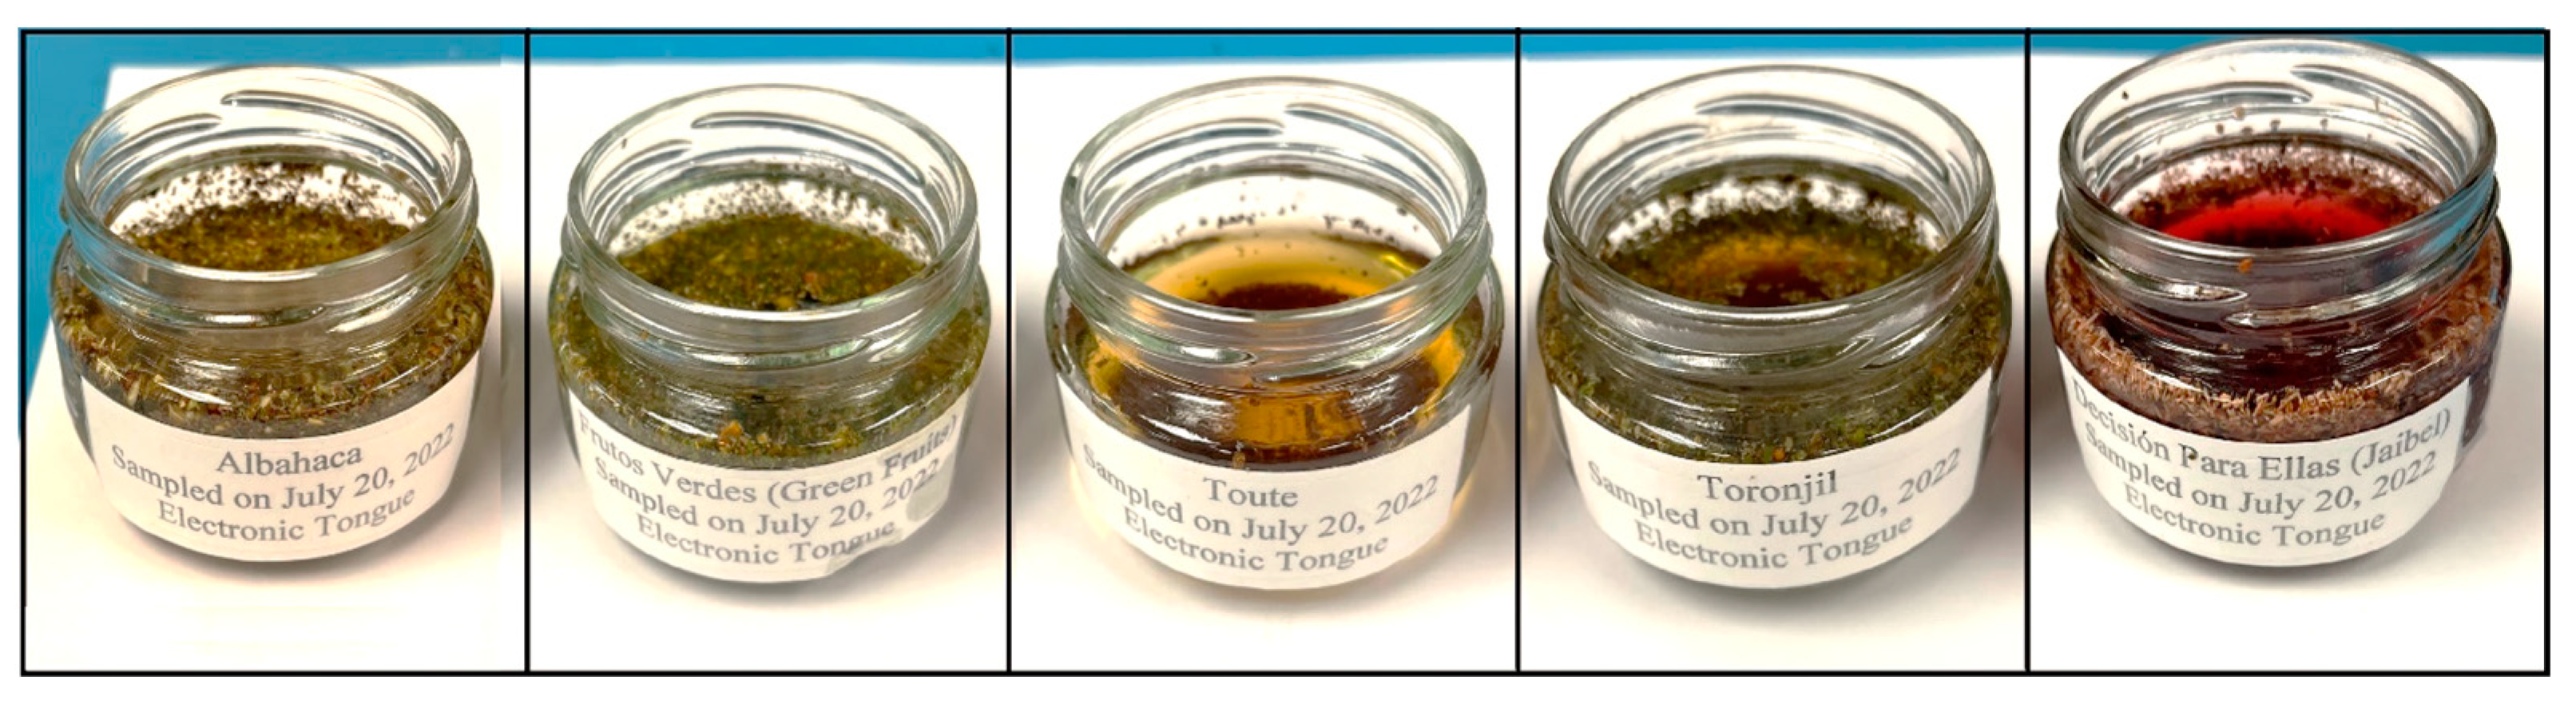
Figure 11 shows a picture of the samples placed in glass jars with water prior to conducting the experiments with the eTongue device. It should be noted that the liquid samples were prepared as infusion without increasing the temperature, and five experiments were conducted on each of the five herbal tea varieties. The average among all five experiments was taken to retain a representative sample. This was repeated five times for each brand of tea. Thus, 25 samples (5 of each tea brand) were used. In these experiments, two different screen-printed electrodes (i.e., the AC1-101 with a gold working electrode and a silver/silver chloride reference electrode and the AC1-102 with a platinum working electrode and a silver/silver chloride reference electrode), were applied to detect different herbal teas categories through electrochemical analysis methods (cyclic voltammetry). Thus a total of 50 samples were collected (i.e., 25 samples × 2 electrodes). These 50 samples were then subjected to machine learning data analysis. We should point out that in a separate study [
67], sparse modeling of electronic tongue signals was used to predict the quality of tea.
Figure S4 shows the differences in relation to the amplitude of the current signals in each of the voltammograms acquired with the AC1-101 electrode.
The parameters used in the cyclic voltammetry experiments are described in
Table 3. Here t is the time for equilibrium for which the E begin, or E DC is applied, where E begin is the potential applied at the beginning of measurement, E Vertex 1 and E Vertex 2 are the potentials at which the scan directions are reversed, E step is the step potential, Scan rate is the applied scan rate (the applicable range depends on the value of E step), and Number of scans is the number of scans to be measured. The selected current range for the experiments was from 10 nA to 1 mA. The expected duration of each experiment was 8 s, and 400 data points were recorded. Furthermore, the PS Trace software has the capability to do analyses based on voltammetric, pulse, amperometric, potentiometric, coulometric, and other techniques like impedance spectroscopy, galvanostatic impedance spectroscopy, and mixed-mode analysis. In addition, the software has an editor and a plot area containing everything post-measurement related, including measurement results and analytical tools.
2.5. Data Processing Method
In this section, we discuss the type of machine learning algorithms that were used in this study for the purpose of classification of Colombian herbal teas. The main structure of a machine learning-based predictive model is to first build the machine learning model from trained historical data and then to use the trained model to predict the outcomes of new data [
68].
Classification is a supervised learning method where the class labels in a given data set are to be predicted [
69]. Mathematically speaking, it maps a function (f) from the input space (X) to the output space (Y) as categories. In this paper, we are interested in predicting the classes in a given data set using structured data collected from E-senses instruments. In the following, we summarize the most common supervised machine learning-based classification algorithms.
2.5.1. K-Nearest Neighbors (kNN)
kNN is called a “lazy learning” algorithm because it is an “instance-based learning” approach. The focus of kNN is not to build a general internal model but to use the n-dimensional training data set to classify new data points on the basis of a similarity measure such as the Euclidean distance [
70]. The classification is based on a simple majority vote from among the k-nearest neighbors of each data point. kNN is quite robust to noisy data, and its accuracy depends highly on the overall quality of the data. A known issue with kNN is finding the optimal number of neighbors to be used. A plot of accuracy (
y-axis) versus the number of neighbors (
x-axis) is a known way of finding the optimal number of neighbors [
71]. kNN is commonly used in classification as well as in regression problems.
2.5.2. Support Vector Machine (SVM)
Another technique that has been quite popular for classification, regression, and other tasks, is the support vector machine [
72]. In a higher or infinite-dimensional space, an SVM classifier constructs hyper-planes having the greatest separation distance from the nearest training data points of any class. It usually achieves a strong separation, since the higher the margin, the lower the classifier’s error bounds. It is quite effective in high-dimensional spaces, and its behavior depends highly on the different mathematical functions called the kernel functions. Some popular kernel functions used in SVM classifiers are the radial basis function (RBF), sigmoid, linear, and polynomial [
73]. SVM, unfortunately, does not perform well under very noisy data and when the target classes significantly overlap.
2.5.3. Decision Trees (DT)
Decision tree is a well-known non-parametric supervised machine learning method and is used for both classification and regression problems. The classification and regression trees (CART) [
69] are a well-known technique used in DT algorithms. DT classifies the instances by sorting down the tree, starting from the root down to a leaf node. Each node has a defined attribute; thus, instances are classified by checking the attribute of a node, starting at the root node and moving down the tree branch, which corresponds to the attribute value. The most popular criteria for splitting the tree are the “gini” index for the Gini impurity and “entropy” for the information gain.
2.5.4. Naïve Bayes (NB)
Naïve Bayes is a result of applying Bayes’ rule under the assumption of independence between pairs of features [
72]. It works well in both binary and multi-class classification problems. The NB classifier tends to be robust, even when used to classify noisy training data. Other features of NB are that it is simple and easy to implement. It can handle both discrete and continuous data. It is easily scalable to the number of data points and predictors. It can be used to make real-time predictions, thus often leading to a robust prediction model [
73]. One major key benefit of NB, compared to other, more sophisticated approaches, is that it is quick and it only needs a small amount of training data to optimally estimate the parameters. However, failure to guarantee the strong feature independence assumption may degrade its performance.
2.5.5. Random Forest (RF)
Random forest is a well-known ensemble classifier used in machine learning and data science. The RF algorithm uses a set of “parallel ensembles”, thus fitting several decision tree classifiers in parallel on different sub-sampled data sets, then uses either majority voting or averages in predicting the outcome or final result. An advantage of RF is that it minimizes the over-fitting problem, therefore increasing the prediction accuracy and control [
74]. It has been observed that using multiple decision trees in an RF learning model is favorably more accurate than a single decision tree-based model [
68]. Other variations to RF include the use of bootstrap aggregation (bagging) and random feature selection. It can be used in both classification and regression problems.
2.5.6. Linear Discriminant Analysis (LDA)
LDA is a linear classifier based on a decision boundary created by fitting conditional class densities to the data and then applying Bayes’ rule [
73]. It has been known that LDA is a generalized Fisher’s linear discriminant, due to the fact that it projects the given dataset onto a lower-dimensional space. As such, it reduces the dimensionality and minimizes the complexity of the model. A standard assumption in the use of LDA is that each class follows a Gaussian density and that all classes have the same covariance matrix. LDA can be thought to be related to the analysis of variance (ANOVA) and regression analysis, which seek to express a dependent variable as a linear combination of other features or observations.
2.5.7. PCA (Principal Component Analysis)
The principal component analysis technique is normally applied to study the relationships that occur between a set of correlated variables (that measure common information) where a set of original variables is transformed into another set of new uncorrelated variables, which are called principal components (PCs) [
75]. These variables are linear combinations and are built given an order of importance, taking into account the captured variance. Therefore, it can be a supervised and unsupervised pattern recognition technique, where the main objective is to reduce the dimensionality of a set of measurements from a given number of variables. This is possible by projecting the input data onto the directions of maximum variance using an orthogonal projection of its principal components onto a dimensional plot. In this study, PCA was mainly used to discriminate the measurements and obtain the “scores” as an input matrix applied to the machine learning or classification methods [
76].
2.5.8. Machine Learning Metrics
In order to be able to discriminate among the different machine learning models, a set of metrics are needed to quantify each models performance. In this section, we give a summary of some of the more common metrics used in machine learning, as described in Reference [
77]. These are given for multi-class classification problems. All metrics are scalar measures, irrespective of their subscripts.
Given a data set, let
denote the number of samples and
be the number of classes as shown in
Table 4. Furthermore, let
be the number of samples belonging to the 𝑔-th class and
be the number of samples predicted to be in the 𝑔-th class. Let
be the
confusion matrix, where
denotes the number of samples belonging to class 𝑔 and predicted to be in class
. Similarly, let
be the diagonal elements in
, which represent the number of samples correctly classified. The off-diagonal elements of
indicate the samples that are incorrectly classified as belonging to class 𝑔 [
68]. Note that, in general,
. Then the total number of samples,
, is given from the sum of all the elements in the confusion matrix; that is,
Moreover, the number of samples belonging to the
g-th class (
) corresponds to the sum of the elements of the
g-th row
Likewise, the number of samples predicted to be in the g-th class (
) corresponds to the sum of the elements of the g-th column
The sensitivity of the
g-th class
is a measure of the ability of a classifier to correctly classify the members of its class. It is calculated as:
Likewise, the precision of the
g-th class
is a measure of the ability of a classifier to avoid a wrong prediction of that class, and is defined as
Finally, the specificity of the
g-th class
is a measure of the ability of a classifier to reject samples from other classes, and is calculated as
Accuracy is the classifier’s overall ability to predict a given class, and is calculated as
The error rate is the classifier’s overall ability to misclassify a given class, and is calculated as
The following metrics are average measures: PRE = precision, SEN = sensitivity, and SPE = specificity; they are calculated from:
Finally, the F1 statistic uses the average measures of sensitivity and precision to calculate the F-score statistic from
In this work, we have used the metrics {ACC, ERR, PRE, SEN, SPE, F1} as measures of fidelity toward judging the performances of the different models. Note that all metrics are scalars in the range . Furthermore, the F1 score is calculated as the harmonic mean of the precision and sensitivity scores.
2.6. Measurements
A total of 100 measurements were acquired, where 25 measurements were processed with each sensory system. For this purpose, groups of 5 measures of each of the aromatic herbs Albahaca, Frutos verdes, Jaibel, Torongil and Toute were formed. In the case of the eTongue, the samples were prepared in glass jars in equal amounts and added portions of drinking water. As mentioned above, the tests with the eNoses and the eEyes were carried out with solid samples which were prepared in small vessels, as found in the original packaged product.
Table 5 shows all five brands of Colombian teas used in this study, along with the main ingredients. All tea samples were evaluated using a headspace solid-phase microextraction coupled with gas chromatography–mass spectrometry (HS-SPME-GC-MS) analysis, which will be discussed in a later section.
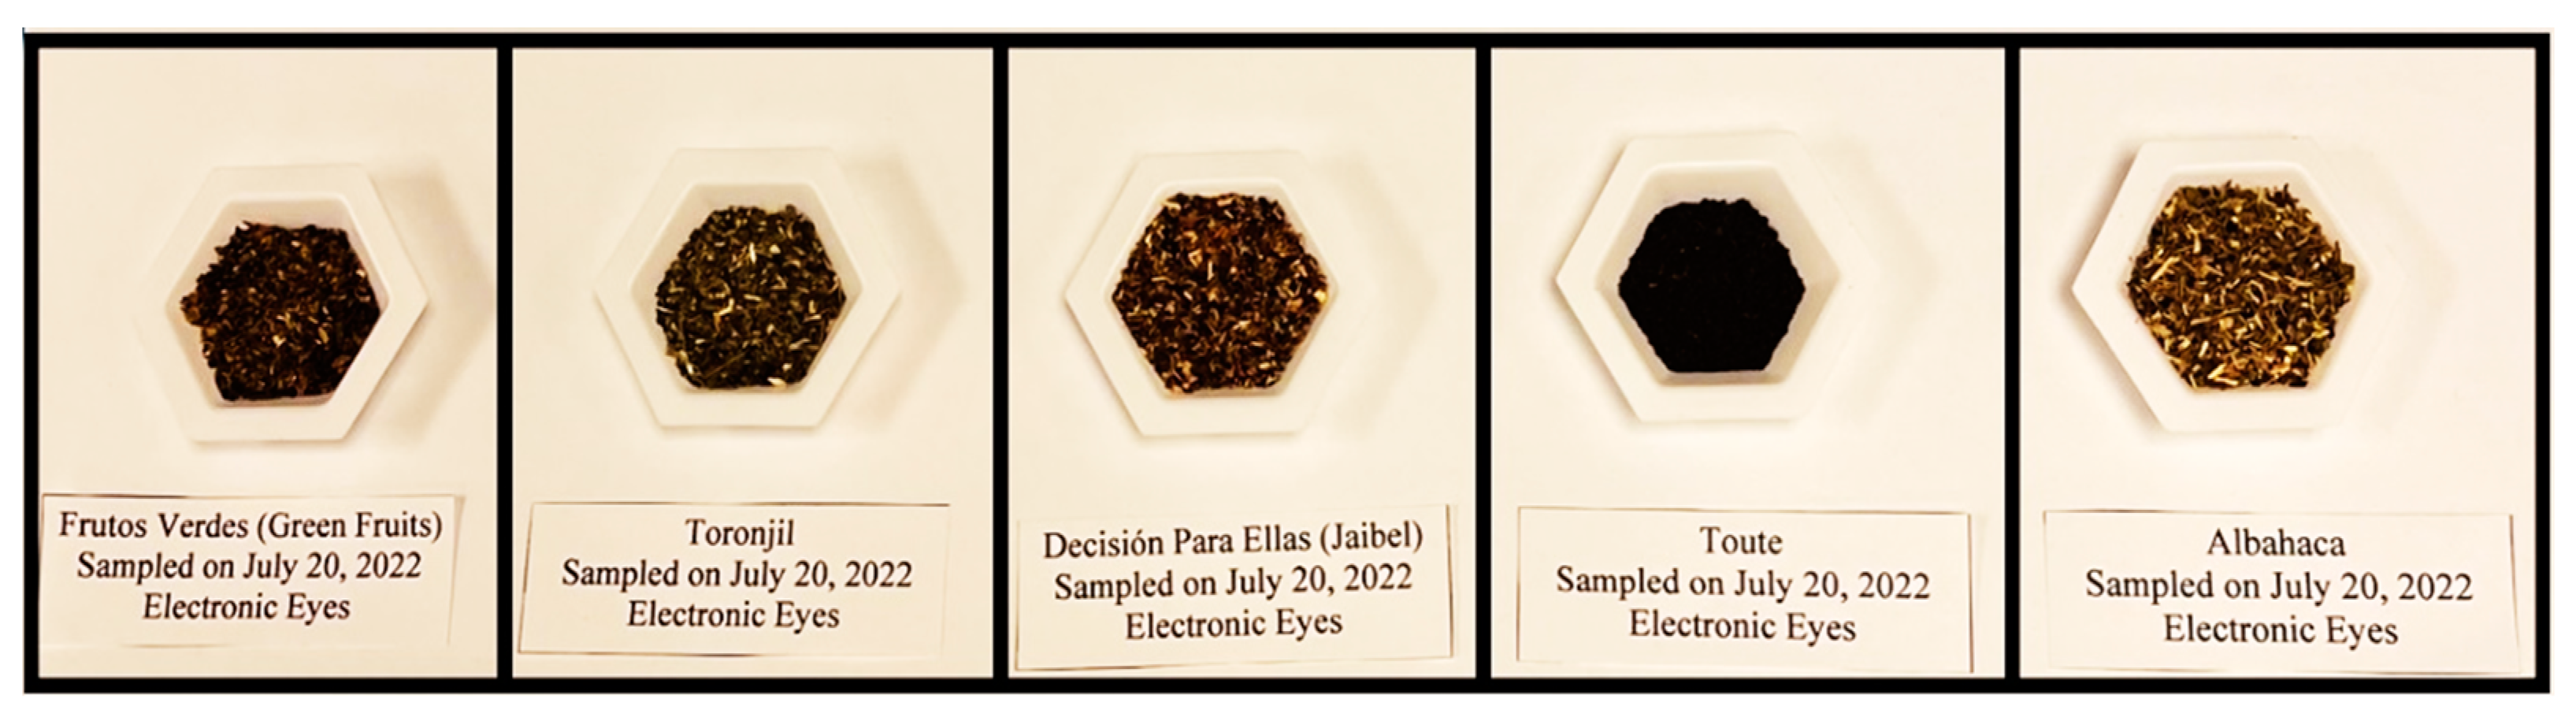
Five samples of each of the Colombian herbal teas were placed in vessels as was mentioned (see
Figure 12). Then, five experiments were run on each of the five different herbal tea samples. We then took an average of the five experiments and kept the average signal as a representative measure of each sample.
3. Results
The results obtained by each of the sensory methods are described below.
3.1. eNose1
As mentioned above, 25 samples of the different types of aromatic herbs were analyzed with the Electronic Nose (eNose1) of the University of Pamplona, where different pre-processing and data-processing methods were applied to the data set.
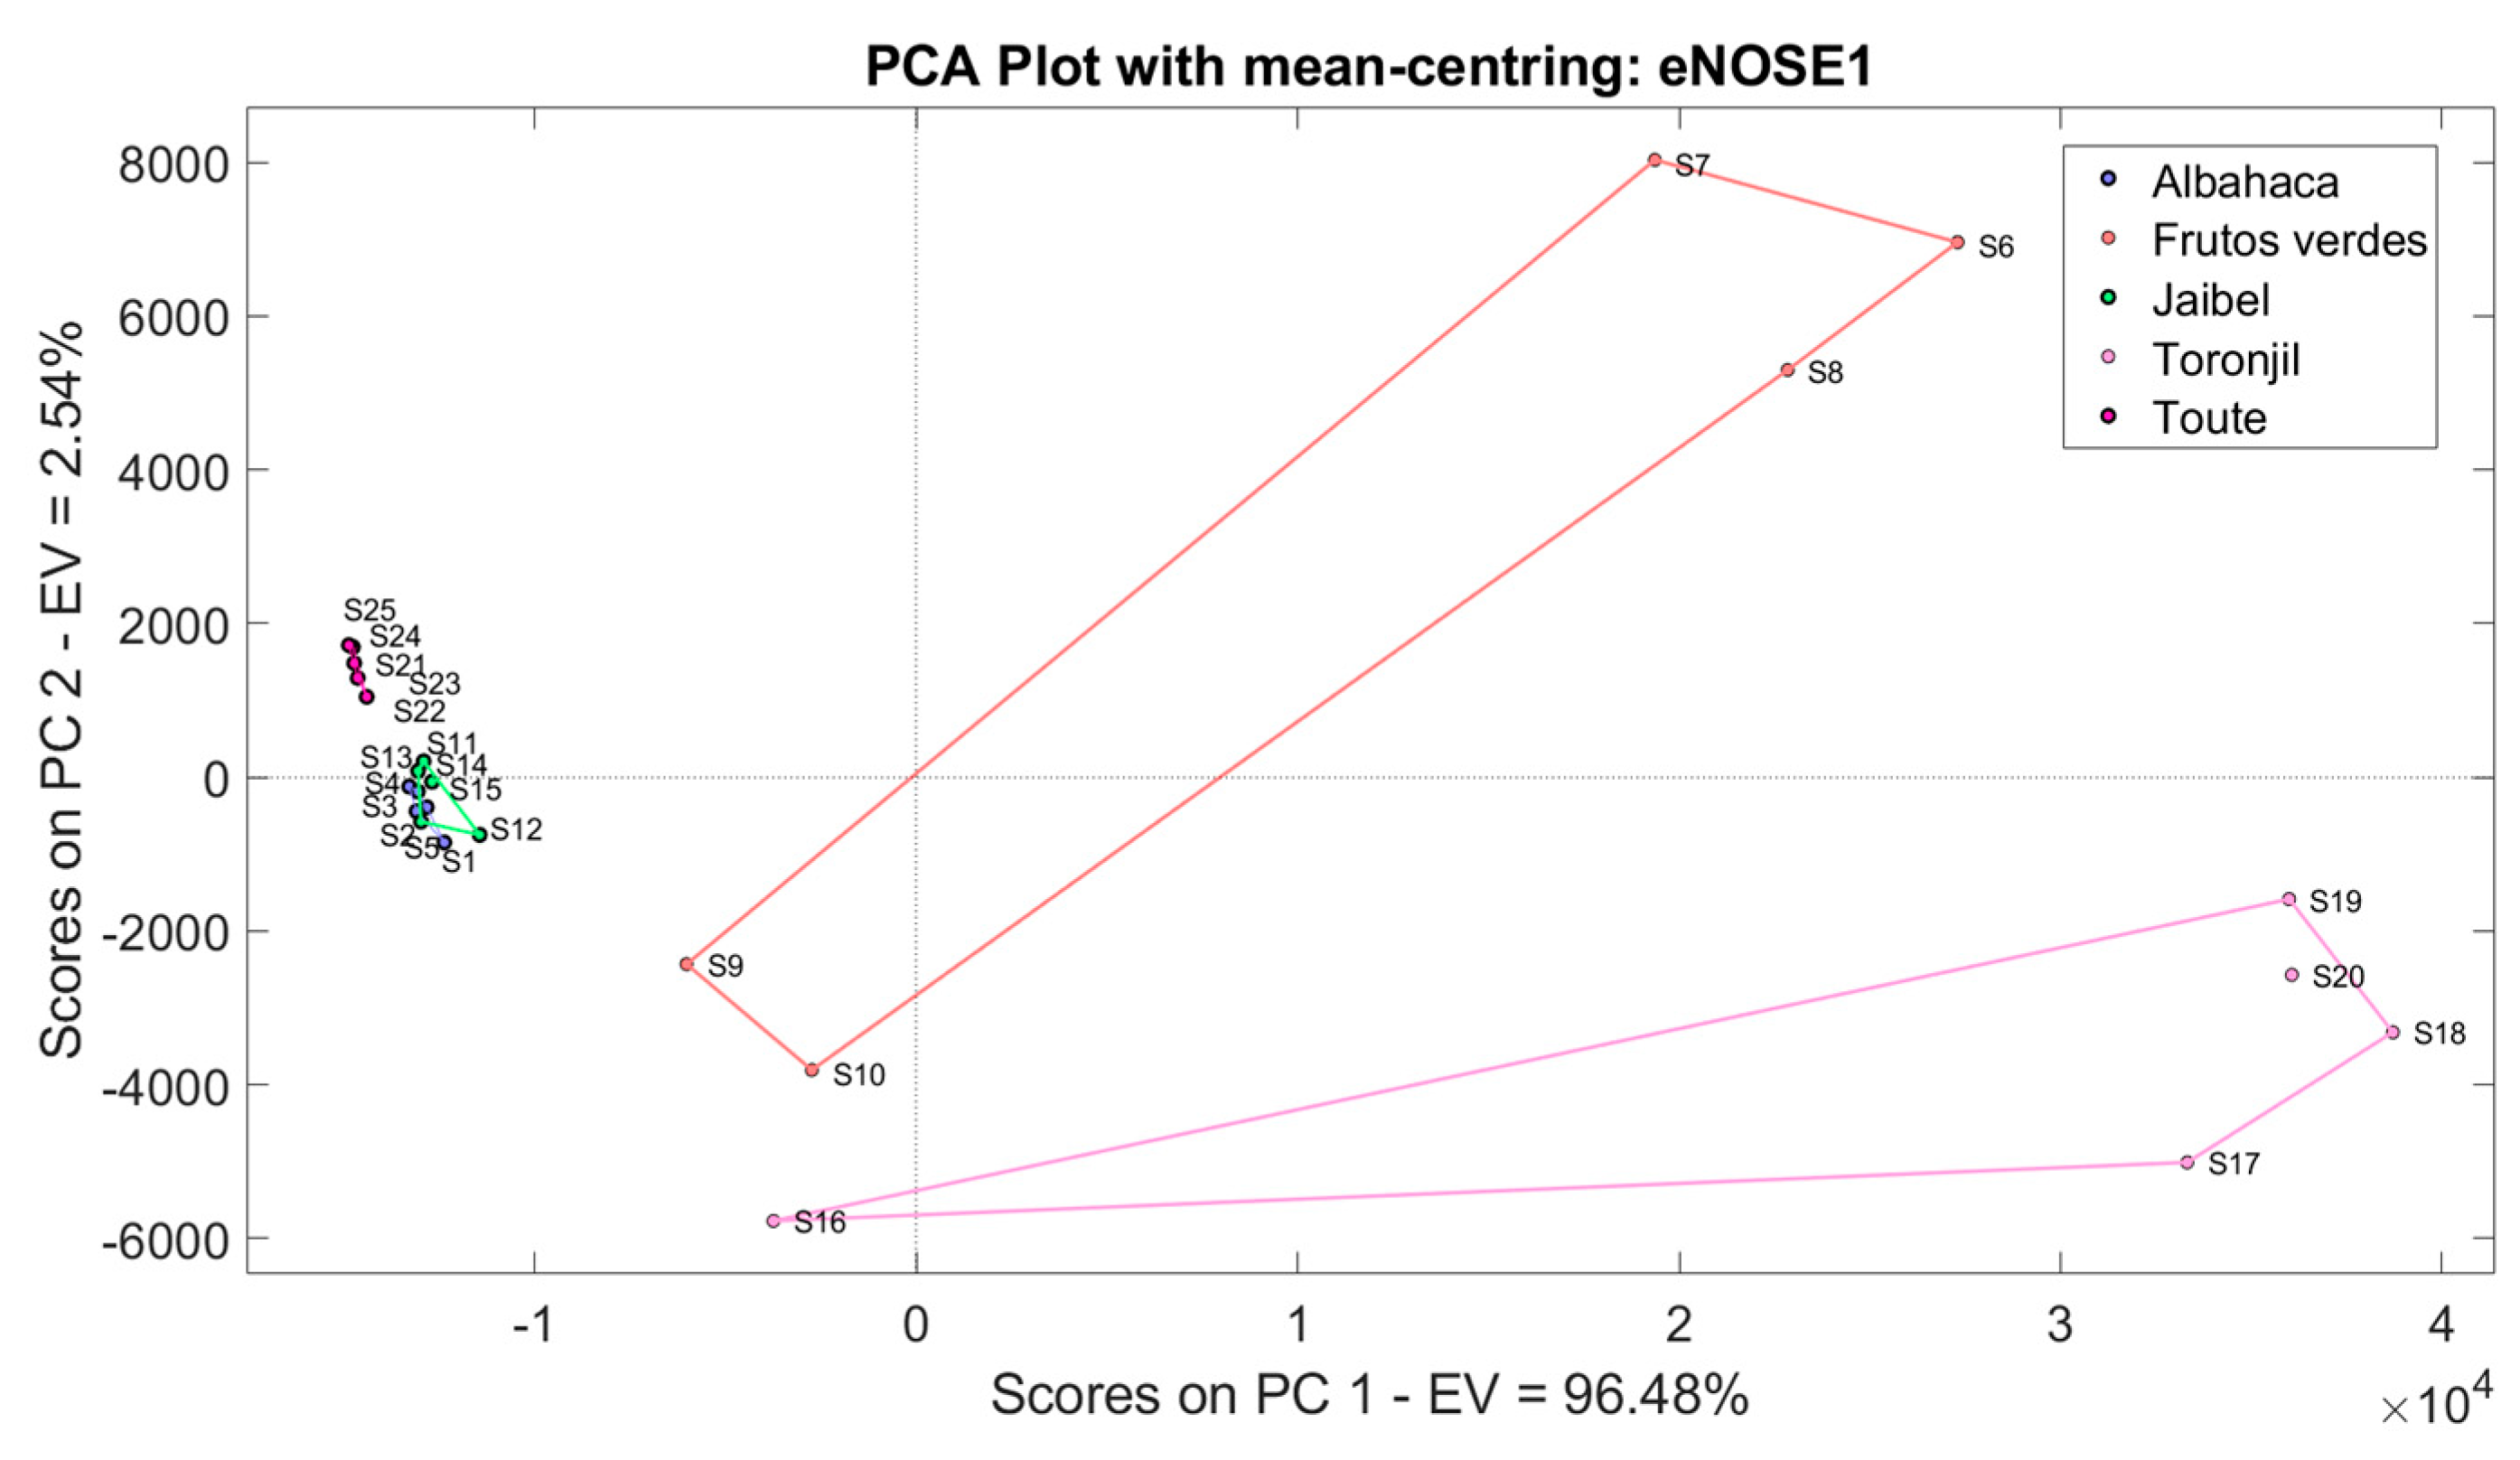
Before applying the machine learning algorithms, we plotted the principal component scores, and the results are shown in
Figure 13. The figure illustrates a clear dispersion of the measurements of
Frutos Verdes and
Toronjil; likewise, an overlap of the
Albahaca samples with
Jaibel is observed. The measurements were previously normalized using mean-centering.
Supplementary Figure S5 illustrates the LDA method response used to classify the herbal teas through the eNose1 system.
3.2. eNose2
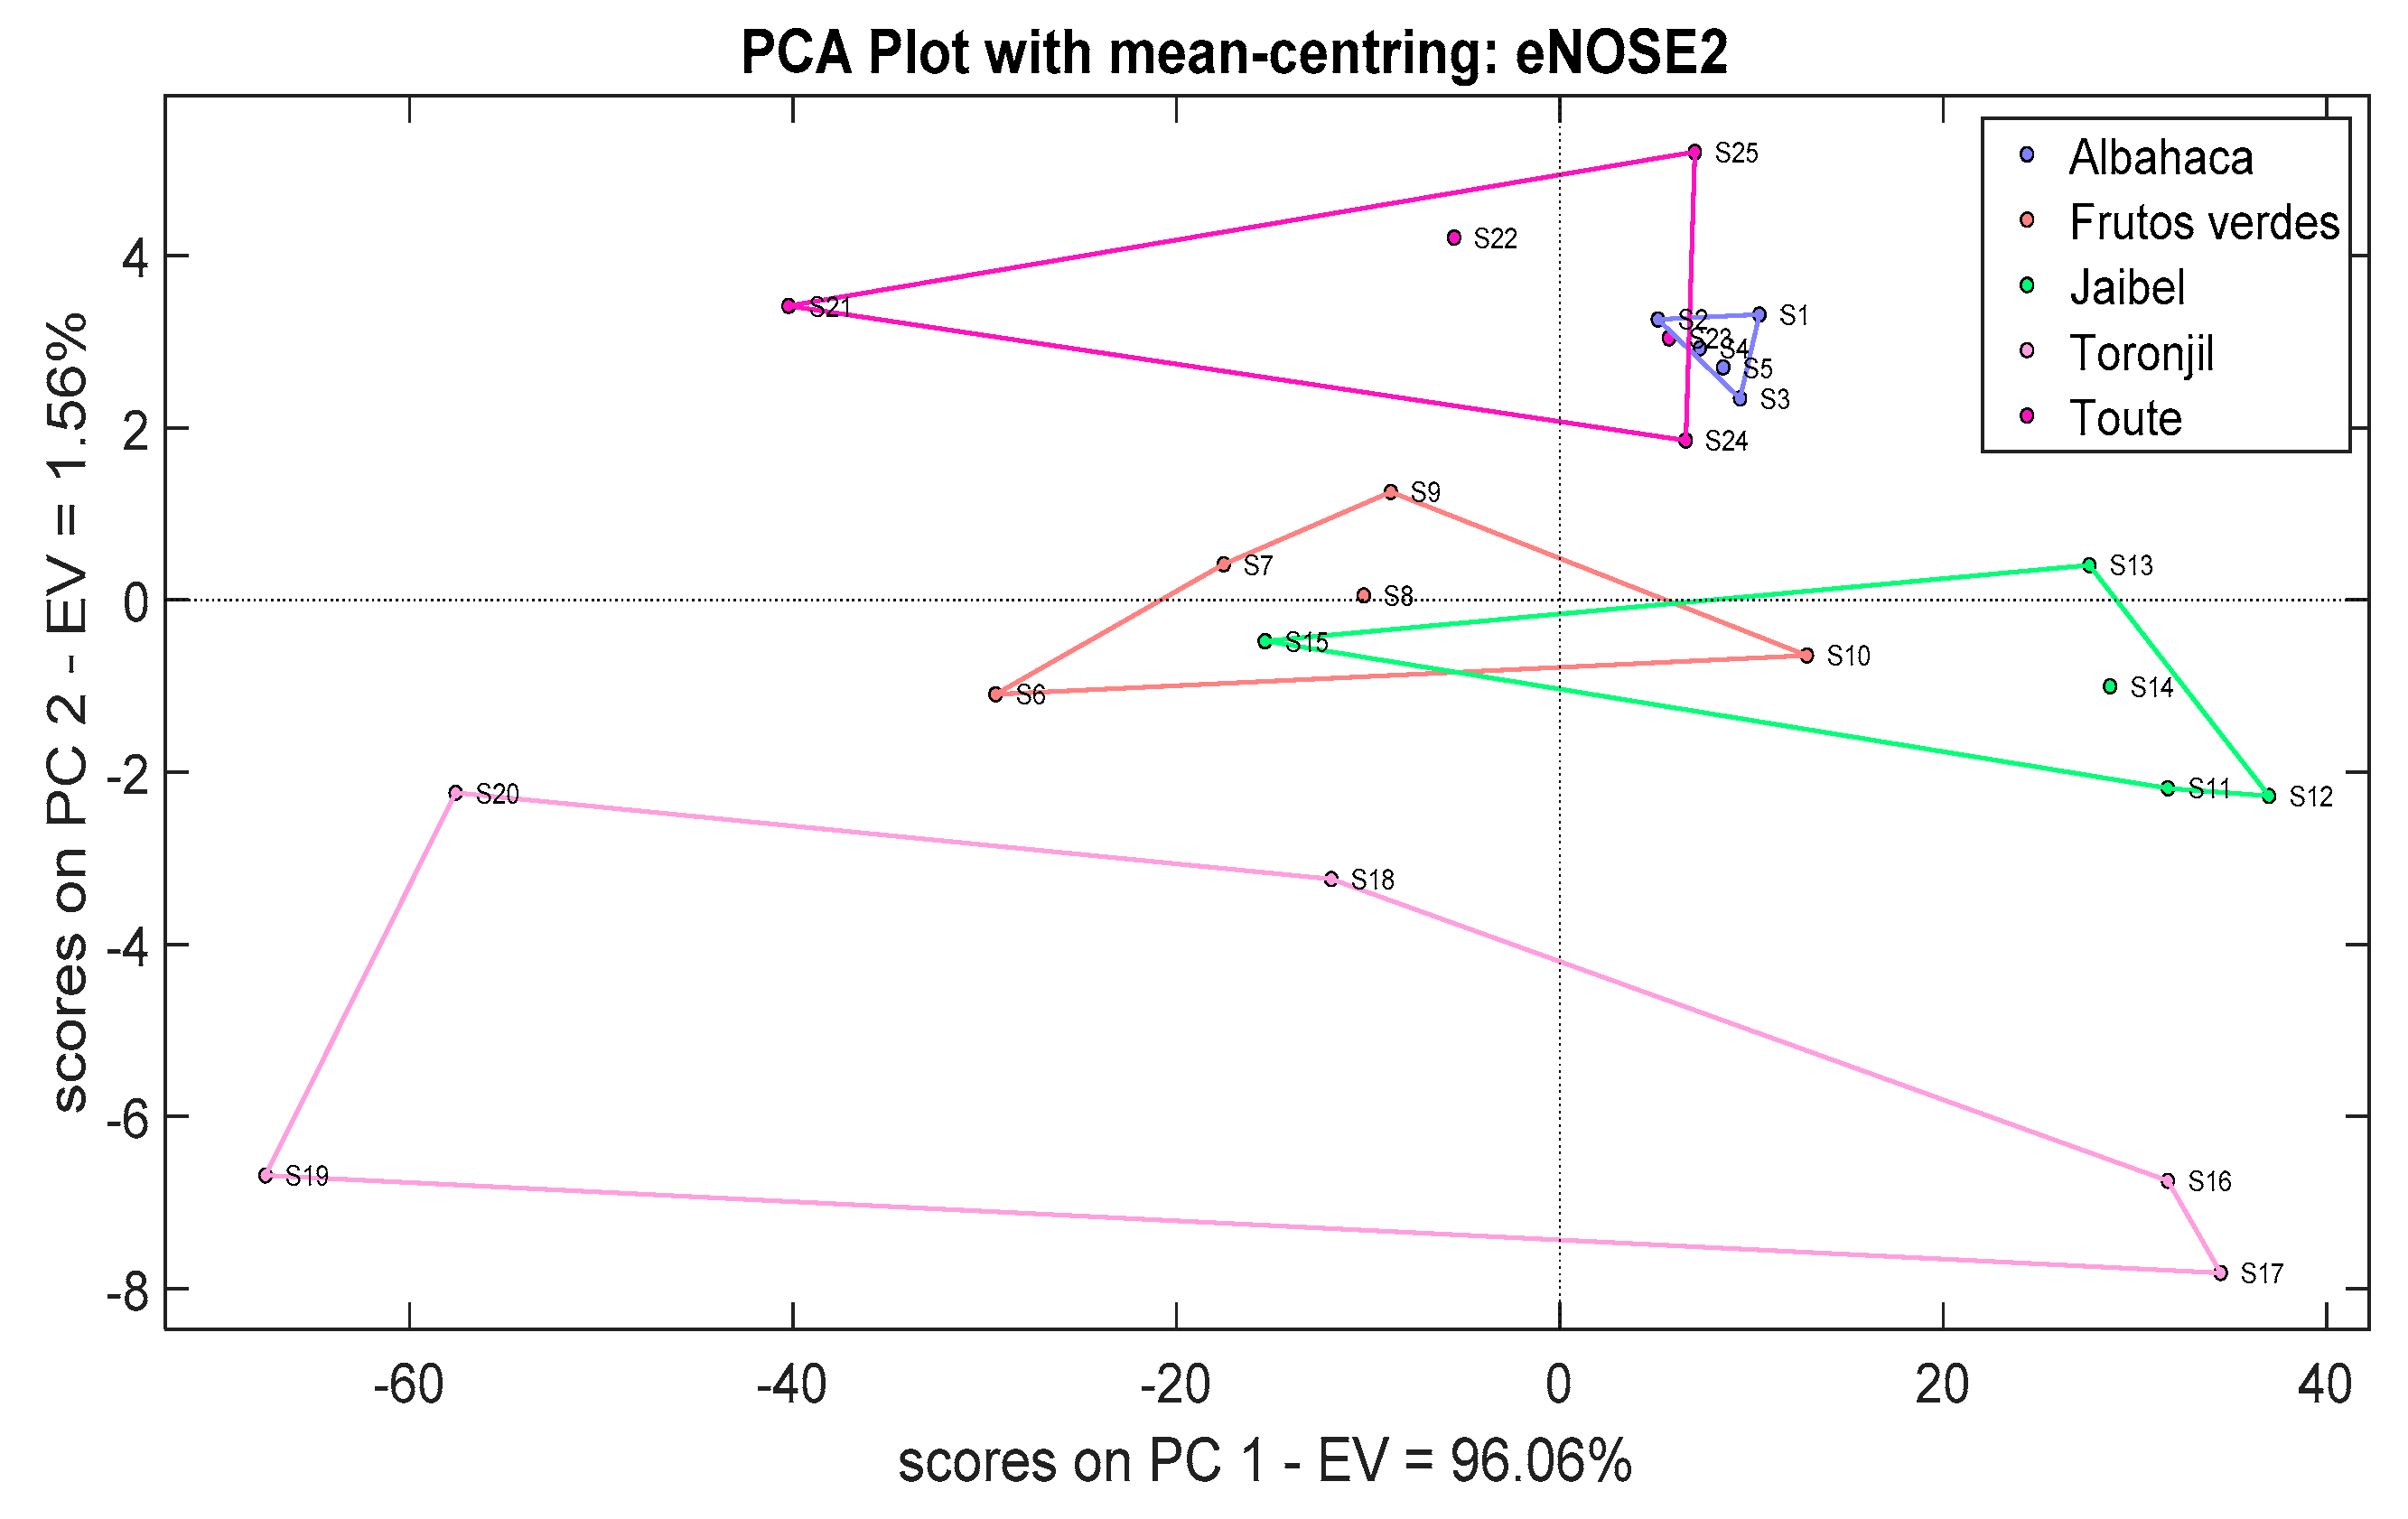
Figure 14 shows a PCA score plot for the eNose2 data using the mean-centering normalization method. Notice how there are five clusters as well, corresponding to each herbal tea, but there are slight overlaps between the
Frutos Verdes, and
Jaibel samples. Likewise, there were overlaps among the
Albahaca and
Toute samples.
Figure S6 shows the LDA method response used to classify the herbal teas through the eNose2 system.
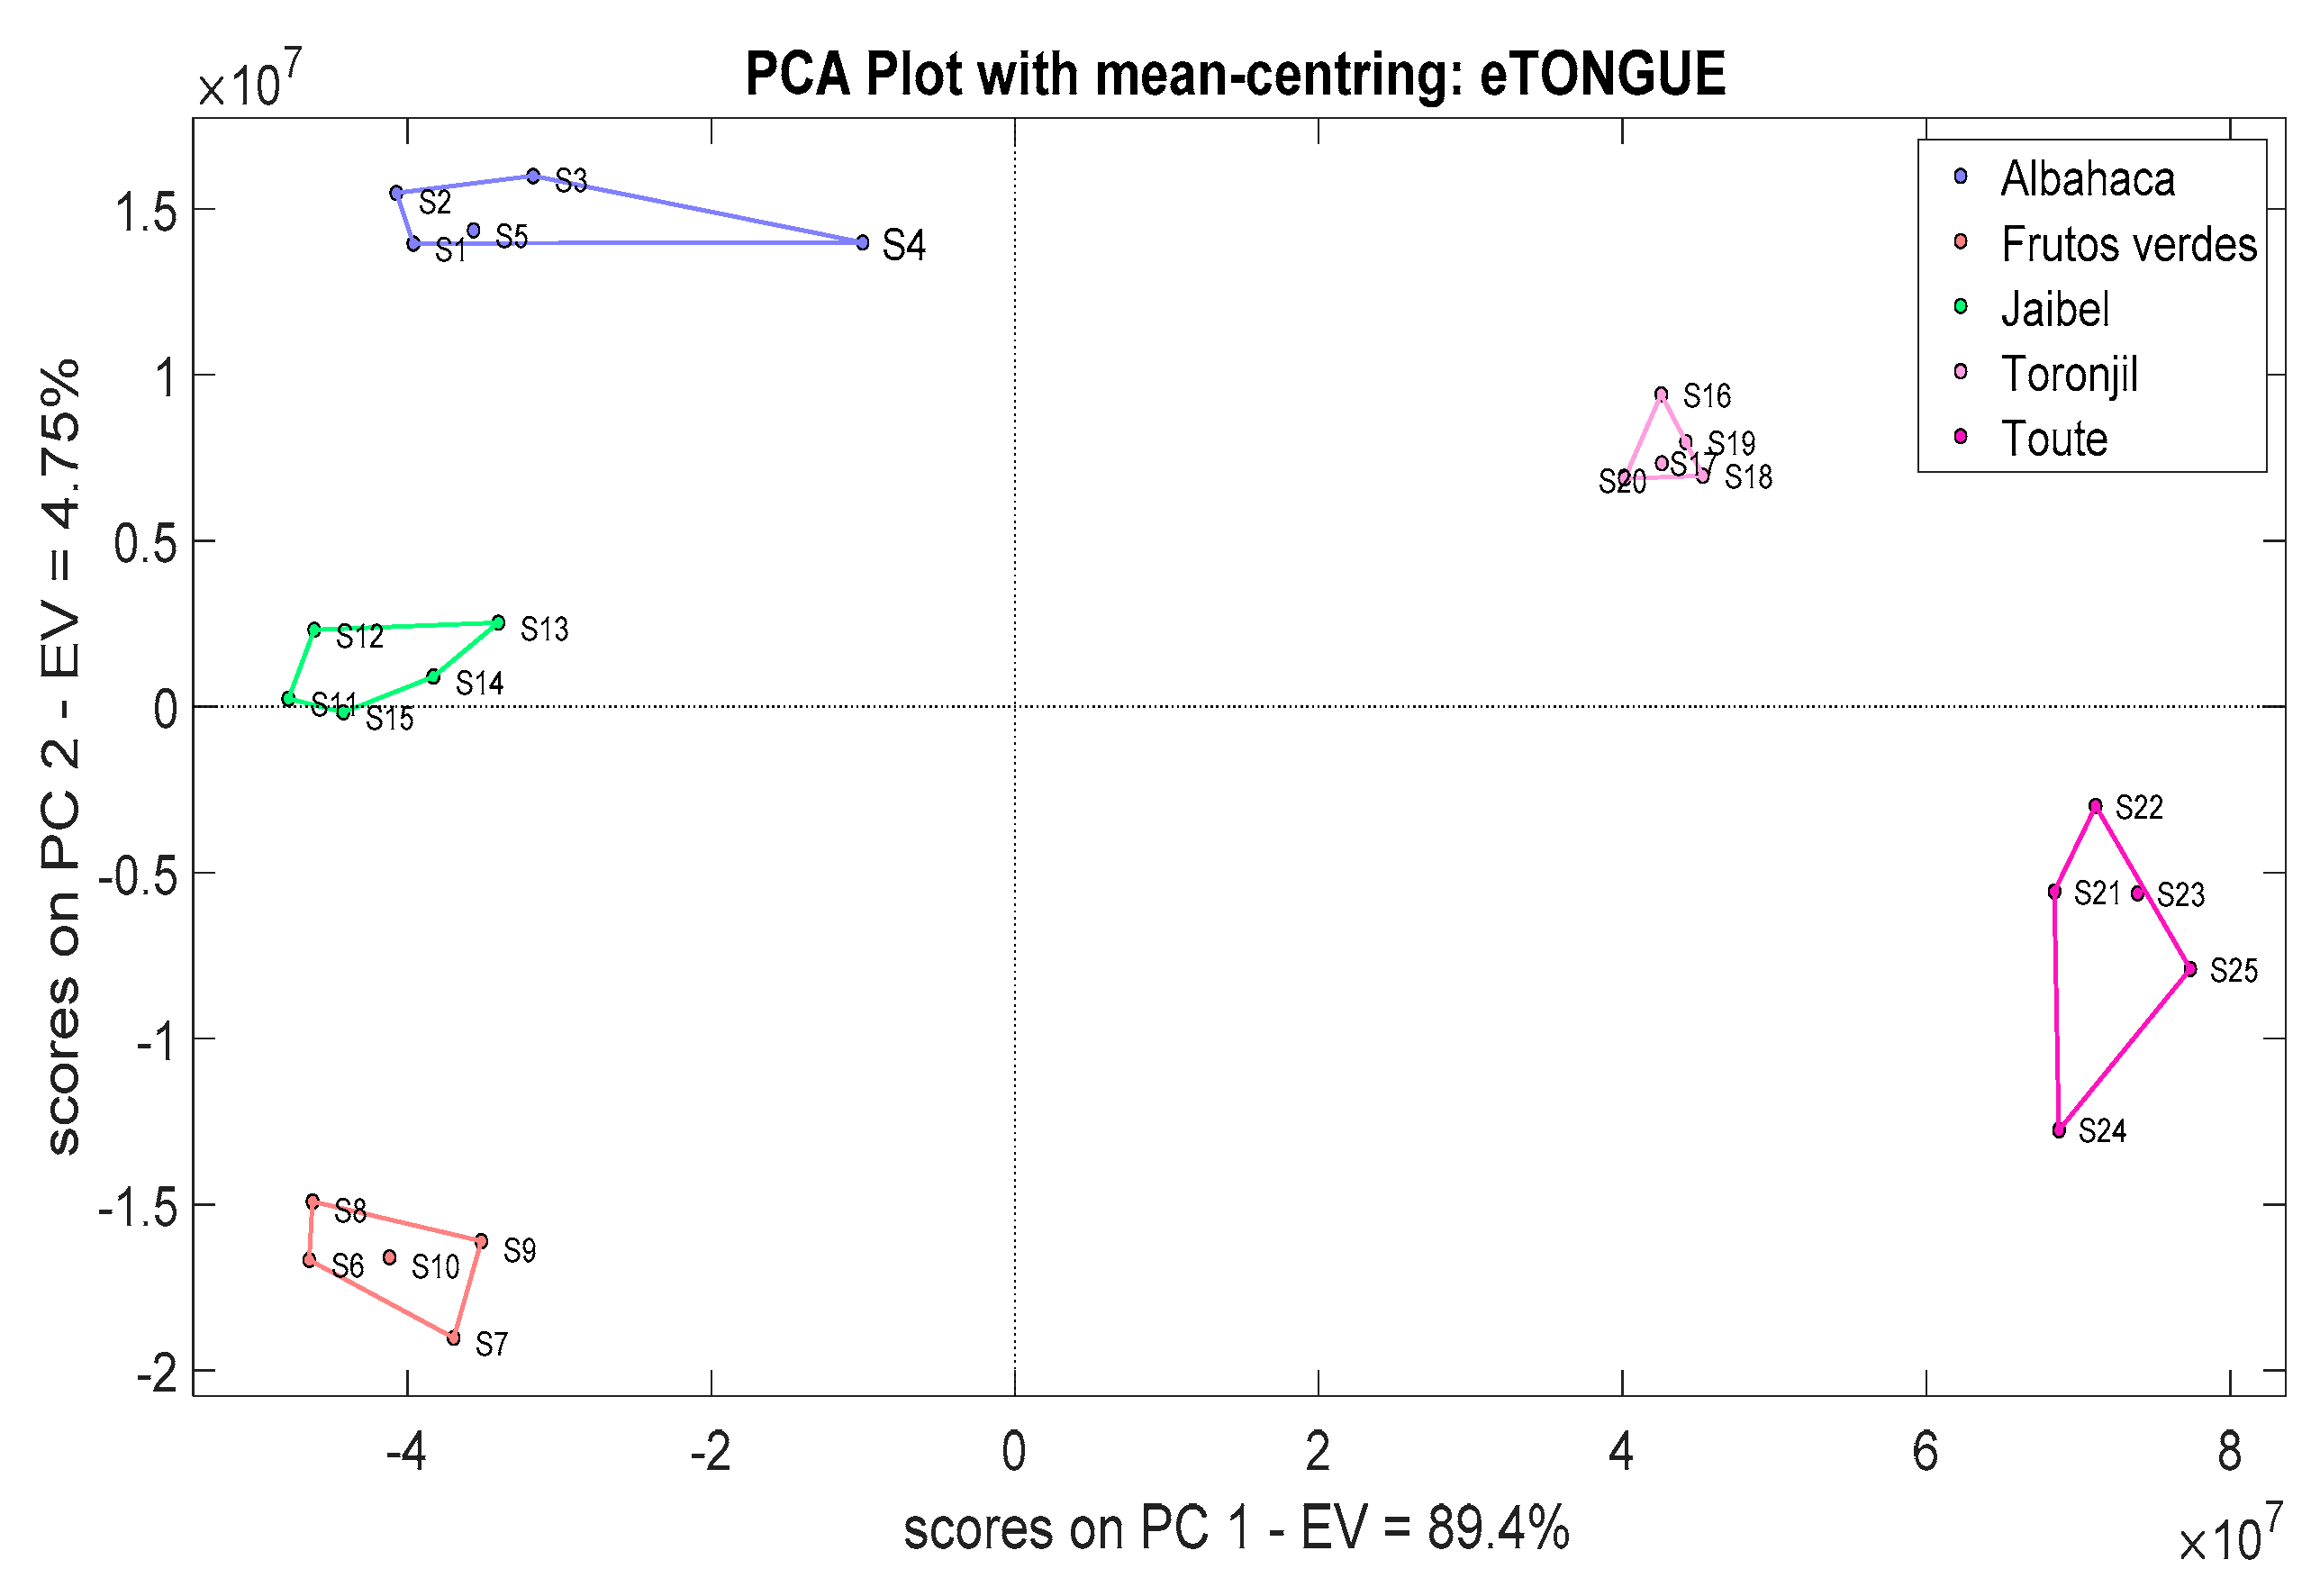
3.3. eTongue
Figure 15 shows the PCA plot for the eTongue system, thus showing five clear clusters as well. The correct discrimination was obtained from the electrodes AC1_101_R2 and AC1_102_R2 responses which were averaged previously.
Figure S7 shows the LDA method response used to classify the herbal teas through the eTongue system.
3.4. eEyes
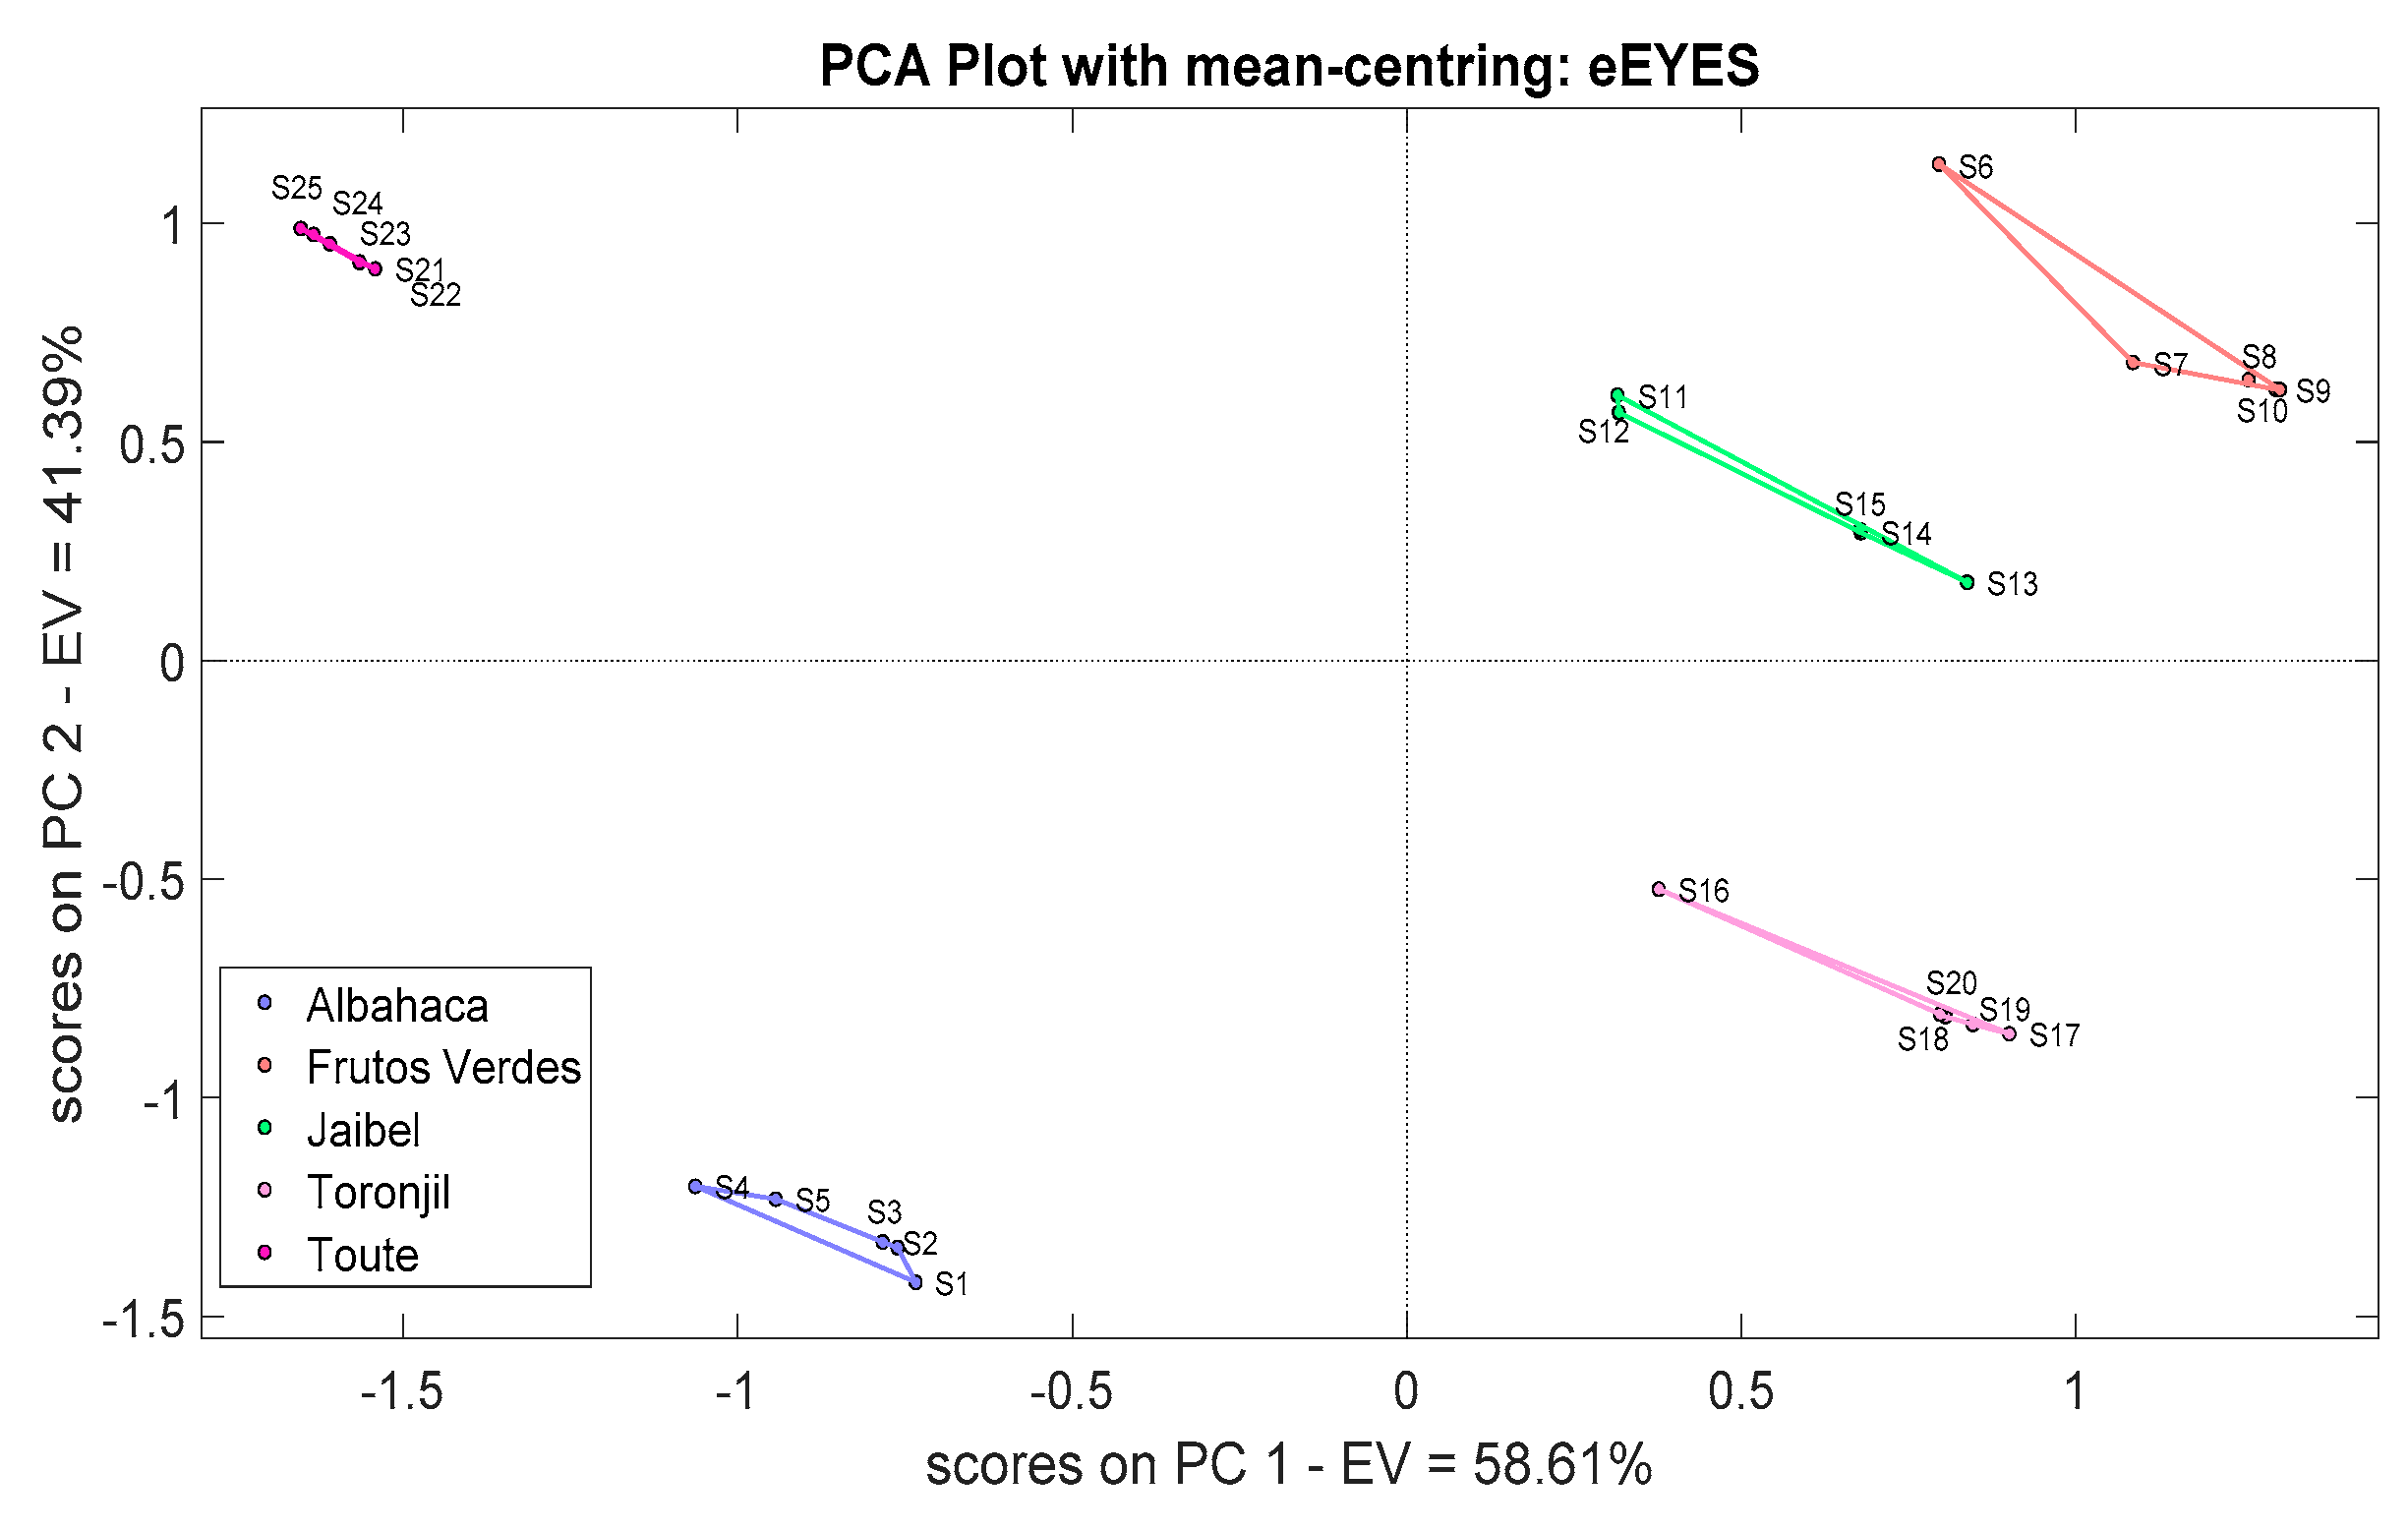
Finally,
Figure 16 illustrates the PCA score plot for the eEyes instrument. Once again, the plot shows five clearly marked clusters. In this case, three different sensors, such as S1.7, S2.0, and S2.5, were used to collect the data, and averages of four measurements were taken in order to acquire the most possible relevant information about the samples.
The PCA score plots for all instruments except eNose2 showed five independent clusters clearly discriminated. Thus, the machine learning algorithms should not have any difficulty in classifying the herbal teas in question.
Figure S8 illustrates the LDA plot used to classify the herbal teas through the eEyes.
3.5. Machine Learning Results
After applying the machine learning algorithms to the Colombian herbal tea data, the results are shown in
Table 6,
Table 7 and
Table 8. The accuracy parameter (ACC) was 100% for all four instruments; therefore, it is judged to be a good indicator of the quality of the data. kNN and SVM were tied as far as performance is concerned due to an ACC of 92% for eNose2 and 100% for the rest. The same was observed with NB and LDA, except that the ACC parameter for eNose2 was 76% and 72%, respectively, and 100% for the rest. The only algorithm that performed poorly was DT, with ACC in the range [60%, 68%].
Table 7 shows the performance metrics after applying the machine learning algorithms to the Colombian herbal tea data. One can observe that DT performed poorly in all of them, as was observed in
Table 6. Likewise, as was expected, kNN, NB, LDA, SVM, and RF performed excellently for eNose1 and eTongue, whereas for eNose2, only RF performed perfectly, while kNN and SVM obtained an excellent performance. The eEyes had a perfect performance under kNN, LDA, SVM, and RF, and an outstanding performance for NB. This confirms that at least one algorithm performed flawlessly for all the systems. That algorithm was RF.
3.6. Data Fusion
In order to evaluate the response of the sensory devices, data fusion was carried out from the information extracted from each one of the sensing devices. Therefore, the measurements acquired by the devices were used, which were previously normalized through mean-centering, and then principal component analysis was used to reduce the dimensionality of the data. Afterwards, all “scores” from each device were merged, where they were then applied as input to the machine learning algorithms. As shown in
Table 8, different supervised machine learning methods were applied using a random sampling, which was employed to split the data into training and validation sets in an 80–20% ratio, respectively, which yielded good performance in the classification of the samples by merging the data acquired by the devices. It should be clarified that the random split method can be used with class-balanced datasets, as there is an equal number of samples in every dataset category.
It is observed that the best response was obtained with the data fusion of the electronic tongue and the electronic eye, using which all of the cases obtained a 100% success rate in the classification of the data. Likewise, with the combination of the data from the rest of the devices, good results were achieved, confirming that in most of the data combinations, it is possible to obtain excellent percentages of success in the classification of the samples. In addition, the low contribution of the decision trees method in the classification of the samples is confirmed.
Figures S9–S16 illustrate the PCA and LDA responses used to discriminate and classify the herbal teas through the four devices using the data fusion method. It should be noted that this information was used to feed each machine learning algorithm where in most cases, the results yielded a 100 % success rate in the data classification.
3.7. Analysis of Volatile Organic Compounds in Colombian Teas Using HS-SPME Procedure and GC-MS
A total of 3.0 g of the commercial teas were transferred to a 20 mL headspace vial by Restek Corporation (Bellefonte, PA, USA). The vials were sealed using screw thread caps (18 mm) with microcenter TTFE/silicone headspace septa by Restek Corporation (Bellefonte, PA, USA). After the same duration of solid phase microextraction (SPME) analysis, each vial was incubated at 60 °C for 5 min, then an SPME fiber coated with 65 μm divinylbenzene/polydimethylsiloxane (DVB/PDMS) by Restek Corporation was exposed to the headspace of the sample for 20 min at 60 °C.
The volatile organic compounds (VOCs) of different Colombian teas on the coating fiber were analyzed using gas chromatography coupled to mass spectrometry (GC-MS; GC 7890B, and MS 5977A; Agilent Technologies, Waldbronn, Germany). GC-MS was performed using the following conditions: Desorption was conducted in the injection port at 250 °C for 10 min in splitless mode. An Agilent J&W HP-5MS Ultra Inert column with the dimensions 30 m × 250 µm × 0.25 µm, nonpolar column, (5%-phenyl)-methylpolysiloxane was used to separate and identifycompounds.
The carrier gas was 99.999 helium at a column flow of 1.0 mL/min. The initial GC oven temperature program was set to 50 °C, held for 5 min, and ramped at 3 °C/min to 210 °C, held for 3 min, and then programmed to 230 °C at 15 °C/min. The acquisition mode was operated full scan (from 35–550 m/z) and the solvent delay time was 3.0 min. The total run time was 65 min.
Identification of Volatile Compounds
The aroma compounds were identified using the National Institute of Standards and Technology (NIST 14). The data acquired by GC-MS was deconvoluted using Agilent Masshunter Workstation Software (version 7.0, Palo Alto, CA, USA) in order to obtain the identification of the best hit compounds by comparing the retention time of the spectrum and the NIST 14 library with a minimum match factor of 80% for all teas mentioned, except for albahaca using 70%. The integral data of all chromatographic peak areas were exported for mathematical analysis.
4. Discussion
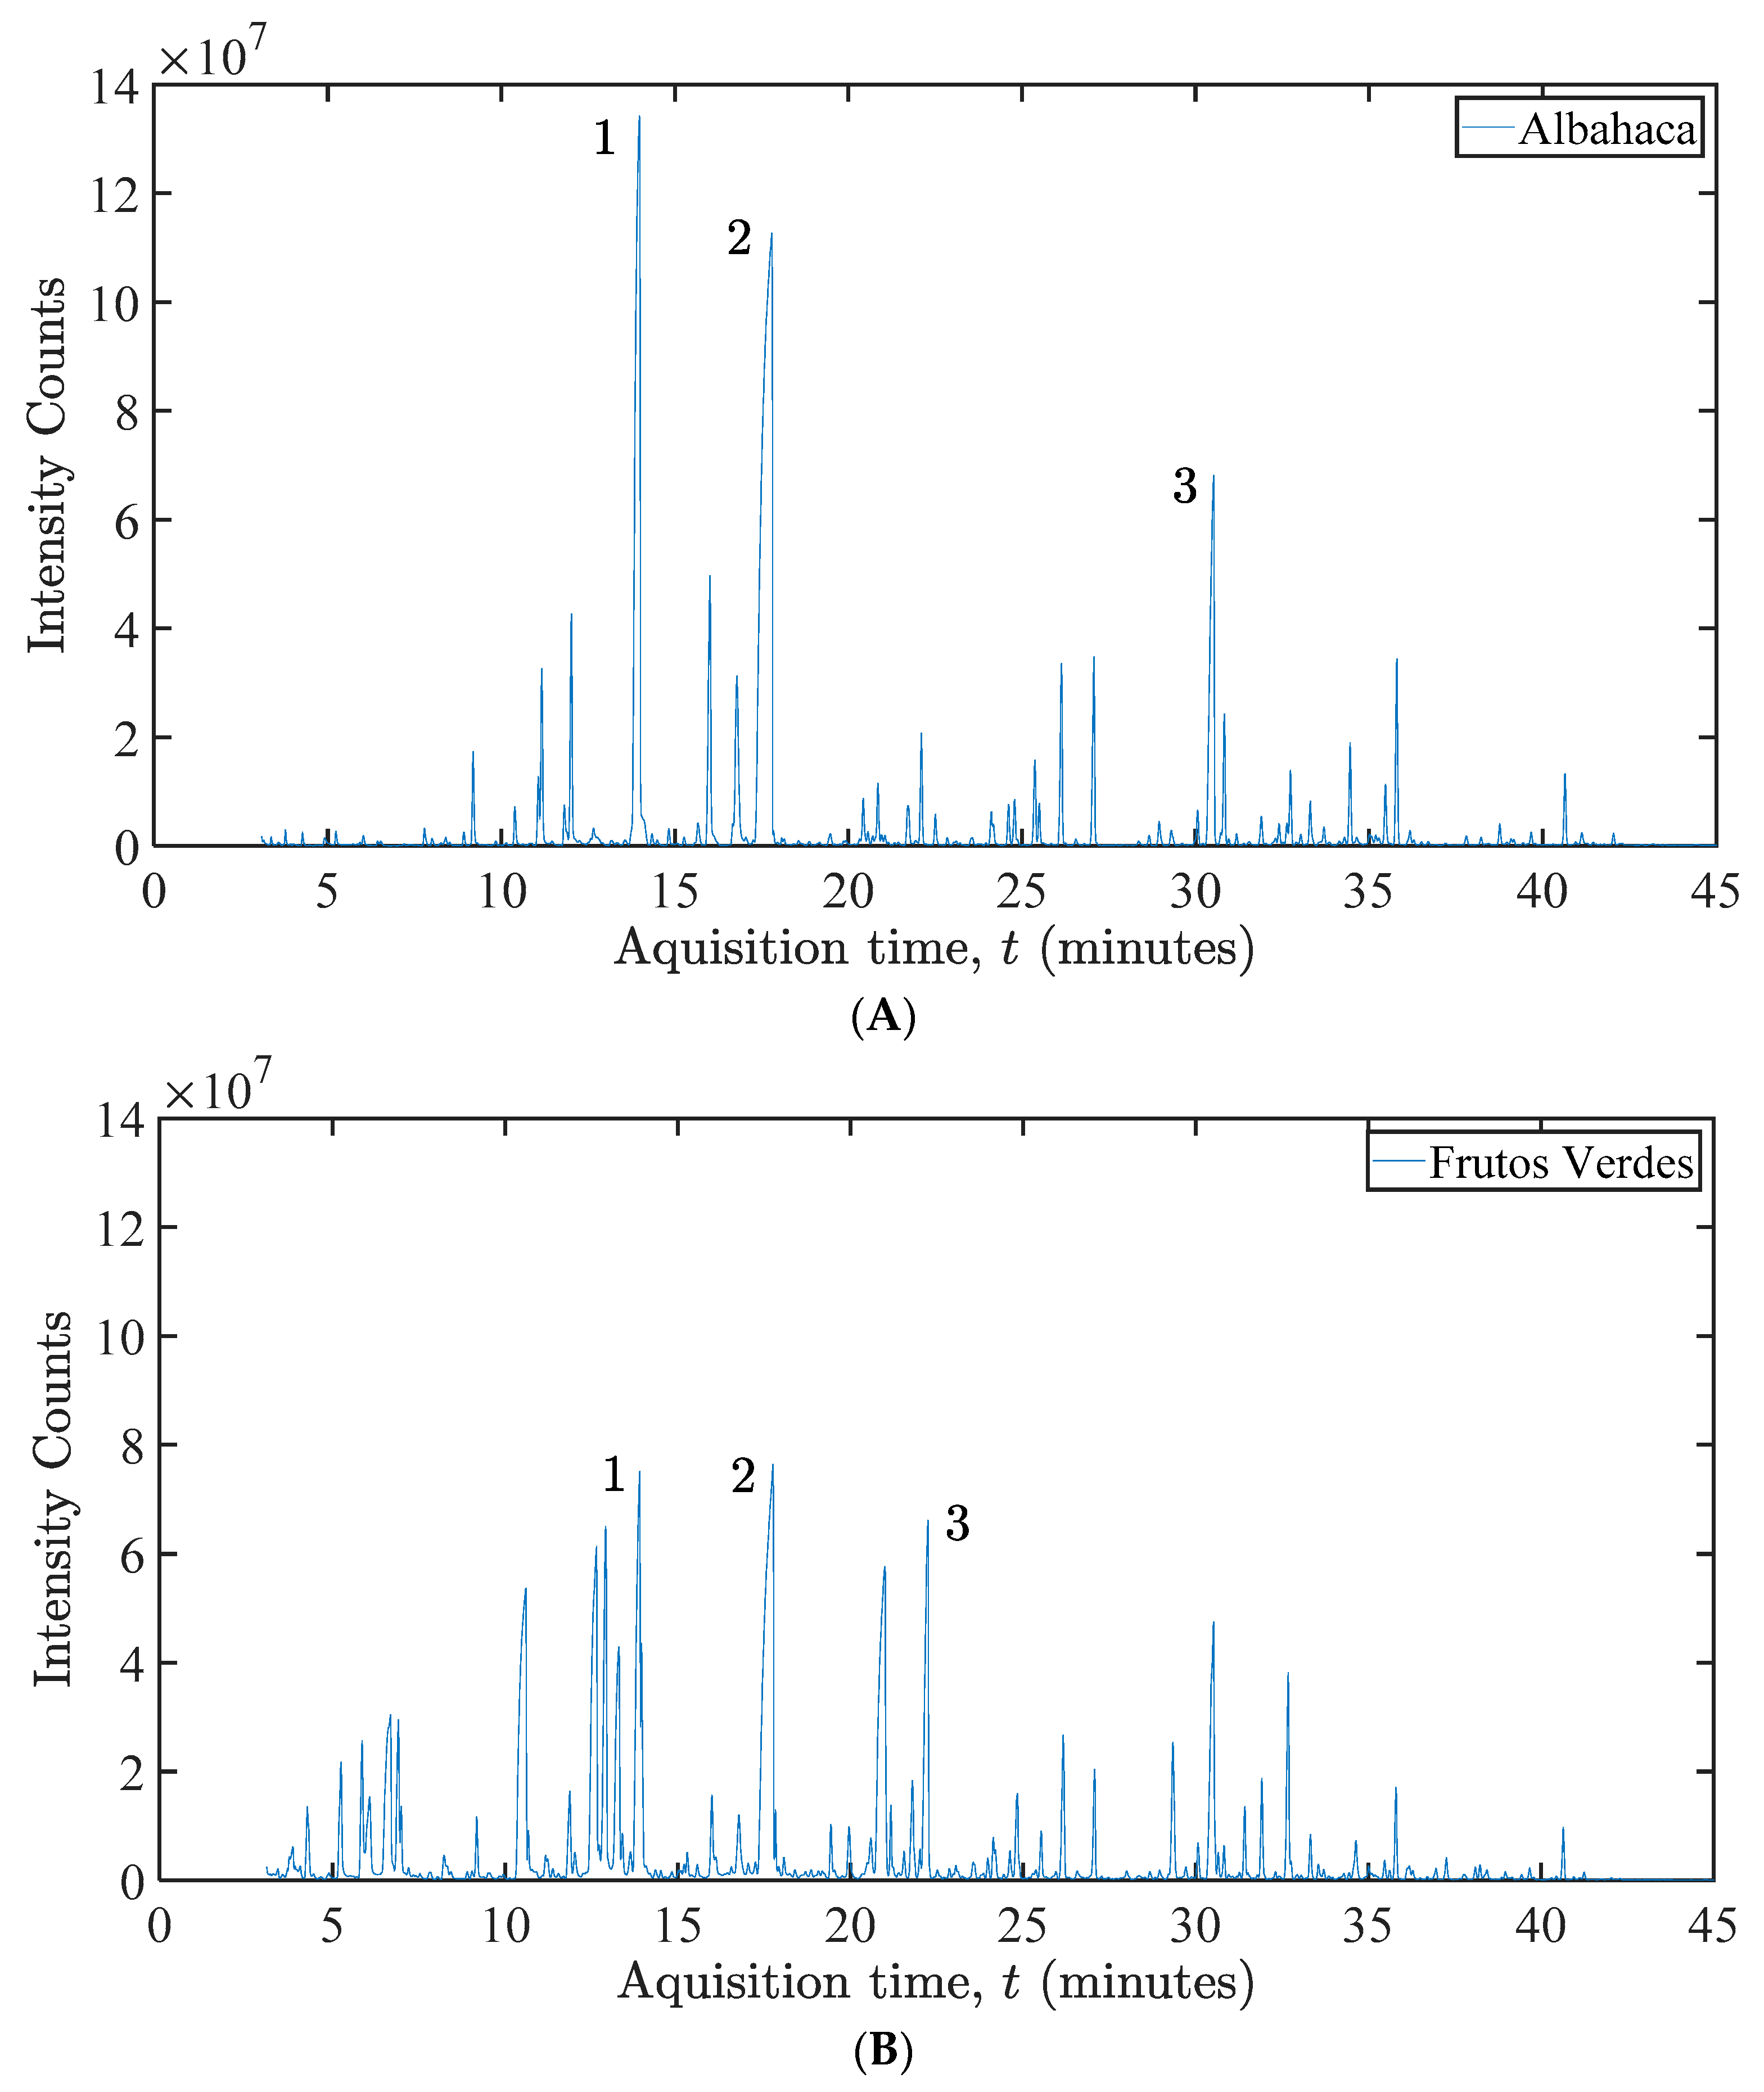
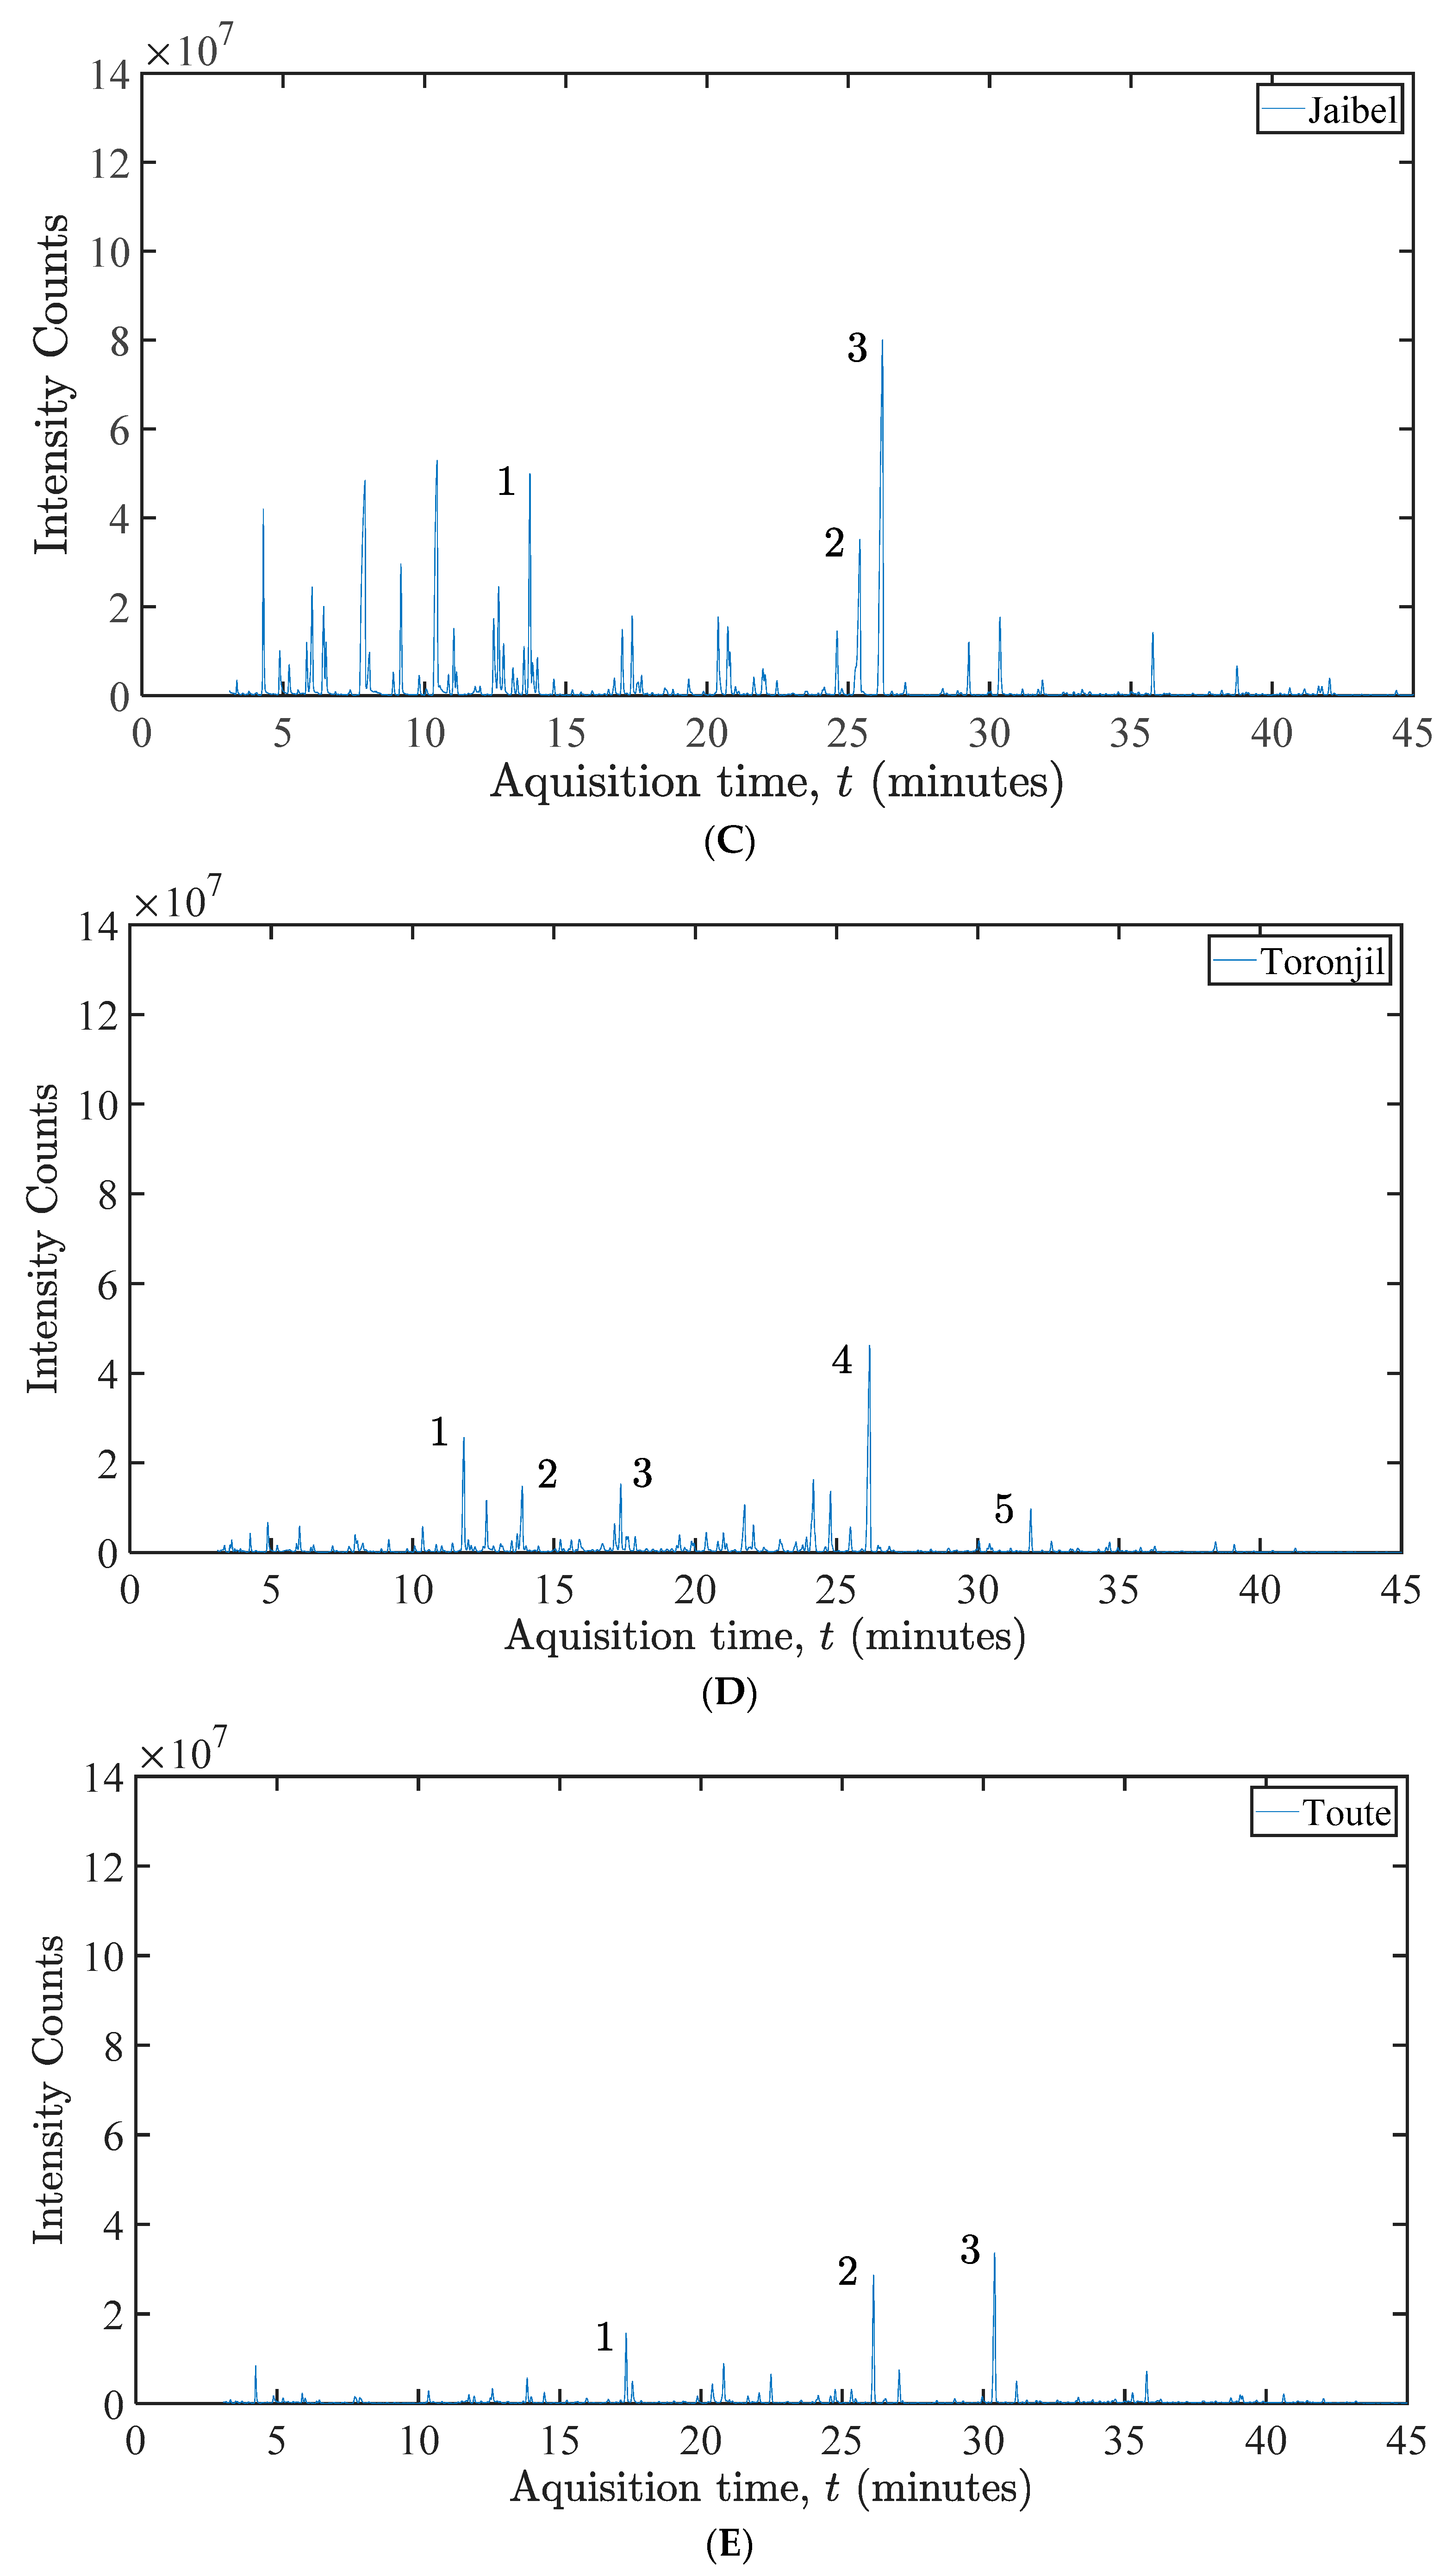
Headspace solid-phase microextraction (HS-SPME) coupled with GC-MS equipment was used to evaluate and detect the extracted compounds and identify the major constituents. In the commercial herbal teas, for Toronjil, 2136 peaks; Frutos Verdes, 2788 peaks; Toute, 2220 peaks; Albahaca, 2292 peaks; and Jaibel, 2209 peaks were detected. GC-MS chromatographic structuration was used to further assist in the identification procedures of the compounds. However, the peaks that could be identified with the best match hits corresponded to 161 peaks of Toronjil, 286 peaks of green fruits, 180 peaks of Toute, 473 peaks of Albahaca, and 187 peaks of Jaibel. Additionally, before considering the use of this high amount of chemical information provided by the HS-SPME-GC-MS, the assessment of possible extraction procedures must be evaluated, and to verify the main components, it is essential to prove them using standards.
On the other hand, the extraction procedure may be incorrectly assumed to be important chemical markers, providing misleading information. However, as this is just an exploratory analysis, the objective was only to differentiate the chromatographic profile of the herbal teas with the possible identification of some compounds. The preliminary, thus tentative identification of the majority of the constituents of the Colombian herbal teas is shown in
Figure 17.
The authors [
78,
79] identified compounds such as 6-methyl-5-hepten-2-one, linalool, and caryophyllene in Melissa officinalis (
Toronjil). Caryophyllene has also been identified in this tea species [
80]. Anethole was found in tea as
Toronjil,
Toute and
Jaibel. This compound is an aromatic compound widely used in the food industry with antioxidant, antibacterial, antifungal, anti-inflammatory, and anesthetic proportions [
81]. 2-ethyl-1-hexanol was one of the major constituents in the tzitzilché flower (Gymnopodium floribundum Rolfe) using HS-SPME and GC-MS [
82]. Linalool is also found in teas such as
Toronjil,
Frutos verdes and
Toute. It is a terpene alcohol found in many plants with a floral aroma [
83]. D-limonene was identified in tea as
Frutos Verdes and is considered the dominant contributor to the citrus aroma [
84]. Estragole was also a compound identified in
Frutos Verdes tea. However, it is an alkylating agent that may thus become a carcinogen, considering the toxic effect of its metabolites [
85]. To
Albahaca, 1,5,5 Trimethyl-6-methylene-cyclohexene was also identified in commercial products of
Chrysanthemun morifolium Hang-ju in different flowering and processing stages [
86]. The other two major compounds identified in
Albahaca would need to be further investigated, as there are not many reports in the literature. In
Jaibel tea, the major compounds identified were (C)-cinnamaldehyde, D-Limonene, and anethole found naturally in plants, which had anthelmintic activity evaluated [
87]. Teas can have several health benefits but also have some contraindications, such as estragole in high concentrations in
Frutos Verdes, as shown in GC-MS analysis. Therefore, it is important to know its composition and be attentive to the recommendations, according to the guidelines of nutritionists and physicians, to avoid exaggeration with high dosages/consumption and even intoxication and allergic reactions, among other symptoms.
Major compounds need to be confirmed using standards to compare retention time, peak area, and the mass-to-charge ratio of characteristic peaks to those identified in the deconvolution software. However, these exploratory analyses using HS-SPME-GC-MS showed different VOC profiles between the samples. This could explain the different clusters found in the PCA and LDA plots presented in the analyses and detected by E-senses systems.
The use of electronic technologies such as electronic nose, electronic tongue, and electronic eye are promising tools that have been used in different areas such as the health sector, pharmaceuticals, environmental contamination, and the food industry, especially to evaluate food quality control (e.g., maturation to harvest, raw material storage to packaging and consumption) by evaluating sensory characteristics such as smell, taste, and color. These systems are characterized by being relatively inexpensive and easy to operate, often requiring slight or no sample preparation, short analysis times, reproducible, portable, and can be used in situ. The data acquired from three instrumental techniques include the possibility of combining the information of the devices, where the final results will be a multisensory response of a certain food under analysis. However, this multisensory response is limited in identifying and quantifying specific chemical compounds, as conventional analytical techniques. Moreover, one way to obtain the chemical compounds for each instrument would be to perform calibration models of the previously identified species to predict them. Individually, the electronic nose presents disadvantages such as low sensitivity and specificity, as for the electronic tongue the disadvantages are the pretreatment of the samples (especially when the food is solid) and the short life of the sensor due to the absorption of food compounds; lastly, the electronic eye requires a controlled environment through constant exposure to light in a dark space to avoid interference from external sources.
5. Conclusions
This analysis was carried out in order to evaluate the operation and capabilities of three E-Senses systems and how they perform individually and combined using sensor fusion, to classify Colombian herbal tea brands.
The two electronic noses were composed of metal oxide gas sensors, where the eNose2 modulated the response of the sensors from a sinusoidal heater signal. Thus, the gas sensors were placed inside the sensing chamber, while the mainboard sits on the outside part of the lid, thus not in direct contact with the volatile organic compounds extracted from the sampling chamber and thereby avoiding contamination of the electronic components.
On the other hand, both eNose1 and eTongue obtained the best results in the individual analysis of the data and classification of the herbal teas; likewise, the system composed of eEyes yielded a good percentage success rate in the classification of the measures.
The machine learning method that obtained the best success rate in the classification was random forest, since in both cases, individually and by data fusion, it obtained 100% of data classification. However, the decision trees method did not perform well, confirming that random forest is a modeling technique much more robust than a single decision tree because it can generate overfitting, and it was not able to minimize the error due to bias and error due to variance. They aggregate many decision trees to limit overfitting as well as error due to bias and therefore yield useful results.
This opens up a wide range of possibilities to improve the classification of categories owing to the combination of different E-Senses, as it is possible to obtain better information from the data and response.
Despite the fact that lower performance was obtained in the classification using eNose2, future experiments must increase the measurement and recovery time in order to obtain more information from the data set and thus determine the saturation requirement of the sensor. In Reference [
57] a 30 min interval was used for both measuring and purging events using the eNose2, thus achieving a good classification rate. Likewise, in Reference [
58], the random forest algorithm gave the best performance.
The main justification for using three different devices, was to compare the responses of each of them and determine which one achieved the best performance in the classification of herbal teas. At the end, the best results were obtained with the electronic tongue and electronic eyes using the data fusion method.
E-tongues and E-noses systems have greater potential when integrated with other measurement systems, such as E-eye with a spectral analysis detector, image analysis, or chemical systems. Thus, each sense provides different information that could lead more variables or parameters to be used with data processing algorithms in order to increase the sensing capacity and accuracy.
With this preliminary study, subsequent studies could be carried out in other applications, ultimately leading to deciding which would be the best option in the detection and classification of a certain volatile compound (gaseous, liquid, and solid state).
The HS-SPME-GC-MS provided information on the different VOCs profiles and composition of the teas evaluated in this study, corroborating mainly with the results found in the analyzes of the eNose and eTongue systems.


 ,
, 


