Article

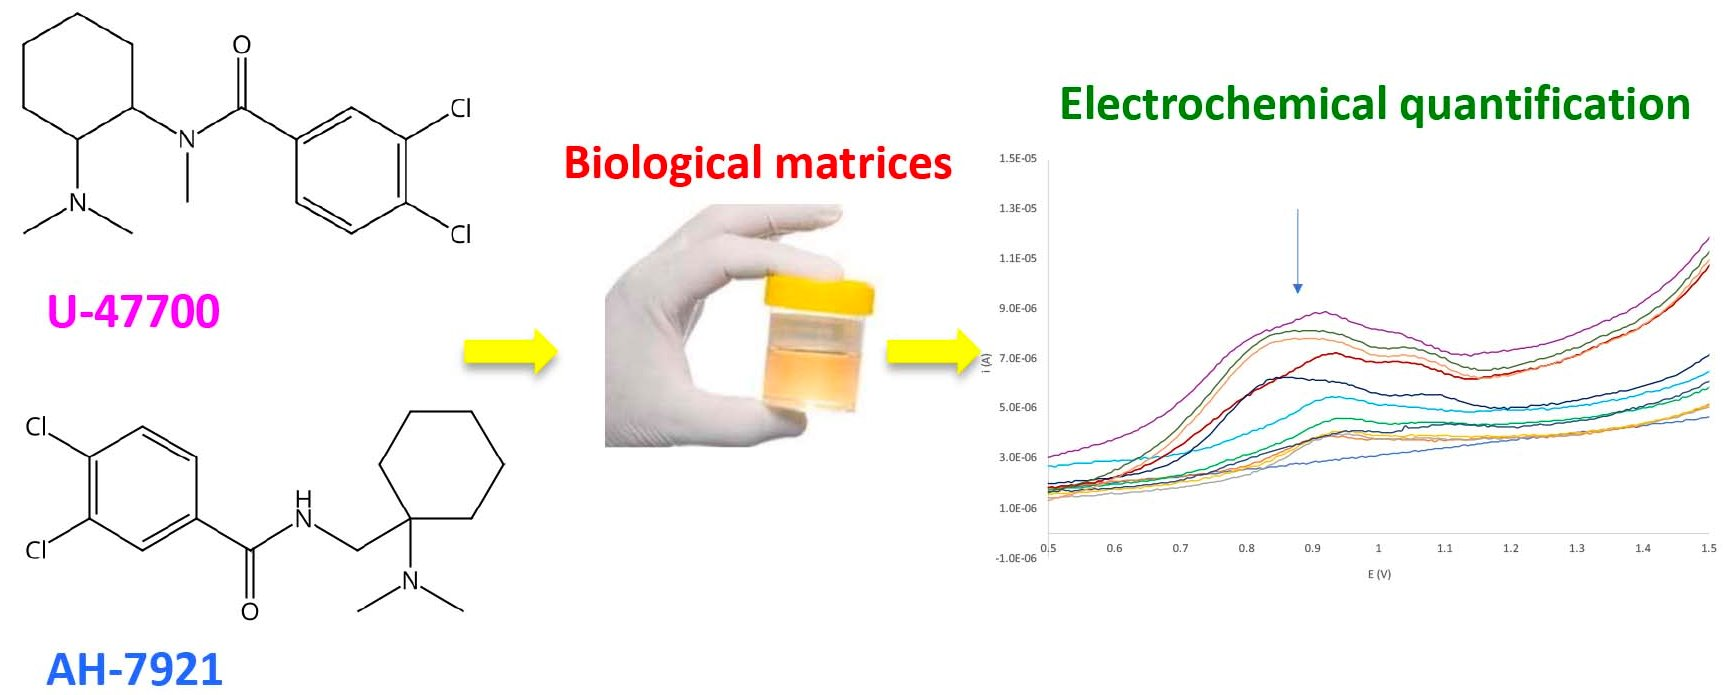
Electrochemical Behavior and Voltammetric Determination of Two Synthetic Aroyl Amides Opioids

1
Department of Chemistry, University of Pavia, Viale Taramelli 10, 27100 Pavia, Italy
2
PhotoGreen Lab, Department of Chemistry, University of Pavia, Viale Taramelli 12, 27100 Pavia, Italy
3
INFN Sezione di Milano-Bicocca, Piazza della Scienza 3, 20126 Milano, Italy
*
Author to whom correspondence should be addressed.
Chemosensors 2023, 11(3), 198; https://doi.org/10.3390/chemosensors11030198
Submission received: 20 January 2023 / Revised: 13 March 2023 / Accepted: 15 March 2023 / Published: 20 March 2023

Abstract

:
In the present work, we describe the electrochemical behaviour of two opioids structurally related to aroyl amides of forensic interest, namely U-47700 and AH-7921. The data obtained allowed for the mise-au-point of a voltammetric determination protocol, that relies on differential pulse voltammetry (DPV) at a glassy carbon electrode in ethanol/0.1 M lithium perchlorate/0.10 M 2,6-lutidine. To apply the method to the analysis of real samples (urines), a clean-up and a preconcentration strategy by solid phase extraction (SPE) using the adsorbent Florisil have been developed. LOQ of 0.2 μg·mL−1 in urine samples with an enrichment factor of 20 and linear range from 5 to 150 μg·mL−1 were obtained.

Graphical Abstract

1. Introduction

Opioids are a class of widely used essential medicines whose abuse could lead to tolerance and dependence, followed by physical and psychological effects, including analgesia, miosis, reduced gastrointestinal mobility, sedation, respiratory depression, anxiety, and, in extreme cases, especially when combined with other substances of abuse, death [1,2,3]. The global-scale diffusion of New Synthetic Opioids (NSOs) on the black market, due to the easy availability of these compounds, is seen with concern by the world community, and is overtaking the diffusion of natural and semi-synthetic opiates (e.g., morphine, heroin, oxycodone), which are more difficult to obtain [4,5].
Among the compounds emerging as substances of abuse, two aroyl amides (AMs, Figure 1), namely 3,4-dichloro-N-(2-(dimethylamino)cyclohexyl)-N-methylbenzamide (also known as U-47700) and 3,4-Dichloro-N-[[1-(N,N-dimethylamino)cyclohexyl] methyl]benzamide (AH-7921), are particularly of concern [3,6]. Such compounds, that bear both a tertiary amine and a 1,2-dichlorobenzamide moiety, have been discovered in the 1970s, later patented but never commercialized as analgesics, thus only few and limited clinical studies are available. However, their abuse is increasing and, considering their potential toxicity, complex multi-drug poisoning has been often observed in emergency rooms [3,6].
From a pharmacokinetic point of view, AMs are subject to phase I and phase II metabolism, but a significant portion of the administered drug can be found unmodified in urine and plasma, in concentrations ranging from 0.15 μg∙mL−1 up to μg∙mL−1 [4,7,8] depending on the dose taken—usually between 5 mg and over 10 mg—and on the consumer’s metabolic profile.
Due to their diffusion, the development of quick analytical methods able to identify these drugs either in seized specimens or in biological matrices is mandatory [7,8]. Recently, different strategies—mainly based on chromatography—have been proposed, including, among others, GC-MS [9], LC-HRMS [10], SPE/LC–ESI-MS-MS [11], LC-QTOF [12], LC-MS/MS [13,14,15,16,17,18,19,20], and UHPLC-MS/MS [21,22] (see Table 1). On the other hand, electrochemistry offers several advantages when compared to chromatographic methods, such as low-cost and portability, ease of operation, as well as good sensitivity [23], so that the interest in developing electrochemical methods able to quantify NSOs at low concentration (<50–100 μM) in biological matrices is growing [24,25].
In recent years, our group has focused on the design of smart analytical strategies for the determination in biological and synthetic matrices of substances of abuse, such as synthetic cannabinoids [26], glaucine [27], and Lysergic Acid N, N-Diethylamide [28]; based on our previous proposals, we presented herein the electrochemical characterization by cyclic voltammetry (CV) and exhaustive coulometry of U-47700 and AH-7921. The data obtained have then been exploited for the development of a differential pulse voltammetric (DPV) method to quantify the analytes in capsules as well as in urine samples. In the latter case, a preconcentration/clean-up step was also added, obtaining results comparable to those already reported by previously reported methods [3].

2. Materials and Methods

2.1. Materials and Reagents

An Amel model 4330 module equipped with a standard three-electrode cell (25 mL) was used for the voltammetric techniques (CV, DPV). The experiments were performed using a glassy carbon (0.04 cm2 geometrical area) working electrode, a Pt auxiliary electrode, and as a reference electrode, a Ag/AgCl/3 M NaCl. The described electrodes were purchased from BASi Electrochemistry. A 5-point Savitsky-Golay smoothing (included in Amel VA peak 2018 ver 6 software ) was applied when necessary to reduce the noise of the voltammogram.
Exhaustive coulometry, EC, was carried under nitrogen atmosphere using a single-compartment cell (10 mL, see Figure S1 in Supplementary Information) on a BASI PWR-3 power module equipped with three electrodes: a Ag/AgCl/3 Μ NaCl reference electrode, a Pt gauze working electrode, and a Pt wire as the counter electrode.
Standard solutions of the examined compounds used for the CV and DPV experiments were prepared by dissolving them in ethanol (1000 μg∙mL−1) and diluting with the same solvents to obtain less-concentrated standards, as needed. The chemicals employed for the preparation of U-47700 and AH-7921 were commercially available and used as received. Ethanol used as solvent in the electrochemical analyses was ACS grade, purity >99.8% (Carlo Erba, Milan, Italy).

2.2. Synthesis of Aroyl Amides U-47700 and AH-7921

Synthesis of 3,4-dichloro-N-[2-(dimethylammino)ciclohexyl]-N-methyl-benzammide (U-47700). The examined compound was prepared according to a procedure previously described in the literature (see Scheme 1) [29].
Step a. 3,4-dichlorobenzoic acid (1.13 g, 5.92 mmol, 1.5 equiv) was refluxed in thionyl chloride (7 mL) overnight. The excess of SOCl2 was eliminated under vacuum, and the resulting 3,4-dichlorobenzoyl chloride (I, 1.24 g, >99% yield) was used without further purification for the next step.
Step b. trans-N,N,N’-trimethyl-1,2-ciclohexandiammine (0.7 mL, 4 mmol) and triethylamine (1 mL, 7.2 mmol, 1.8 equiv) were dissolved in 50 mL anhydrous ethyl ether under nitrogen atmosphere, then a solution of 4-dichlorobenzoyl chloride (1.24 g, 5.92 mmol, 1.5 equiv) in anhydrous diethyl ether (10 mL) was added dropwise and stirred for 20 h. The solvent was evaporated under vacuum. The crude residue was purified by column chromatography over silica (hexane: ethyl acetate 7:3) to obtain 1.24 g of U-47700 (white solid, yield: 94%).
U-47700 1H-NMR (300 MHz, CD3COCD3) δ 7.69 (d, J = 8 Hz, 1H), 7.51 (s, 1H), 7.31 (d, J = 7 Hz, 1H), 3.37 (m, 1H), 2.85 (s, 3H), 2.64–2.58 (m, 1H), 2.28 (s, 3H), 2.08 (s, 3H), 1.83–1.69 (m, 2H), 1.29–1.19 (m, 2H). 13C-NMR (75 MHz, CD3COCD3) δ 170.1, 169.2, 140.1, 133.4, 131.9, 130.1, 128.0, 64.3, 55.1, 41.3, 40.8, 32.3, 27.8, 26.4, 23.1, 22.7.
Synthesis of 3,4-Dichloro-N-[[1-(N,N-dimethylamino)cyclohexyl] methyl]benzamide (AH-7921). The examined compound was prepared according to a procedure previously described in the literature (see Scheme 2) [30].
Step a. Synthesis of 1-cyano- 1-ciclohexy-dimethylamine. Methylammonium chloride (8.1 g, 0.120 mol) was dissolved in water (15 mL) and added one-pot to freshly distilled cyclohexanone (9.8 g, 0.099 mol), rapidly followed by the addition of potassium cyanide (6.8 g, 0.105 mol). The resulting solution was stirred at room temperature for 24 h. The obtained solid was filtered, washed with cold water (20 mL), and dissolved in dichloromethane (DCM, 15 mL). The DCM phase was washed with water (15 mL) and the aqueous phase was extracted with DCM. The organic phases were thus reunited, dried with Na2SO4, and the solvent evaporated at reduced pression. The resulting 1-cyano-1-ciclohexy-dimethylamine (II, colorless oil, 60% yield [31]) solidified at room temperature after few hours.
II: 1H NMR (300 MHz, CDCl3) δ 2.34 (s, 6H), 2.13–2.10 (m, 2H), 1.79–1.75 (m, 2H), 1.60–1.50 (m, 5H), 1.28–1.24 (m, 1H). 13C NMR (75 MHz, CDCl3) δ 118.7, 62.4, 39.7, 34.4, 24.4, 22.2.
Step b. Synthesis of 1-(aminomethyl)- 1-ciclohexy-dimethylamine chlorohydrate. (1-cyano-1-ciclohexy-dimethylamine (2.3 g, 15 mmol) was dissolved in dry ether (20 mL) and added dropwise under stirring to a suspension of LiAlH4 (1.2 g, 30 mmol) in dry ethyl ether (30 mL) under nitrogen atmosphere. The suspension was stirred at room temperature overnight and the excess of LiAlH4 was quenched by carefully adding 22.1 mL of 30% w/v NaOH solution followed by a further 5 mL of water. The organic layer was thus separated, dried over Na2SO4, and the solvents were evaporated under vacuum. The residue was then dissolved in ether (10 mL) and a HCl solution in ethanol (10% w/v) was added until complete precipitation of crude 1-(aminomethyl)-1-ciclohexy-dimethylamine hydrochloride, which was purified by recrystallization from ethanol/ethyl ether (III, yield: 65%, white needles) [32].
III: 1H NMR (300 MHz, CDCl3) δ 2.65 (s, 2H), 2.17 (s, 6H), 1.19–1.52 (m, 10H). 13C NMR (75 MHz, CDCl3) δ 77.4, 57.9, 42.5, 37.5, 28.6, 26.2, 22.1.
Step c. Synthesis of 3,4-Dicloro-N-[[1-(dimetilammino)cicloesil]metil]benzammide (AH-7921). 1-(aminomethyl)-1-ciclohexy-dimethylamine (250 mg, 1.6 mmol) and 3,4-diclorobenzoyl chloride (I, freshly prepared from 460 mg of 3,4-dichlorobenzoic acid, 2.4 mmol, and 3 mL of thionyl chloride as described for the synthesis of U-47700) were dissolved in 2 mL pyridine and kept under stirring at room temperature for 1 h. The crude AH-7921 was isolated, then recrystallized from ethanol/ethyl ether (colorless solid, 40% yield) [31].
AH-7921 1H NMR (300 MHz, CDCl3) δ 11.86 (bs, 1H), 8.96 (s, 1H), 8.31 (s, 1H), 8.13–8.16 (d, 1H, J = 9 Hz), 4.00–4.02 (d, 2H, J = 6 Hz), 2.78 (s, 6H), 1.95–1.98 (m, 2H), 1.78–1.81 (m, 3H), 1.59.1.63 (m, 4H), 1.59–1.60 (m, 1H). 13C NMR (75 MHz, CDCl3) δ 165.9, 136.1, 132.8, 132.7, 130.5, 130.4, 127.1, 77.1, 68.3, 38.5, 37.4, 27.5, 24.5, 21.9.

2.3. Glassy Carbon (GC) Electrode Pre-Treatment/Characterization

The GC electrode was mechanically cleaned using successively finer grades of alumina (from 1 μm to 0.05 μm), rinsed with HNO3 5%aq, and ultimately washed with water. The electrode was further electrochemically cleaned performing 15 CV cycles CV, in a 0.5 M H2SO4 solution, in the potential range Ei = 0.0 mV to Ef = +1400 mV, using a fixed scan speed (ν) of 200 mV∙s−1 [28,33]. The effective area of the electrode was measured by CV in a water solution containing 5.0 mM potassium hexacyanoferrate (II) and 0.1 M potassium nitrate as supporting electrolyte. The scans were performed in the potential range Ei = +200 mV to Ef = +800 mV, with a scan speed of 100 mV∙s−1 applying the Randles–Sevcik equation. [34].

2.4. Electrochemical Analyses

2.4.1. Number of Electrons Involved in the Electrochemical Processes

The number of electrons involved in the redox reactions was determined by exhaustive coulometry (EC, see Table S1 in Supplementary Information) [35,36]. According to the literature, the electrolysis was carried out on an ethanolic 2.5 mM solution of the target compound (10 mL) containing lithium perchlorate (0.1 M) and 2,6-lutidine (0.10 M); the experiment was stopped when the current was <5% of the initial value.
The potential to be applied was the one of the first voltammetric wave observed by CV (Ep values reported in Table 2) increased by +100 mV, to speed up the electrolysis and to compensate for the reduction in the concentration of the electroactive species during the experiment, which affects the potential needed as per the Nernst equation.
As the electrode used in the EC was a Pt gauze, we performed a CV experiment on a working Pt electrode. The potential measured and the waveform were comparable with the ones observed in the same conditions by GC, with a discrepancy <20 mV on the peak potentials.

2.4.2. Cyclic Voltammetry Measurements

These experiments, performed to understand the redox activity of the considered compounds, were performed in ethanolic solution of the analyte (2.5 mM), containing 0.1 M lithium perchlorate as supporting electrolyte and an excess (0.10 M) of a base (2,6-lutidine), that proved to improve the CV signals by favoring the deprotonation of the intermediates (see Scheme 3). A 0 V to +1.8 V and 0 V to +2.2 V range for U-47700 and AH-7921, respectively, was chosen. Different scan speeds were tested, from 10 mV∙s−1 up to 1000 mV∙s−1.

2.5. Electrochemical Determination of Aroyl Amides

A procedure based on DPV was developed for the quantification of the examined analytes. In a screening phase, a set of different solvents (acetonitrile, ethanol, N,N-dimethylformamide water) containing different supporting electrolytes, i.e., LiClO4, KNO3, and (nBu)4ClO4, according to the reciprocal solubility, was investigated; likewise, the effect of the presence of additives including water in non-aqueous solvents and hexafluoroisopropanol has been considered. In view of the results obtained, as a medium for the analysis a solution of LiClO4 (0.10 M) and 2,6-lutidine (0.10 M) in ethanol was selected. The organic base guarantees the exclusive presence of the analytes in their deprotonated form during the analytical procedure.
The DPV instrumental parameters were as follows: wave frequency 12.5 Hz, wave amplitude 50 mV, wave period 80 ms, wave increment 5 mV, Ei = +500 mV, and Ef = +1400 mV. Before analyses, the solutions were purged with a stream of nitrogen for 3 min. The standard addition method was used.

2.6. Evaluation of LOD, LOQ, and Statistical Parameters

LOD and LOQ were calculated from the calibration curves according to ICH Topic [35].
L O D = 3.3 S y / x m   LOQ = 10 S y / x m
where Sy/x is the residual standard deviation from the linear regression and m is the slope of the calibration curve.
The standard deviation is reported after the numerical value.
Interday and intraday precisions were calculated according to the same guidelines for LOD and LOQ. [37]

2.7. Analysis of Aroyl Amides Capsules

Capsules containing the considered drugs were prepared by mixing thoroughly in a porcelain mortar 10 mg of each active ingredient [3,37], 30 mg of calcium carbonate, and 70 mg of lactose, and grounding for 2–3 min to obtain a homogeneous solid suspension. For the analysis, the content of 2 capsules was placed in a beaker and was extracted with 10 mL ethanol by sonicating for 3–5 min The resulting suspension was filtered on a 2 cm diameter 0.22 μm syringe nylon filter (Whatman®, purchased from Merck KGaA, Darmstadt, Germany). An aliquot of the filtrate—typically 150 μL—was diluted with 10 mL ethanol containing the supporting electrolyte and 2,6-lutidine in the concentration already described and analyzed by DPV by standard addition method (see above).

2.8. Analysis of Aroyl Amides in Water Samples, Synthetic and Natural Urines

Water samples were prepared by spiking distilled water with the proper amounts of the drugs. Synthetic urine was prepared as previously described [27,34,38], and its composition is reported in Supporting Information (SI Section S5). To analyze water sample and urine, a clean-up/preconcentration step was needed before DPV analyses. We used the solid phase extraction (SPE, Richardson, TX, USA) technique, employing home-made cartridges assembled with 0.5 g Florisil set on a 3 mL polypropylene tube, and interposed between two polyethylene frits of 20 μm porosity (Sigma-Aldrich, St. Louis, MO, USA). As a reservoir to dispense the water/urine solution to the cartridges, a polypropylene syringe (50 mL) was used, connected to the SPE cartridge by a proper adaptor (Aldrich, code 57020-U).
The assembled cartridges were preconditioned by washing with ethanol (10 mL) and then water (5 mL) before use. The water or urine samples, whose volume ranged from 10 mL to 200 mL, according to the specific experiment, were spiked with the considered drugs at concentrations in the range 0.5 μg·mL−1 to 20 μg·mL−1. The solutions were then brought to pH = 6 by 10% w/v HNO3. At this point, to remove any possible solid precipitation that could clog the SPE column, the solutions were filtered toward a 2 cm diameter 0.45 μm nylon syringe filter. The clear solution was charged onto the SPE column, previously washed with 50 mL water at a flow rate of 1 mL·min−1, by using a commercially available manifold (Visiprep™ SPE manifold, Sigma-Aldrich, St. Louis, MO, USA) connected to vacuum, with a flux of 1.0 mL∙min−1. The drugs were eluted with 10 mL of a 0.1 M LiClO4 solution in ethanol (flow rate: 1 mL·min−1) and after the addition of 2,6-lutidine (0.10 M), they were analyzed by DPV as described. Recovery experiments were performed in triplicate.

3. Results and Discussion

3.1. Electrode Characterization

The GC electrode’s electrochemically active area resulted to be 0.051(3) cm2, which is in good accordance with the geometrical area and proof that the surface has low roughness.

3.2. Electrochemistry of the Examined Aroyl Amides

The number of electrons involved in the redox process was calculated from the charge Q consumed in the EC experiment. It needed 35 min at +1100 mV (for U-47700) and 65 min at +1200 mV (for AH-7921) to completely electrolyze the solution, consuming, respectively, 4.3 coulomb (U-47700) and 5.6 coulomb (AH-7921). Considering that we used 5 × 10⁻⁵ moles of substrate, we calculated that a one-electron process was involved (see Table S1). Obviously, the number of electrons per mole involved in the rate-determining step must coincide with this value (see in Figures S2 and S3 the comparison between the CV of the solutions before after the EC experiments).

3.2.1. Cyclic Voltammetry and Oxidation Mechanism

Among the various combinations of supporting electrolytes and solvents tested, the best results in terms of waveform and peak intensity were obtained using a polar protic solvent (ethanol) and a supporting electrolyte which combines a small cation (Li+) and an intermediate size anion (ClO4-) [35,36]. In fact, by using an aprotic solvent (such as acetonitrile or DMF), significant fouling is found from scan to scan, and the electrochemical signal is highly irreproducible (i.e., a change >20% in successive scans is found, see Figure S4), while when using tetrabutylammonium perchlorate as a supporting electrolyte higher background signals are obtained, as can be seen from Figure S4 in which results for AH-7921 are reported (the same behavior was observed with U-7700).
The results obtained with the two opioids at scan speeds from 10 mV∙s−1 up to 1000 mV∙s−1. (see Figures S5 and S6) are comparable to each other and are described below.
The CV curves showed a two-peak irreversible oxidation wave in the range 0 mV to +2000 mV for scan speed 50 mV∙s−1 (see Table 3 for details and Figure 2), with the first oxidation wave being well defined and the second one only poorly defined and with no re-reduction peaks. Results reported below relate to the first oxidation peak, unless otherwise specified.
The Ep vs. log ν graph was linear, thus suggesting that an electrochemical step (E) is followed by an irreversible chemical step (C) (see Table 3 and Figure 3) [22,28,39,40,41,42]. This assumption is confirmed by the “current function”, as described in the “Materials and Methods” section, which is flat, with a slope < 10−5 V·s−1 (see Table 2 and Figure 4 and Figure 5) [40]. Concerning AH-7921, the slope of the current function changes drastically for low scan speeds, meaning that in these conditions the rate of the chemical step is competitive with respect to the scan speed [43,44].
The redox process is diffusion-controlled and not limited by adsorption of the electroactive species or its products, as confirmed by the linearity of the log ip vs. log ν plot, that has a slope around 0.5 units/decade (See Figure 4) [27,29].
To clarify the EC mechanism, we performed CVs on model redox compounds related to the two opioids considered. First, we proved that amides (DMF) and an ester related to the target analytes (methyl 3,4-dichlorobenzoate) are not redox-active in the explored potential range (see Figures S2, S3 and S5 in Supplementary Information), leading us to the conclusion that the monoelectronic oxidation involves the tertiary aminic nitrogen (first wave in CV). To further confirm this, we evidenced that the CV of the two precursor amines 1-(N-aminomethyl)-1-ciclohexy-dimethylamine and trans-N,N,N’-trimethyl-1,2-ciclohexandiammine showed a first peak congruous with those observed with AH-7921 and U-7700, respectively, that can be unambiguously assigned to the tertiary amine moiety [43,44,45,46]. Along with these two compounds, further oxidation peaks were observed and can be attributed to the oxidation of the secondary amine moiety and to the further oxidation of the degradation products formed after the electron transfer [44].
The presence of a base (2,6-lutidine) had a significant effect on the oxidation peak definition and intensity of the two opioids but not on their position, as expected for an E step followed by the loss of a proton [47,48].
The described results along with literature data [24,45] lead us to propose the redox mechanism reported in Scheme 3 for U-47700. According to this view, the one-electron oxidation of the aminic N of the analytes (Ep1, path a) leads to the formation of the radical cation intermediate I•+, followed by a chemical step, identified as a deprotonation (path b) to form the α-amino radical II. The further oxidation of this intermediate [49] (Ep2, path c) afforded iminium ion III+ and accounted for the second voltammetric wave observed in the voltammogram. Once formed, III+ can undergo different competitive degradation pathways, among which are the addition of the nucleophilic solvent [50] and hydrolytic processes where the formation of an aldehyde prevails [43]. Analogues processes are involved with AH-7921.

3.2.2. Cyclic Voltammetry Plots

Plots of the CV data—namely, peaks potential (Ep) vs. log ν (see Figure 3) [51,52], log ip vs. log ν (Figure 4) [53,54]—were done to further understand the redox mechanism. Moreover, to assess if the electrochemical processes were limited by adsorption or were diffusion-controlled, current intensity (ip) was plotted vs. the square root of the scan speed (ν1/2) (see Figure 5) and vs. scan speed (ν), Finally we plotted log i vs. log C (μg∙mL−1) (Figure 6) and ip∙ν−1/2 vs. ν (Figure 7).

3.2.3. Determination of  E °

As the electrochemical processes involving the studied compound were proved to be irreversible in the described conditions, an accurate determination of the formal potential is not possible, nevertheless it can be roughly estimated by using the Ep vs. ν graph, as E ° corresponds to the value of Ep extrapolated on the vertical axes at ν = 0 [27,50]. Estimated  E °  values are reported in Table 2. Values found are around +1000 mV, in agreement with the oxidation potential of tertiary amines [44].

3.2.4. Determination of the Charge Transfer Coefficient (α)

As is already known [39], α can be estimated via the Tafel slope, indicated as b in Equation (1), and obtained by the already described CV experiments from the Ep vs. log v plot.
b = ∂Ep/∂logν = 2.303RT/αnαF
By substituting the values of T, R, and F, and taking into consideration that from literature data and our coulometric experiments the number of electrons involved in the rate determining step (nα) is equal to 1 [35,36], Equation (2) can be obtained from which α can be directly calculated. The calculated values of α for the two opioids are comparable and around 0.7, as reported in Table 2. These values are consistent with irreversible redox processes in which the curves describing the activation energy barrier are not symmetric [55,56].
α = 0.059/b

3.2.5. Determination of the Diffusion Coefficient (D)

The already described CV curves can be used to evaluate D (cm2∙s−1) from the slope of the graph ip vs. v1/2 applying the modified Randles–Sevcik equation for irreversible processes to the first oxidation peak, according to Equation (3) [55,56]:
i p = 2.99 · 10 5 n 1 α 1 / 2 A C D 1 / 2 v 1 / 2
where A is the electrode area (cm2), n is the number of electrons involved in the redox process (n = 1), ip is the peak current (Ampere), [34] α is the charge transfer coefficient described above, [C] is the concentration of analyte (chosen as 5 × 10⁻⁶ mol∙cm−3 in the present case), and ν is the scan speed (V∙s−1).
In our experiments, we found diffusion coefficients in the range 10−5 cm2∙s−1 and 10−6 cm2∙s−1 (see Table 2), in line with literature data for compounds of similar size and polarity [34].

3.2.6. Determination of the Kinetic Constant K°

Matsuda and Ayabe’s equation (Equation (4)) can be used to calculate the value of K° when irreversibility prevails [39,50]:
E p i r r e v = R T a n α F 0.78 l n K ° f r e d D 1 2 + 1 2 l n α n α F v R T
where f r e d is the activity coefficient that can be approximated to 1, and the other symbols have the usual meanings reported above. Peak potential (Ep) is expressed in V.

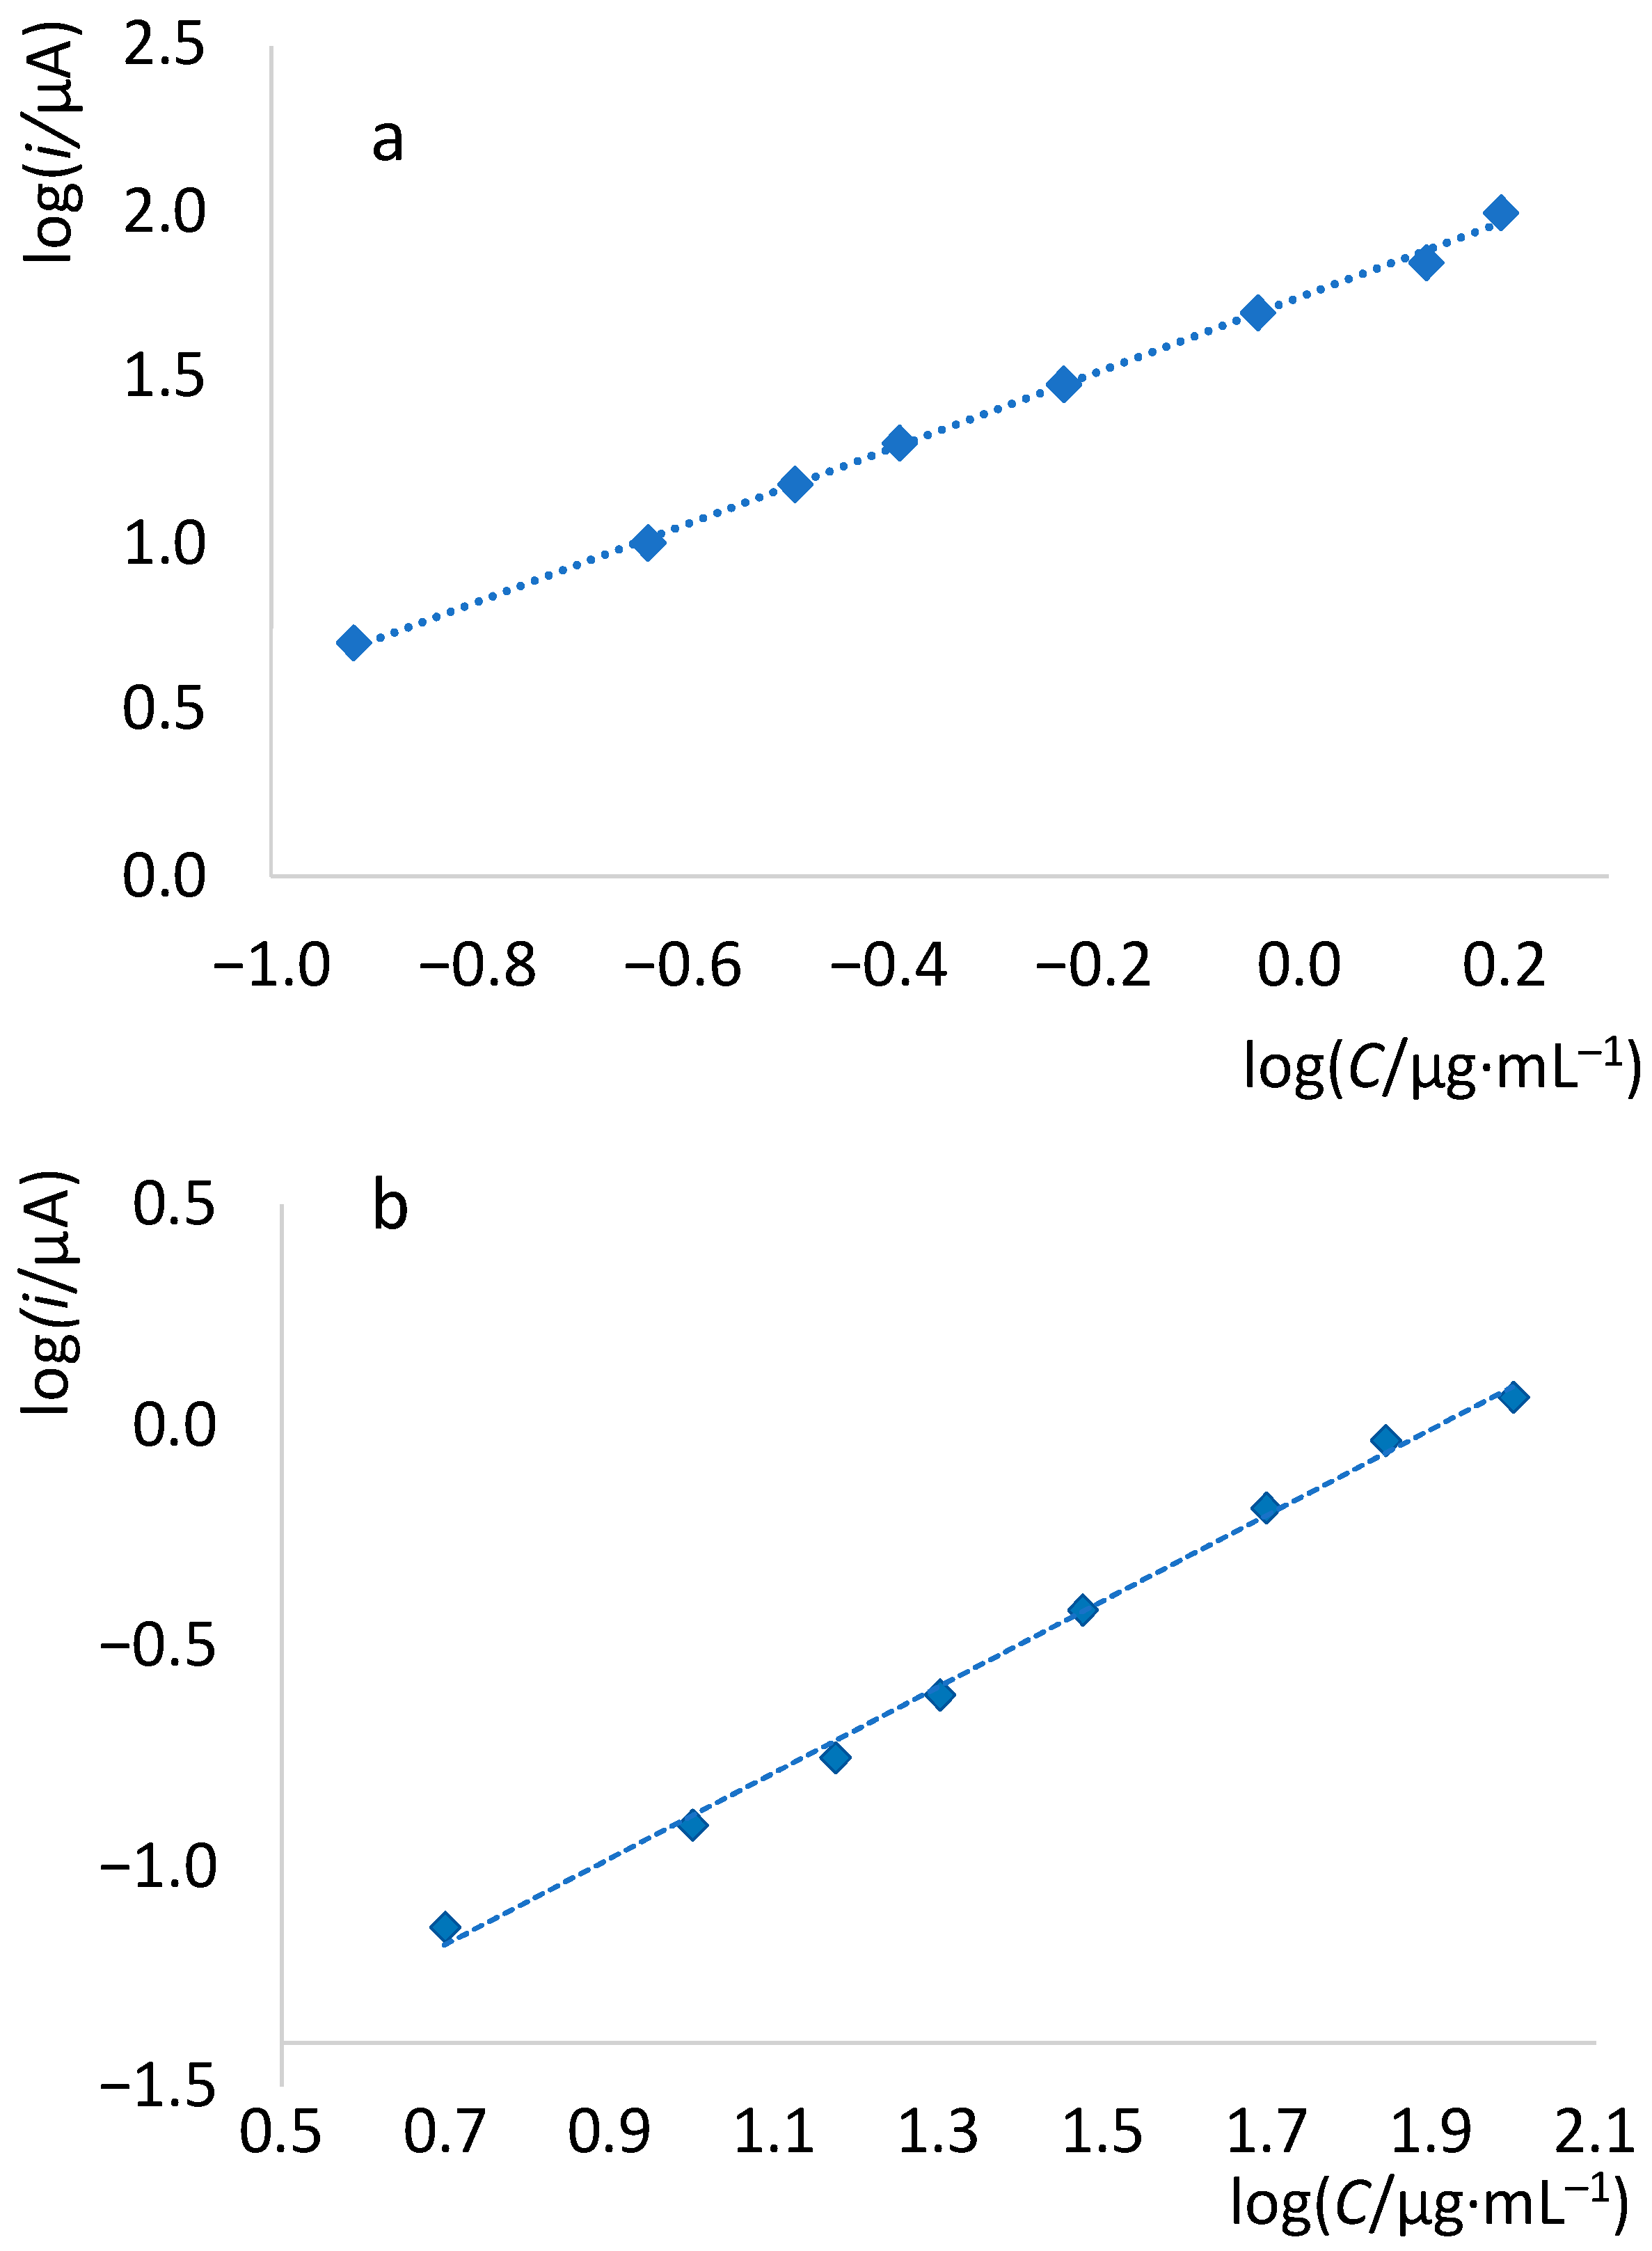
3.2.7. Determination of the Reaction Order

Differential pulse voltammetry (DPV) was used to evaluate the reaction order, using the experimental conditions described in Section 2.5 regarding the analytical determination of the drugs. The curve log ip vs. analyte concentration [26,35,36], in the 5 μg∙mL−1 to 150 μg∙mL−1 concentration range (eight data points), was constructed, and its slope was used for the evaluation of the reaction order.
The reaction order for the two opioids was one (see Table S1 in Supplementary Information). These data helped prove the reaction mechanism (Section 3.2.1) and showed that no dimerization of the intermediates occurred.

3.3. Electrochemical Determination of Aroyl Amides

When shifting from CV to DPV to develop a quantitative analytical method, we found that in the considered oxidation potential range the two opioids showed two peaks, the first one of both analytes was used for the quantitative determination. Concerning U-7700, the second peak, it appeared only at higher concentrations of the analyte (>100 μg∙mL−1).
Linearity was found with concentrations of the opioids ranging from 5 μg∙mL−1 up to 150 μg∙mL−1 (see Figure 8, Figure 9 and Figure 10 for the calibration curves). Details concerning the parameters associated with the DPV method are presented in Table 4. LOD and LOQ, calculated from 10 data points calibration curves, were 0.2 μg∙mL−1 (LOD) for both opioids and 0.5 μg∙mL−1 for AH-7921 and 0.6 μg∙mL−1 for U-47700 (LOQ). The voltammograms for the two compounds are reported in Figures S8 and S9. The considered redox process is irreversible and characterized by the exchange of a proton. These phenomena are responsible for a change in the peak potential by changing the concentration of the substrate (visible in the calibration curves reported in Figure 8, Figure 9, Figure S8 and Figure S9). We think that the reason for why the phenomena are much more evident with U-47700 with respect to AH-7921 resides in the different kinetics of the redox process (as evidenced by the values reported in Table 2 and by the fact that the ΔE between the first and second peak is 200 mV in one case and 320 mV in the other).
As the voltammetric peaks of the two compounds have barely different potentials, we explored the possibility of determining one in the presence of the other. As can be seen from the voltammograms of Figures S8 and S9, this is feasible if the two compounds are both present at similar concentrations; on the contrary, when one is much greater than the other (i.e., 10×), a single broadened peak is obtained. As can be seen from Figure S9, increasing the concentration of AH-7921, the peaks tend to approach and overlap, due to the fact that their ΔEp is <100 mV (see Table 4) and to the fact that they present a second peak that has the same peak potential (+1150 mV, see Table 4). For these reasons, the peaks overlap, giving rise to a broadened wave; nevertheless, as we measure the height of the peak and not their area, the errors are minimal if the concentration of the two drugs is in the same order of magnitude as reported in the text. Nevertheless, the co-administration of these two equipotent opioids is a rare event, and even in this case their dose in formulations is in the same order of magnitude.

3.3.1. Analysis of the Drug Formulations in Presence of Possible Interfering Substances

The excipients and drugs that can commonly co-present in the formulations of the two opioids were investigated as potential interferences in the DPV method, by adding them directly to the solution in the voltammetric cell in which a fixed concentration of the active compound is present. Several sugars were considered, e.g., glucose, dextrose, galactose, mannitol, and lactose (up to 5000 μg∙mL−1). We also considered as possible excipients EDTA, amphetamine (up to 50 μg∙mL−1), and dextrin (up to 70 μg∙mL−1), without any significant interference (change in peak height and position <10%). The higher tested concentrations of the potentially interfering substances were chosen according to their solubility in the working medium. Water, up to 20% with respect to ethanol, did not interfere. DPV scans in presence of the various interfering substances are reported in the Supplementary Information, Figures S10 and S11.

3.3.2. Analysis of the Capsules

The capsules were prepared and extracted as described in the “Material and method” section. Recovery factors of 86–99% for U-47700 and 83–99% for AH-7921 were obtained (see Table 5).

3.3.3. Analysis of Water and Natural and Synthetic Urines Spiked with the Title Compounds

As expected, the concentrations of the unmetabolized drugs in urine samples from real cases are in the order of 0.5 μg∙mL−1 to 5 μg∙mL−1 [57,58], i.e., in some cases below the LOQ of the method, and due to severe interferences caused by this complex matrix of partially unpredictable composition, a preconcentration and clean-up step is mandatory before the DPV analysis.
We already found that Florisil is a highly attractive stationary phase for the SPE of aminic compounds, as it efficiently retains this class of substances in a pH-dependent way [27,34]. For this reason, we used this approach for the clean-up/preconcentration of the two opioids, as described in the Materials and Methods section. The recovery factors were between 87% and 115% (water), 76% and 105% (synthetic urine), and 75% and 106% (real urine), depending on the analyte concentration (see Table 5).
The preconcentration factor obtained in our experimental conditions with the SPE phase was up to twenty times. Concentrations <0.5 μg∙mL−1were not considered because of poor clinical significance, and urine volumes >200 mL were not routinely used due to the long percolation time on the SPE cartridge.

4. Conclusions

The characterization of the electrochemical oxidative behavior of two synthetic opioids of the category of aroyl amides highlighted that the electroactivity of the compounds is related to the presence of the aliphatic tertiary amine group. Upon oxidation, a radical cation is formed whose reactivity is responsible for a branched reaction path. A DPV method for the analysis of the two compounds in water, synthetic urine, and urine samples was developed by relying on their oxidative behavior. For both synthetic opioids, at a concentration range suitable for its application in clinical and forensic analyses, possible interference from common substances present in these samples has been verified and excluded. Solid-phase extraction clean-up and preconcentration allowed us to reach the quantification limits compatible with the amounts of unmetabolized compounds that can be found in urine. The DPV method here described is timesaving and has analytical performances comparable to the methods already published in the literature. The procedure has also been applied to the analysis of capsules containing 10 mg of the aroyl amides, with no significant interferences due to the excipients.

Supplementary Materials

The following supporting information can be downloaded at https://www.mdpi.com/article/10.3390/chemosensors11030198/s1, Figure S1: The three-electrode cell, used in the CPE measurement; Table S1: Results obtained from cyclic voltammetry and exhaustive electrolysis for all the considered compounds. Peak potential of the studied compounds evaluated by CV, potential applied for CPE and number of electrons consumed during electrolysis. CV tests were performed at a concentration of 2.5 mM, in ethanol/0.1 M lithium perchlorate and 0.10 M 2,6-lutidine. Potentials are referred to Ag/AgCl, 3 M NaCl. Scan speed: 50 mV∙s−1. Working electrode: glassy carbon, 2 mm diameter. As regards the CPE, all the tests were carried out at a concentration of 5 mM of analyte in ethanol containing 0.1 M lithium perchlorate and 2,6-lutidine (0.10 M); Figure S2: Comparison between the cyclic voltammograms of U-47700 obtained before (red curve) and after exhaustive electrolysis conducted at +1100 mV (green curve). Cyclic voltammetry of U-47700 (2.5 mM, in ethanol/0.1 M lithium perchlorate and 0.10 M 2,6-lutidine). Potentials are referred to Ag/AgCl, 3 M NaCl. Scan speed: 50 mV∙s−1. Working electrode: glassy carbon, 2 mm diameter. Other conditions described in the text; Figure S3: Comparison between the cyclic voltammograms of AH-7921 obtained before (blue curve) and after exhaustive electrolysis conducted at +1200 mV (green curve). Cyclic voltammetry of AH-7921 (2.5 mM, in ethanol/0.1 M lithium perchlorate and 0.10 M 2,6-lutidine). Potentials are referred to Ag/AgCl, 3 M NaCl. Scan speed: 50 mV∙s−1. Working electrode: glassy carbon, 2 mm diameter. Other conditions described in the text; Figure S4: Effect of different combinations of supporting electrolytes and solvents on the CV curves of AH-7921 (Scan speed: 50 mV∙s−1, AH-7921 concentration 2.5 mM). Potentials are referred to Ag/AgCl, 3 M NaCl. Working electrode: glassy carbon, 2 mm diameter. Other conditions described in the text; Figure S5: Cyclic voltammetry of U-47700 (2.5 mM, in ethanol/0.1 M lithium perchlorate and 0.10 M 2,6-lutidine) at different scan speeds. Potentials are referred to Ag/AgCl, 3 M NaCl. Working electrode: glassy carbon, 2 mm diameter. Other conditions described in the text; Figure S6: Cyclic voltammetry of AH-7921, (2.5 mM, in ethanol/0.1 M lithium perchlorate and 0.10 M 2,6-lutidine) at different scan speeds. Potentials are referred to Ag/AgCl, 3 M NaCl. Working electrode: glassy carbon, 2 mm diameter. Other conditions described in the text; Figure S7: Cyclic voltammetry of DMF and methyl 3,4-dichlorobenzoate, (2.5 mM, in ethanol/0.1 M lithium perchlorate and 0.10 M 2,6-lutidine). Potentials are referred to Ag/AgCl, 3 M NaCl. Scan speed: 50 mV∙s−1. Working electrode: glassy carbon, 2 mm diameter. Other conditions described in the text; Figure S8: DPV of AH-7921 in ethanol/0.1 M lithium perchlorate and 0.10 M 2,6-lutidine and corresponding calibration curve; concentration range: from 5 μg∙mL−1 to 100 μg∙mL−1, in presence of 50 μg∙mL−1 of U-47700 and corresponding calibration curve. Potentials are referred to Ag/AgCl, 3 M NaCl. Scan speed: 50 mV∙s−1. Working electrode: glassy carbon, 2 mm diameter; Figure S9: DPV of U-47700 in ethanol/0.1 M lithium perchlorate and 0.10 M 2,6-lutidine and corresponding calibration curve; concentration range: from 5 μg∙mL−1 to 100 μg∙mL−1, in presence of 50 μg∙mL−1of AH-7921 and corresponding calibration curve. Potentials are referred to Ag/AgCl, 3 M NaCl. Scan speed: 50 mV∙s−1. Working electrode: glassy carbon, 2 mm diameter; Figure S10: DPV scans of U-47700 (100 μg∙mL−1), in presence of the various interfering substances: glucose (5000 μg∙mL−1), dextrose (5000 μg∙mL−1), galactose (5000 μg∙mL−1), mannitol, (5000 μg∙mL−1), lactose (5000 μg∙mL−1), EDTA (50 μg∙mL−1), amphetamine (50 μg∙mL−1), dextrine (70 μg∙mL−1); Figure S11: DPV scans of AH-7920 (100 μg∙mL−1) in presence of the various interfering substances: glucose (5000 μg∙mL−1), dextrose (5000 μg∙mL−1), galactose (5000 μg∙mL−1), mannitol, (5000 μg∙mL−1), lactose (5000 μg∙mL−1), EDTA (50 μg∙mL−1), amphetamine (50 μg∙mL−1), dextrine (70 μg∙mL−1) [38].

Author Contributions

Conceptualization, D.M.; investigation, A.C., A.B. and C.B.; writing—original draft preparation, S.P. writing—supervision, D.M. and A.P.; project administration: D.M. All authors have read and agreed to the published version of the manuscript.

Funding

This research received no external funding.

Institutional Review Board Statement

Not applicable.

Informed Consent Statement

Informed consent was obtained from all subjects involved in the study.

Conflicts of Interest

The authors declare no conflict of interest.

List of Abbreviations and Compounds Name

U-477003,4-dichloro-N-[2-(dimethylammino)ciclohexyl]-N-methyl-benzammide
AH-79213,4-Dicloro-N-[[1-(dimetilammino)cicloesil]metil]benzammide
CVcyclic voltammetry
CPE controlled potential electrolysis
DPV differential pulsed voltammetry
νscan speed (mV·s−1)
Eppeak potential (V)
ippeak intensity (A)
Rc%recovery factor %

References

  1. Colvin, L.A.; Bull, F.; Hales, T.G. Perioperative opioid analgesia—When is enough too much? A review of opioid-induced tolerance and hyperalgesia. Lancet 2019, 393, 1558–1568. [Google Scholar] [CrossRef] [PubMed] [Green Version]
  2. Koepke, E.J.; Manning, E.L.; Miller, T.E.; Ganesh, A.; Williams, D.G.A.; Manning, M.W. The rising tide of opioid use and abuse: The role of the anesthesiologist. Perioper. Med. 2018, 7, 16. [Google Scholar] [CrossRef] [PubMed] [Green Version]
  3. Mercadante, S. Opioid Analgesics Adverse Effects: The Other Side of the Coin. Curr. Pharm. Des. 2019, 25, 3197–3202. [Google Scholar] [CrossRef]
  4. Hasegawa, K.; Minakata, K.; Suzuki, M.; Suzuki, O. U-47700 and Its Analogs: Non-Fentanyl Synthetic Opioids Impacting the Recreational Drug Market. Brain Sci. 2020, 10, 895. [Google Scholar]
  5. Lamy, F.R.; Daniulaityte, R.; Barratt, M.J.; Lokala, U.; Sheth, A.; Pardo, R.G.C. Etazene, safer than heroin and fentanyl: Non-fentanyl novel synthetic opioid listings on one darknet market. Drug Alcohol Depend. 2021, 225, 108790. [Google Scholar] [CrossRef] [PubMed]
  6. Nowak, K.; Szpot, P.; Zawadzki, M. Fatal intoxication with U-47700 in combination with other NPS (N-ethylhexedrone, adinazolam, 4-CIC, 4-CMC) confirmed by identification and quantification in autopsy specimens and evidences. Forensic Toxicol. 2021, 39, 493–505. [Google Scholar] [CrossRef]
  7. Baselt, R. Disposition of Toxic Drugs and Chemicals in Man, 11th ed.; Biomedical Publications: Foster City, CA, USA, 2007; p. 2208. [Google Scholar]
  8. Lukić, V.; Micić, R.; Arsić, B.; Nedović, B.; Radosavljević, Ž. Overview of the major classes of new psychoactive substances, psychoactive effects, analytical determination and conformational analysis of selected illegal drugs. Open Chem. 2021, 19, 60–106. [Google Scholar] [CrossRef]
  9. Alexandridoua, A.; Mouskeftar, T.; Raikos, N.; Gika, H.G. GC-MS analysis of underivatised new psychoactive substances in whole blood and urine. J. Chromatogr. B 2020, 1156, 122308. [Google Scholar] [CrossRef]
  10. Richeval, C.; Gaulier, J.-M.; Romeuf, L.; Allorge, D.; Gaillard, Y. Case report: Relevance of metabolite identification to detect new synthetic opioid intoxications illustrated by U-47700. Int. J. Leg. Med. 2019, 133, 133–142. [Google Scholar] [CrossRef]
  11. Rojek, S.; Romańczuk, A.; Kula, K.; Synowiec, K.; Kłys, M. Quantifcation of U-47700 and its metabolites: N-desmethyl-U-47700 and N,N-didesmethyl-U-47700 in 12 autopsy blood samples employing SPE/LC–ESI-MS-MS. Forensic Toxicol. 2019, 37, 339–349. [Google Scholar] [CrossRef] [Green Version]
  12. Krotulski, A.J.; Mohr, A.L.A.; Papsun, D.M.; Logan, B.K. Metabolism of novel opioid agonists U-47700 and U-49900using human liver microsomes with confirmation in authenticurine specimens from drug users. Drug Test. Anal. 2018, 10, 127–136. [Google Scholar] [CrossRef]
  13. López-García, E.; Mastroianni, N.; Postigo, C.; Valcárcel, Y.; González-Alonso, S.; Barceló, D.; López de Alda, M. Simultaneous LC–MS/MS determination of 40 legal and illegal psychoactive drugs in breast and bovine milk. Food Chem. 2018, 245, 159–167. [Google Scholar] [CrossRef]
  14. Lowry, J.; Truver, M.T.; Swortwood, M.J. Quantification of seven novel synthetic opioids in blood using LC–MS/MS. Forensic Toxicol. 2019, 37, 215–223. [Google Scholar] [CrossRef]
  15. Truver, M.T.; Swortwood, M.J. Quantitative Analysis of Novel Synthetic Opioids, Morphine and Buprenorphine in Oral Fluid by LC–MS-MS. J. Anal. Toxicol. 2018, 42, 554–561. [Google Scholar] [CrossRef]
  16. Fleming, S.W.; Cooley, J.C.; Johnson, L.; Frazee, C.C.; Domanski, K.; Kleinschmidt, K.; Garg, U. Analysis of U-47700, a Novel Synthetic Opioid, in Human Urine by LC–MS–MS and LC–QToF. J. Anal. Toxicol. 2017, 41, 173–180. [Google Scholar] [CrossRef] [PubMed] [Green Version]
  17. Adamowicz, P.; Bakhmut, Z.; Mikolajczyk, A. Screening procedure for 38 fentanyl analogues and five other new opioids in whole blood by liquid chromatography-tandem mass spectrometry. J. Appl. Toxicol. 2020, 40, 1033–1046. [Google Scholar] [CrossRef]
  18. Mohr, A.L.; Friscia, M.; Papsun, D.; Kacinko, S.L.; Buzby, D.; Logan, B.K. Analysis of Novel Synthetic Opioids U-47700, U-50488 and Furanyl Fentanyl by LC-MS/MS in Postmortem Casework. J. Anal. Toxicol. 2016, 40, 709–717. [Google Scholar] [CrossRef] [PubMed] [Green Version]
  19. Strayer, K.E.; Antonides, H.M.; Juhascik, M.P.; Daniulaityte, R.; Sizemore, I.E. LC-MS/MS-Based Method for the Multiplex Detection of 24 Fentanyl Analogues and Metabolites in Whole Blood at Sub ng mL–1 Concentrations. ACS Omega 2018, 3, 514–523. [Google Scholar] [CrossRef] [PubMed] [Green Version]
  20. Popławska, M.; Bednarek, E.; Naumczuk, B.; Kozerski, L.; Błażewicz, A. Identification and structure characterization of five synthetic opioids: 3,4-methylenedioxy-U-47700, o-methyl-acetylfentanyl, 2-thiophenefentanyl, benzoylfentanyl and benzoylbenzylfentanyl. Forensic Toxicol. 2021, 39, 45–58. [Google Scholar] [CrossRef]
  21. Bade, R.; Abdelaziz, A.; Nguyen, L.; Pandopulos, A.J.; White, J.M.; Gerber, C. Determination of 21 synthetic cathinones, phenethylamines, amphetamines and opioids in influent wastewater using liquid chromatography coupled to tandem mass spectrometry. Talanta 2020, 208, 120479. [Google Scholar] [CrossRef] [PubMed]
  22. Gerace, E.; Salomone, A.; Luciano, C.; Di Corcia, D.; Vincenti, M. First Case in Italy of Fatal Intoxication Involving the New Opioid U-47700. Front. Pharmacol. 2018, 9, 747. [Google Scholar] [CrossRef]
  23. Nunes, C.N.; Pauluk, L.E.; Dos Anjos, V.E.; Lopes, M.C.; Quináia, S.P. New approach to the determination of contaminants of emerging concern in natural water: Study of alprazolam employing adsorptive cathodic stripping voltammetry. Anal. Bioanal. Chem. 2015, 407, 6171–6179. [Google Scholar] [CrossRef] [PubMed]
  24. Glasscott, M.W.; Vannoy, K.J.; Fernando, P.U.A.I.; Kosgei, G.K.; Moores, L.C.; Dick, J.E. Electrochemical sensors for the detection of fentanyl and its analogs: Foundations and recent advances. Trends Anal. Chem. 2020, 132, 116037. [Google Scholar] [CrossRef]
  25. Choìnska, M.K.; Šestáková, I.; Hrdlĭcka, V.; Skopalová, J.; Langmaier, J.; Maier, V.; Navrátil, T. Electroanalysis of Fentanyl and Its New Analogs: A Review. Biosensors 2022, 12, 26. [Google Scholar] [CrossRef]
  26. Merli, D.; Profumo, A.; Tinivella, S.; Protti, S. From smart drugs to smartphone: A colorimetric spot test for the analysis of the synthetic cannabinoid AB-001. Forensic Chem. 2019, 14, 100167. [Google Scholar] [CrossRef]
  27. Capucciati, A.; Cacciatore, L.; Protti, S.; Profumo, A.; Merli, D. Electrochemical analysis and characterization of psychoactive substances glaucine and tetrahydropalmatine. J. Electroanal. Chem. 2022, 907, 116032. [Google Scholar] [CrossRef]
  28. Zamboni, D.; Merli, D.; Protti, S.; Profumo, A. Electrochemistry and analytical determination of Lysergic Acid Diethylamide (LSD) via adsorbitive stripping voltammetry. Talanta 2014, 130, 456–461. [Google Scholar]
  29. Rustler, K.; Pockes, S.; König, B. Light-Switchable Antagonists for the Histamine H 1 Receptor at the Isolated Guinea Pig Ileum. ChemMedChem 2019, 14, 636–644. [Google Scholar] [CrossRef]
  30. Norman, I.; Harper, J.; Veitch, B.A. 1-(3,4-Dichlorobenzamidomethyl)-cyclohexyldimethylamine. US 518720, 17 August 1976. Available online: https://patentimages.storage.googleapis.com/38/15/18/e7e698218687c3/US3975443.pdf (accessed on 13 March 2023).
  31. Ott, J.; Spilhaug, M.M.; Maschauer, S.; Rafique, W.; Jakobsson, J.E.; Hartvig, K.; Hübner, H.; Gmeiner, P.; Prante, O.; Riss, P.J. Pharmacological Characterization of Low-to-Moderate Affinity Opioid Receptor Agonists and Brain Imaging with 18F-Labeled Derivatives in Rats. J. Med. Chem. 2020, 63, 9484–9499. [Google Scholar] [CrossRef]
  32. Yang, B.; ShenLanglois, K. Serotoninergic properties of new conformationally restricted benzamides. Eur. J. Med. Chem. 1996, 31, 231–239. [Google Scholar] [CrossRef]
  33. Merli, D.; Pretali, L.; Fasani, E.; Albini, A.; Profumo, A. Analytical Determination and Electrochemical Characterization of the Oxazolidinone Antibiotic Linezolid. Electroanalysis 2011, 23, 2364–2372. [Google Scholar] [CrossRef]
  34. Milanesi, C.L.; Protti, S.; Chiodi, D.; Profumo, A.; Merli, D. Electrochemical characterization and voltammetric determination of aryl piperazine emerging as designer drugs. J. Electroanal. Chem. 2021, 2021, 115480. [Google Scholar] [CrossRef]
  35. Hammerich, O.; Speiser, B. Organic Electrochemistry, 5th ed.; Hammerich, O., Speiser, B., Eds.; CRC Press (Taylor & Francis group): Boca Raton, FL, USA, 2016. [Google Scholar]
  36. Merli, D.; Profumo, A.; Dossi, C. An analytical method for Fe(II) and Fe(III) determination in pharmaceutical grade iron sucrose complex and sodium ferric gluconate complex. J. Pharm. Anal. 2012, 2, 450–453. [Google Scholar] [CrossRef] [PubMed] [Green Version]
  37. Available online: http://www.mpl.loesungsfabrik.de/en/english-blog/method-validation/calibration-line-procedure (accessed on 6 February 2023).
  38. Sarigul, N.; Korkmaz, F.; Kurultak, İ. A New Artificial Urine Protocol to Better Imitate Human Urine. Sci. Rep. 2019, 9, 20159. [Google Scholar] [CrossRef] [PubMed] [Green Version]
  39. Wang, B.; Cao, X. Anodic oxidation of hydrazine on glassy carbon modified by macrociclic transition metal complexes. J. Electroanal. Chem. 1991, 309, 147–158. [Google Scholar] [CrossRef]
  40. Zanello, P. Inorganic Electrochemistry—Theory, Practice and Application; Royal Society of Chemistry: Cambridge, UK, 2003. [Google Scholar]
  41. Fotouhi, L.; Hajilari, F.; Heravi, M.M. Electrochemical Behavior of Some Thiotriazoles in Aqueous-Alcoholic Media at GCE. Electroanalysis 2002, 14, 1728–1732. [Google Scholar] [CrossRef]
  42. Gowda, J.I.; Nandibewoor, S.T. Electrochemical Behavior of Paclitaxel and Its Determination at Glassy Carbon Electrode. Asian J. Pharm. Sci. 2014, 9, 42–49. [Google Scholar] [CrossRef] [Green Version]
  43. Masui, M.; Sayo, H.; Tsuda, Y. Anodic Oxidation of Amines. Part I. Cyclic Voltammetry of Aliphatic Amines at a Stationary Glassy-Carbon Electrode. J. Chem. Soc. B Phys. Org. 1968, 973–976. [Google Scholar] [CrossRef]
  44. Adenier, A.; Chehimi, M.M.; Gallardo, I.; Pinson, J.; Vilà, N. Electrochemical Oxidation of Aliphatic Amines and Their Attachment to Carbon and Metal Surfaces. Langmuir 2004, 20, 8243–8253. [Google Scholar] [CrossRef]
  45. Masui, M.; Hiroteru Sayo, H. Anodic Oxidation of Amines. Part 2. Electrochemical Dealkylation of Aliphatic Tertiary Amines. J. Chem. Soc. B 1971, 1593–1596. [Google Scholar] [CrossRef]
  46. Hull, L.A.; Davis, G.T.; Rosenblatt, D.H.; Mann, C.K. Oxidations of amines. VII. Chemical and electrochemical correlations. Phys. Chem. 1969, 73, 2142–2146. [Google Scholar] [CrossRef]
  47. Adhoum, N.; Monser, L. Determination of trimebutine in pharmaceuticals by differential pulse voltammetry at a glassy carbon electrode. J. Pharm. Biomed. Anal. 2005, 38, 619–623. [Google Scholar] [CrossRef]
  48. Amatore, C.; Farsang, G.; Maisonhaute, E.; Simon, P. Voltammetric investigation of the anodic dimerization of p-halogenoanilines in DMF Reactivity of their electrogenerated cation radicals. J. Electroanal. Chem. 1999, 462, 55–62. [Google Scholar] [CrossRef]
  49. Alfonso-Súarez, P.; Kolliopoulos, V.A.; Smith, J.P.; Banks, C.E.; Jones, A.M. An Experimentalists Guide to Electrosynthesis: The Shono Oxidation. Tetrahedron Lett. 2015, 56, 6863–6867. [Google Scholar] [CrossRef]
  50. Yunhua, W.; Xiaobo, J.; Shengshui, H. Studies on electrochemical oxidation of azithromycin and its interaction with bovine serum albumin. Bioelectrochemistry 2004, 64, 91–97. [Google Scholar]
  51. Bontempelli, G.; Dossi, N.; Toniolo, R. Linear Sweep and Cyclic, Reference Module in Chemistry, Molecular Sciences and Chemical Engineering. Available online: https://doi.org/10.1016/B978-0-12-409547-2.12200-0 (accessed on 30 December 2022).
  52. Sandford, C.; Edwards, M.A.; Klunder, K.J.; Hickey, D.P.; Li, M.; Barman, K.; Sigman, M.S.; White, H.S.; Minteer, S.D. A synthetic chemist’s guide to electroanalytical tools for studying reaction mechanisms. Chem. Sci. 2019, 10, 6404–6422. [Google Scholar] [CrossRef] [Green Version]
  53. Keerti, M.N.; Sharanappa, T.N. Electrochemical behaviour of chalcone at a glassy carbon electrode and its analytical applications. Am. J. Anal. Chem. 2012, 3, 656–663. [Google Scholar]
  54. Patil, S.M.; Bagoji, A.M.; Konnur, S.B.; Gokavi, N.M.; Nandibewoor, S.T. Electro-analysis of Orphenadrine Hydrochloride by Graphene Modified Glassy Carbon Electrode and Its Oxidation Mechanism. Anal. Bioanal. Electrochem. 2021, 13, 190–201. [Google Scholar]
  55. Galus, Z.; Adams, R.N. Anodic Oxidation Studies of N,N-Dimethylaniline. II. Stationary and Rotated Disk Studies at Inert Electrodes. J. Am. Chem. Soc. 1962, 84, 2061–2065. [Google Scholar] [CrossRef]
  56. Mizoguchi, T.; Adams, R.N. Anodic Oxidation Studies of N,N-Dimethylaniline. I. Voltammetric and Spectroscopic Investigations at Platinum Electrodes. J. Am. Chem. Soc. 1961, 84, 2058–2061. [Google Scholar] [CrossRef]
  57. Rambaran, K.A.; Fleming, S.W.; An, J.; Burkhart, S.; Furmaga, J.; Kleinschmidt, K.J.; Spiekerman, A.M.; Alzghari, S.K. U-47700: A Clinical Review of the Literature. J. Emerg. Med. 2017, 53, 509–519. [Google Scholar] [CrossRef] [PubMed]
  58. Concheiro, M.; Chesser, R.; Pardi, J.; Cooper, G. Postmortem Toxicology of New Synthetic Opioids. Front. Pharmacol. 2018, 9, 1210. [Google Scholar] [CrossRef] [PubMed]
Figure 1. New Synthetic Opioids examined in the present paper.
Chemosensors 11 00198 g001
Scheme 1. Procedure followed for the synthesis of U-47700.
Chemosensors 11 00198 sch001
Scheme 2. Procedure followed for the synthesis of AH-7921.
Chemosensors 11 00198 sch002
Scheme 3. Proposed oxidation mechanism for U-47700. Oxidation of AH-7921 proceeds in an analogous manner.
Chemosensors 11 00198 sch003
Figure 2. Cyclic voltammetry of U-47700 and AH-7921, 2.5 mM in ethanol/0.1 M lithium perchlorate and 0.10 M 2,6-lutidine. Potentials are referred to Ag/AgCl, 3 M NaCl. Scan speed: 50 mV∙s−1. Working electrode: glassy carbon, 2 mm diameter. Other conditions described in the text.
Chemosensors 11 00198 g002
Figure 3. Ep vs. log v graph for the first voltammetric peak of U-47700 (pink curve) and for the first voltammetric peak of AH-7921 (blue curve). Equations are reported in Table 3.
Chemosensors 11 00198 g003
Figure 4. log i vs. log v graph for the first voltammetric—peak of U-47700 and for the first voltammetric peak of AH-7921. Equations are reported in Table 3.
Chemosensors 11 00198 g004
Figure 5. i vs. v1/2 graph for the first voltammetric peak of U-47700 and for the first voltammetric peak of AH-7921. Equations are reported in Table 3.
Chemosensors 11 00198 g005
Figure 6. log i vs. log C (μg∙mL−1) graph for the first voltammetric peak of (a) U-47700 and for the first voltammetric peak of (b) AH-7921. Equations are reported in Table 3.
Chemosensors 11 00198 g006
Figure 7. i·v−1/2 vs. v1/2 graph for the first voltammetric peak of U-47700 and for the first voltammetric peak of AH-7921. Equations are reported in Table 3.
Chemosensors 11 00198 g007
Figure 8. DPV of U-47700 in ethanol/0.1 M lithium perchlorate and 0.10 M 2,6-lutidine; concentration range: from 5 μg∙mL−1 to 150 μg∙mL−1. Potentials are referred to Ag/AgCl, 3 M NaCl. Scan speed: 50 mV∙s−1. Working electrode: glassy carbon, 2 mm diameter.
Chemosensors 11 00198 g008
Figure 9. DPV of AH-7921 in ethanol/0.1 M lithium perchlorate and 0.10 M 2,6-lutidine; concentration range: from 5 μg∙mL−1 to 150 μg∙mL−1. Potentials are referred to Ag/AgCl, 3 M NaCl. Scan speed: 50 mV∙s−1. Working electrode: glassy carbon, 2 mm diameter.
Chemosensors 11 00198 g009
Figure 10. Calibration curve corresponding to DPV of AH-7921 (a) in ethanol/0.1 M lithium perchlorate and 0.10 M 2,6-lutidine; concentration range: from 5 μg∙mL−1 to 150 μg∙mL−1. Calibration curve corresponding to DPV of U-47700 (b) in ethanol/0.1 M lithium perchlorate and 0.10 M 2,6-lutidine; concentration range: from 5 μg∙mL−1 to 150 μg∙mL−1. Potentials are referred to Ag/AgCl, 3 M NaCl. Scan speed: 50 mV∙s−1. Working electrode: glassy carbon, 2 mm diameter. The standard deviation is reported after the numerical value. Each point of the calibration curve corresponds to the voltammetric curve of the same color.
Chemosensors 11 00198 g010
Table 1. Alternative methods for the determination of aroyl amides opioids, with their corresponding figures of merit.
AH-7920U-47700
Quantification
Methods
LOD
ng∙mL–1
Linear Range
ng∙mL–1
R2LOD
ng∙mL–1
Linear Range
ng∙mL–1
R2
LC-MS/MS * [15]51–25000.98551–25000.985
LC-MS/MS [16]---11–12500.9983
LC-MS/MS [17]0.020.01–200.99920.010.01–200.9990
UHPLC-MS/MS # [22]---0.60–2500.998
LC-MS/MS [18]---0.51–1000.9995
LC-MS/MS [11]0.0420.100−10.0-0.0190.100−10.0-
LC-MS/MS [19]---0.51–10000.9997
LC-MS/MS ° [20]qualitative qualitative
* Liquid chromatography-tandem mass spectrometry (LC-MS/MS). # Ultra-high-performance liquid chromatography-MS/MS. ° Quadrupole time-of-flight analyzer (LC–QTOF-MS/MS).
Table 2. Peak potential and electrochemical behavior of the studied compounds evaluated by CV (2.5 in ethanol, containing 0.1 M lithium perchlorate and 0.10 M 2,6-lutidine, measured at scan speed 50 mV·s−1). Note: i = irreversible. D = diffusion coefficient. and α refer to the process described by Ep1 (path a in Scheme 3).
CompoundD
cm2∙s−1
E0′
mV
Ep1
mV
Ep2
mV
Peak 1
Intensity
μA
Peak 2
Intensity μA
ln αReaction Order
U-477001.40 × 10−5+980 (i)+980+130041 ± 556 ± 7−16.80.731
AH-79212.40 × 10−5+1100 (i)+1100+130030 ± 631 ± 5−15.40.701
Table 3. Curves used for the determination of the electrochemical parameters exposed in the text. C = concentration (μg∙mL−1); v = scan speed (V·s−1); i= current intensity (A). The standard deviation is reported after the numerical value.
U-47700
E vs. log vE/V = (0.091 ± 0.013)·log (v/V·s−1) + (1.144 ± 0.047)
log i vs. log vlog (i/A) = (0.504 ± 0.010)·log (v/V·s−1) − (4.103 ± 0.032)
i vs. v1/2i/A = (1.003 ± 0.021) × 10−4 v1/2/V1/2·s−1/2 + (3.004 ± 0.032)∙10−6
log i vs. log Clog (i/A) = (3.153 ± 0.032)·log (C/mg∙L−1) + (1.753 ± 0.019)
i·v−1/2 vs. v1/2i·v−1/2/A·V−1/2·s1/2 = −(1.004 ± 0.042) × 10−5/V1/2·s−1/2 + (1.42 ± 0.28) × 10−4
AH-7921
E vs. log vE/V = (0.093 ± 0.014)·log (v/V·s−1) + (1.080 ± 0.032)
log i vs. log vlog (i/A) = (0.531 ± 0.023)·log (v/V·s−1) − (3.941 ± 0.043)
i vs. v1/2i/A = (7.003 ± 0.041) × 10−5 v1/2/V1/2 ·s−1/2 + (4.002 ± 0.053)∙10−4
log i vs. log Clog (i/A) = (0.972 ± 0.031)·log (C/mg∙L−1) + (1.821 ± 0.040)
i·v−1/2 vs. v1/2i·v−1/2/A·V−1/2·s1/2 = −(1.002 ± 0.050) × 10−5/V1/2·s−1/2 +(9.001 ± 0.033) × 10−5
Table 4. Calibration curves (DPV) for the considered compounds in ethanol/lithium perchlorate 0.1 M, and associated parameters. Standard deviation is reported after the numerical value. Each curve was obtained with 9 data points, from 5 μg∙mL−1 to 100 μg∙mL−1. Peak potentials observed in DPV are also reported.
CompoundCalibration CurveCorrelation Coefficient R2LOD μg∙mL−1LOQ μg∙mL−1Intraday Precision %Interday Precision
%
Ep1
mV
Ep2
mV
U-47700i/μA = (0.01212 ± 0.00043)·(C/μg·L−1) + (0.012 ± 0.020)0.9930.20.676+880+1150
AH-7921i/μA = (0.01533 ± 0.00083)·(C/μg·L−1) + (0.083 ± 0.02)0.9900.20.598+970+1150
Table 5. Percentual recovery factor (Rc %) in water, synthetic urine, and real urine samples (number of replicates, n = 4) spiked with U-47700 and AH-7921 and in capsules containing 10 mg of one of the two compounds.
WaterSynthetic UrineUrineCapsules
CompoundConcentration μg∙mL−1 aRc %Concentration
μg∙mL−1 a
Rc %Concentration μg∙mL−1 aRc %Amount mgRc %
U-477000.5 (100)1110.5 (100)1020.5 (100)731086–99
0.5 (200)1110.5 (100)1020.5 (200)97
1 (50)1151 (50)1012 (50)86
20 (10)872 (50)1055 (50)95
AH-79210.5 (100)980.5 (100)760.5 (100)1041083–99
0.5 (200)1150.5 (200)890.5 (200)96
1 (50)1001 (50)852 (50)103
20 (10)1102 (50)815 (50)106
a the volume of solution preconcentrated is reported between parentheses.
Disclaimer/Publisher’s Note: The statements, opinions and data contained in all publications are solely those of the individual author(s) and contributor(s) and not of MDPI and/or the editor(s). MDPI and/or the editor(s) disclaim responsibility for any injury to people or property resulting from any ideas, methods, instructions or products referred to in the content.

