Article

Exploring the Adsorption of Pb on Microalgae-Derived Biochar: A Versatile Material for Environmental Remediation and Electroanalytical Applications

1
Norwegian Institute for Water Research (NIVA), Økernveien 94, 0579 Oslo, Norway
2
Department of Science and High Technology, University of Insubria, Via Valleggio 11, 22100 Como, Italy
3
Department of Theoretical and Applied Science, University of Insubria, Via J.H. Dunant 3, 21100 Varese, Italy
*
Authors to whom correspondence should be addressed.
Chemosensors 2022, 10(5), 168; https://doi.org/10.3390/chemosensors10050168
Submission received: 30 March 2022 / Revised: 22 April 2022 / Accepted: 28 April 2022 / Published: 30 April 2022
(This article belongs to the Special Issue Biochar Based Sustainable Sensing Platforms)

Abstract

:
Biochar, a carbon material obtained by pyrolysis of biomasses, is increasingly applied in environmental remediation and sensing thanks to its functional properties, cost-effectiveness and eco-friendliness. The adsorption capacity of biochar, strictly dependent on its specific surface area, heteroatom doping and surface functional groups, is crucial for these applications. Here, biochar produced at low temperature (350 °C) from a marine microalga (Nannochloropsis sp.) is proposed as an efficient adsorbent of lead (II) ions in aqueous solution; this production strategy promotes the natural self-doping of biochar without requiring harsh conditions. The kinetics and thermodynamics of the adsorption process, as well as the effect of pH, ionic strength and dissolved organic matter on the adsorption efficiency were systematically assessed. The microalgae-derived biochar shows superior adsorption performances compared to a nutshell-derived one (used as a reference of lignocellulosic feedstocks) under all the tested conditions. The microalgae-derived biochar was finally used to decorate screen-printed carbon electrodes to improve the electroanalytical performances towards the voltammetric detection of lead (II) ions. A two-fold increase in sensitivity was obtained compared to the unmodified electrode thanks to the enhanced electron transfer and adsorption properties provided by biochar. These results highlight the potentialities of microalgae-derived biochar for environmental and sensing applications.

1. Introduction

Biochar (BC), a carbon-rich solid obtained from the thermal treatment of biomass feedstocks, is increasingly being studied as an alternative sustainable biomaterial for several industrial applications [1,2,3,4]. Notably, BC is widely used for soil amendment and the immobilization of contaminants thanks to its favorable physicochemical properties (e.g., mechanical and thermal stability, high reactive surface area [4,5,6]), low cost, and eco-friendliness. More recently, BC has also found application in other different innovative technologies, such as for electrochemical devices [1,7] and catalytic platforms [8,9].
A crucial feature of BC for environmental remediation and sensing applications is its adsorption capacity, which is related to: (i) the high surface reactive area (mainly derived from its porous structure), which ensures high adsorption rates, (ii) the presence of heteroatoms (e.g., P, N, Ca) which induces defects in the carbon structure and favors ion insertion, and (iii) the occurrence of surface functional groups which can act as active sites (e.g., C=C aromatic bonds which create cation–π interactions for adsorption of toxic metals) [10,11,12]. These properties are strongly affected by two key factors: the nature of the biomass feedstock (which reflects the physicochemical properties of the final product [11]) and the pyrolysis process [4,13,14]. The investigation of pyrolysis conditions and the selection of raw materials presenting advantageous properties (e.g., presence of heteroatoms and high concentration of lipids) are therefore crucial to improve the adsorption performances of BC. High temperature pyrolysis (800–1000 °C) is often preferred when producing BC for environmental and electrochemical applications, since it produces BC characterized by high electrical conductivity and specific surface area. Activating agents (e.g., KOH, H3PO4) are also often added to biomass feedstocks to further induce porosity and surface functionalization of BC (partially lost at high temperatures due to the graphitization of the material [15]). Despite the high adsorption efficiencies of the produced BC, such harsh pyrolysis conditions negatively affect BC yield and its natural self-doping (which reflects the raw material chemical composition [11]). Moreover, the use of additives and high-temperature pyrolysis strongly reduce the sustainability of BC production.
Self-doped biomass feedstocks subjected to low-temperature pyrolysis (<400 °C) can instead represent a novel class of highly performing and greener materials (requiring limited or absent use of chemicals and energy) leading to high production yields of naturally functionalized BC with improved adsorptive properties [16,17]. Accordingly, the use of microalgae as a source of BC is increasingly supported in research due to their fast grow, high carbon fixing efficiency, high lipidic content and low required amount of land for growth [18,19,20]. Moreover, recent reports highlighted that microalgae-derived biochar is rich in carbonyl and other oxygen containing functional groups, as well as abundant self-doping in N and P heteroatoms [14,21,22]. Despite these beneficial features, microalgae-derived BC produced at low temperature is still not deeply studied as adsorbent and sensing material for the removal and detection of toxic heavy metals in water [23,24].
In light of these considerations, here we tested the adsorption performances of two different biochar materials, obtained from a marine microalga (Nannochloropsis sp.) and from an agricultural lignocellulosic biomass (nutshells), towards lead (II) ions to elucidate how the physicochemical properties derived from the different feedstocks (presented in a previous study [14]) affect the adsorption process. Lead (Pb) is selected as a model target element in this work because of its importance for environmental monitoring and health assessment, owing to its high toxicity (with different adverse effects on humans [25,26] and the biota [27]) and its widespread presence in water by natural processes (e.g., weathering of Pb-bearing minerals [28,29]) and anthropic activities [29,30]. The adsorption process was systematically evaluated regarding kinetic and thermodynamic features to reconstruct its mechanism. The effect of water chemistry (pH, ionic strength and dissolved organic matter–DOM) on this process was assessed as well, paving the way for the application of produced BC for pollution remediation [31]. Finally, the microalgae-derived BC was preliminary tested in view of its combined electrochemical and adsorption properties for a sensing application: a Differential Pulse Adsorptive Stripping Voltammetry (DPAdSV) method was applied to determine lead (II) ions using screen-printed carbon electrodes (SPEs) modified with microalgae-derived BC particles with the aim of improving the sensitivity of the method.

2. Materials and Methods

2.1. Reagents, Materials and Solutions

All the solutions, where not differently stated, were prepared using ultrapure water obtained with a Sartorius (Göttingen, Germany) Arium mini (18.8 MΩcm resistivity). HNO3 solutions were obtained from dilution of 65% wt. sub-boiling distilled HNO3 using a Milestone (Shelton, CT, USA) DuoPUR system [32], while the NaOH solution was prepared by diluting commercial 50% NaOH solution (Carlo Erba, Milan, Italy). Lead (II) nitrate was purchased from Sigma Aldrich (St. Louis, MI, USA) and used to prepare adsorption solutions. Sodium nitrate and humic acid (HA), used for adsorption experiments, were purchased from Sigma-Aldrich respectively. Sodium acetate (Carlo Erba), acetic acid (Fluka, Everett, WA, USA, >99.8%), potassium nitrate (Carlo Erba, analytical grade) and potassium ferricyanide (Carlo Erba) were used for electrochemical measurements. Pb and Rh standard solutions for ICP-MS analysis were obtained by dilution of Merck (Darmstadt, Germany) Trace cert single standard solutions. All the adsorption experiments were performed in low-density polyethylene (LDPE) bottles thoroughly cleaned and decontaminated by a procedure involving prolonged washing with a detergent solution (4 mL/L Nalgene L900) and then with a 2% wt. HNO3 solution (see details in [33,34]). Containers used for ICP-MS analysis were washed following the same protocol.

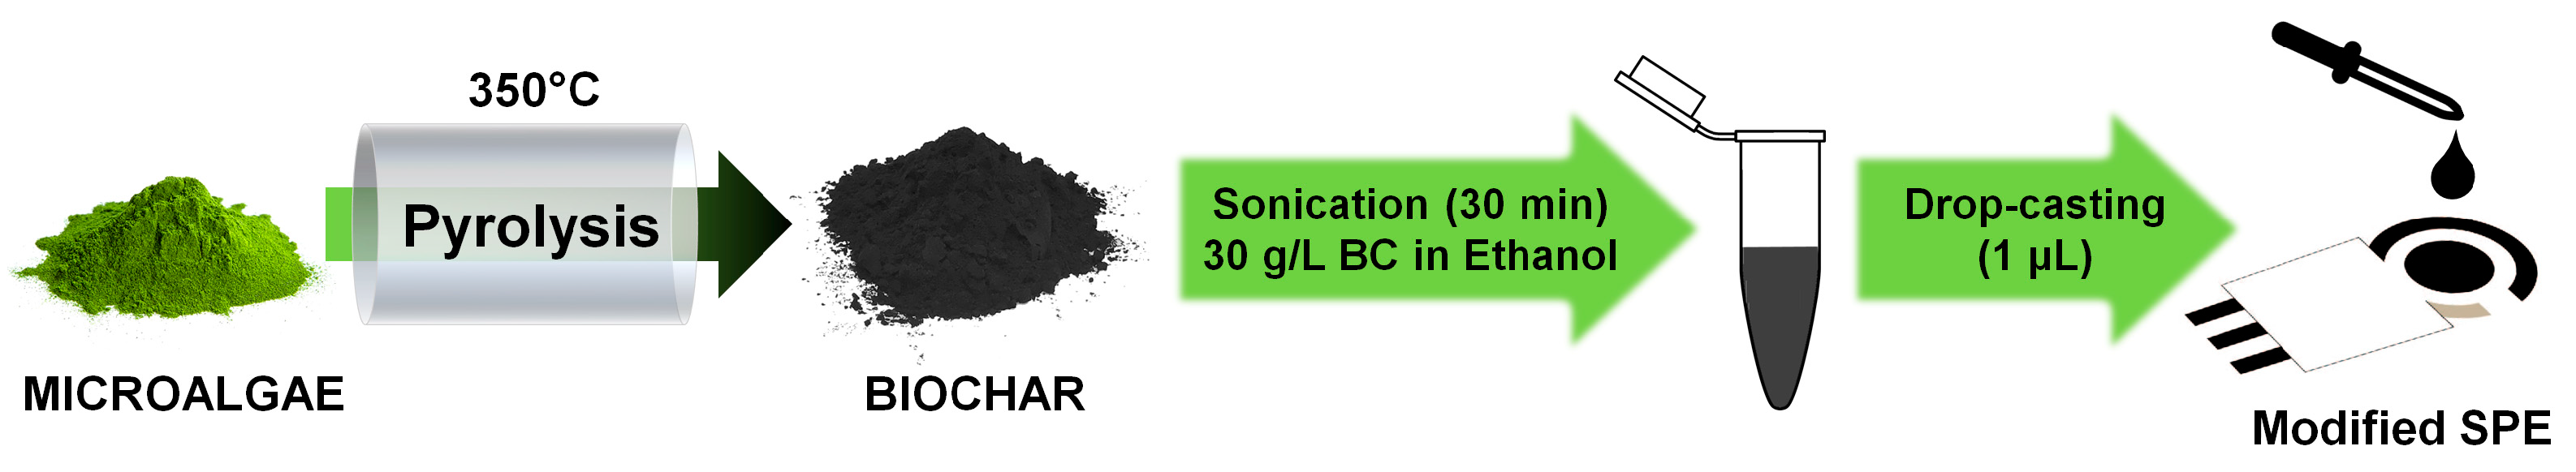
2.2. Biochar Production

BC materials were obtained by a slow pyrolysis process at 350 °C (10 °C/min). Lyophilized microalgae samples were obtained from Archimede Ricerche S.r.l. (Camporosso, Imperia, Italy), while nutshells were obtained from commercial walnuts and manually ground. Pyrolysis was performed for all the samples (around 10 g for each batch) in a cylindrical quartz reactor (internal diameter 65 mm) heated by an external tubular electric furnace under continuous N2 flux (flow rate 0.5 L/min). More details on the pyrolysis process are reported elsewhere [14].
After pyrolysis, biochar batches were cooled under nitrogen, ground using a Fritsch (Germany) Pulverisette 0 agate ball mill, washed in ultrapure water for 24 h under continuous stirring by an orbital shaker (50 mg in 50 mL of ultrapure water), and the resulting suspension using 0.45 µm pore cellulose filters to recover BC. The latter was then dried for 16 h at 80 °C on a hot plate. In the following sections, the obtained microalgae-derived biochar and nutshell-derived biochar will be named as MBC and NBC, respectively.

2.3. Pb Adsorption Experiments

The effect of different factors on Pb adsorption were evaluated (i.e., Pb concentration, equilibration time, pH, and conductivity values) to comprehensively reconstruct the interaction mechanisms and the role of water chemistry in regulating the adsorption process. Operatively, 100 mg of biochar were transferred into LDPE bottles and 50 mL of solutions containing different concentrations of Pb (final biochar concentration 2 g/L, comparable to previous reports [35,36,37,38]). The solutions were thoroughly mixed and then left in an orbital shaker at 150 rpm for the time required to reach equilibrium. Solutions were then filtered through 0.45 µm pore cellulose filters, diluted with ultrapure water, acidified with ultrapure HNO3 (final concentration of 2% in weight), and finally analyzed by means of a Thermo-Scientific (Waltham, MA, USA) Icap Q ICP-MS to determine residual Pb concentration in solution. Rhodium (1 µg/L) was spiked in all the diluted samples as an internal standard. For all the extraction processes both MBC and NBC were tested. A blank solution containing Pb without BC was analyzed as a control to quantify possible deposition and adsorption of Pb on the container walls.

2.3.1. Adsorption Kinetics and Isotherms

Kinetic tests were performed using a 5 µmol/L Pb solution in ultrapure water. Solutions were analyzed after filtration at different fixed times (0.5, 1, 2, 4, 8, 18, 24, and 48 h, respectively).
After the ICP-MS quantification of Pb, its adsorption capacity (Q) was calculated as follows (Equation (1)):
Q = (C0 − C1) × V/M
where C0 and C1 are the initial (corrected by blank values) and the residual concentration in solution; M (g) is the amount of biochar; and V (mL) is the volume of the solution.
The pseudo first-order and pseudo second-order equation were then tested to describe the kinetic process of adsorption. They are depicted in Equations (2) and (3), respectively:
ln(Qe − Qt) = ln Qe − k1t
t/Qt = 1/k2Qe2 + t/Qe
where and Qe (µmol/g) Qt (µmol/g) are the adsorption capacity value at equilibrium and at specific time t (min); k1 (1/min) and k2 (g/µmol × min) are the rate constants for pseudo first-order and the pseudo second-order, respectively [39].
Adsorption isotherm tests were performed to understand the adsorption capacity of biochar materials and model the equilibrium conditions, using Pb concentrations ranging from 0.25 µmol/L to 25 µmol/L. The solutions were equilibrated for 24 h (see Section 3.1), and then filtered and analyzed. Langmuir and Freundlich models were then tested to describe the adsorption process (Equations (4) and (5), respectively):
Ce/Qe = 1/(KL × Qm) + Ce/Qm
lnQe = lnKF + 1/n × lnCe
where Qm (µmol/g) is the maximum adsorption capacity, Qe (µmol/g) is the adsorption capacity at equilibrium and Ce is the residual concentration in solution. KL (l/µmol) is the Langmuir constant, and KF (µmol/g) × (µmol/l)1/n and 1/n are the Freundlich constants [40].

2.3.2. Adsorption Experiments at Varying Water Chemistry

After the understanding of physicochemical adsorption process in ultrapure water, the role of water chemistry in determining Pb adsorption was assessed. pH, ionic strength, and DOM concentration were evaluated: an equilibration time of 24 h was employed (see Section 3.1) and 5 µmol/L of Pb was added to all the batches. A 32 design of experiment (DoE) was applied to study the effect of the pH (adjusted by adding 0.1 M HNO3 and NaOH solutions) and ionic strength (varied using different concentration of NaNO3) on the adsorption process. Table 1 shows the operative conditions adopted for the nine experiments performed.
Finally, the effect of dissolved organic matter was assessed in solutions (at pH 5.5, with 10 mmol/L of dissolved NaNO3) adding 1 and 10 mg/L of humic acids in batches. Moreover, as a further test of adsorption performances in and environmental sample, a lake water sample was spiked with 1 mg/L of Pb, and this solution was treated as previously mentioned (water physicochemical features and major ions are reported in Supplementary Material, Table S1; details on lake water sampling and analysis can be found elsewhere [28,41].
In this case, the adsorption efficiency (%) was calculated after the ICP-MS analysis of Pb (Equation (6)):
E(%) = (C0 − Ce)/C0 × 100
where E is the efficiency, C0 is the initial concentration (corrected after the analysis of blank values), and Ce residual the concentration in the adsorption batches at equilibrium.

2.3.3. Biochar Physicochemical Characterization

The morphology of biochar was investigated using a Philips® (Amsterdam, The Netherlands) field emission gun-scanning electron microscope (FEG-SEM), with a 20 keV beam under high-vacuum atmosphere. SEM–energy dispersive X-ray (SEM–EDX) elemental analysis was performed to observe the elemental composition of biochar and potential Pb adsorption.
Fourier-transformed infrared spectroscopy (FT-IR) was performed to analyze surface groups and possible changes after adsorption of Pb. Before FT-IR analysis, biochar samples were grounded with an agate ball mill. The analysis was then performed in attenuated total reflection (ATR) mode using a diamond-ATR Thermo Scientific Nicolet iS 10 FTIR Spectrometer and thirty-two scans for each sample were performed in the 4000–650 cm−1 spectral window. Spectral data were then smoothed using Savitzky–Golay filter (with a window of 30 points) and normalized (from 0 to 1) on the maximum absorbance peak.

2.4. Electroanalytical Application

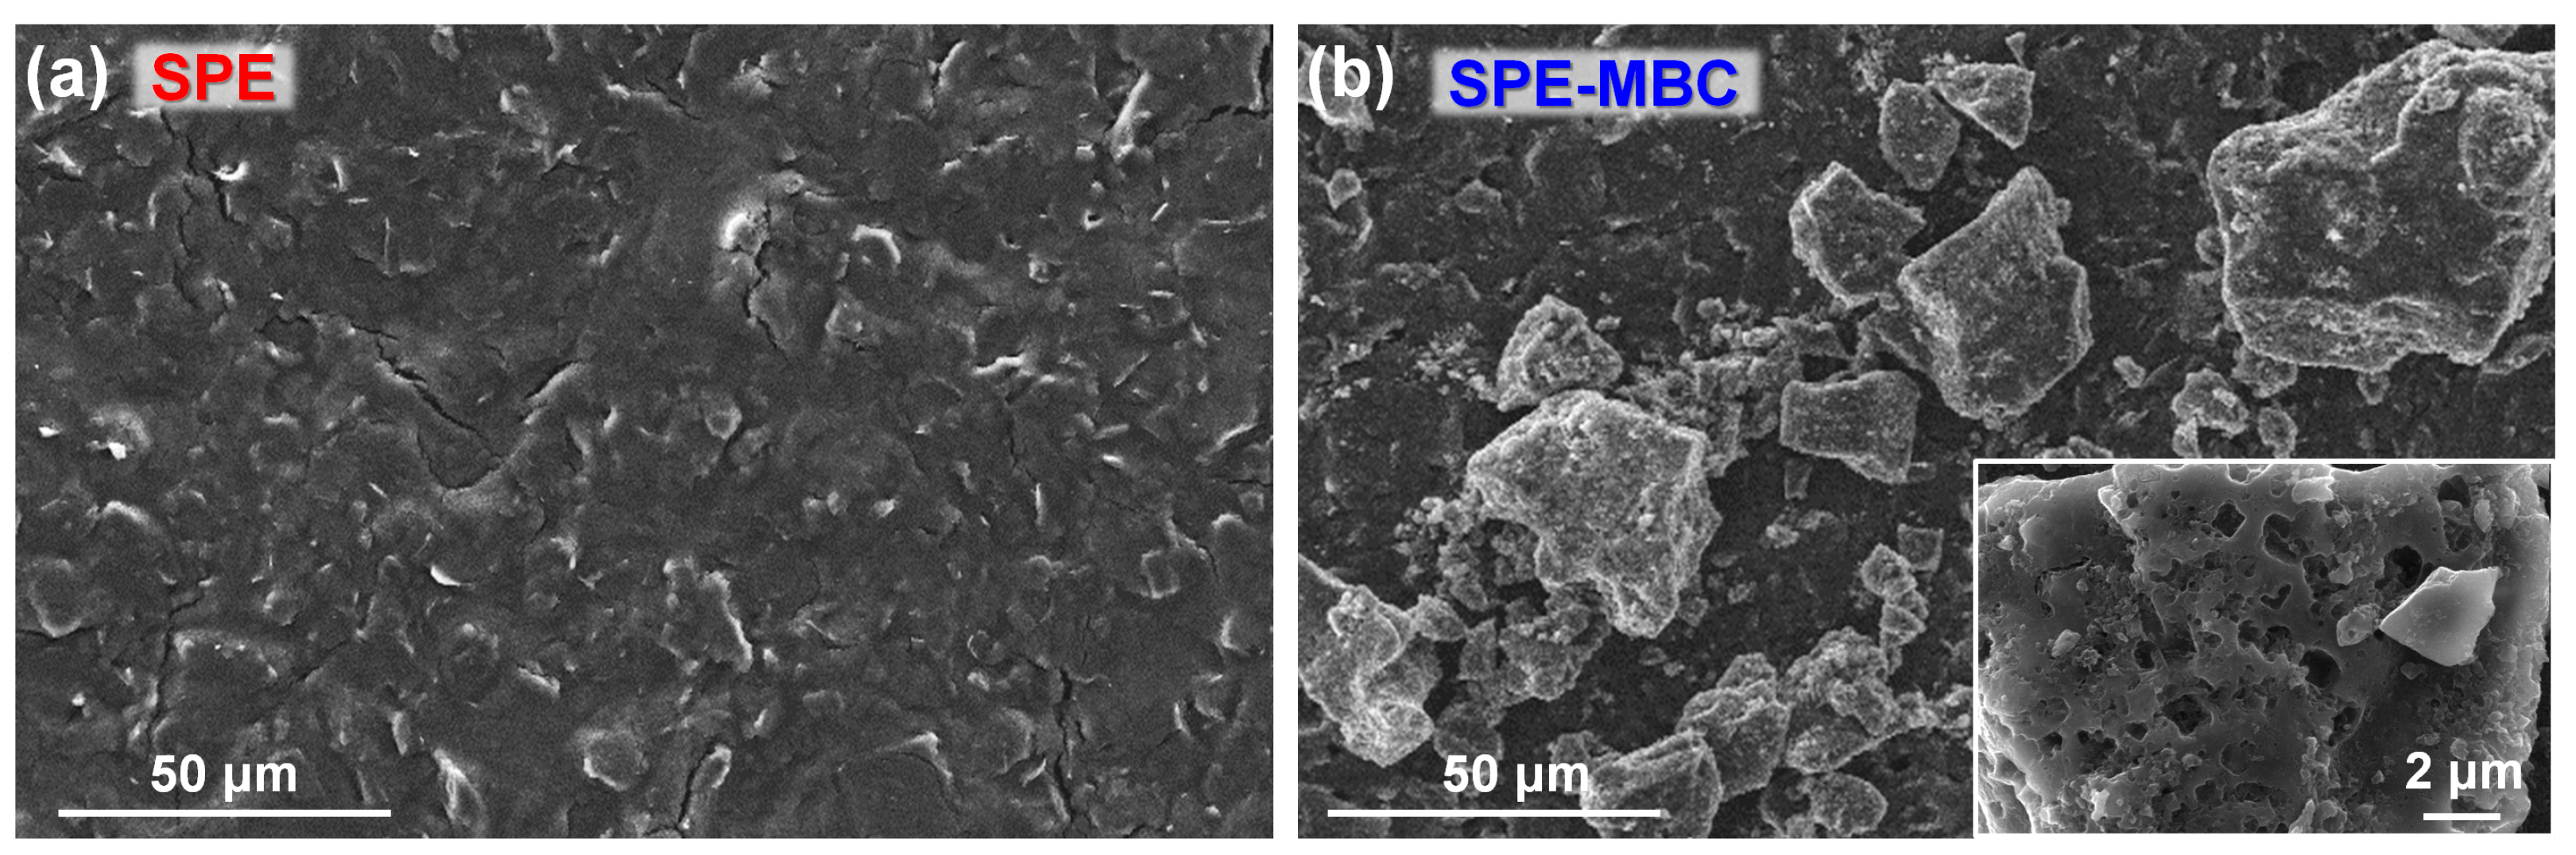
2.4.1. Modification of the Screen-Printed Electrodes (SPEs) with MBC

The screen-printed electrodes (SPEs) DRC-C11L Dropsens (Metrohm, Herisau, Switzerland) were used in this work: working (4 mm diameter) and counter electrodes are made of carbon, whereas the reference electrode is composed of Ag/AgCl. The microalgae-derived biochar powder was dispersed in ethanol (BC concentration = 30 g/L) and sonicated for 30 min to partially break down BC into to micro- and nano-sized particles: ethanol was selected as dispersing agent as it guarantees a highly homogenous dispersion of the biochar [42]. Then, one microliter of the so-obtained suspension was drop-casted onto the working electrode and then left to dry in air. This deposited volume was selected after a preliminary optimization to completely cover the working electrode surface with BC, while leaving the other electrodes unaltered (volumes greater than 1 μL may lead to the partial or total coverage of the reference and counter electrodes). Finally, the modified-SPE was gently rinsed with ultrapure water to remove biochar particles loosely adhered to the carbon electrode surface. A schematic representation of the entire process is depicted in Figure 1.
An Amel 4330 electroanalytical instrument (Amel srl, Milano, Italy) was used for all electrochemical experiments. The instrument was interfaced to a Windows-based personal computer via VApeak software. Full data analysis (peak finding, peak height and fitting) was performed by using Origin 2018 software (OriginLab, Northampton, MA, USA). All electrochemical measurements were carried out by filling the voltammetric cell with 7 mL of solution, eventually degassed under a flow of N2. The agitation of the solution was ensured by a vertical mechanical stirrer.

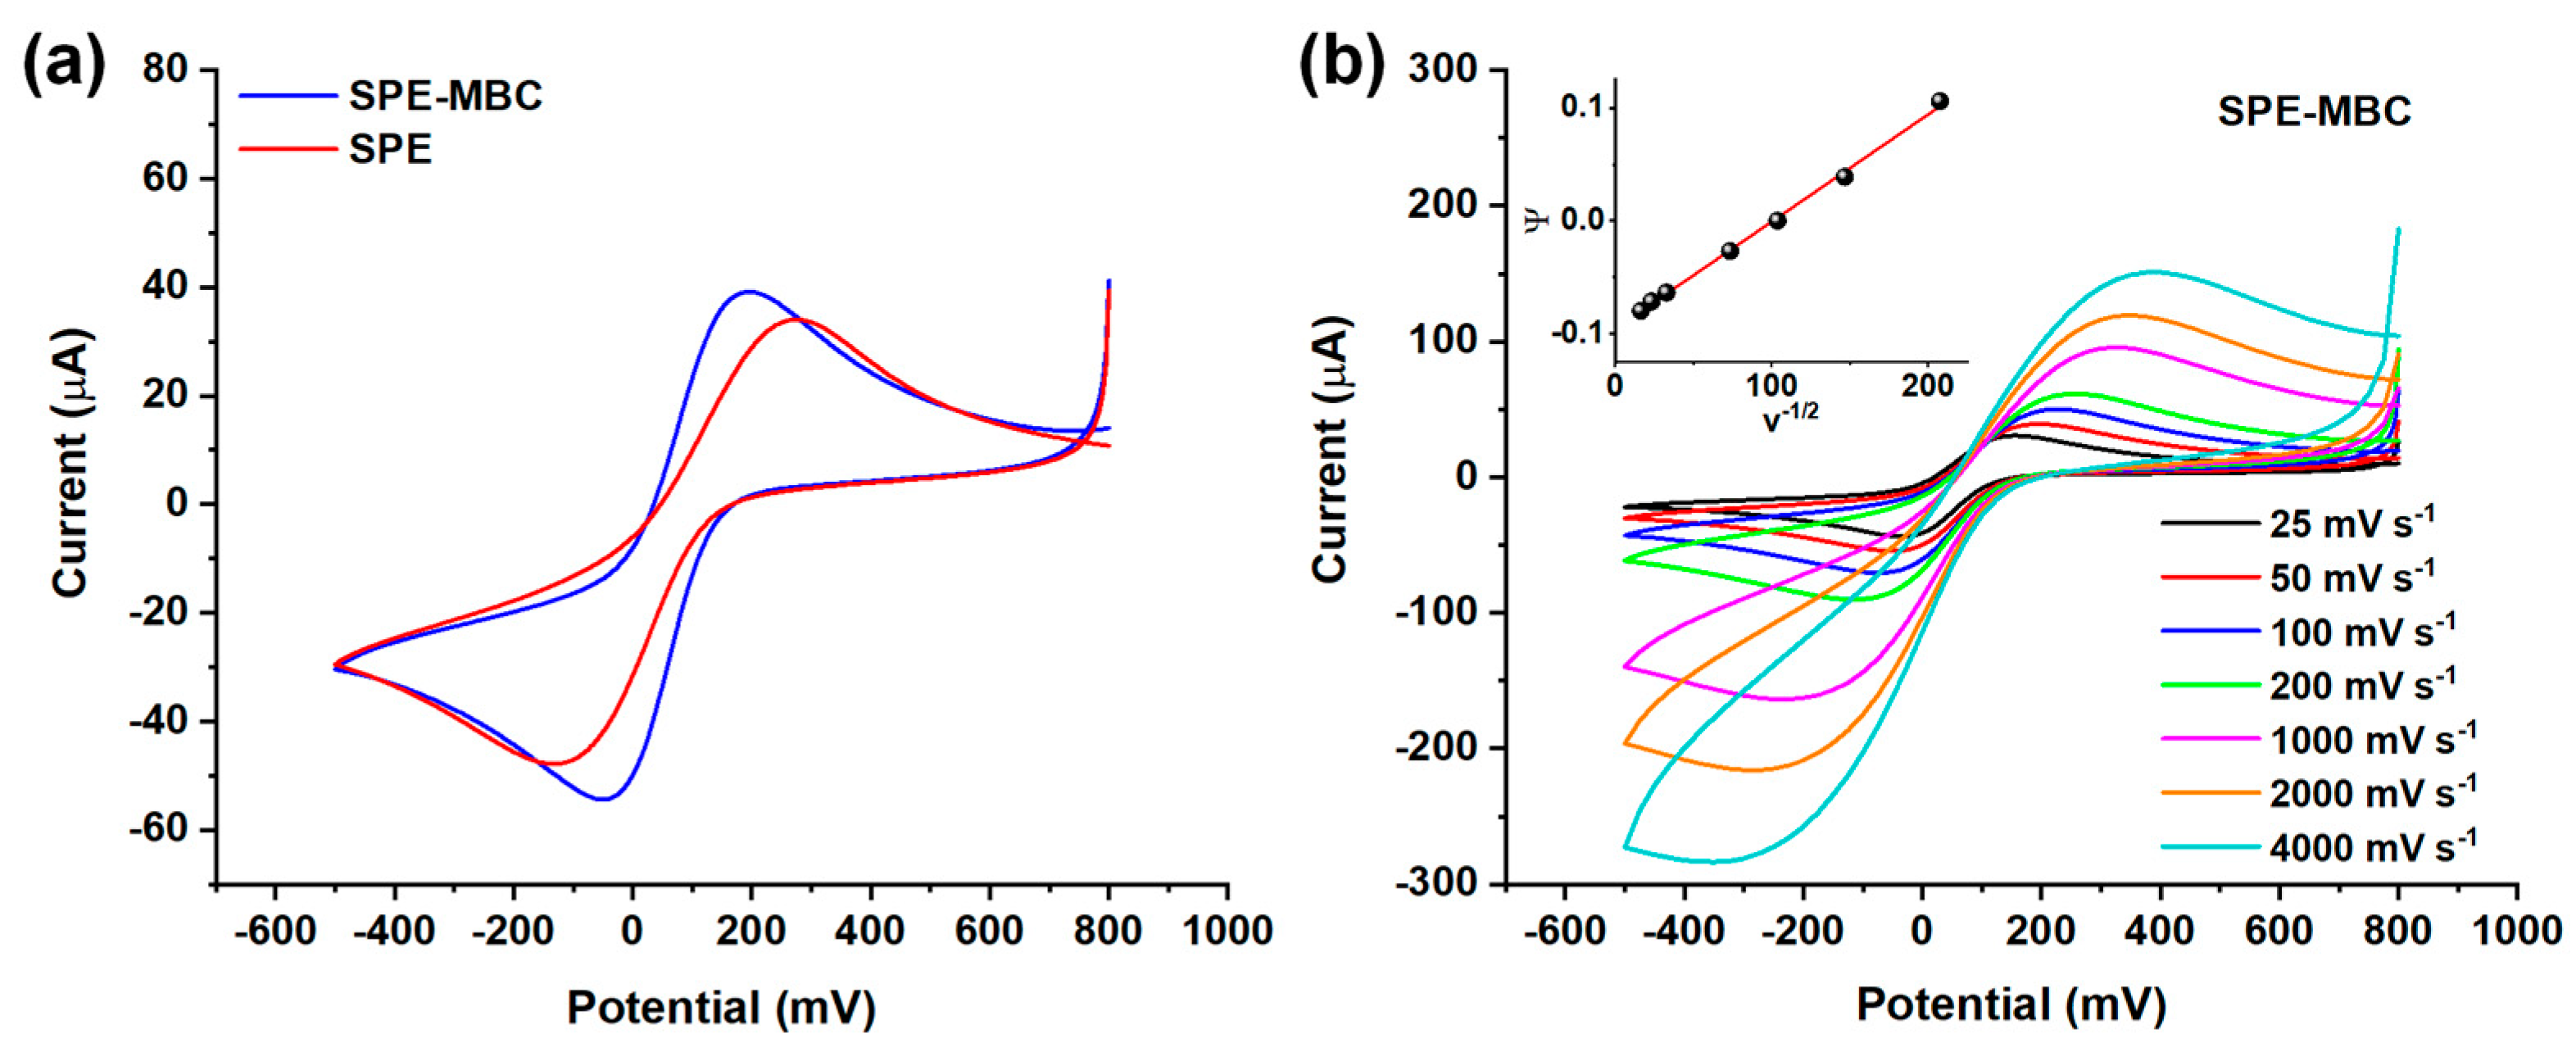
2.4.2. SPE Electrochemical Characterization

The electrochemical characterization of BC-modified and bare SPEs was carried out by means of cyclic voltammetry measurements of a 5 mM potassium ferricyanide (K3[Fe(CN)6]) and 100 mM KNO3 solution. Voltammograms were recorded by performing linear potential scans at different speeds ranging from 25 to 4000 mV/s. Further details on the parameters used are shown in Table 2. The obtained data were treated to estimate the electron transfer rate constant (k0) for bare and modified electrodes. The well-known kinetic dimensionless parameter Ψ = k0[DnvF/(RT)]−1/2 [43] and its empirical determination according to Lavagnini et al. [44] Ψ = (−0.6288 + 0.0021ΔEpn)/(1 − 0.017ΔEpn) were used to estimate k0. In these equations:
  • v = linear scan speed (mV s−1)
  • F (Faraday constant) = 96,485 C mol−1
  • D (diffusion coefficient) = 7.6 × 10⁻⁶ cm2 s−1
  • R (gas constant) = 8.314 J K−1 mol−1
  • T (temperature) = 298.15 K
  • ΔEp = peak-to-peak separation (mV)
  • n = number of transferred electrons (n = 1)

2.4.3. Voltammetric Lead Determination

A Differential Pulse Adsorptive Stripping Voltammetry (DPAdSV) method (adapted from Oliveira et al. [31]) was used involving multiple steps for the electrochemical Pb determination in aqueous solution. The procedure was performed using the same electrochemical equipment described in the previous section and can be summarized as follows:
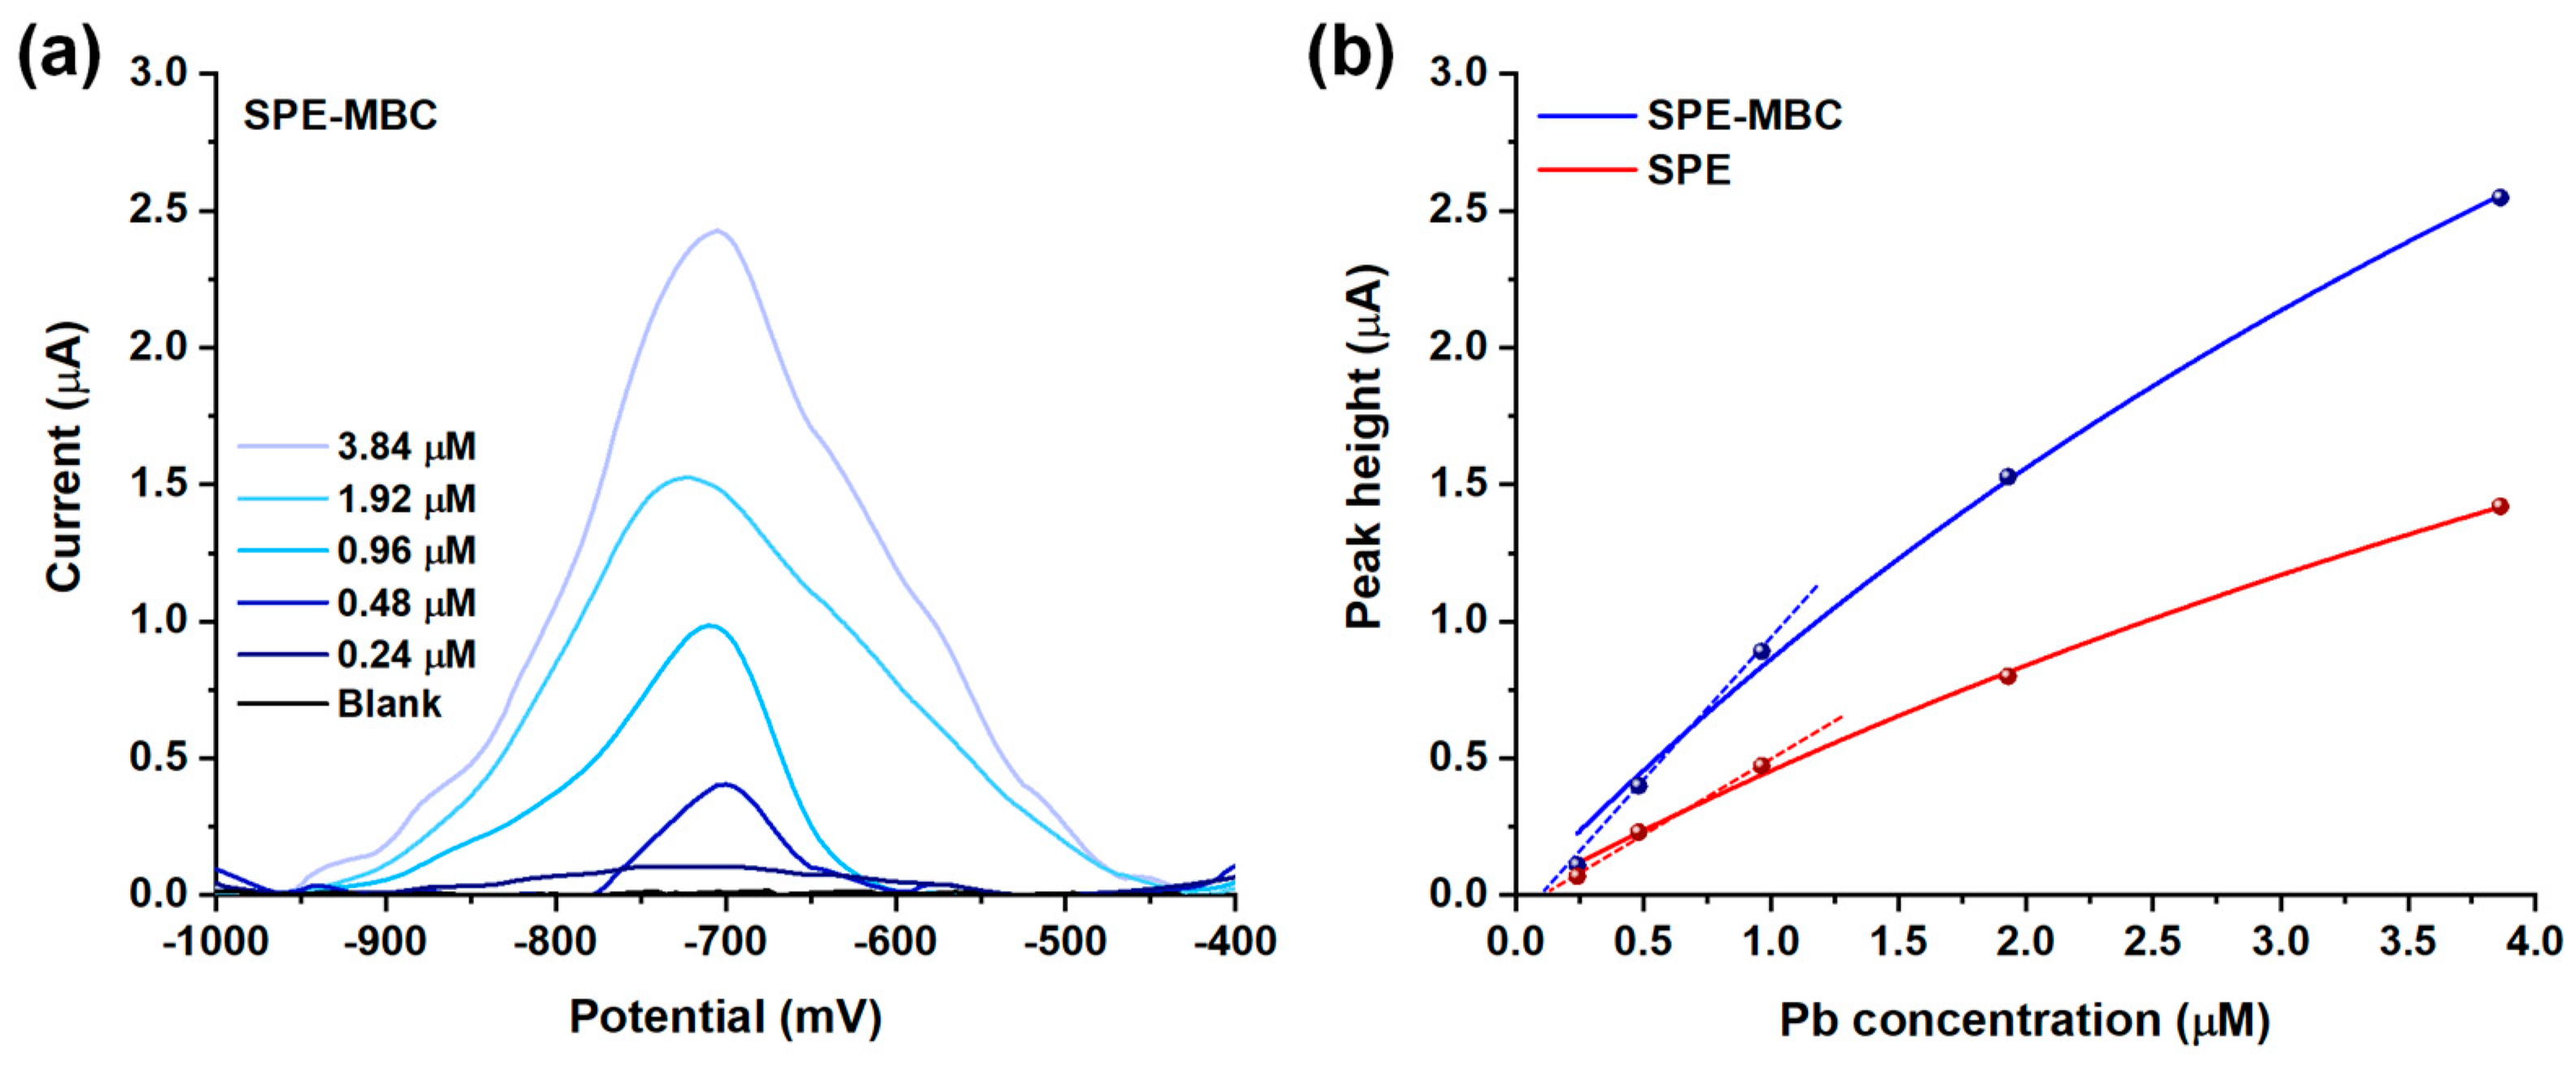
  • Pb2+ preconcentration: the SPE is placed in a cell containing a 0.10 M sodium acetate solution (pH 7.0) and a known Pb concentration under open circuit conditions for 10 min.
  • Pb2+ reduction: the SPE is removed from the solution, washed lightly with ultrapure water, and transferred to the voltammetric cell which contains a 0.10 M sodium acetate solution (pH 3.6). A negative potential of –1100 mV is applied for 120 s during this stage to reduce the adsorbed lead ions.
  • Stripping voltammetry analysis: the SPE is submitted to differential pulse voltammetry (DPV) sweeps from −1100 mV to −300 mV using the following experimental conditions: pulse width of 100 mV, pulse duration time of 25 ms, and a scan rate of 5 mV s−1.

3. Results and Discussion

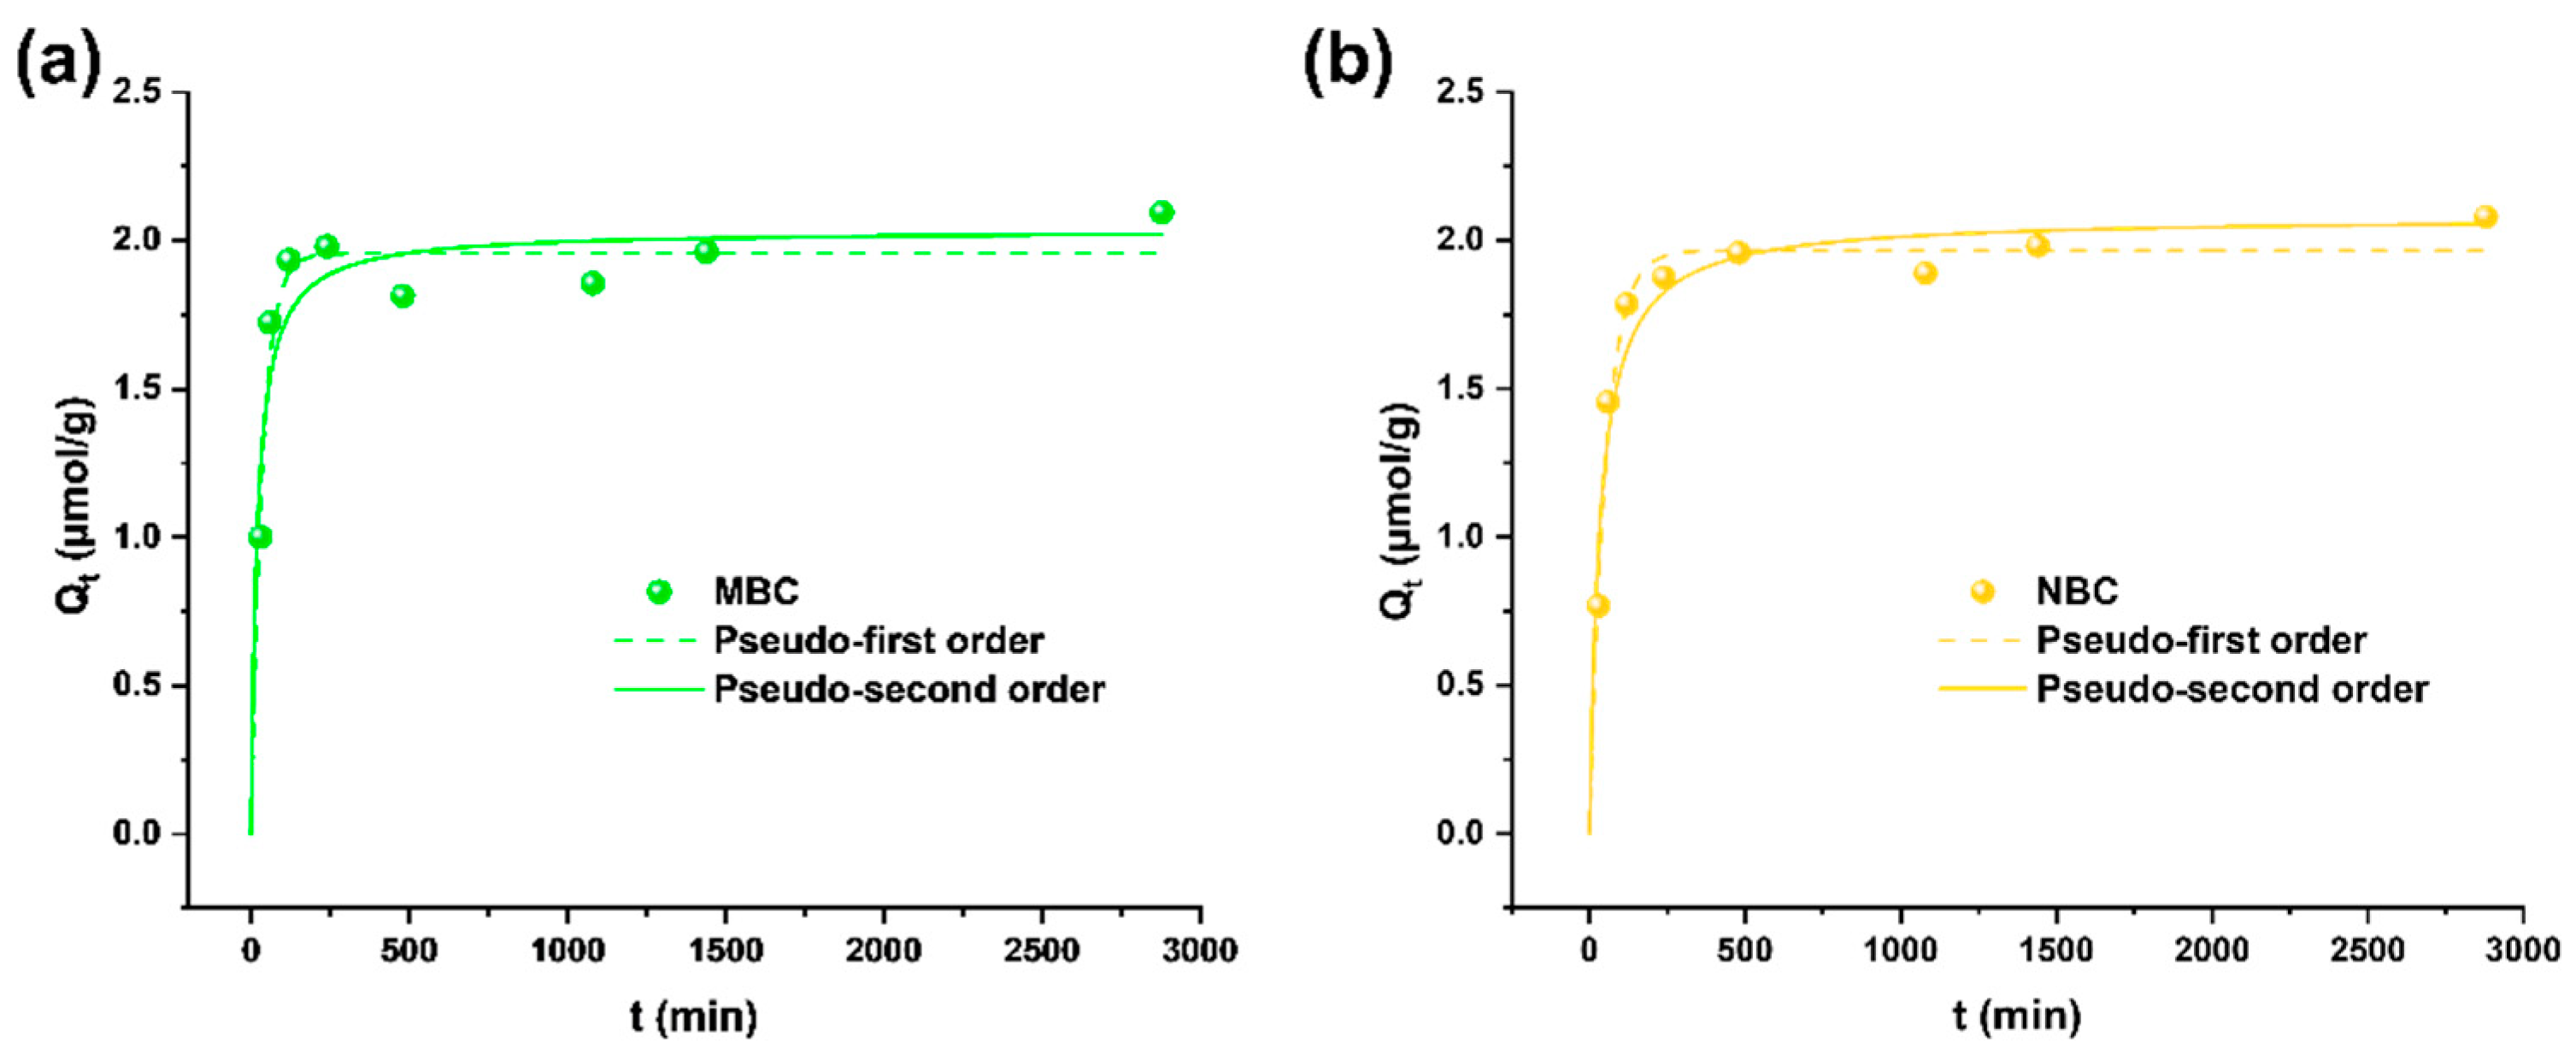
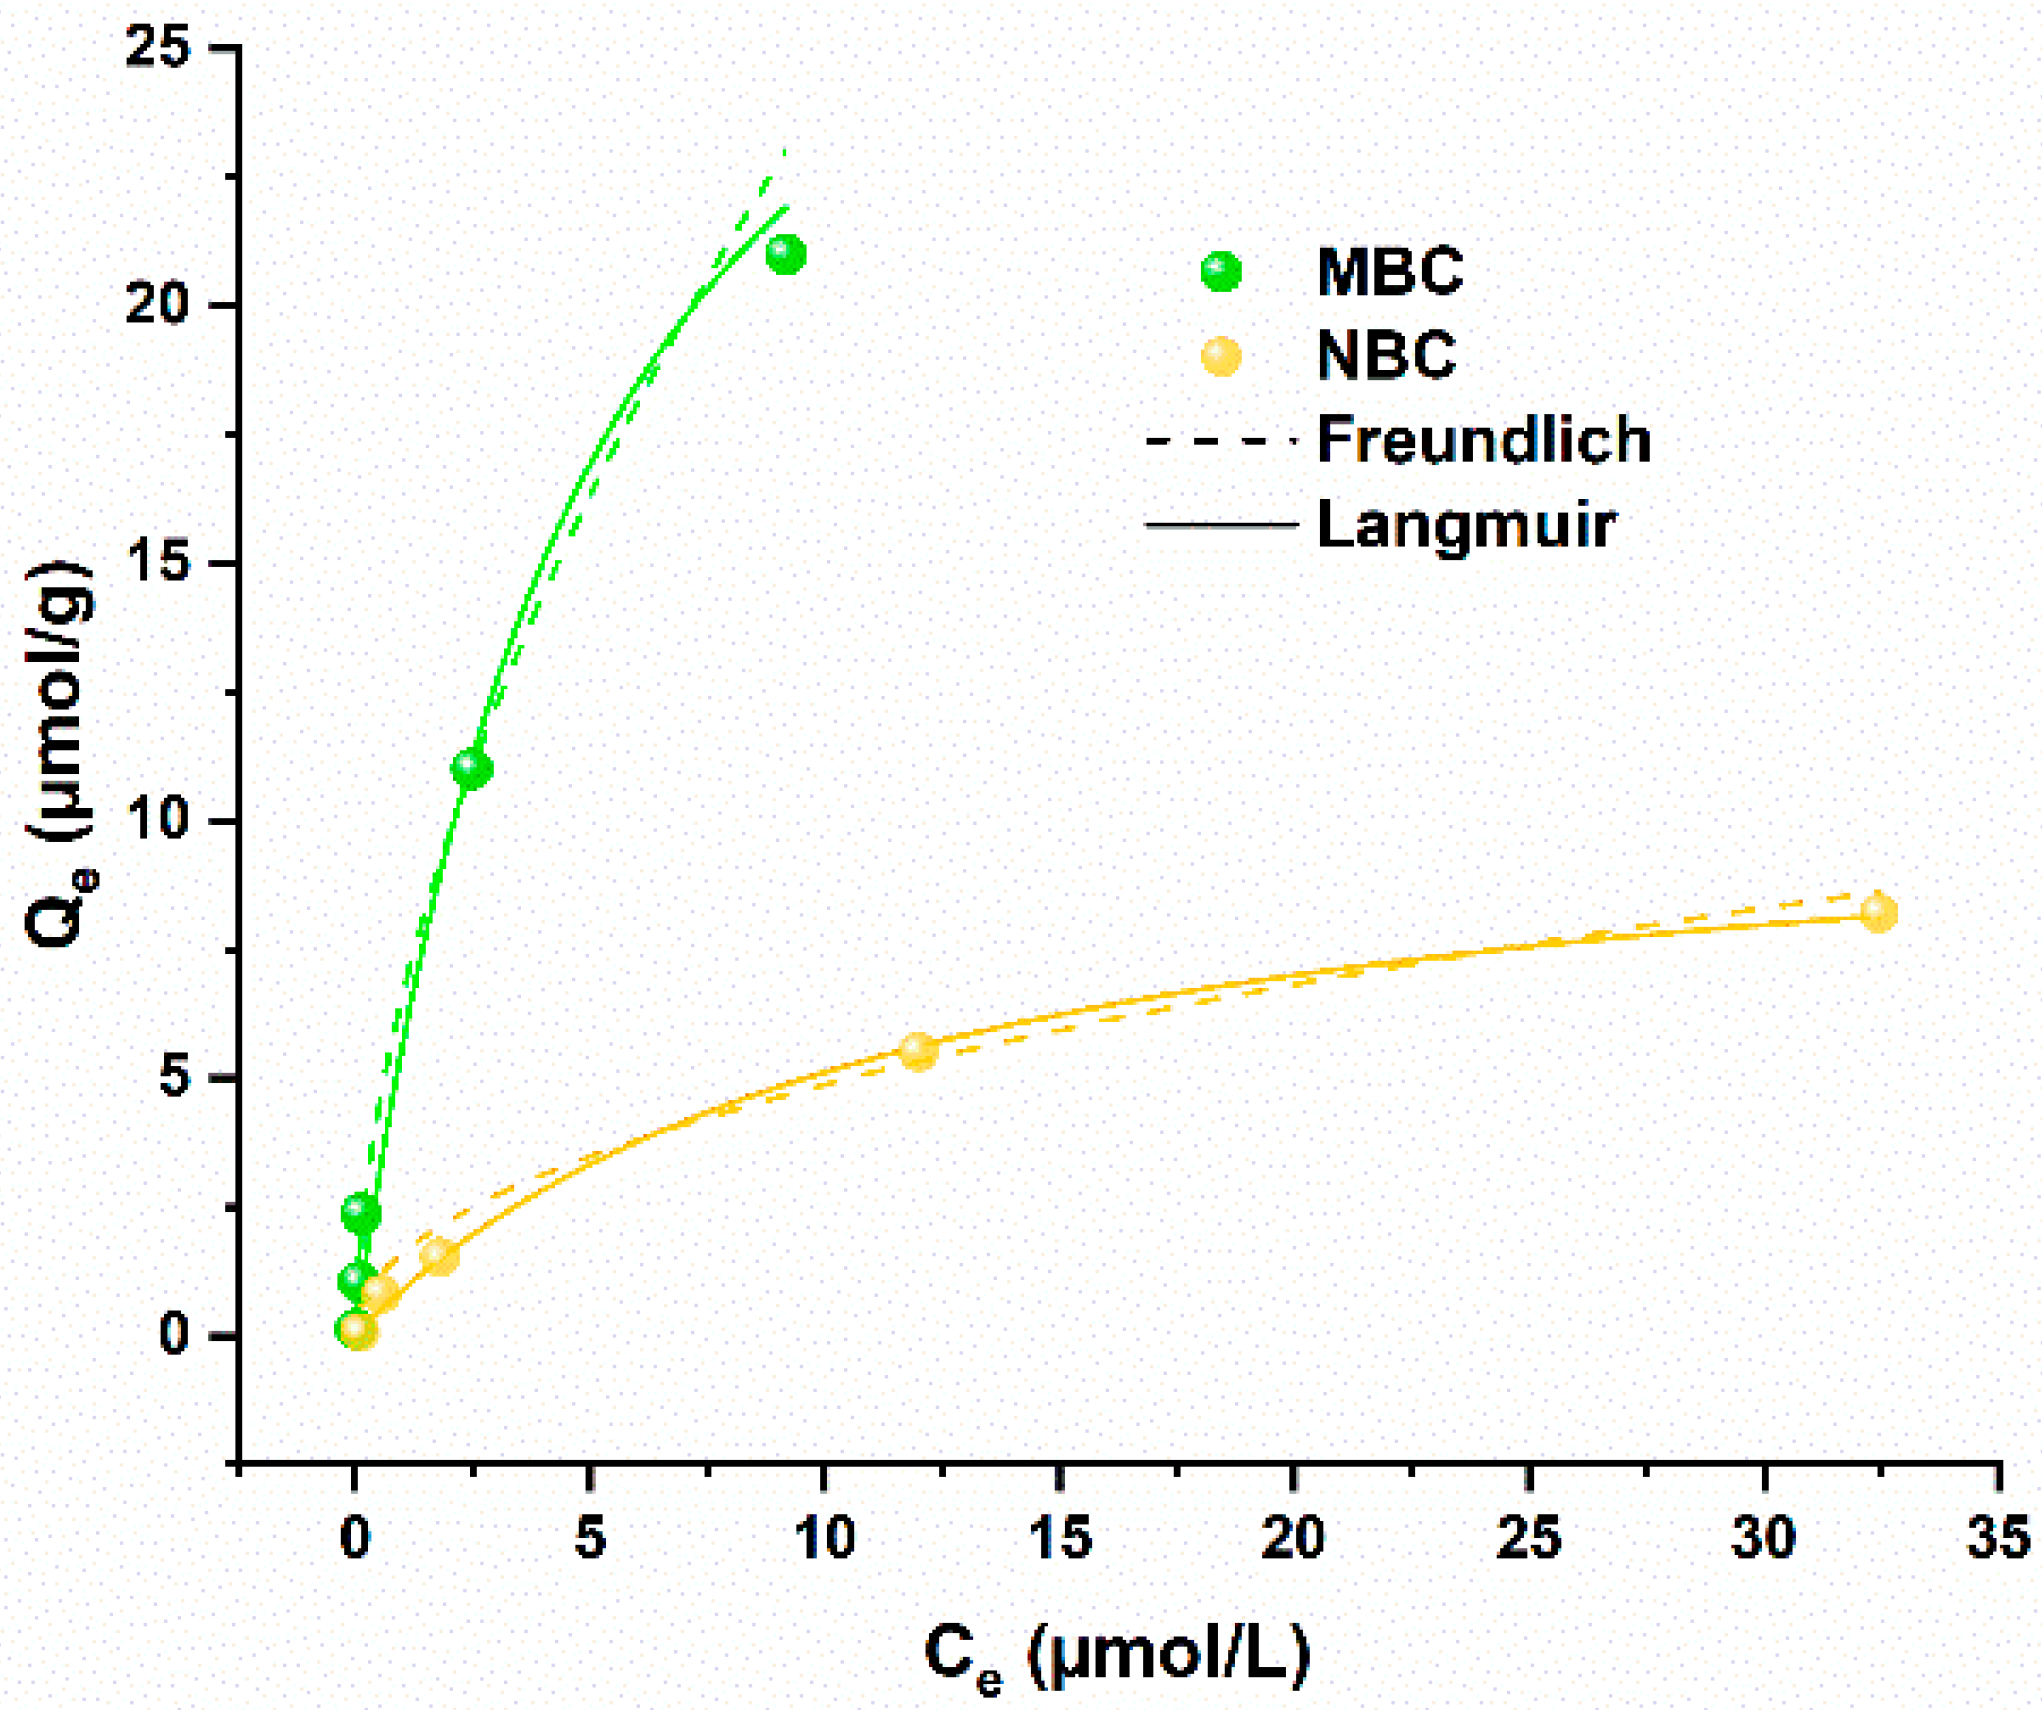
3.1. Kinetics and Equilibrium: Adsorption Mechanisms

Adsorption isotherms and kinetics were tested in ultrapure water containing Pb solutions to elucidate the main adsorption mechanisms of the different biochar materials. The observation of the experimental data (Figure 2) shows a fast adsorption in the first phase of interaction (below 2 h), followed by a lower adsorption rate reaching equilibrium after 24 h, when almost 2 µmol/g (about the 98% of Pb previously in solution) is adsorbed onto both MBC and NBC. This behavior is well in line with the assumption of a pseudo second-order model, meaning that the rate-limiting step is the chemical adsorption step due to surface interactions [45]. Pseudo second order, in fact, better describes the kinetics (Table S2), in accordance with other studies applying biochar from different feedstocks for Pb adsorption [35,40,46]. Finally, SEM-EDX analyses showed the homogeneous presence of Pb on BC surface. However, the low Pb concentration close to the limit of detection of the technique (observed Pb content < 0.4% wt.) made its quantification poorly accurate.
Considering the kinetics of the adsorption process, equilibrium modeling was performed with an experimental time of 24 h under continuous shaking. The results of these tests are depicted in Figure 3. Both the biochar samples present a similar behavior in the equilibrium models, with the Langmuir equation slightly better fitting with the data than the Freundlich equation, considering R2 values (Table S2). This is in accordance with previous literature testing Pb adsorption on biochar and biochar-modified materials [24,35,38,40]. Importantly, MBC showed a much higher adsorption capacity than nutshell-derived biochar, with a Qmax value modeled from the Langmuir function of 33.9 µmol/g against 11.1 µmol/g for NBC (Figure 3).
The kinetics and equilibrium behavior of the biochar obtained from the two feedstocks, as well as their surface functional groups as characterized by the ATR spectra (Figure S1) provide some insights on the adsorption process. The most likely Pb adsorption process of NBC is cationic-π interaction, similarly to other reports in literature showing pseudo-second order kinetics and Langmuir isotherm [47,48]. NBC sample showed also few changes in the IR bands after adsorption: the aromatic C=C peak at 1590 cm−1 reduced in height, while the peaks at 1310 cm−1 (C-O stretching of aromatic esters [49]) and at 1225 cm−1 (phenolic -OH stretching [50]) changed their shapes, further confirming the contribution of aromatic functional groups in the adsorption process [40,51]. MBC, instead, is more prone to adsorb Pb through complexation and co-precipitation processes. The different reshaping of the peak shoulder at 1100 cm−1 (indicating abundant inorganic material) before and after adsorption and the higher concentration of alkaline earth metals in this biochar (already observed in a previous study [14]) further support the formation of Pb precipitates, similarly to other microalgae-derived biochar [24]. Moreover, these processes are already invoked to explain Pb adsorption with similar kinetics and equilibrium behavior on other biochar materials [24,38,52].

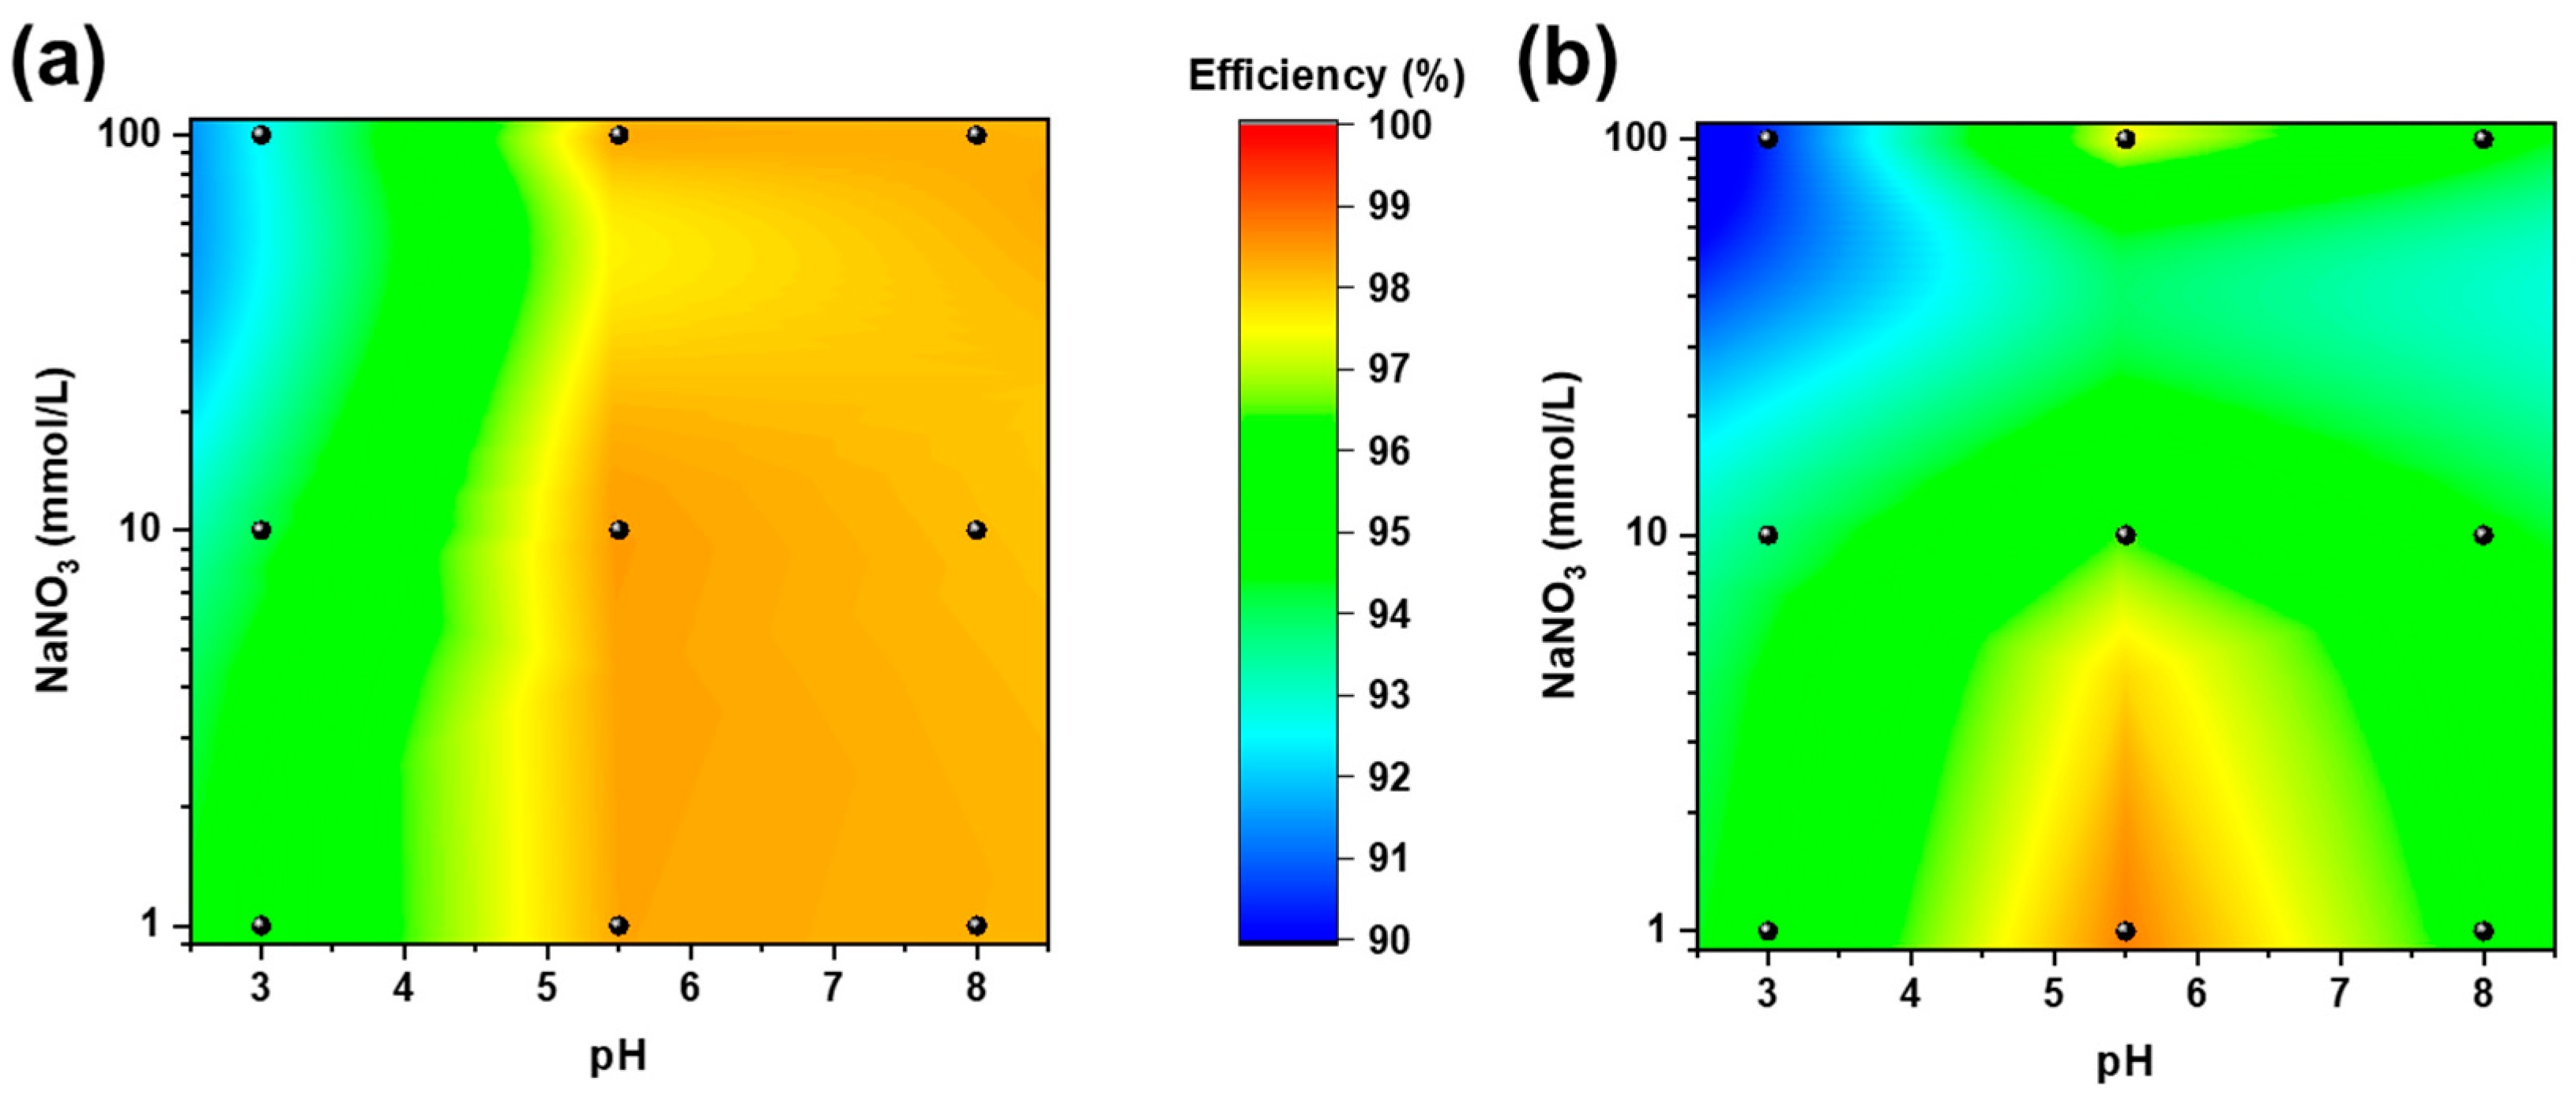
3.2. Effect of Water Chemistry on Adsorption Efficiency

After the preliminary observation of interaction mechanisms and adsorption rates, the role of water chemistry and Pb speciation in water was investigated for a broader application of biochar in adsorption processes.
The adsorption efficiencies of MBC and NBC were evaluated at different pH and ionic strength values according to the 32 full factorial design described in Table 1 (see Figure 4). As a general comment, both biochar materials provided adsorption efficiencies above 90% under all the tested conditions, with MBC showing superior removal performances to those of NBC. This evidence clearly demonstrates the robustness and effectiveness of the Pb removal process on MBC and NBC.
Data were fitted with a second-order polynomial surface including an intercept, two linear terms, two quadratic terms, and an interaction term. Tables S3 and S4 summarize the regression coefficients and the statistical significance of the investigated parameters: the R-squared values of 0.916 and 0.983 for NBC and MBC, respectively, demonstrate the goodness of fit of the multivariate model. The fitted intercept, which refers to the adsorption efficiency in the central point of the design (i.e., pH = 5.5 and 10 μM NaNO3) is slightly higher for MBC compared to NBC (98.4% and 97.2%, respectively), further confirms the superiority of the microalgae-derived biochar. Concerning the other parameters only the linear and quadratic terms of pH results statistically significant at the 95% confidence level whereas all the terms related to the ionic strength and the interaction between pH and NaNO3 concentration resulted not statistically significant: changes in pH slightly influence the absorption of Pb on biochar in a non-linear way, almost independently of the ionic strength of the solution. Both biochar materials showed the lowest adsorption performances at low pH, where H+ easily act as a competitor for reactive sites [53]. Pb adsorption is instead poorly affected by increasing ionic strength for MBC (similar adsorption capacities are observed at 100 mmol/l NaNO3), indicating that the natural self-doping of MBC is likely to enhance the adsorption processes with respect to NBC. Moreover, the dissolution of ashes in MBC are possibly enhancing co-precipitation on its surface also at higher pH [24,54].
Finally, the effect on Pb adsorption of a natural ligand (humic acid) and of a natural lake water were tested. Generally, a slightly better, although barely significant, adsorption efficiency was confirmed for MBC compared to NBC (Table 3). The presence of humic acid, organic matter (Chemical Oxygen Demand value of 18 mg/L, Table S1), and dissolved ions (such as NO3, Ca2+, Mg2+ and SO42−, Table S1) in lake water does not affect the adsorption efficiency for both materials. Such evidence indicates that the adsorption process is highly robust and free from significant interferences.

3.3. Electroanalytical Application

Having proven the superior adsorption properties of MBC, we decided to assess the exploitation of this material to improve the electroanalytical performances of commercial carbon screen-printed electrodes (SPEs) towards lead (II) ions detection via DPAdSV.
SPEs were modified by simply drop-casting 1 μL of a 30 g L−1 ethanolic biochar suspension onto the carbon working electrode (see details in the Materials and Methods section). A comparison of the surface morphology of bare and BC-modified SPE is depicted in Figure 5. BC particles, ranging in size from hundreds of nanometers to tens of micrometers, are abundantly present on the electrode surface after the deposition procedure (Figure 5b), demonstrating the effectiveness of the latter. The covering is not homogeneous, as BC particles tend to agglomerate in suspension. This process is due to different factors: hydrophobic interactions, the binding of lignin functional groups (carboxylic and phenolic) and the reduction in surface charge [55,56]. Finally, most MBC particles exhibit a widespread macro-porosity which possibly contributes to increase the specific surface area and consequently, its surface adsorption and electrochemical features.
Cyclic voltammetry experiments were performed to evaluate the suitability of the biochar-based platforms to be utilized as electrochemical sensors: the MBC is expected to be beneficial in terms of electron transfer kinetic owing to its natural self-doping [14]. The well-known redox couple ferricyanide/ferrocyanide (Fe(CN)63−/Fe(CN)64−) was chosen to investigate the kinetics the electron transfer process at the SPE (Figure 6).
Figure 6a displays the cyclic voltammograms obtained using a 50 mV s−1 scan rate and provides a quick comparison among the investigated electrodes. The peak-to-peak separation (∆Ep) is clearly different when considering SPE-MBC and SPE. In more detail, the ΔEp obtained for the BC-modified electrode is much lower than that of SPE (ΔEp = 240 mV and 405 mV, respectively); this evidence indicates a significant improvement of the electron kinetics at the electrode surface when decorating the SPE with BC. Then, the cyclic voltammetry measurements performed using different scan rates (Figure 6b) were exploited to estimate the standard heterogeneous kinetic rate constant k0 (see Section 2.4.2 for details on the calculation). The latter is a measure of the reversibility of the electron transfer. The modified BC electrode shows a k0 more than twice that of the bare electrode, k0SPE = 4.3 × 10⁻⁴ cm s−1 and k0SPE-MBC = 9.5 × 10⁻⁴ cm s−1; this finding further confirms the beneficial effect in terms of electron transfer rate provided by introducing BC on the SPE. Preliminary experiments were carried out also by depositing biochar suspension having concentrations lower than 30 g L−1 (i.e., 1 and 10 g L−1), but no beneficial effect on the electrochemical performances was observed, which was most likely due to the limited amount of BC deposited on the SPE.
In view of these results, we decided to test these electrodes by means of DPAdSV towards lead (II) ion determination exploiting the improvements in terms of surface area, electron transfer kinetic and lead adsorption achieved by using MBC.
To take advantage of MBC adsorption properties, a 10 min pre-concentration step was carried out in a 0.10 M acetate solution at pH 7.0 without applying any external voltage and using different lead (II) ions contents (ranging from 0.24 μM to 3.84 μM). The adsorbed lead is then electrochemically reduced at −1100 mV before a scan in anodic direction is performed: the faradic process observed at ~700 mV refers to the Pb/Pb2+ oxidation process. Figure 7a displays the DPV profiles obtained for the re-oxidation of lead (II) ions previously adsorbed at the BC-modified SPE surface. DPV oxidation peaks are located at potentials ranging from −698 to −730 mV, but no specific trend related to the Pb concentration was found: these random shifts are most likely due to the normal fluctuation observed for screen-printed electrodes, owing to the presence of a pseudo-reference electrode [57,58]. As expected, the height of the peak increases proportionally with the concentration of the Pb in solution.
Figure 7b displays the relationship between the current peak height and the concentration of Pb in the solution for both SPE and SPE-MBC. This relationship seems not to be linear over the entire investigated range for both the electrodes: a good linearity was observed only up to 1 μM concentration (R2 = 0.994 and 0.998 for SPE and SPE-MBC) with the sensitivity of SPE-MBC approximately twice that of the bare SPE (1.06 μA μM−1 and 0.54 μA μM−1, respectively) within this range, demonstrating an important contribution of MBC in increasing the sensitivity of the analytical method. The repeatability was assessed by comparing sensitivities obtained after three replicated analyses using the same SPE-MBC electrode: a relative standard deviation of 5.5% was found. The reproducibility (using SPE-MBC electrodes produced in different batches) was evaluated in the same way: a relative standard deviation of 8.0% was found. The non-linear signal–concentration correlation can be easily explained by the adsorption mechanism used in this electroanalytical strategy to preconcentrate lead (II) ions: the data fit very well (R2 = 0.993 and 0.996 for SPE-MBC and SPE) with a Langmuir isotherm model (see Figure 7b), which is consistent with the results reported in the previous section regarding Pb removal in aqueous solution. Table 4 summarizes the estimated Langmuir parameters.
The KL values, which measure the magnitude of the adsorbate-electrode surface interaction, suggest that BC-modified electrodes provide only a slightly stronger affinity between lead ions (II) and the electrode surface: the similar K values may be explained by the analogous surface carbon chemistry of SPE and SPE-MBC and the incomplete BC coverage of the SPE.
Conversely, a marked difference was observed when comparing the adsorption capacity (Qm). A much higher Qm was found for the BC-modified SPE thanks to the contribution provided by the biomass-derived material deposited on the electrode surface.

4. Conclusions

In this paper, we systematically evaluated the adsorption of lead (II) ions on biochar obtained from the low temperature pyrolysis of microalgae and nutshells. The kinetic and thermodynamic of the process were comprehensively elucidated for both materials, evidencing the superiority of the microalgae-derived system in adsorbing Pb under model conditions. The investigation of the role of water chemistry and Pb speciation on the adsorption process was carried out: the adsorption efficiency for both MBC and NBC is slightly affected only by the change in pH whereas other parameters such as the presence of dissolved ions and organic matter apparently have no effect on the process proving the robustness of the process. Importantly, whatever the experimental conditions, MBC shows superior performance to NBC, possibly due to the natural self-doping of the former, which offers a much higher degree of surface functionalization (granted by the chemical composition of the biomass feedstock and the low-temperature pyrolysis). Having proven the superiority of MBC in adsorbing lead (II) ions, a preliminary study was carried out to assess the suitability of this material as a modifier to improve the electroanalytical of screen-printed carbon electrodes towards the detection of lead (II) ions via DPAdSV. The decoration with MBC particles was proven to double the sensitivity of the SPE towards Pb determination thanks to enhanced adsorption and electron transfer properties, providing the proof of concept for the use of this material for sensing applications. Moreover, the material proved affordable robustness and selectivity during the adsorption process, further prompting its applicability to natural water samples. Further studies are indeed necessary to produce electrochemical sensors with competitive performances compared to the existing literature.
In summary, the present study highlights the potentialities of biochar produced by the low-temperature pyrolysis of microalgae feedstocks in water remediation and electroanalytical applications, fostering its use in future research.

Supplementary Materials

The following supporting information can be downloaded at: https://www.mdpi.com/article/10.3390/chemosensors10050168/s1, Figure S1: IR spectra; Table S1: Lake water chemical composition; Table S2: Fitted kinetic and thermodynamic data for the adsorption process under model conditions; Table S3: Surface fitting of data obtained for Pb adsorption on NBC; Table S4: Surface fitting of data obtained for Pb adsorption on MBC.

Author Contributions

Conceptualization, D.M., G.B. and D.S.; methodology, G.B. and D.S.; investigation, D.F. and M.Z.; formal analysis, D.F. and G.B.; data curation, D.F., M.Z. and D.S.; writing—original draft preparation, D.S. and G.B.; writing—review and editing, D.M., C.D. and A.P.; visualization, D.S. and G.B.; resources, C.D. and A.P.; supervision, D.M. All authors have read and agreed to the published version of the manuscript.

Funding

This work was funded by Insubria University and by the project “Abissi” supported by the “Banca del Monte di Lombardia” foundation.

Institutional Review Board Statement

Not applicable.

Informed Consent Statement

Not applicable.

Data Availability Statement

All the data relevant to this study are reported in this paper and in the Supplementary Materials.

Acknowledgments

The authors wish to thank “Archimede Ricerche S.r.l.” (Camporosso, Imperia, Italy) for providing Nannochloropsis sp. raw biomass feedstocks used for biochar production.

Conflicts of Interest

The authors declare no conflict of interest.

References

  1. Spanu, D.; Binda, G.; Dossi, C.; Monticelli, D. Biochar as an Alternative Sustainable Platform for Sensing Applications: A Review. Microchem. J. 2020, 159, 105506. [Google Scholar] [CrossRef]
  2. Li, D.C.; Jiang, H. The Thermochemical Conversion of Non-Lignocellulosic Biomass to Form Biochar: A Review on Characterizations and Mechanism Elucidation. Bioresour. Technol. 2017, 246, 57–68. [Google Scholar] [CrossRef]
  3. Wang, D.; Jiang, P.; Zhang, H.; Yuan, W. Biochar Production and Applications in Agro and Forestry Systems: A Review. Sci. Total Environ. 2020, 723, 137775. [Google Scholar] [CrossRef]
  4. Kambo, H.S.; Dutta, A. A Comparative Review of Biochar and Hydrochar in Terms of Production, Physico-Chemical Properties and Applications. Renew. Sustain. Energy Rev. 2015, 45, 359–378. [Google Scholar] [CrossRef]
  5. Yu, K.L.; Show, P.L.; Ong, H.C.; Ling, T.C.; Chen, W.H.; Salleh, M.A.M. Biochar Production from Microalgae Cultivation through Pyrolysis as a Sustainable Carbon Sequestration and Biorefinery Approach. Clean Technol. Environ. Policy 2018, 20, 2047–2055. [Google Scholar] [CrossRef]
  6. Uchimiya, M.; Lima, I.M.; Klasson, K.T.; Wartelle, L.H. Contaminant Immobilization and Nutrient Release by Biochar Soil Amendment: Roles of Natural Organic Matter. Chemosphere 2010, 80, 935–940. [Google Scholar] [CrossRef]
  7. Gibertini, E.; Liberale, F.; Dossi, C.; Binda, G.; Mattioli, B.; Bettinetti, R.; Maspero, A.; Fiore, M.; Ruffo, R.; Magagnin, L. Algae-Derived Hard Carbon Anodes for Na-Ion Batteries. J. Appl. Electrochem. 2021, 51, 1665–1673. [Google Scholar] [CrossRef]
  8. Pinna, M.; Binda, G.; Altomare, M.; Marelli, M.; Dossi, C.; Monticelli, D.; Spanu, D.; Recchia, S. Biochar Nanoparticles over TiO2 Nanotube Arrays: A Green Co-Catalyst to Boost the Photocatalytic Degradation of Organic Pollutants. Catalysts 2021, 11, 1048. [Google Scholar] [CrossRef]
  9. Lee, J.; Kim, K.H.; Kwon, E.E. Biochar as a Catalyst. Renew. Sustain. Energy Rev. 2017, 77, 70–79. [Google Scholar] [CrossRef]
  10. Zhao, J.; Shen, X.-J.; Domene, X.; Alcañiz, J.-M.; Liao, X.; Palet, C. Comparison of Biochars Derived from Different Types of Feedstock and Their Potential for Heavy Metal Removal in Multiple-Metal Solutions. Sci. Rep. 2019, 9, 9869. [Google Scholar] [CrossRef] [Green Version]
  11. Hopkins, D.; Hawboldt, K. Biochar for the Removal of Metals from Solution: A Review of Lignocellulosic and Novel Marine Feedstocks. J. Environ. Chem. Eng. 2020, 8, 103975. [Google Scholar] [CrossRef]
  12. Dai, Y.; Zhang, N.; Xing, C.; Cui, Q.; Sun, Q. The Adsorption, Regeneration and Engineering Applications of Biochar for Removal Organic Pollutants: A Review. Chemosphere 2019, 223, 12–27. [Google Scholar] [CrossRef]
  13. Tomczyk, A.; Sokołowska, Z.; Boguta, P. Biochar Physicochemical Properties: Pyrolysis Temperature and Feedstock Kind Effects. Rev. Environ. Sci. Bio/Technol. 2020, 19, 191–215. [Google Scholar] [CrossRef] [Green Version]
  14. Binda, G.; Spanu, D.; Bettinetti, R.; Magagnin, L.; Pozzi, A.; Dossi, C. Comprehensive Comparison of Microalgae-Derived Biochar from Different Feedstocks: A Prospective Study for Future Environmental Applications. Algal Res. 2020, 52, 102103. [Google Scholar] [CrossRef]
  15. Angın, D.; Altintig, E.; Köse, T.E. Influence of Process Parameters on the Surface and Chemical Properties of Activated Carbon Obtained from Biochar by Chemical Activation. Bioresour. Technol. 2013, 148, 542–549. [Google Scholar] [CrossRef]
  16. Fernandes, J.O.; Bernardino, C.A.R.; Mahler, C.F.; Santelli, R.E.; Braz, B.F.; Borges, R.C.; da Cunha Veloso, M.C.; Romeiro, G.A.; Cincotto, F.H. Biochar Generated from Agro-Industry Sugarcane Residue by Low Temperature Pyrolysis Utilized as an Adsorption Agent for the Removal of Thiamethoxam Pesticide in Wastewater. Water Air Soil Pollut. 2021, 232, 67. [Google Scholar] [CrossRef]
  17. Xu, X.; Cao, X.; Zhao, L.; Wang, H.; Yu, H.; Gao, B. Removal of Cu, Zn, and Cd from Aqueous Solutions by the Dairy Manure-Derived Biochar. Environ. Sci. Pollut. Res. 2013, 20, 358–368. [Google Scholar] [CrossRef]
  18. Bordoloi, N.; Goswami, R.; Kumar, M.; Kataki, R. Biosorption of Co (II) from Aqueous Solution Using Algal Biochar: Kinetics and Isotherm Studies. Bioresour. Technol. 2017, 244, 1465–1469. [Google Scholar] [CrossRef]
  19. Yu, K.L.; Lau, B.F.; Show, P.L.; Ong, H.C.; Ling, T.C.; Chen, W.-H.; Ng, E.P.; Chang, J.-S. Recent Developments on Algal Biochar Production and Characterization. Bioresour. Technol. 2017, 246, 2–11. [Google Scholar] [CrossRef]
  20. Hung, C.M.; Huang, C.P.; Hsieh, S.L.; Tsai, M.L.; Chen, C.W.; Dong, C.D. Biochar Derived from Red Algae for Efficient Remediation of 4-Nonylphenol from Marine Sediments. Chemosphere 2020, 254, 126916. [Google Scholar] [CrossRef]
  21. Plácido, J.; Bustamante-López, S.; Meissner, K.E.; Kelly, D.E.; Kelly, S.L. Microalgae Biochar-Derived Carbon Dots and Their Application in Heavy Metal Sensing in Aqueous Systems. Sci. Total Environ. 2019, 656, 531–539. [Google Scholar] [CrossRef] [Green Version]
  22. Law, X.N.; Cheah, W.Y.; Chew, K.W.; Ibrahim, M.F.; Park, Y.-K.; Ho, S.-H.; Show, P.L. Microalgal-Based Biochar in Wastewater Remediation: Its Synthesis, Characterization and Applications. Environ. Res. 2022, 204, 111966. [Google Scholar] [CrossRef]
  23. Choi, Y.-K.; Choi, T.-R.; Gurav, R.; Bhatia, S.K.; Park, Y.-L.; Kim, H.J.; Kan, E.; Yang, Y.-H. Adsorption Behavior of Tetracycline onto Spirulina sp. (Microalgae)-Derived Biochars Produced at Different Temperatures. Sci. Total Environ. 2020, 710, 136282. [Google Scholar] [CrossRef]
  24. Yang, Z.; Hou, J.; Wu, J.; Miao, L. The Effect of Carbonization Temperature on the Capacity and Mechanisms of Pb(II) Adsorption by Microalgae Residue-Derived Biochar. Ecotoxicol. Environ. Saf. 2021, 225, 112750. [Google Scholar] [CrossRef]
  25. Gidlow, D.A. Lead Toxicity. Occup. Med. 2004, 54, 76–81. [Google Scholar] [CrossRef] [Green Version]
  26. Cuomo, D.; Foster, M.J.; Threadgill, D. Systemic Review of Genetic and Epigenetic Factors Underlying Differential Toxicity to Environmental Lead (Pb) Exposure. Environ. Sci. Pollut. Res. 2022; in press. [Google Scholar] [CrossRef]
  27. Zulfiqar, U.; Farooq, M.; Hussain, S.; Maqsood, M.; Hussain, M.; Ishfaq, M.; Ahmad, M.; Anjum, M.Z. Lead Toxicity in Plants: Impacts and Remediation. J. Environ. Manag. 2019, 250, 109557. [Google Scholar] [CrossRef]
  28. Binda, G.; Pozzi, A.; Livio, F. An Integrated Interdisciplinary Approach to Evaluate Potentially Toxic Element Sources in a Mountainous Watershed. Environ. Geochem. Health 2020, 42, 1255–1272. [Google Scholar] [CrossRef]
  29. Evans, J.; Pashley, V.; Madgwick, R.; Neil, S.; Chenery, C. Tracking Natural and Anthropogenic Pb Exposure to Its Geological Source. Sci. Rep. 2018, 8, 1969. [Google Scholar] [CrossRef] [Green Version]
  30. Cheng, H.; Hu, Y. Lead (Pb) Isotopic Fingerprinting and Its Applications in Lead Pollution Studies in China: A Review. Environ. Pollut. 2010, 158, 1134–1146. [Google Scholar] [CrossRef]
  31. Oliveira, G.A.; Gevaerd, A.; Mangrich, A.S.; Marcolino-Junior, L.H.; Bergamini, M.F. Biochar Obtained from Spent Coffee Grounds: Evaluation of Adsorption Properties and Its Application in a Voltammetric Sensor for Lead (II) Ions. Microchem. J. 2021, 165, 106114. [Google Scholar] [CrossRef]
  32. Monticelli, D.; Castelletti, A.; Civati, D.; Recchia, S.; Dossi, C. How to Efficiently Produce Ultrapure Acids. Int. J. Anal. Chem. 2019, 2019, 5180610. [Google Scholar] [CrossRef]
  33. Spanu, D.; Butti, L.; Boldrocchi, G.; Bettinetti, R.; Monticelli, D. High-Throughput, Multi-Batch System for the Efficient Microwave Digestion of Biological Samples. Anal. Sci. 2020, 36, 889–892. [Google Scholar] [CrossRef] [Green Version]
  34. Binda, G.; Pozzi, A.; Livio, F.; Piasini, P.; Zhang, C. Anomalously High Concentration of Ni as Sulphide Phase in Sediment and in Water of a Mountain Catchment with Serpentinite Bedrock. J. Geochem. Explor. 2018, 190, 58–68. [Google Scholar] [CrossRef]
  35. Sun, C.; Chen, T.; Huang, Q.; Wang, J.; Lu, S.; Yan, J. Enhanced Adsorption for Pb(II) and Cd(II) of Magnetic Rice Husk Biochar by KMnO4 Modification. Environ. Sci. Pollut. Res. 2019, 26, 8902–8913. [Google Scholar] [CrossRef]
  36. Yu, W.; Lian, F.; Cui, G.; Liu, Z. N-Doping Effectively Enhances the Adsorption Capacity of Biochar for Heavy Metal Ions from Aqueous Solution. Chemosphere 2018, 193, 8–16. [Google Scholar] [CrossRef]
  37. Caporale, A.G.; Pigna, M.; Sommella, A.; Conte, P. Effect of Pruning-Derived Biochar on Heavy Metals Removal and Water Dynamics. Biol. Fertil. Soils 2014, 50, 1211–1222. [Google Scholar] [CrossRef] [Green Version]
  38. Park, J.-H.; Ok, Y.S.; Kim, S.-H.; Cho, J.-S.; Heo, J.-S.; Delaune, R.D.; Seo, D.-C. Competitive Adsorption of Heavy Metals onto Sesame Straw Biochar in Aqueous Solutions. Chemosphere 2016, 142, 77–83. [Google Scholar] [CrossRef]
  39. Wang, Z.; Liu, G.; Zheng, H.; Li, F.; Ngo, H.H.; Guo, W.; Liu, C.; Chen, L.; Xing, B. Investigating the Mechanisms of Biochar’s Removal of Lead from Solution. Bioresour. Technol. 2015, 177, 308–317. [Google Scholar] [CrossRef]
  40. Wu, Q.; Xian, Y.; He, Z.; Zhang, Q.; Wu, J.; Yang, G.; Zhang, X.; Qi, H.; Ma, J.; Xiao, Y.; et al. Adsorption Characteristics of Pb(II) Using Biochar Derived from Spent Mushroom Substrate. Sci. Rep. 2019, 9, 15999. [Google Scholar] [CrossRef] [Green Version]
  41. Binda, G.; Frascoli, F.; Spanu, D.; Ferrario, M.F.; Terrana, S.; Gambillara, R.; Trotta, S.; Noble, P.J.; Livio, F.A.; Pozzi, A.; et al. Geochemical Markers as a Tool for the Characterization of a Multi-Layer Urban Aquifer: The Case Study of Como (Northern Italy). Water 2022, 14, 124. [Google Scholar] [CrossRef]
  42. Cancelliere, R.; Carbone, K.; Pagano, M.; Cacciotti, I.; Micheli, L. Biochar from Brewers’ Spent Grain: A Green and Low-Cost Smart Material to Modify Screen-Printed Electrodes. Biosensors 2019, 9, 139. [Google Scholar] [CrossRef]
  43. Nicholson, R.S. Theory and Application of Cyclic Voltammetry for Measurement of Electrode Reaction Kinetics. Anal. Chem. 1965, 37, 1351–1355. [Google Scholar] [CrossRef]
  44. Lavagnini, I.; Antiochia, R.; Magno, F. An Extended Method for the Practical Evaluation of the Standard Rate Constant from Cyclic Voltammetric Data. Electroanalysis 2004, 16, 505–506. [Google Scholar] [CrossRef]
  45. Inyang, M.I.; Gao, B.; Yao, Y.; Xue, Y.; Zimmerman, A.; Mosa, A.; Pullammanappallil, P.; Ok, Y.S.; Cao, X. A Review of Biochar as a Low-Cost Adsorbent for Aqueous Heavy Metal Removal. Crit. Rev. Environ. Sci. Technol. 2016, 46, 406–433. [Google Scholar] [CrossRef]
  46. Wang, C.; Wang, H.; Cao, Y. Pb(II) Sorption by Biochar Derived from Cinnamomum Camphora and Its Improvement with Ultrasound-Assisted Alkali Activation. Colloids Surf. A Physicochem. Eng. Asp. 2018, 556, 177–184. [Google Scholar] [CrossRef]
  47. Zuo, X.; Liu, Z.; Chen, M. Effect of H2O2 Concentrations on Copper Removal Using the Modified Hydrothermal Biochar. Bioresour. Technol. 2016, 207, 262–267. [Google Scholar] [CrossRef]
  48. Cheng, X.; Deng, J.; Li, X.; Wei, X.; Shao, Y.; Zhao, Y. Layered Double Hydroxides Loaded Sludge Biochar Composite for Adsorptive Removal of Benzotriazole and Pb(II) from Aqueous Solution. Chemosphere 2022, 287, 131966. [Google Scholar] [CrossRef]
  49. Nakahara, M.; Sanada, Y. FT-IR ATR Spectroscopy of the Edge Surface of Pyrolytic Graphite and Its Surface/PVC Interface. J. Mater. Sci. 1995, 30, 4363–4368. [Google Scholar] [CrossRef]
  50. Jiang, Y.F.; Sun, H.; Yves, U.J.; Li, H.; Hu, X.F. Impact of Biochar Produced from Post-Harvest Residue on the Adsorption Behavior of Diesel Oil on Loess Soil. Environ. Geochem. Health 2016, 38, 243–253. [Google Scholar] [CrossRef]
  51. Wu, J.; Wang, T.; Zhang, Y.; Pan, W.P. The Distribution of Pb(II)/Cd(II) Adsorption Mechanisms on Biochars from Aqueous Solution: Considering the Increased Oxygen Functional Groups by HCl Treatment. Bioresour. Technol. 2019, 291, 121859. [Google Scholar] [CrossRef]
  52. Li, H.; Dong, X.; da Silva, E.B.; de Oliveira, L.M.; Chen, Y.; Ma, L.Q. Mechanisms of Metal Sorption by Biochars: Biochar Characteristics and Modifications. Chemosphere 2017, 178, 466–478. [Google Scholar] [CrossRef] [PubMed]
  53. Binda, G.; Spanu, D.; Monticelli, D.; Pozzi, A.; Bellasi, A.; Bettinetti, R.; Carnati, S.; Nizzetto, L. Unfolding the Interaction between Microplastics and (Trace) Elements in Water: A Critical Review. Water Res. 2021, 204, 117637. [Google Scholar] [CrossRef] [PubMed]
  54. Fidel, R.B.; Laird, D.A.; Thompson, M.L.; Lawrinenko, M. Characterization and Quantification of Biochar Alkalinity. Chemosphere 2017, 167, 367–373. [Google Scholar] [CrossRef] [Green Version]
  55. Tansel, B.; Boglaienko, D. Characterization of Aggregation and Declustering Tendency of Hydrophobic Fine Particles in Water. Granul. Matter 2019, 21, 34. [Google Scholar] [CrossRef]
  56. Ramanayaka, S.; Vithanage, M.; Alessi, D.S.; Liu, W.J.; Jayasundera, A.C.A.; Ok, Y.S. Nanobiochar: Production, Properties, and Multifunctional Applications. Environ. Sci. Nano 2020, 7, 3279–3302. [Google Scholar] [CrossRef]
  57. Jian, J.M.; Liu, Y.Y.; Zhang, Y.L.; Guo, X.S.; Cai, Q. Fast and Sensitive Detection of Pb2+ in Foods Using Disposable Screen-Printed Electrode Modified by Reduced Graphene Oxide. Sensors 2013, 13, 13063–13075. [Google Scholar] [CrossRef] [PubMed] [Green Version]
  58. Dossi, C.; Binda, G.; Monticelli, D.; Pozzi, A.; Recchia, S.; Spanu, D. Exploiting Laser-Ablation ICP-MS for the Characterization of Salt-Derived Bismuth Films on Screen-Printed Electrodes: A Preliminary Investigation. Biosensors 2020, 10, 119. [Google Scholar] [CrossRef]
Figure 1. Sketch representation of the steps involved in the modification of the screen-printed electrode with biochar.
Chemosensors 10 00168 g001
Figure 2. Adsorption kinetics of MBC (a) and NBC (b) in 5 µmol/L Pb solutions in ultrapure water. Pseudo first-order and pseudo second-order fittings are depicted as dashed and solid lines, respectively.
Chemosensors 10 00168 g002
Figure 3. Adsorption isotherms of MBC (in green) and NBC (in yellow) in Pb solution in ultrapure water. Freundlich and Langmuir isotherm models are depicted as dashed and solid lines, respectively.
Chemosensors 10 00168 g003
Figure 4. Adsorption efficiencies of MBC (a) and NBC (b) at varying pH (on the x axis) and NaNO3 concentrations (on the y axis in log scale) according to the 32 full factorial design described in Table 1.
Chemosensors 10 00168 g004
Figure 5. SEM top-view images of (a) the bare SPE and (b) the SPE after biochar drop-casting deposition (Inset: magnified top-view image).
Chemosensors 10 00168 g005
Figure 6. (a) Cyclic voltammograms for the ferricyanide/ferrocyanide couple (scan speed = 50 mV/s) obtained using the bare and BC-modified SPE. (b) Cyclic voltammograms for the ferricyanide/ferrocyanide couple at different scan speeds (25–4000 mV/s range) obtained using SPE-MBC. Inset: linearization for k0 calculation.
Chemosensors 10 00168 g006
Figure 7. (a) Voltammograms (subtracted from the baseline) obtained after the adsorption of increasing amount of Pb2+ on SPE-MBC. (b) Fitting of the peak height values obtained for SPE and SPE-MBC with the Langmuir equation.
Chemosensors 10 00168 g007
Table 1. Levels of parameters used in the 32 full factorial design.
FactorLow Level (−1)Intermediate Level (0)High Level (+1)
pH3.05.58.0
NaNO31 mmol/L10 mmol/L100 mmol/L
Table 2. Conditions used for cyclic voltammetry measurements.
Scan Speeds (mV/s)Starting Potential (mV)Switching Potential (mV)Step
Potential (mV)
Step Time (ms)Gas Purging Time
(s)
Stirring
(rpm)
25800−5005200300300
50800−5005100300300
100800−500550300300
200800−500525300300
1000800−5002525300300
2000800−5002512.5300300
4000800−500256.25300300
Table 3. Adsorption efficiencies of the two biochar materials at varying HA concentrations and in lake water spiked sample.
Pb Containing SolutionMBC Efficiency (%)NBC Efficiency (%)
Ultrapure water97.5 ± 0.898.6 ± 2.3
1 mg/L HA98.0 ± 0.896.3 ± 2.0
10 mg/L HA97.7 ± 1.092.4 ± 5.0
Lake water99.0 ± 1.497.5 ± 3.0
Table 4. Langmuir parameters obtained by fitting DPAdSV data reported in Figure 7b.
ElectrodeQm (μmol g−1)KLR2
SPE-MBC8.2 ± 1.90.12 ± 0.040.993
SPE5.5 ± 1.30.09 ± 0.030.996
Publisher’s Note: MDPI stays neutral with regard to jurisdictional claims in published maps and institutional affiliations.

