Investigation of the Applicability of Raman Spectroscopy as Online Process Control during Consumer Milk Production


1
Institute of Process Engineering in Life Sciences: Food Process Engineering, Karlsruhe Institute of Technology, Kaiserstraße 12, 76131 Karlsruhe, Germany
2
Fraunhofer Institute for Manufacturing Engineering and Automation (IPA), Nobelstraße 12, 70569 Stuttgart, Germany
3
Soft Matter Science and Dairy Technology, University of Hohenheim, Garbenstraße 21, 70599 Stuttgart, Germany
*
Author to whom correspondence should be addressed.
ChemEngineering 2020, 4(3), 45; https://doi.org/10.3390/chemengineering4030045
Submission received: 20 May 2020
/
Revised: 22 June 2020
/
Accepted: 16 July 2020
/
Published: 19 July 2020
(This article belongs to the Special Issue Emulsion Process Design)
Abstract
:Online detection of product defects using fast spectroscopic measurements is beneficial for producers in the dairy industry since it allows readjustment of product characteristics or redirection of product streams during production. Raman spectroscopy has great potential for such application due to the fast and simple measurement. Its suitability as online sensor for process control was investigated at typical control points in consumer milk production being raw milk storage, standardization, and heat treatment. Additionally, the appropriateness of Raman spectroscopy to act as indicator for product application parameters was investigated using the example of barista foam. To assess the suitability of a pure online system, the merit of Raman spectra was evaluated by a principal component analysis (PCA). Thereby, proteolytic spoilage due to the presence of extracellular enzymes of Pseudomonas sp. was detected and samples based on the applied heat treatment (extended shelf life (ESL) and ultra-high temperature (UHT)) could be separated. A correlation of the content of free fatty acids and foam stability with spectra of the respective milk samples was found, allowing a prediction of the technofunctional quality criterion “Barista” suitability of a UHT milk. The results underlined the suitability of Raman spectroscopy for the detection of deviations from a defined product standard of consumer milk.
1. Introduction
The consistent quality of food products is one major aspect during production. Although, increasing levels of automation accelerate production processes, the integration of conventional, time-consuming offline methods for quality control causes problems. Thus, an increasing demand for on-line sensors with a short response time that can be applied as means of process control is found. The rapid prediction of technofunctional attributes on the basis of process data in combination with short response times could increase production efficiency.
Here, the early detection of product defects by simple measurements such as spectroscopy would be of great value for producers in the food industry. It would allow the adjustment of product characteristics or the redirection of product streams during production. The process parameters that have to be controlled vary largely depending on the specific properties of the product. Consumer milk is one of the most produced food products due to its good availability and high nutritional value [1]. In this product group, important parameters that require constant control are microbial spoilage in raw milk, heat-treatment as a means to inactivate microorganisms and enzymes, and to control whey protein denaturation, as well as the content of major ingredients, such as fat, protein, and lactose. Nowadays, the new quality parameter “foamability” and “foam stability” became more important due to the increasing consumption of specialty coffees like cappuccino [2,3,4]. A lot of studies focus on avoiding milk foaming during, e.g., packaging, but the growing market of foamed beverages requires the comprehension and prediction of milk foamability and foam stability for these milk products.
In Germany, the storage time of raw milk at dairy farms after milk collection varies between 1 and 3 days. Further storage of the raw milk in the dairy takes from 24 h up to a maximum of 72 h [5]. During these cold storages, the microbiota shifts towards psychrotolerant microorganisms [6], Particularly towards Pseudomonas sp. [7], which can outgrow the other bacteria of the raw milk microbiota. Even though the vegetative cells of Pseudomonas sp. are inactivated by pasteurization [8], their extracellular peptidases persist UHT-treatments [9] and can therefore still be active in the final product. These peptidases can cause bitterness, particle formation, creaming/sedimentation, and gelation and comes into effect especially in UHT milk due to its long shelf-life [10]. In general, this allows the prediction of UHT milk shelf life, but one major drawback is the time-consuming prediction on the basis of visual product defects.
The major constituents of cow’s milk are fat, protein, and lactose. The quantity of all constituents has to be labelled and serves as an important quality characteristic for consumer milk. This applies in particular for consumer milk, where consumers can choose between a variety of fat contents or for market innovations like lactose-free milk. Quantification of major milk constituents is performed using Fourier-transform infrared spectroscopy (FTIR).
Heat treatment of milk is very important in terms of safety and quality. Main aims of this process step are the reduction of the microbial population, inactivation of enzymes, and the minimization of chemical reactions and physical changes [11]. Depending on the applied heat treatment/temperature–time combination, a differentiation between pasteurized, extended shelf life (ESL), and ultrahigh temperature (UHT) milk is made. The two main proceedings for the production of ESL milk are higher-heat shorter time (ESL-HHST) and a combination of microfiltration and pasteurization (ESL-MF). The differentiation between these products can be done, for instance, by the determination of the whey protein denaturation degree using a time- and material-consuming high-performance liquid chromatography (HPLC).
The “foamability” and “foam stability” are meanwhile a technofunctional quality criterion of a UHT-milk used for foamed beverages such as cappuccino. An average milk foam stability of 10–15 min is generally expected [12]. Foam stability is the ability of foam to retain its volume under specific conditions over a certain period of time. A foam is defined as the dispersion of gas bubbles in a liquid [13]. Dairy foams are colloidal systems produced with gas, water, surfactant, i.e., protein [14], and energy. One reason for unstable whole milk foams is the presence of polar lipids like free fatty acids (FFA), which are able to displace proteins from the air–liquid interface leading to a weakening of the elastic film [15]. This leads to coalescence and destabilization of the foam [16]. The prediction of foam stability could minimize complaints by redirection to product applications independent of milk foamability.
Major advantages of Raman spectroscopy for safety and quality analysis are the fast and nondestructive measurements and the elimination of time- and material-consuming sample preparations, e.g., in Dumas method, HPLC, or enzymatic methods. The advantage of Raman spectroscopy over, e.g., infrared (IR) spectroscopy is savings of time and material, i.e., rinsing solutions. Additionally, Raman spectroscopy offers the advantage of a weak O-H stretching vibration, thus a low interference of the water signal allowing a sensitive analysis [17,18,19,20]. Water strongly absorbs infrared light, which can interfere with peaks for the quantification of trace amounts. This low interference of the water signal in Raman spectroscopy enables the detection of milk adulteration with several adulterants, e.g., melamine or urea [19,21,22,23,24]. Additionally, the quantification of fat [25,26], protein content [27], and level of fat unsaturation in milk [28] as well as the detection of various pathogens [29,30,31,32] was successfully shown.
The aim of this work is to investigate whether Raman spectroscopy can be used as on-line sensor at typical control points in consumer milk production for process control and the early detection of product defects. Measurements in this work were carried out offline in order to assess the general feasibility of using Raman spectroscopy to detect product defects, future experiments should then apply the sensor on-line during processing of cow’s milk. In addition, the suitability of Raman spectroscopy to act as indicator for product application parameters is investigated using the example of milk foam stability.
2. Materials and Methods
2.1. Samples
In this study, commercially available milk samples were purchased at a local grocery store. Samples with different fat content (0.1, 1.5, and 3.8%) and lactose content were purchased (<0.1 and 4.5 g/L), as well as products with different heat treatments (past, ESL, and UHT) were bought. To investigate whether Raman spectroscopy can be applied to detect product defects, only one milk property was varied at a time. Products from varying dairies were selected to ensure (statistical) representation. The manufacturers of purchased samples are listed in Table 1.
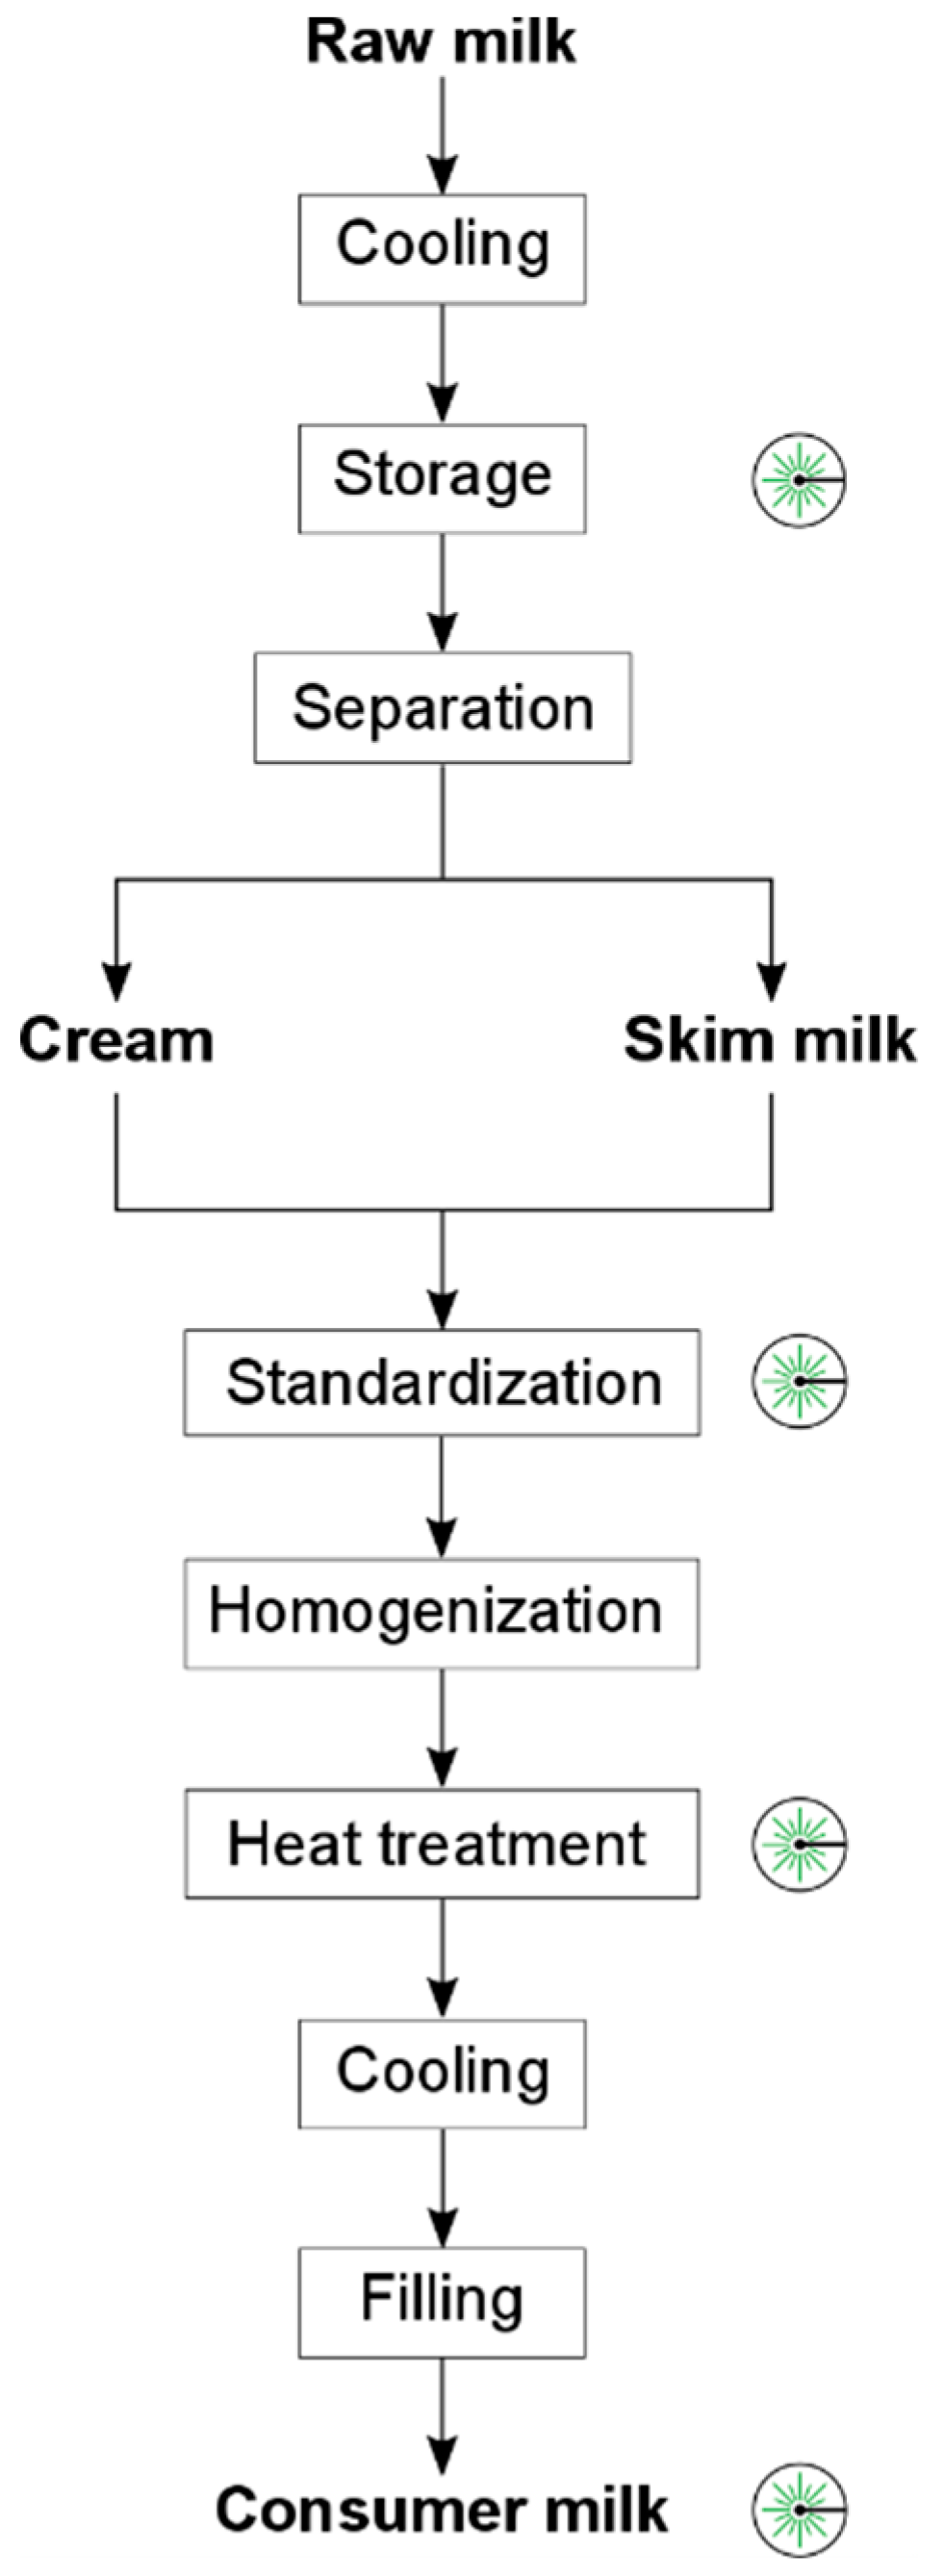
Pasteurized milk (3.5% fat) for storage tests (see Section 2.4) was produced at the Dairy for Research and Training at University of Hohenheim (Stuttgart, Germany) with raw milk from the Meiereihof of the University. In addition, Figure 1 depicts the general production scheme of consumer milk. Control points at which Raman measurements were performed to evaluate the possibility of controlling product properties and the early detection of specific product defects are marked.
2.2. Raman Spectroscopic Measurements
Raman measurements were carried out using an inno spec Raman 785 Spectrometer (inno-spec GmbH, Nuremberg, Germany) with a laser excitation wavelength of 784.98 nm. Samples were placed 6 mm underneath the temperature-stabilized laser to ensure proper focusing on the sample. The signal was collected on a thermoelectric cooled back-thinned charge-coupled device (CCD) detector. All Raman spectra consisted of three accumulated scans at 1 cm−1 resolution across the spectral range of 65–3290 cm−1. For all samples, an integration time (IT) of 10,000 ms was applied resulting in a total measurement time of 30 s.
For spectra acquisition, 50 mL of milk was transferred into a petri dish. Spectra were taken at different positions to consider sample inhomogeneity. For one product, three spectra of three samples were taken resulting in nine spectra. All measurements were conducted at room temperature.
2.3. Inoculation with Pseudomonas sp. and Storage Test
For the evaluation of Pseudomonas sp. peptidase activity via Raman spectroscopy, pasteurized whole milk (3.5% fat) was inoculated with strain W15a. The strain was kindly provided by the Technology and Food Science Unit of the Institute for Agricultural and Fisheries Research (Melle, Belgium). Preparation of the inoculum was carried out as described in [32]. In brief, pellets obtained from cell suspensions of incubated tryptic soy broth (Carl Roth®, Karlsruhe, Germany) were resuspended in UHT milk and stored at 6 °C for 24 h to allow the bacteria to adapt to the milk medium and cold storage conditions. After 24 h, pasteurized milk was inoculated with Pseudomonas sp. to a cell count of approximately 105 cfu mL−1. The cell count of pasteurized milk 5 days after inoculation was determined. The quantitative number of bacterial cells in 1 mL inoculated milk was determined using tryptic soy agar (Carl-Roth®, Karlsruhe, Germany) and ¼ Ringer solution (Merck, Darmstadt, Germany).
To imitate storage of raw milk before processing, inoculated pasteurized milk (3.5% fat) was stored at 6 °C for 11 days. Raman measurements were performed after 4, 5, 6, and 11 days.
2.4. Preparation and Analysis of Milk Foam
An average milk foam stability of 10–15 min is generally expected [12]. Briefly, 100 mL of whole milk (3.5% fat) was tempered at 7 °C until temperature equilibration. The tempered milk was foamed up to a total volume of approximately 200 mL using a coffee machine (Jura Impressa XS95; Jura Elektroapparate AG, Niederbuchsiten, Switzerland). Foam stability was investigated for 15 min and determined as follows: the total volume (milk + foam) after 15 min (V15) was compared to milk foam volume at time t0 (V0). t0 was defined as the time, when the total milk volume of 100 mL was foamed resulting in V0 (approximately 200 mL). A volume decrease of ΔV = 50 mL was defined as the maximal acceptable decrease in volume for a stable foam. This resulted in the following criteria for foam stability evaluation:
- V15 ≥ 150 mL → good foam stability
- V15 < 150 mL → bad foam stability
Pictures of foam and the underlying liquid volume were taken over the investigated time using a UV lamp to increase image contrast due to protein fluorescence.
2.5. Chemical Composition
The total fat content, protein content, dry matter, and free fatty acid content (FFA) of all samples of the milk foam trial were determined via Fourier-transform infrared spectroscopy (FTIR Advanced, Delta Instruments, Drachten, The Netherlands). These measurements were kindly performed by the accredited laboratory of Milchprüfring Baden-Württemberg e.V. (Kirchheim unter Teck, Germany) according to the ASU L 01.00-78, 2002-05.
2.6. Spectral Data Analysis and Statistics
SpectraGryph 1.2 (Dr. Friedrich Menges, Oberstdorf, Germany) was used to remove spikes from spectra prior to baseline correction. Due to background fluorescence, the offset of the baseline of raw spectra was bigger at shorter wavenumbers of the spectrum. Thus, baseline correction was performed in the MATLAB R2015b (The MathWorks Inc., Natick, Massachusetts, USA) environment. Spectral channels without bands and therefore no relevant information was excluded from baseline correction and further analysis. Single spectra were smoothed using a Savitzky–Golay filter for better peak visualization, which was always indicated with the applied polynomial fit for the respective spectra.
After preprocessing, principal component analysis (PCA) was performed using MATLAB to assess differences between samples and to detect product defects. PCA was performed with unsmoothed spectra. If not stated, samples PCA were conducted on the whole spectra after baseline correction. Deviations were noted in the particular case.
All measurements were conducted in triplicate. Values are reported as arithmetic mean values. Spearman’s rank correlation with a confidence interval of p = 0.05 was performed using the statistical software IBM SPSS Statistics 24 (IBM Corporation, NY, USA), to assess the possibility of predicting foam stability on the basis of the respective Raman spectrum. The area below a specific peak was correlated with the free fatty acid content and milk foam stability.
3. Results and Discussion
The results of Raman measurements at potential control points during production of consumer milk are shown and discussed in the following sections.
3.1. Standardization
3.1.1. Fat Content
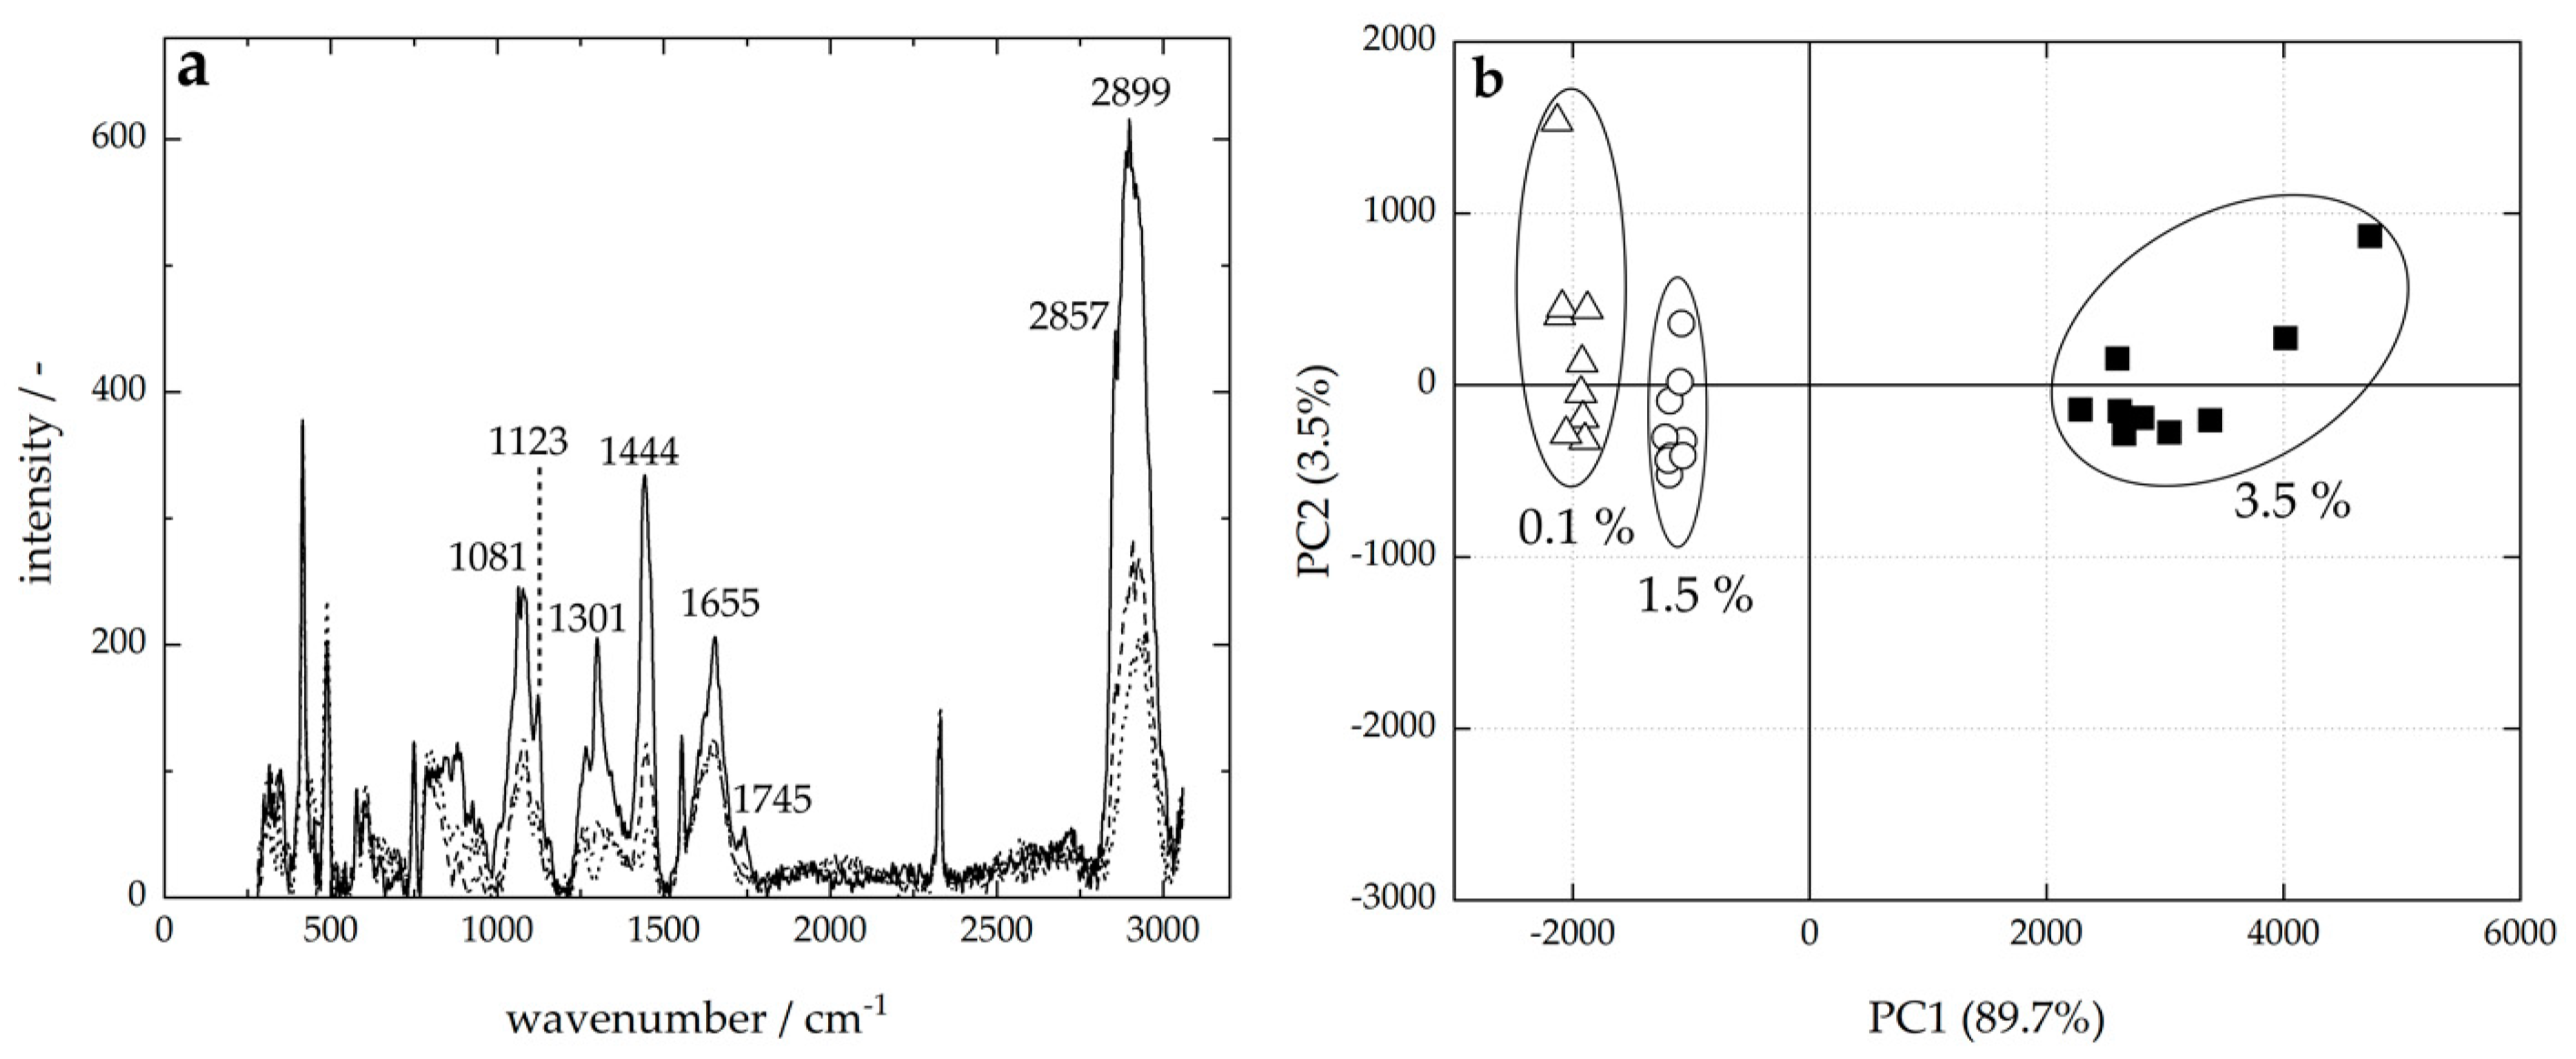
Raman spectra of milk samples varying in their fat content contained a set of overlapping bands characteristic for the major milk constituents. Representative spectra of these samples are depicted in Figure 2a. They were smoothed using a Savitzky–Golay filter (interval: 10 and polynomial order: 3) for better peak visualization in the graph.
Bands near 2899 and 2857 cm−1 were assigned to the ν(C-H) asymmetric and symmetric stretching vibration, respectively [26]. The band at 1745 cm−1 is characteristic for the ν(C=O) stretching vibration in an ester [33,34]. Peaks at 1655 and 1123 cm−1 arouse due to ν(C=C) and ν(C-C) stretching vibrations, respectively [35]. The two bands around 1444 and 1301 cm−1 were attributed to δ(CH2)scissoring and δ(CH2)bending vibrations [25], and the band at 1081 cm−1 was found due to ν(CH3)bending mode [26]. Major differences between band intensities of these peaks were observed in Raman spectra of milk with varying fat content. Band intensities increased with increasing fat content. Figure 2b depicts the PCA score plot explaining 96.7% of the total variance of tested samples. A distinct formation of sample clusters based on their fat content was observed. PC1 would be sufficient for the correlation of variance and relevant information, because scores of PC1 were always smaller or even negative for lower fat contents. The classification and distinction of milk samples with varying fat content based on their Raman spectra combined with PCA was possible.
3.1.2. Lactose
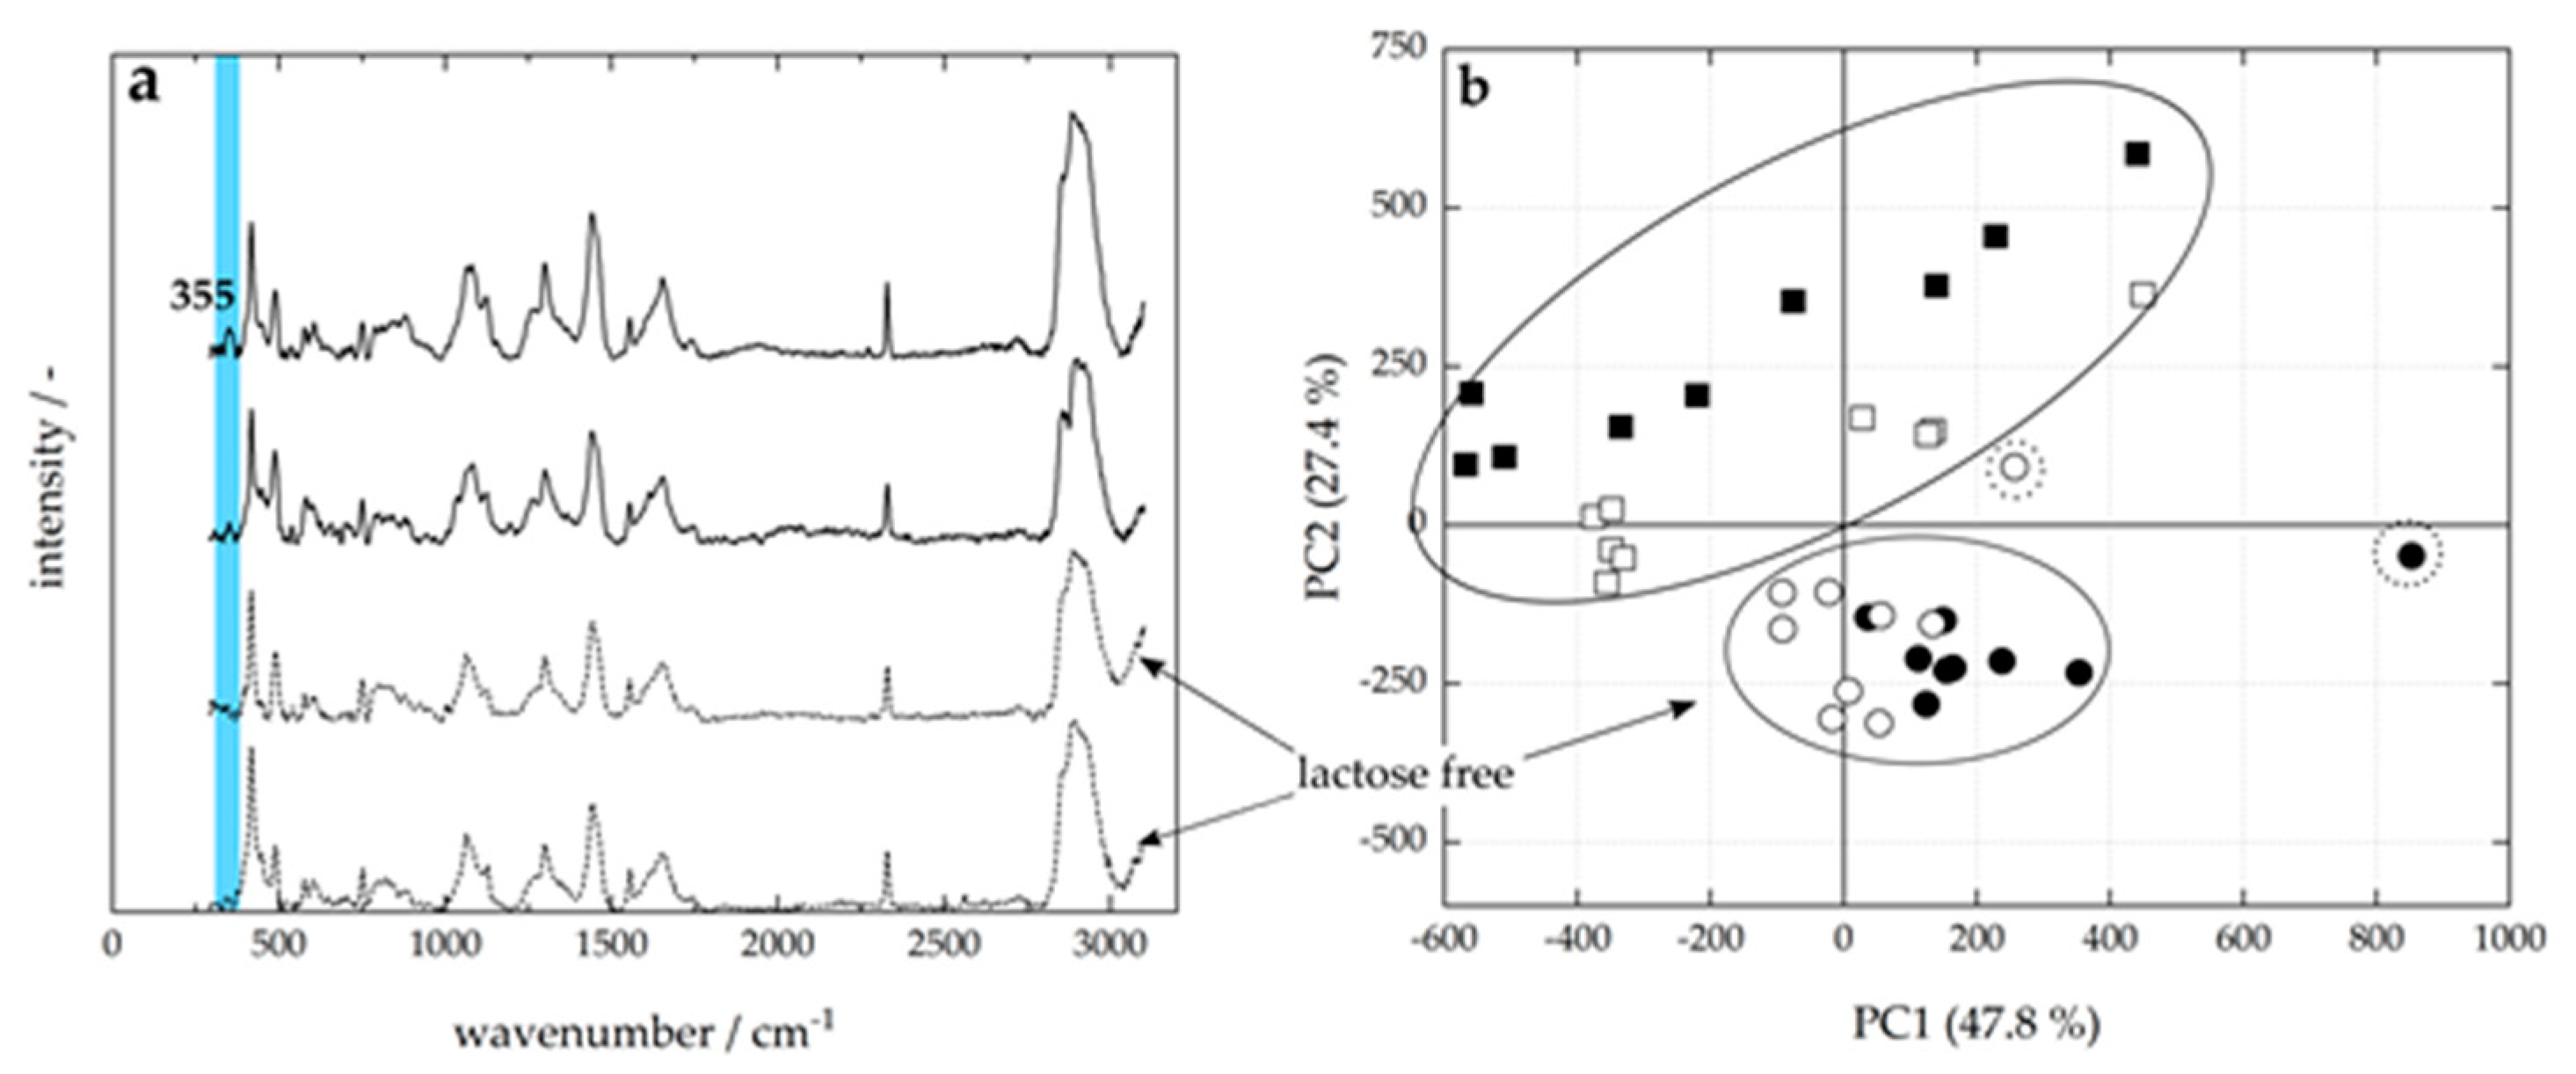
The detection of lactose in milk by means of Raman spectroscopy was investigated using commercial lactose-free and regular milk products. Figure 3a depicts representative Raman spectra of two lactose-free and two regular whole milk samples. Spectra were smoothed using a Savitzky–Golay filter (interval: 10 and polynomial order: 3) prior to plotting.
The spectra showed similar Raman bands characteristic for whole milk. Raman spectra of milk typically show two bands due to the presence of lactose, at 355 and 445 cm−1 [36,37]. Spectra of regular milk samples in this trial merely contained the band at 355 cm−1 and no distinct peak at 445 cm−1 was observed. Sample one of the lactose-free milk was produced by enzymatic cleavage of lactose into glucose and galactose. Sample two was produced via a combination of filtration and enzymatic cleavage. In all spectra of lactose-free milk for both processes, the band at 355 cm−1 was missing. Thus, a decrease in lactose concentration can be correlated with a decrease of band intensity at 355 cm−1.
PCA was performed in the spectral region of 280–520 cm−1, because the relevant spectral information for lactose distinction was given here. Figure 3b depicts the resulting score plot of PC1 vs. PC2 explaining a total variance of 75.2%. The formation of two sample clusters based on their lactose concentration was observed: one cluster for regular milk and another cluster for lactose-free milk. Two outliers, one of each lactose-free sample, were found, indicated by the dashed circles. Potential methods to determine the lactose content in milk products are enzymatic assays, chromatography, or nuclear magnetic resonance spectroscopy [38,39,40,41]. These measurements are time- and cost-consuming compared to Raman spectroscopy and have to be performed offline. Online process control of lactose content in milk using Raman spectroscopy would be advantageous for industrial applications. Therefore, models for quantitative analysis have to be established, which was already successfully demonstrated for other constituents like fat and protein [21,26,37].
3.2. Raw Milk Storage
The early detection of peptidase activity during cold storage of milk by Raman spectroscopy was investigated.
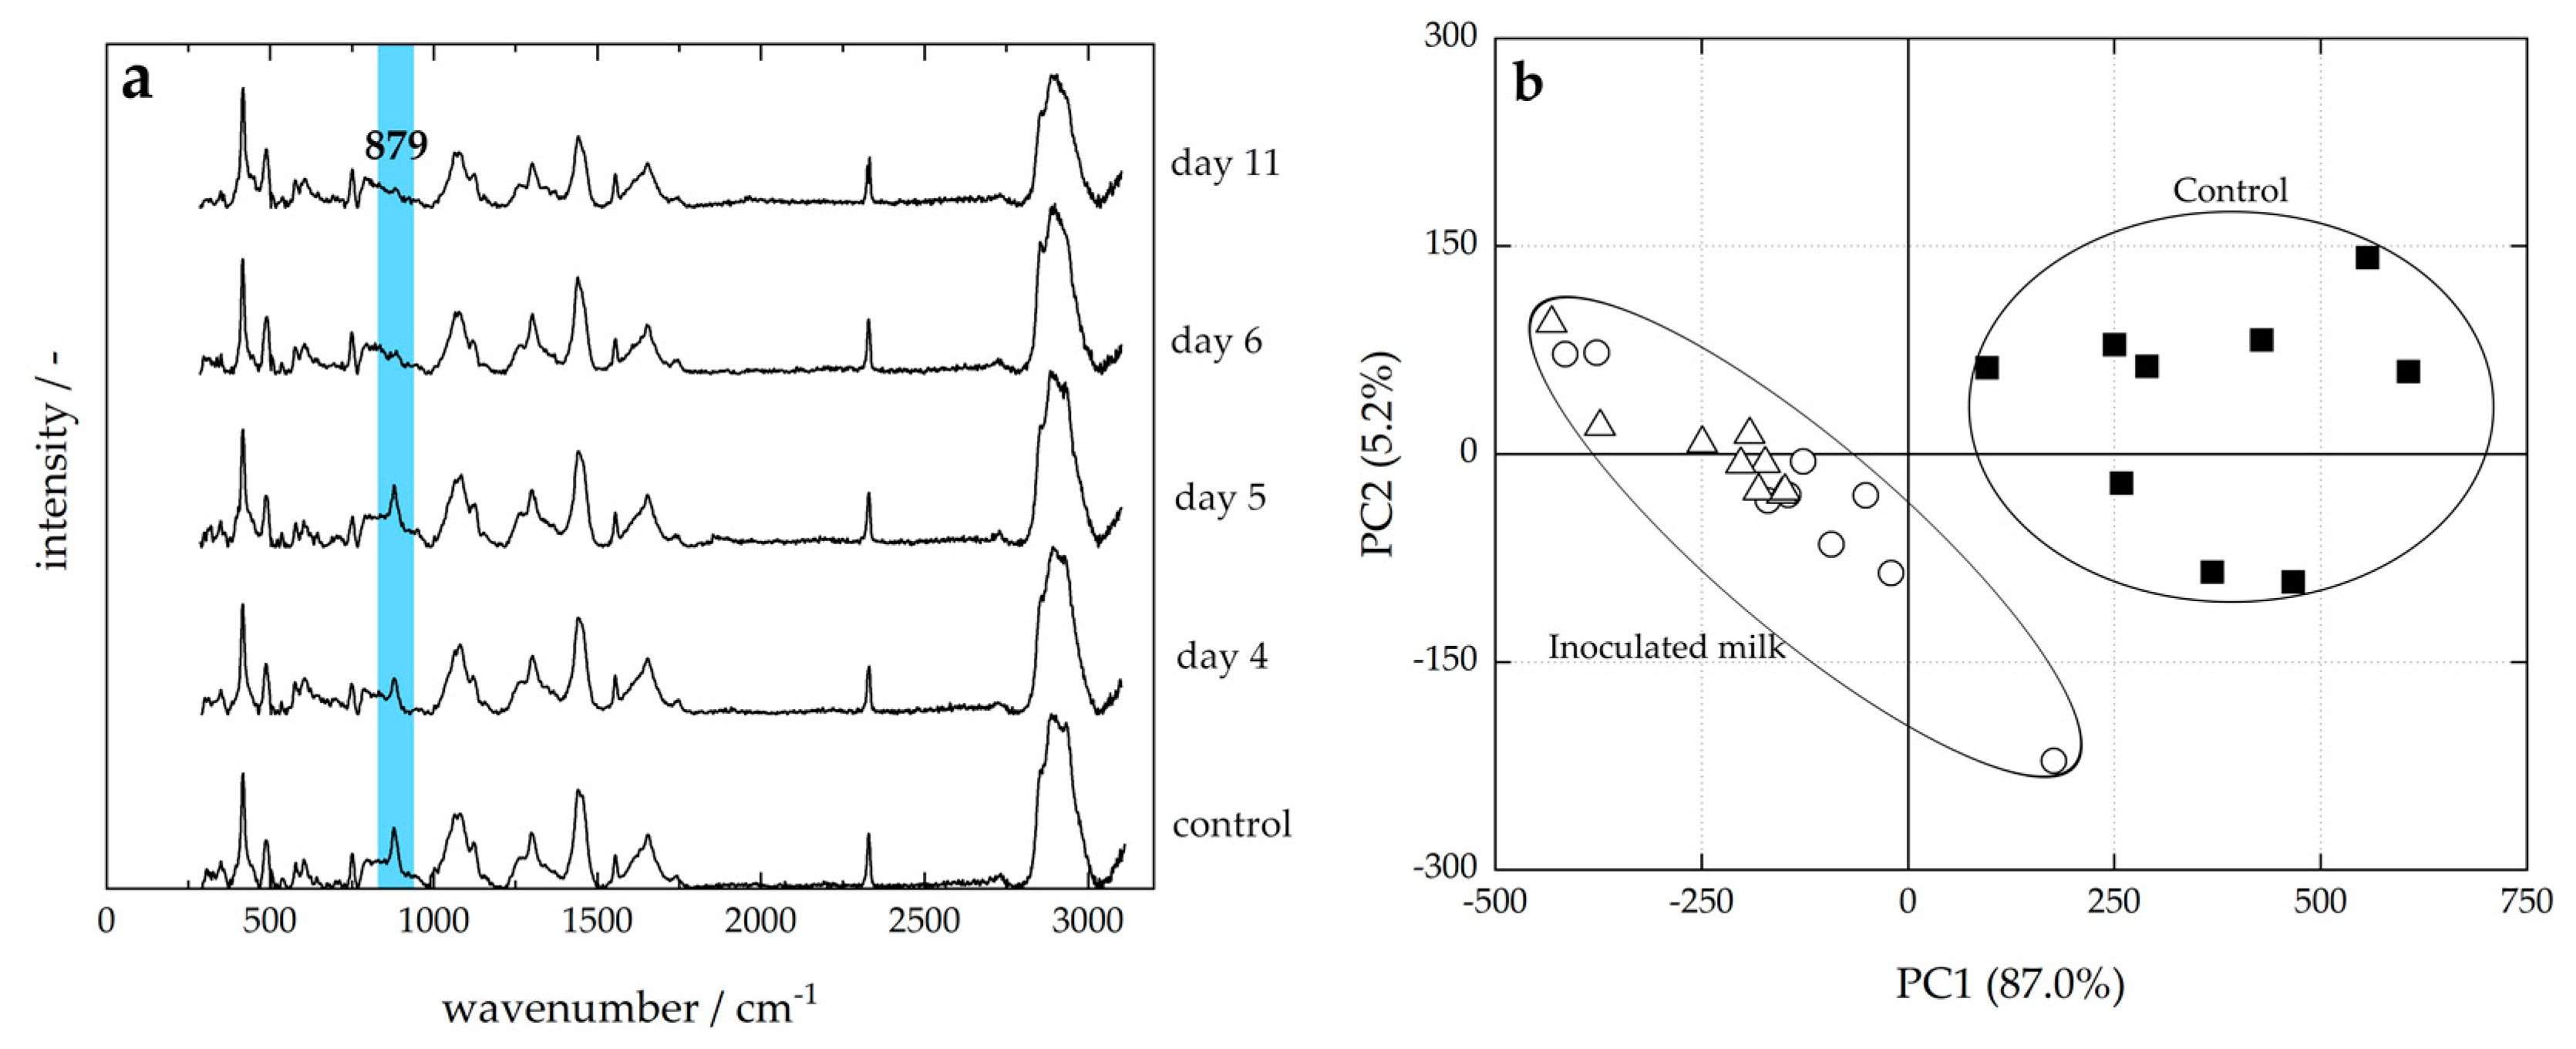
Bacterial counts in the magnitude of 109 were used to inoculate pasteurized milk samples with Pseudomonas sp. to cell counts of 105 cfu mL−1. This resulted in cell counts of 107 cfu mL−1 after 5 days, which is the time needed to reach the stationary growth phase [10]. Raman spectra of inoculated whole milk stored at 6 °C were recorded after 4, 5, 6, and 11 days for three single replica and of the corresponding control milk. Representative baseline corrected spectra are shown in Figure 4a.
In Figure 4a, all spectra show bands characteristic for whole milk, which can be assigned to the main constituents, i.e., lactose, fat, and protein [37,42]. The peak at 879 cm−1 can be attributed to the indole ring of tryptophan [43,44,45]. The control spectrum and spectra taken after 4 and 5 days of cold storage at 6 °C showed a distinct band due to tryptophan. After 6 and 11 days, the intensity of this peak decreased.
Peptidases catalyze the hydrolysis of proteins into smaller polypeptides or amino acids. During this process, protein residues get exposed which were formerly buried due to folding of the protein into its characteristic three-dimensional structure. Hence, tryptophan residues like the indole ring become exposed to the polar aqueous solvent during proteolysis due to Pseudomonas peptidases. Sharp bands in Raman spectra occurred as tryptophan indicated buried tryptophan residues [45,46]. It was shown that the intensity of band at 879 cm−1 serves as a practical probe of the tryptophan environment. Thus, during proteolytic hydrolysis, exposed tryptophan residues can be detected by a decrease of the formerly sharp band at 879 cm−1.
Principal component analysis was performed to correlate spectral changes with the Pseudomonas peptidase activity. No clear cluster formation based on incubation days was obtained except for day 11 (data not shown). Since main spectral differences between control and inoculated milk occurred for the peak at 879 cm−1, a PCA was performed in the spectral region of 799–1000 cm−1 using spectra of control milk and spectra after 6 and 11 days of storage. The resulting score plot of PC1 vs. PC2 is shown in Figure 4b explaining 92.2% of the total variance. Two clear clusters were formed, one for the control milk and another for spoiled milk. In this trial, proteolytic spoilage was detectable after 5 days of storage. Thus, a detection method based on a sensor is feasible and is quicker than the visual and sensorial evaluation of a panel [10]. Future experiments could investigate if proteolytic spoilage is detectable earlier than day 5 after milk collection by adjusting parameter during spectra acquisition.
3.3. Heat Treatment
We investigated the discrimination of consumer milk samples based on the applied heat treatment. UHT and ESL milk were compared, as well as the two main proceedings for ESL production.
Raman spectra of whole milk prepared via UHT and ESL-MF as well as ESL-HHST and ESL-MF treatments were compared. Spectral changes due to a more intense heating procedure in the case of UHT milk occurred mainly in the spectral region of 500–1225 cm−1, which were assigned to protein and fat, respectively. The spectral differences were assessed by PCA over the whole spectral region resulting in the representative PCA score plot in Figure 5a explaining 70.5% of the total variance. Two clusters were formed, one for each heat treatment. Clear distinction between samples was possible.
UHT treatment of milk leads to an increased Maillard reaction compared to ESL milk production. During the Maillard reaction, the brown compound, melanoidin, is formed [47], which induces a color change of the milk to yellow/brown [48]. Melanoidins are high-molecular-weight polymers formed during the nonenzymatic browning reaction between amine compounds and reducing compounds like sugars. Additionally, protein denaturation occurs during heat treatment of milk changing the protein conformation. The extend of denaturation depends, inter alia, on the applied heat treatment (temperature–time combination). UHT milk also exhibits sensory changes, which are perceived by consumers as cooking flavor. This flavor occurs due to the thermally induced formation of free SH-groups. In UHT treatment of homogenized milk, fat–protein conglomerates are also formed. Thus, the formation of Maillard compounds, fat–protein conglomerates, and protein denaturation occurs to a greater extent during UHT treatment compared to the ESL process.
The differentiation of the two main processes for ESL milk production, ESL-MF and ESL-HHST, was also investigated. The two main heating procedures of ESL milk also differ in the applied heat treatment [49,50]. ESL-HHST is produced via a temperature–time combination of 125–127 °C for 4–2 s. Thus, the degree of whey protein denaturation in ESL-HHST is about 30% for direct and 40% for indirect heating, a little lower than for UHT milk.
During ESL-MF production, skim milk obtained after separation is microfiltered at temperatures around 50 °C. Afterwards, pasteurization (72–75 °C for 30–15 s) of the permeate follows. The separated cream is rich in microorganisms and thus is high-heat treated together with the retentate from microfiltration [51]. Due to the lower content of whey proteins, the higher heat treatment has little effect on the denaturation. Consequently, the degree of denaturation in the standardized, heat-treated milk is equal to the one for pasteurized milk, and thus lower than for ESL-HHST and UHT milk [49].
Figure 5b shows the score plot resulting from the performed PCA. PC1 vs. PC2 showed 67.3% of the total variance. One cluster for each heat treatment was seen, one for ESL-HHST and one for ESL-MF. Thus, we were able to detect the applied ESL process (either HHST or MF) which allowed a clear differentiation of samples based on the applied heat treatment.
The rearrangements and formation of new chemical bonds due to the whey protein denaturation and Milliard reaction lead to spectral differences between milk samples. Therefore, the differentiation of milk based on the applied heating procedure by chemometric analysis of the spectra was possible for the investigated samples. This can be used in order to verify heat treatment directly inline before filling and packaging.
3.4. Consumer Milk—Foam Stability
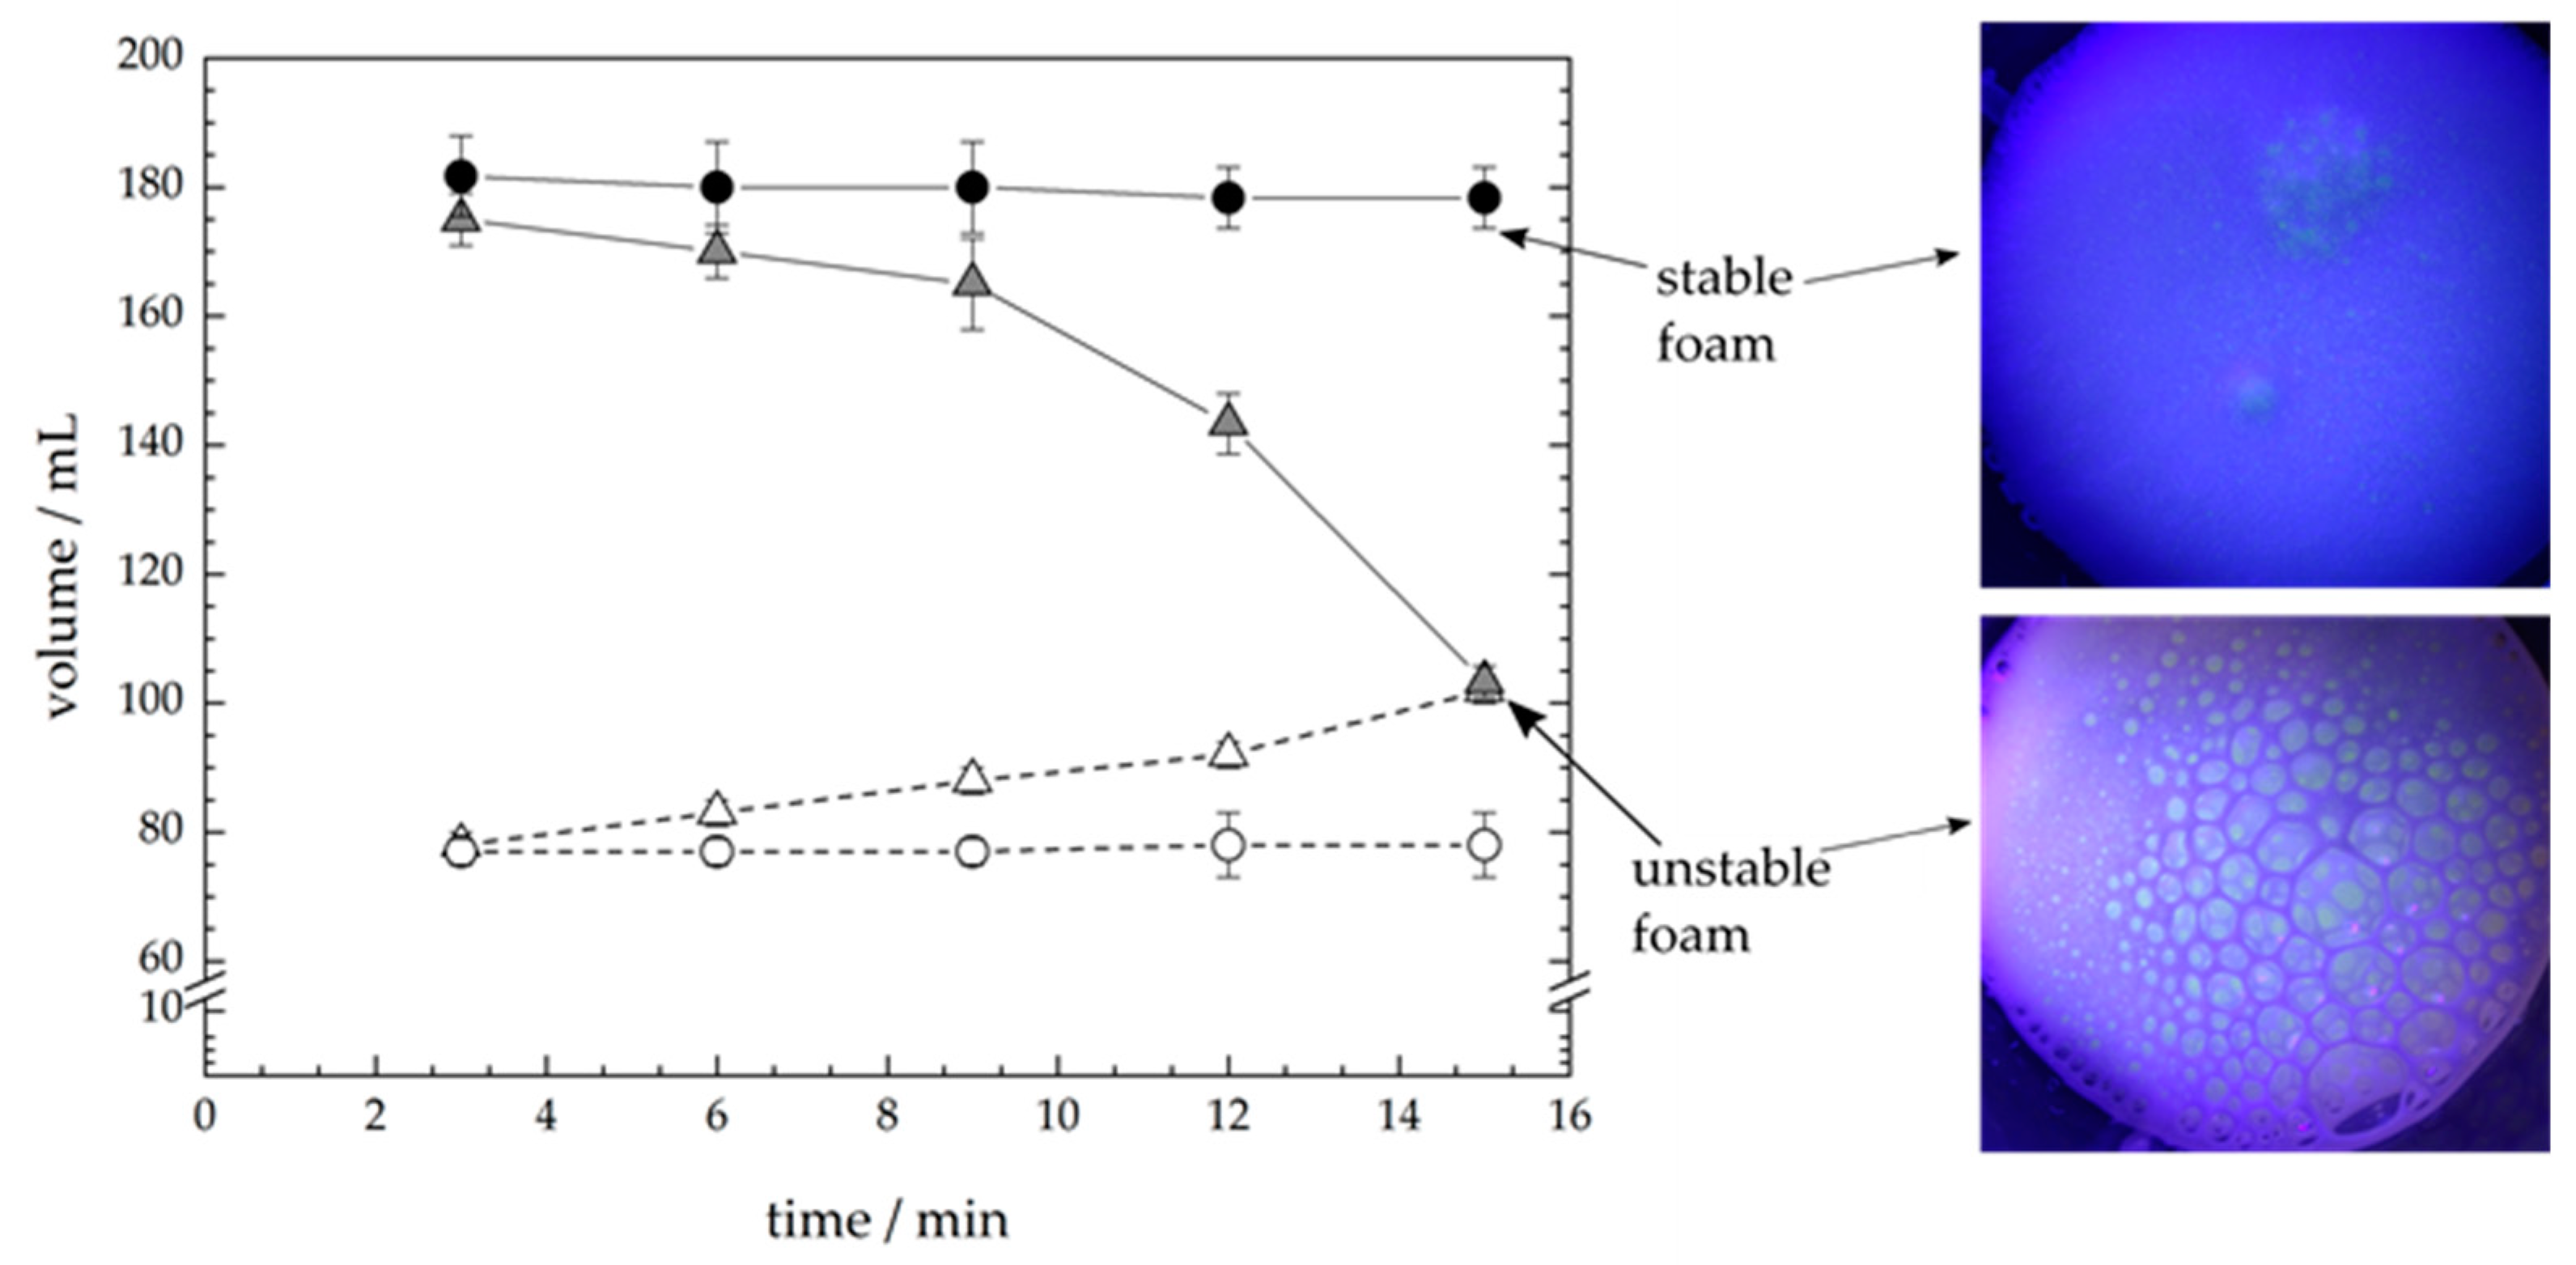
Foam stability was investigated for UHT whole milk samples and correlated with the free fatty acid (FFA) content and differences in the corresponding Raman spectra. The tested milk samples varied significantly in their foam stability. The total volume and liquid volume over time are exemplarily shown in Figure 6 for one stable and one unstable foam.
The first volume measurement point at t = 0 min is not shown, no clear phase separation was visible. After 3 min, foam and the underlying liquid volume were clearly separated, enabling the determination of both volumes. The total volume of stable foams only decreased slightly, in the case of the shown sample from 188 to 178 mL. In contrast, the total volume of unstable foams decreased rapidly over time from 180 to 100 mL. The underlying liquid phase increased slightly in the case of stable foams. For all unstable foams, the foam collapsed completely after 12–15 min, resulting in a total and liquid volume of 100 mL which is equal to the initial volume before foaming.
These results show that there were pronounced differences between milk foams prepared with UHT milk even though the fat content was the same. Milk foams, in general, are protein-stabilized foams. Foams prepared with whole milk are generally less stable than skim milk foams, because of the destabilizing effect of milk fat on protein foam stability [52]. The influence of sample composition on foaming ability and stability was ruled out for the investigated samples. All samples had proper composition regarding fat and protein content, as well as dry matter. The results can be found in Table A1 in the Appendix A. In general, the destabilizing effect of fat is more pronounced when fat globules contain both liquid and solid fat, and if a high content of polar lipids like FFAs is found [53]. A typical cause of changes in the ratio of solid to liquid fat in milk fat globules is the temperature. Since all samples were thoroughly tempered at 7 °C and foaming temperature was constant, further investigations were focused on the FFA content. Free fatty acids are the result of hydrolytic cleavage of milk triacylglycerides [54]. This hydrolysis is commonly referred to as lipolysis, mainly caused by heat-resistant extracellular lipases by psychrotrophic bacteria like Pseudomonas fluorescens [55,56] or by the release of lipases from the milk fat globule membrane (MFGM) due to, e.g., mechanical damage [54]. The FFA content was determined offline as described in Section 2.6 and was correlated with the total volume after 15 min (V15). Table 2 shows the data sets of all investigated samples. FFA contents of 0.9 up to 3.2 meq/100 g fat were found. A statistically significant negative correlation between the FFA content and V15 was found for the tested samples, with a Spearman-Rho correlation coefficient of −0.775 (p = 0.001). The coefficient defines the inversely proportional relation of FFA content and V15 and thus foam stability. Samples with higher amounts of FFA present also resulted in coarser foams with bigger pores and broader pore size distribution. Moreover, three layers were formed: an upper layer of coarse foam, a middle layer of fine foam, and an underlying layer of liquid milk. Stable foams consisted of a fine structure with very small pores. These visual characteristics were also reported by Kamath, Wulandewi, and Deeth [53].
In milk foams, FFAs compete with proteins for the adsorption at the interface between air and serum. They can displace the protein, which leads to the disruption of protein–protein interactions unabling them from forming a stable viscoelastic film around the air bubbles [57]. This leads to coalescence and then, destabilization of the foam [16]. Coalescence was observed as an increase of bubble size and a decrease of bubble number over time, which can be seen in an exemplary foam picture in Figure 6. In this trial, the critical concentration of FFAs leading to unstable foams was 2.0 mequiv per 100 g fat. Samples containing more free fatty acids lead to unstable foams.
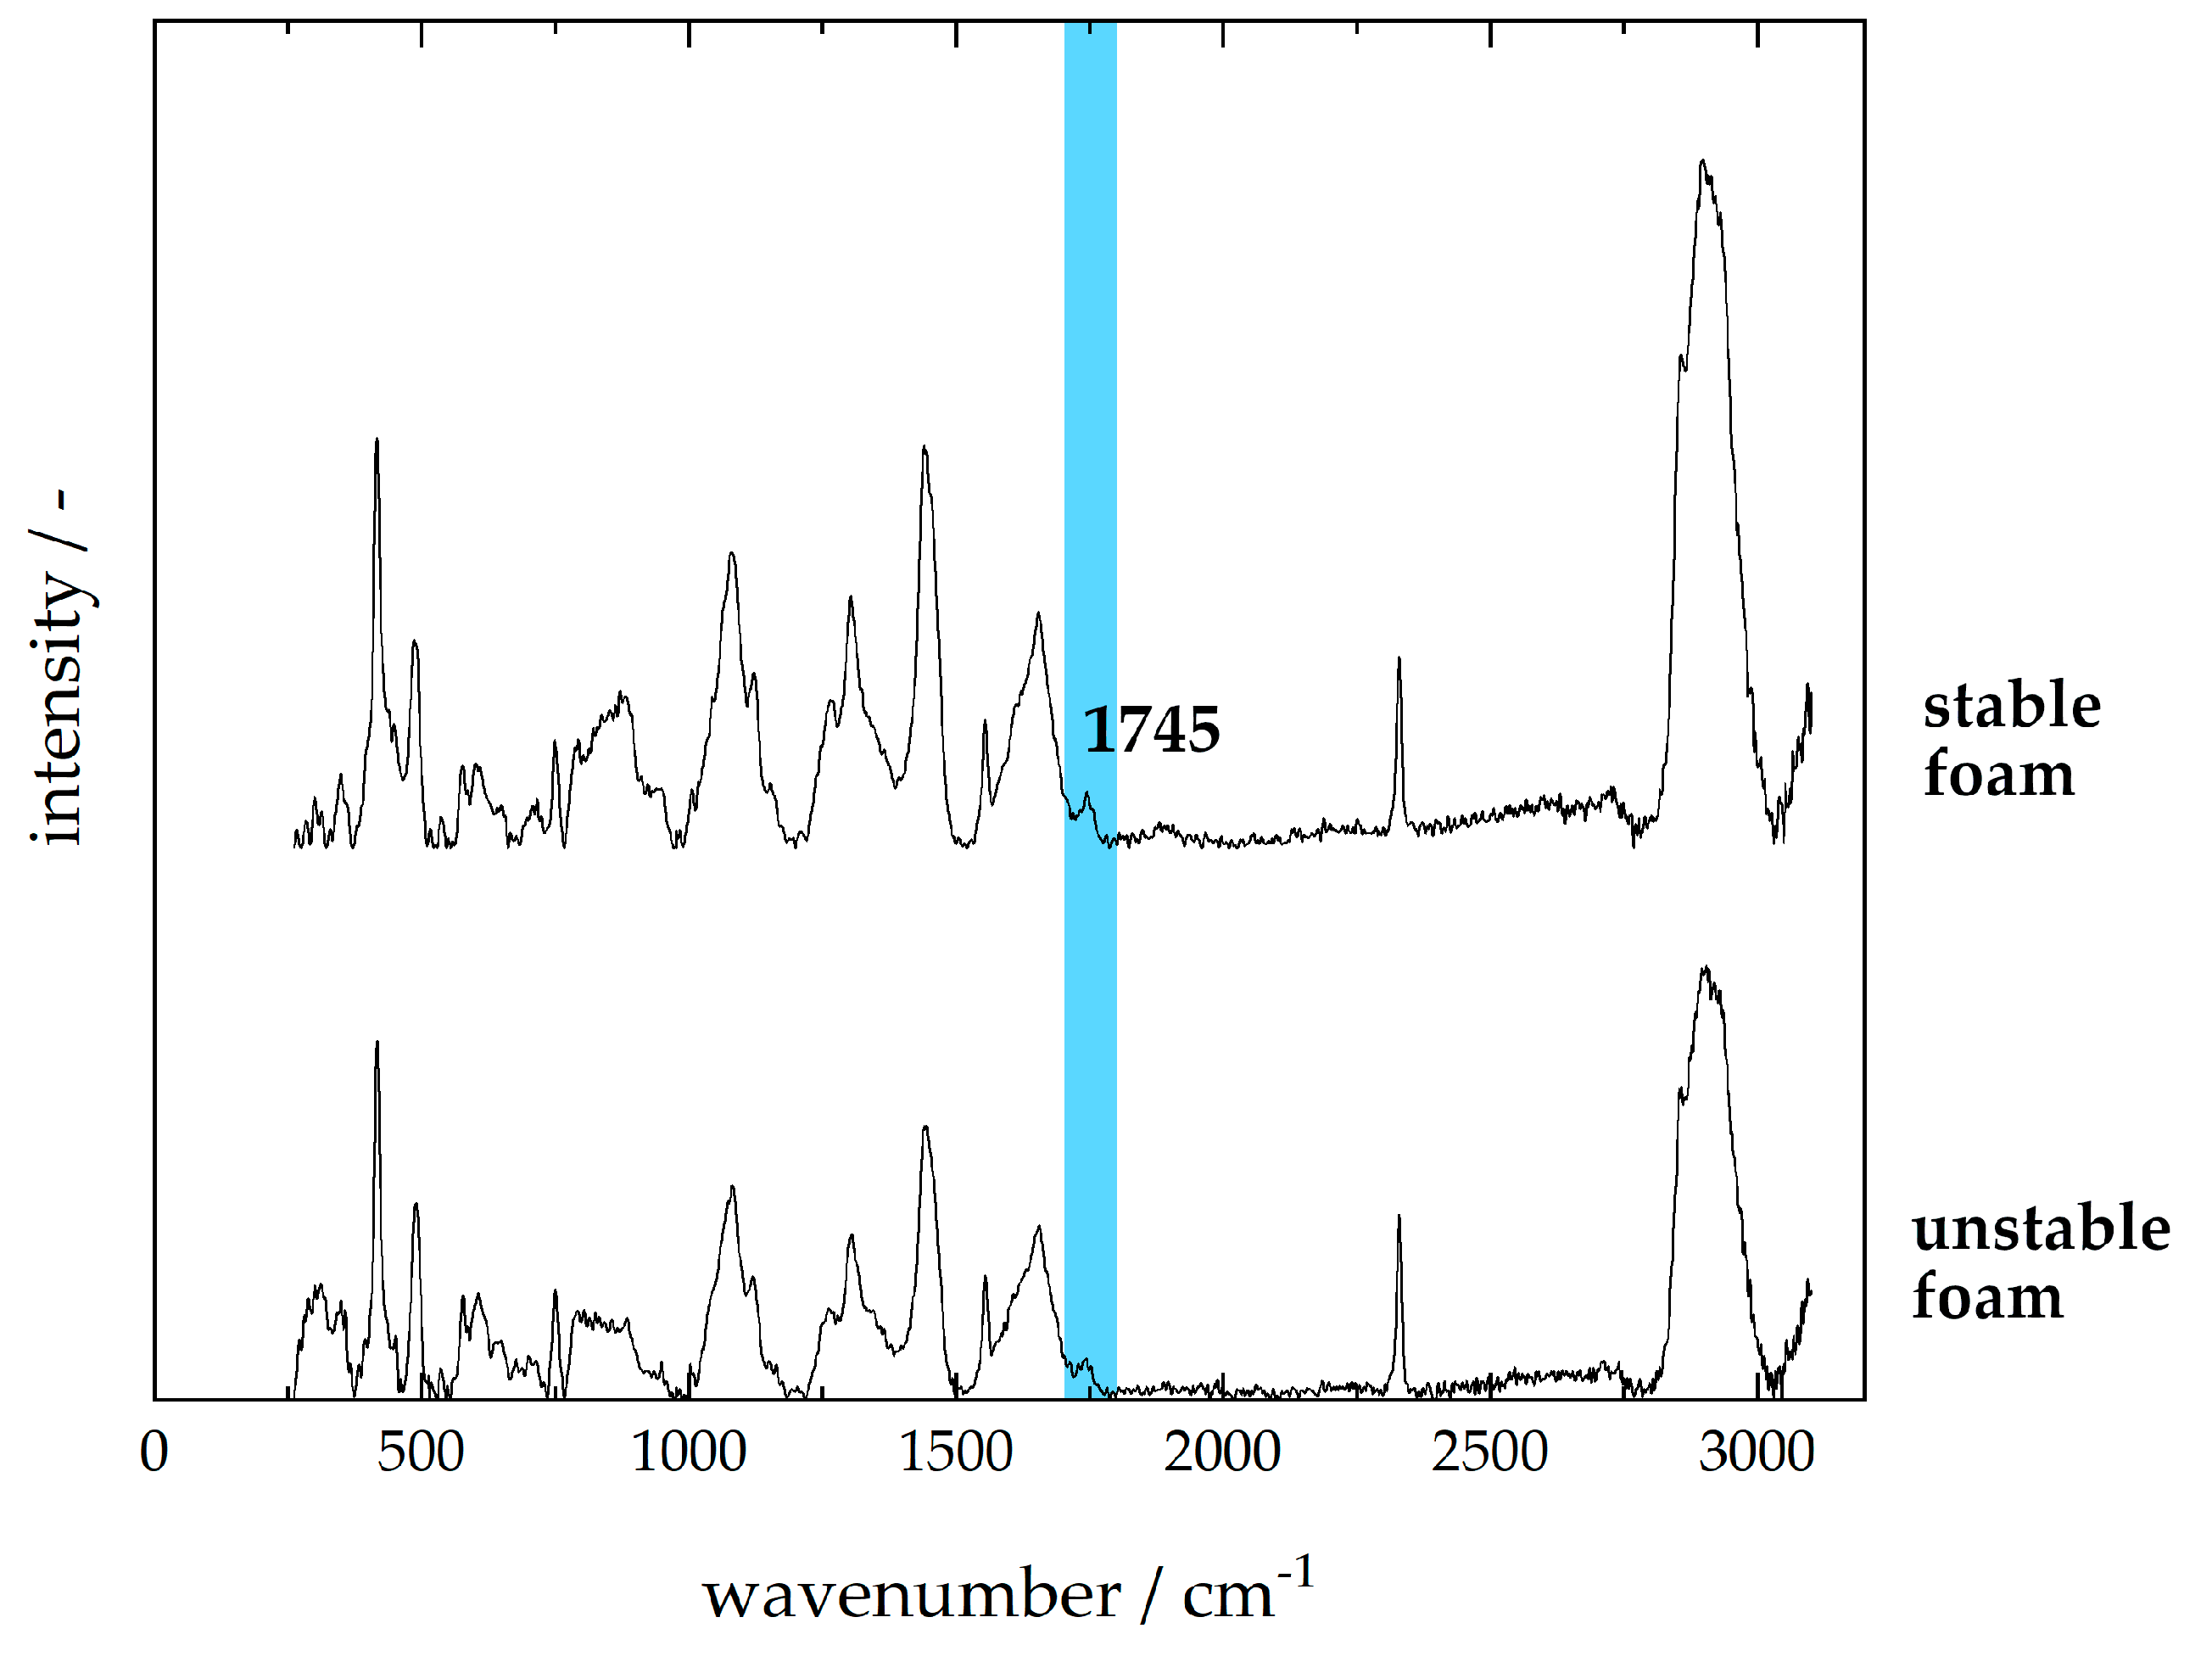
To investigate whether this correlation can also be detected using Raman spectroscopy, measurements of all samples were carried out. Exemplary spectra of one stable and one unstable foam are shown in Figure 7.
The blue bar marks the band at approximately 1745 cm−1, corresponding to the ν(C=O) stretching vibration in an ester [33,34,36]. During lipolysis, the ester bond of triacylglycerides is broken down, resulting in nonesterified fatty acids and partial glycerides or glycerol. Hence, the intensity of the band corresponding to the ν(C=O) stretching vibration in an ester decreases with decreasing amount of triglycerides and therefore, with increasing rate of lipolysis and increasing FFA content. The area under the band was determined for all samples. The results are shown in Table 2. Spectra were smoothed (second-order polynomial) in the spectral range from 1720 to 1775 cm−1 prior to determining the area. A statistically significant correlation with a Spearman-Rho correlation coefficient of −0.741 between the area and FFA content was found. Additionally, correlation of the area and total volume after 15 min was statistically significant resulting in a correlation coefficient of −0.799. Foam stability was strongly influenced by the FFA content. Future research could focus on the implementation of quantitative models to determine the amount of free fatty acids on-line. Spectra could also be used to qualitatively predict the foaming properties of the milk by assessing deviations from standard spectra.
4. Conclusions
The aim of this work was to investigate whether Raman spectroscopy can be used for the early detection of product defects and its suitability to act as indicator for product application parameters using the example of barista foam. Raman spectroscopic measurements were combined with principal component analysis. First experiments focused on the distinction of samples based on their fat and lactose content. For samples with varying fat content, intensities of peaks assigned to fat (2899, 2857, 1745, 1655, 1444, 1301, and 1123 cm−1) increased with an increasing fat content. Thus, PCA of spectra of milk with different fat contents resulted in the formation of clear clusters based on their fat content. The distinction of lactose-free and regular milk samples was based on the band at 355 cm−1. In lactose-free milk, this peak was missing, allowing a clear distinction of samples based on their spectra and PCA. Regular enzymatic methods for lactose quantification could be replaced by fast and cheap spectroscopic measurements.
The presence of proteolytic enzymes of Pseudomonas sp. during storage of whole milk led to a decrease of the band at 879 cm−1. This band is assigned to the indole ring of tryptophan and acts as a marker for the environment. During proteolytic hydrolysis, tryptophan residues become exposed to the polar aqueous environment leading to a decrease in peak intensity, which was detectable with PCA after 6 and 11 days of storage.
The classification of samples based on the applied heat treatment (UHT and ESL-MF) was possible. The degree of thermally induced protein modifications led to spectral differences detectable by PCA. A distinction between the two main proceedings for ESL milk production (ESL-MF and ESL-HHST) was also possible based on these spectral changes. This can be used, e.g., in order to verify heat treatment directly inline before filling and packaging.
Lastly, the foam stability of UHT milk foams varied significant between samples. Foam stability was correlated with the amount FFAs present. In this trial, the critical concentration of free fatty acids was 2.0 mequiv per 100 g fat. Furthermore, the area under the band at 1745 cm−1, assigned to the ν(C=O) stretching vibration in an ester, decreased with increasing FFA content. The prediction of foam stability based on the Raman spectrum of the respective milk sample was possible.
This work shows that Raman spectroscopy can be applied for the early detection of product defects and act as an indicator for product application parameters like foamability of UHT milk. The results show that Raman spectroscopy could be a powerful tool for the fast on-line detection of deviations from a defined product standard, allowing the adjustment of product characteristics or the redirection of product streams. Raman spectroscopy has the potential to replace time- and material-consuming analyses like enzymatic or chromatographic methods. Furthermore, Raman spectroscopy offers the advantage of providing additional information on product quality like, e.g., foamability. Well-established methods like FTIR for constituent quantification are not likely to be replaced by Raman spectroscopy. However, Raman spectroscopy could be used for additional verification of constituent quantity right before filling and packaging. Furthermore, IR and Raman both belong to optical spectroscopy and are complementary techniques; Raman sensors could provide additional information during production. Thus, we propose a combination of Raman spectroscopy with well-established methods like FTIR to obtain a broader data set for verification during production and benefit from the advantages of both techniques.
Author Contributions
Conceptualization, J.R. and K.P.; validation, J.R.; formal analysis, J.R.; investigation, J.R.; resources, J.H. and K.P.; writing—original draft preparation, J.R.; writing—review and editing, K.P. and J.H.; visualization, J.R.; supervision, K.P. and J.H. All authors have read and agreed to the published version of the manuscript.
Funding
This research received no external funding.
Acknowledgments
The authors thank the Milchprüfring Baden-Württemberg E.V. for performing FTIR measurements for FFA and milk constituent quantification. The authors also thank Luc Mertz and Nabil Chaib for the procurement of raw milk and production of UHT milk, as well as Carolin Wedel and Birgit Schilling for their assistance in Pseudomonas sp. inoculum preparation.
Conflicts of Interest
The authors declare no conflicts of interest.
Abbreviations
| The following abbreviations are used in this manuscript: | |
| ESL | Extended shelf life |
| ESL-MF | Extended shelf life-microfiltration |
| ESL-HHST | Extended shelf life-higher-heat shorter time |
| FFA | Free fatty acids |
| FTIR | Fourier-transform infrared spectroscopy |
| PC | Principal component |
| PCA | Principal component analysis |
| UHT | Ultrahigh temperature |
Appendix A
To ensure proper sample composition of UHT milk samples investigated in terms of foam stability, the fat and protein content, as well as dry matter were measured via FTIR. The results listed in Table A1 show that samples had the expected quantities of constituents, and no deviations from the standard were found. Thus, composition had no influence on the foam stability of the investigated UHT whole milk samples.

Table A1.
Concentration of major whole milk constituents for all samples investigated in foam stability experiments.
Table A1.
Concentration of major whole milk constituents for all samples investigated in foam stability experiments.
| Sample Code | Fat Content (%) | Protein Content (%) | Dry Matter (%) |
|---|---|---|---|
| C1 | 3.73 | 3.34 | 12.45 |
| C2 | 3.51 | 3.37 | 12.26 |
| C3 | 3.57 | 3.37 | 12.33 |
| C4 | 3.49 | 3.34 | 12.16 |
| C5 | 3.97 | 3.35 | 12.75 |
| C6 | 3.80 | 3.29 | 12.51 |
| C7 | 3.49 | 3.35 | 12.17 |
| C8 | 3.48 | 3.35 | 12.15 |
| C9 | 3.50 | 3.41 | 12.35 |
| C10 | 3.53 | 3.40 | 12.35 |
| C11 | 3.52 | 3.37 | 12.29 |
| C12 | 3.55 | 3.36 | 12.29 |
| C13 | 3.57 | 3.44 | 12.53 |
| C14 | 3.52 | 3.35 | 12.19 |
| C15 | 3.54 | 3.40 | 12.36 |
References
- Bradley, R.L. Effect of Light on Alteration of Nutritional Value and Flavor of Milk: A Review. J. Food Prot. 1980, 43, 314–320. [Google Scholar] [CrossRef] [PubMed]
- Silva, S.; Espiga, A.; Niranjan, K.; Livings, S.; Gumy, J.-C.; Sher, A. Formation and Stability of Milk Foams. In Bubbles in Food 2; Campbell, G., Ed.; Elsevier Science: Amsterdam, The Netherlands, 2008; pp. 153–161. ISBN 9781891127595. [Google Scholar]
- Madimutsa, O.N.M.; Gwala, W.; Mujuru, F.; Nyambi, C. Investigation of Factors Affecting Frothing Capacity of Pasteurised Whole Milk for Cappuccino Coffee. Int. J. Latest Technol. Eng. Manag. Appl. Sci. 2017, 6, 144–151. [Google Scholar]
- Ponte, S. The ‘Latte Revolution’? Regulation, Markets and Consumption in the Global Coffee Chain. World Dev. 2002, 30, 1099–1122. [Google Scholar] [CrossRef]
- Chandan, R.C. Dairy processing and quality assurance: An overview. In Dairy Processing & Quality Assurance, 2nd ed.; Chichester: West Sussex, UK; Hoboken, NJ, USA, 2008; pp. 1–40. ISBN 978-1-118-81031-6. [Google Scholar]
- Lafarge, V.; Ogier, J.-C.; Girard, V.; Maladen, V.; Leveau, J.-Y.; Gruss, A.; Delacroix-Buchet, A. Raw cow milk bacterial population shifts attributable to refrigeration. Appl. Environ. Microbiol. 2004, 70, 5644–5650. [Google Scholar] [CrossRef] [Green Version]
- De Jonghe, V.; Coorevits, A.; van Hoorde, K.; Messens, W.; van Landschoot, A.; de Vos, P.; Heyndrickx, M. Influence of storage conditions on the growth of Pseudomonas species in refrigerated raw milk. Appl. Environ. Microbiol. 2011, 77, 460–470. [Google Scholar] [CrossRef] [Green Version]
- Cogan, T.M. A review of heat resistant lipases and proteinases and the quality of dairy products. Ir. J. Food Sci. Technol. 1977, 1, 95–105. [Google Scholar]
- Griffiths, M.W.; Phillips, J.D.; West, I.G.; Muir, D.D. The effect of extended low-temperature storage of raw milk on the quality of pasteurized and UHT milk. Food Microbiol. 1988, 5, 75–87. [Google Scholar] [CrossRef]
- Stoeckel, M.; Lidolt, M.; Achberger, V.; Glück, C.; Krewinkel, M.; Stressler, T.; von Neubeck, M.; Wenning, M.; Scherer, S.; Fischer, L.; et al. Growth of Pseudomonas weihenstephanensis, Pseudomonas proteolytica and Pseudomonas sp. in raw milk: Impact of residual heat-stable enzyme activity on stability of UHT milk during shelf-life. Int. Dairy J. 2016, 59, 20–28. [Google Scholar] [CrossRef]
- Kessler, H.G. Lebensmittel- und Bioverfahrenstechnik: Molkereitechnologie; Verlag A. Kessler: Freising, Germany, 1996; ISBN 9783980237840. [Google Scholar]
- Huppertz, T. Foaming properties of milk: A review of the influence of composition and processing. Int. J. Dairy Technol. 2010, 63, 477–488. [Google Scholar] [CrossRef]
- Walstra, P. Principles of Foam Formation and Stability. Foams: Physics, Chemistry and Structure; Springer: Amsterdam, The Netherlands, 1989; pp. 1–15. [Google Scholar]
- Oetjen, K.; Bilke-Krause, C.; Madani, M.; Willers, T. Temperature effect on foamability, foam stability, and foam structure of milk. Colloids Surf. A: Physicochem. Engingeeing Asp. 2014, 460, 280–285. [Google Scholar] [CrossRef]
- Hailing, P.J.; Walstra, P. Protein-stabilized foams and emulsions. Crit. Rev. Food Sci. Nutr. 1981, 15, 155–203. [Google Scholar] [CrossRef] [PubMed]
- Sarker, D.K.; Wilde, P.J.; Clark, D.C. Control of surfactant-induced destabilization of foams through polyphenol-mediated protein-protein interactions. J. Agric. Food Chem. 1995, 43, 295–300. [Google Scholar] [CrossRef]
- Mazurek, S.; Szostak, R.; Czaja, T.; Zachwieja, A. Analysis of milk by FT-Raman spectroscopy. Talanta 2015, 138, 285–289. [Google Scholar] [CrossRef] [PubMed]
- Almeida, M.R.; Oliveira, K.d.S.; Stephani, R.; de Oliveira, L.F.C. Fourier-transform Raman analysis of milk powder: A potential method for rapid quality screening. J. Raman Spectrosc. 2011, 42, 1548–1552. [Google Scholar] [CrossRef]
- Nieuwoudt, M.K.; Holroyd, S.E.; McGoverin, C.M.; Simpson, M.C.; Williams, D.E. Rapid, sensitive, and reproducible screening of liquid milk for adulterants using a portable Raman spectrometer and a simple, optimized sample well. J. Dairy Science. 2016, 99, 7821–7831. [Google Scholar] [CrossRef]
- Li-Chan, E.C.Y. The applications of Raman spectroscopy in food science. Trends Food Sci. Technol. 1996, 7, 361–370. [Google Scholar] [CrossRef]
- da Rocha, R.A.; Paiva, I.M.; Anjos, V.; Furtado, M.A.M.; Bell, M.J.V. Quantification of whey in fluid milk using confocal Raman microscopy and artificial neural network. J. Dairy Sci. 2015, 98, 3559–3567. [Google Scholar] [CrossRef] [Green Version]
- He, L.; Rodda, T.; Haynes, C.L.; Deschaines, T.; Strother, T.; Diez-Gonzalez, F.; Labuza, T.P. Detection of a Foreign Protein in Milk Using Surface-Enhanced Raman Spectroscopy Coupled with Antibody-Modified Silver Dendrites. Anal. Chem. 2011, 83, 1510–1513. [Google Scholar] [CrossRef]
- Zhang, X.F.; Zou, M.-Q.; Qi, X.-H.; Liu, F.; Zhu, X.-H.; Zhao, B.-H. Detection of melamine in liquid milk using surface-enhanced Raman scattering spectroscopy. J. Raman Spectrosc. 2010, 41, 1655–1660. [Google Scholar] [CrossRef]
- Nieuwoudt, M.K.; Holroyd, S.E.; McGoverin, C.M.; Simpson, M.C.; Williams, D.E. Raman spectroscopy as an effective screening method for detecting adulteration of milk with small nitrogen-rich molecules and sucrose. J. Dairy Sci. 2016, 99, 2520–2536. [Google Scholar] [CrossRef]
- El-Abassy, R.; Eravuchira, P.J.; Donfack, P.; von der Kammer, B.; Materny, A. Fast determination of milk fat content using Raman spectroscopy. Vib. Spectrosc. 2011, 56, 3–8. [Google Scholar] [CrossRef]
- Mendes, T.O.; Junqueira, G.M.A.; Porto, B.L.S.; Brito, C.D.; Sato, F.; de Oliveira, M.A.L.; Anjos, V.; Bell, M.J.V. Vibrational spectroscopy for milk fat quantification: Line shape analysis of the Raman and infrared spectra. J. Raman Spectrosc. 2016, 47, 692–698. [Google Scholar] [CrossRef]
- Huang, Y.; Gu, J.; Xiang, G.; Xu, J.; Fu, S.; Gong, H. Detection of total protein in milk using phosphomolybdic acid-mediated surface-enhanced Raman spectroscopy. J. Raman Spectrosc. 2015. [Google Scholar] [CrossRef]
- El-Abassy, R.M.; Eravuchira, P.J.; Donfack, P.; von der Kammer, B.; Materny, A. Direct determination of unsaturation level of milk fat using Raman spectroscopy. Appl. Spectrosc. 2012, 66, 538–544. [Google Scholar] [CrossRef]
- Nicolaou, N.; Xu, Y.; Goodacre, R. Fourier transform infrared and Raman spectroscopies for the rapid detection, enumeration, and growth interaction of the bacteria Staphylococcus aureus and Lactococcus lactis ssp. cremoris in milk. Anal. Chem. 2011, 83, 5681–5687. [Google Scholar] [CrossRef]
- Meisel, S.; Stöckel, S.; Elschner, M.; Melzer, F.; Rösch, P.; Popp, J. Raman spectroscopy as a potential tool for detection of Brucella spp. in milk. Appl. Environ. Microbiol. 2012, 78, 5575–5583. [Google Scholar] [CrossRef] [Green Version]
- Wang, J.; Xie, X.; Feng, J.; Chen, J.C.; Du, X.-j.; Luo, J.; Lu, X.; Wang, S. Rapid detection of Listeria monocytogenes in milk using confocal micro-Raman spectroscopy and chemometric analysis. Int. J. Food Microbiol. 2015, 204, 66–74. [Google Scholar] [CrossRef]
- Weidemaier, K.; Carruthers, E.; Curry, A.; Kuroda, M.; Fallows, E.; Thomas, J.; Sherman, D.; Muldoon, M. Real-time pathogen monitoring during enrichment: A novel nanotechnology-based approach to food safety testing. Int. J. Food Microbiol. 2015, 198, 19–27. [Google Scholar] [CrossRef]
- Bernuy, B.; Meurens, M.; Mignolet, E.; Larondelle, Y. Performance Comparison of UV and FT-Raman Spectroscopy in the Determination of Conjugated Linoleic Acids in Cow Milk Fat. J. Agric. Food Chem. 2008, 56, 1159–1163. [Google Scholar] [CrossRef]
- Beattie, J.R.; Bell, S.E.J.; Moss, B.W. A critical evaluation of Raman spectroscopy for the analysis of lipids: Fatty acid methyl esters. Lipids 2004, 39, 407–419. [Google Scholar] [CrossRef]
- Gallier, S.; Gordon, K.C.; Jiménez-Flores, R.; Everett, D.W. Composition of bovine milk fat globules by confocal Raman microscopy. Int. Dairy J. 2011, 21, 402–412. [Google Scholar] [CrossRef]
- Kirk, J.H.; Dann, S.E.; Blatchford, C.G. Lactose: A definitive guide to polymorph determination. Int. J. Pharm. 2007, 334, 103–114. [Google Scholar] [CrossRef] [PubMed]
- McGoverin, C.M.; Clark, A.S.S.; Holroyd, S.E.; Gordon, K.C. Raman spectroscopic quantification of milk powder constituents. Anal. Chim. Acta 2010, 673, 26–32. [Google Scholar] [CrossRef] [PubMed]
- Mattiasson, B.; Danielsson, B. Calorimetric analysis of sugars and sugar derivatives with aid of an enzyme thermistor. Carbohydr. Res. 1982, 102, 273–282. [Google Scholar] [CrossRef]
- Indyk, H. High performance liquid chromatographic analysis of lactose-hydrolysed milk. Food Chem. 1996, 57, 575–580. [Google Scholar] [CrossRef]
- Kwak, H.S.; Jeon, I.J. Comparison of High Performance Liquid Chromatography and Enzymatic Method for the Measurement of Lactose in Milk. J. Food Sci. 1988, 53, 975–976. [Google Scholar] [CrossRef]
- Monakhova, Y.B.; Kuballa, T.; Leitz, J.; Andlauer, C.; Lachenmeier, D.W. NMR spectroscopy as a screening tool to validate nutrition labeling of milk, lactose-free milk, and milk substitutes based on soy and grains. Dairy Sci. Technol. 2012, 92, 109–120. [Google Scholar] [CrossRef] [Green Version]
- Socrates, G. Infrared and Raman Characteristic Group Frequencies: Tables and Charts; John Wiley & Sons: Hoboken, NJ, USA, 2004; ISBN 9780470093078. [Google Scholar]
- Li-Chan, E.; Nakai, S.; Hirotsuka, M. Raman spectroscopy as a probe of protein structure in food systems. In Protein Structure-Function Relationships in Foods; Springer: Boston, MA, USA, 1994; pp. 163–197. [Google Scholar]
- Nevin, A.; Osticioli, I.; Anglos, D.; Burnstock, A.; Cather, S.; Castellucci, E. Raman spectra of proteinaceous materials used in paintings: A multivariate analytical approach for classification and identification. Anal. Chem. 2007, 79, 6143–6151. [Google Scholar] [CrossRef]
- Nonaka, M.; Li-Chan, E.; Nakai, S. Raman spectroscopic study of thermally induced gelation of whey proteins. J. Agric. Food Chem. 1993, 41, 1176–1181. [Google Scholar] [CrossRef]
- Li-Chan, E.; Nakai, S. Raman spectroscopic study of thermally and/or dithiothreitol induced gelation of lysozyme. J. Agric. Food Chem. 1991, 39, 1238–1245. [Google Scholar] [CrossRef]
- Hodge, J.E. Dehydrated foods, chemistry of browning reactions in model systems. J. Agric. Food Chem. 1953, 1, 928–943. [Google Scholar] [CrossRef]
- Horak, F.P.; Kessler, H.-G. Über die Reaktionskinetik der Sporenabtötung und chemischer Veränderungen bei der thermischen Haltbarmachung von Milch zur Optimierung von Erhitzungsverfahren. Chem. Ing. Tech. 1982, 54, 377–378. [Google Scholar] [CrossRef]
- Kaufmann, V.; Scherer, S.; Kulozik, U. Verfahren zur Verlängerung der Haltbarkeit von Konsummilch und ihre stofflichen Veränderungen: ESL-Milch. J. Für Verbrauch. Und Lebensm. 2010, 5, 59–64. [Google Scholar] [CrossRef]
- Kaufmann, V.; Kulozik, U. Verfahrenskonzepte zur Herstellung von ESL-Milch. Dtsch. Milchwirtwirtschaft 2007, 58, 268–271. [Google Scholar]
- Kaufmann, V.; Kulozik, U. Kombination von Mikrofiltration und thermischen Verfahren zur Haltbarkeitsverlängerung von Lebensmitteln. Chem. Ing. Tech. 2006, 78, 1647–1654. [Google Scholar] [CrossRef]
- Kamath, S.; Huppertz, T.; Houlihan, A.V.; Deeth, H. The influence of temperature on the foaming of milk. Int. Dairy J. 2008, 18, 994–1002. [Google Scholar] [CrossRef]
- Kamath, S.; Huppertz, T.; Houlihan, A.V.; Deeth, H. Relationship between surface tension, free fatty acid concentration and foaming properties of milk. Food Res. Int. 2008, 41, 623–629. [Google Scholar] [CrossRef]
- Töpel, A. Chemie und Physik der Milch: Naturstoff - Rohstoff - Lebensmittel; Behr’s Verlag: Hamburg, Germany, 2007. [Google Scholar]
- Law, B.A. Enzymes of psychrotrophic bacteria and their effects on milk and milk products. J. Dairy Res. 1979, 46, 573–588. [Google Scholar] [CrossRef]
- Shelley, A.W.; Deeth, H.C.; MacRae, I.C. Growth of lipolytic psychrotrophic pseudomonads in raw and ultra-heat-treated milk. J. Appl. Bacteriol. 1986, 61, 395–400. [Google Scholar] [CrossRef]
- Buchanan, R.A. Lipolysis and the frothing of milk. Aust. J. Dairy Technol. 1965, 20, 62. [Google Scholar]
Figure 1.
General production scheme of consumer milk and control points.

Figure 2.
Representative smoothed Raman spectra of ultrahigh temperature (UHT) milk with 0.1% (dotted line), 1.5% (dashed line), and 3.5% (solid line) fat content (a), and the resulting principal component analysis (PCA) score plot of PC1 vs. PC2 (b).
Figure 2.
Representative smoothed Raman spectra of ultrahigh temperature (UHT) milk with 0.1% (dotted line), 1.5% (dashed line), and 3.5% (solid line) fat content (a), and the resulting principal component analysis (PCA) score plot of PC1 vs. PC2 (b).

Figure 3.
Representative smoothed Raman spectra of two lactose-free samples (<0.1 g per 100 g) (dashed lines) and two regular milk samples (solid lines) (a), and the resulting PCA score plot of PC1 vs. PC2 (b). Spectra are offset for clarity. Highlighted in blue is the band at 355 cm−1 assigned to lactose.

Figure 4.
Representative Raman spectra of control milk and after 4, 5, 6, and 11 days of inoculation with Pseudomonas sp. (a), and the resulting score plot of PCA (b) of control (■) and samples after 6 (○) and 11 (△) days of incubation. Spectra are offset for clarity. Highlighted in blue is the peak corresponding to the indole ring of tryptophan.

Figure 5.
PCA score plot of extended shelf life-microfiltration (ESL-MF) vs. UHT (a) and extended shelf life-higher-hear shorter time (ESL-HHST) vs. ESL-MF (b).
Figure 5.
PCA score plot of extended shelf life-microfiltration (ESL-MF) vs. UHT (a) and extended shelf life-higher-hear shorter time (ESL-HHST) vs. ESL-MF (b).

Figure 6.
Total volume (solid symbols) and liquid volume (open symbols) as a function of time for UHT whole milk. Representative graphs of one stable (C4 ●,○) and one unstable foam (C15 ▲,△) are shown. Exemplary pictures of pore sizes of one stable and one unstable foam are shown.
Figure 6.
Total volume (solid symbols) and liquid volume (open symbols) as a function of time for UHT whole milk. Representative graphs of one stable (C4 ●,○) and one unstable foam (C15 ▲,△) are shown. Exemplary pictures of pore sizes of one stable and one unstable foam are shown.

Figure 7.
Raman spectra of milk forming stable (C4) and unstable (C15) foams are given Spectra are offset for clarity. Highlighted in blue is the peak corresponding to the ν(C=O) stretching vibration in an ester.
Figure 7.
Raman spectra of milk forming stable (C4) and unstable (C15) foams are given Spectra are offset for clarity. Highlighted in blue is the peak corresponding to the ν(C=O) stretching vibration in an ester.

Table 1.
Manufacturer of commercial milk samples in alphabetical order.
| Manufacturers of Milk Samples |
|---|
| Arla Foods A.m.b.A., Viby, Denmark |
| FrieslandCampina, Amersfoort, The Netherlands |
| Hohenloher Molkerei eG, Schwäbisch Hall, Germany |
| Molkerei Weihenstephan GmbH & Co. KG, Freising, Germany |
| OMIRA GmbH, Ravensburg, Germany |
Table 2.
Free fatty acid content of investigated ultrahigh temperature (UHT) milk samples (3.5% fat) and mean values for the total volume after 15 min (V15) and the determined area under band 1745 cm−1 in order of their consecutive sample code. The Spearman-Rho correlation coefficient is given for the respective correlation.
| Sample Code | V15 (mL) | FFA (meq/100 g fat) | Area (-) | |
|---|---|---|---|---|
| C1 | 105 ± 4 | 2.8 | 514 ± 36 | |
| C2 | 108 ± 2 | 2.7 | 543 ± 35 | |
| C3 | 175 ± 0 | 1.9 | 671 ± 49 | |
| C4 | 103 ± 2 | 2.6 | 456 ± 44 | |
| C5 | 172 ± 2 | 1.1 | 695 ± 91 | |
| C6 | 172 ± 2 | 1.1 | 725 ± 76 | |
| C7 | 100 ± 0 | 3.1 | 498 ± 30 | |
| C8 | 100 ± 0 | 3.2 | 496 ± 37 | |
| C9 | 170 ± 4 | 1.0 | 591 ± 5 | |
| C10 | 170 ± 4 | 1.1 | 688 ± 55 | |
| C11 | 172 ± 2 | 0.9 | 585 ± 54 | |
| C12 | 100 ± 4 | 2.4 | 536 ± 10 | |
| C13 | 183 ± 2 | 1.1 | 629 ± 70 | |
| C14 | 102 ± 2 | 3.0 | 488 ± 50 | |
| C15 | 178 ± 5 | 1.0 | 818 ± 48 | |
| Spearman-Rho correlation coefficient |  | | ||
| −0.775 | −0.741 | |||
© 2020 by the authors. Licensee MDPI, Basel, Switzerland. This article is an open access article distributed under the terms and conditions of the Creative Commons Attribution (CC BY) license (http://creativecommons.org/licenses/by/4.0/).
Share and Cite
MDPI and ACS Style
Reiner, J.; Protte, K.; Hinrichs, J. Investigation of the Applicability of Raman Spectroscopy as Online Process Control during Consumer Milk Production. ChemEngineering 2020, 4, 45. https://doi.org/10.3390/chemengineering4030045
AMA Style
Reiner J, Protte K, Hinrichs J. Investigation of the Applicability of Raman Spectroscopy as Online Process Control during Consumer Milk Production. ChemEngineering. 2020; 4(3):45. https://doi.org/10.3390/chemengineering4030045
Chicago/Turabian StyleReiner, Jasmin, Kristin Protte, and Jörg Hinrichs. 2020. "Investigation of the Applicability of Raman Spectroscopy as Online Process Control during Consumer Milk Production" ChemEngineering 4, no. 3: 45. https://doi.org/10.3390/chemengineering4030045