Colocalization of MID1IP1 and c-Myc is Critically Involved in Liver Cancer Growth via Regulation of Ribosomal Protein L5 and L11 and CNOT2

 ,
,  and
and 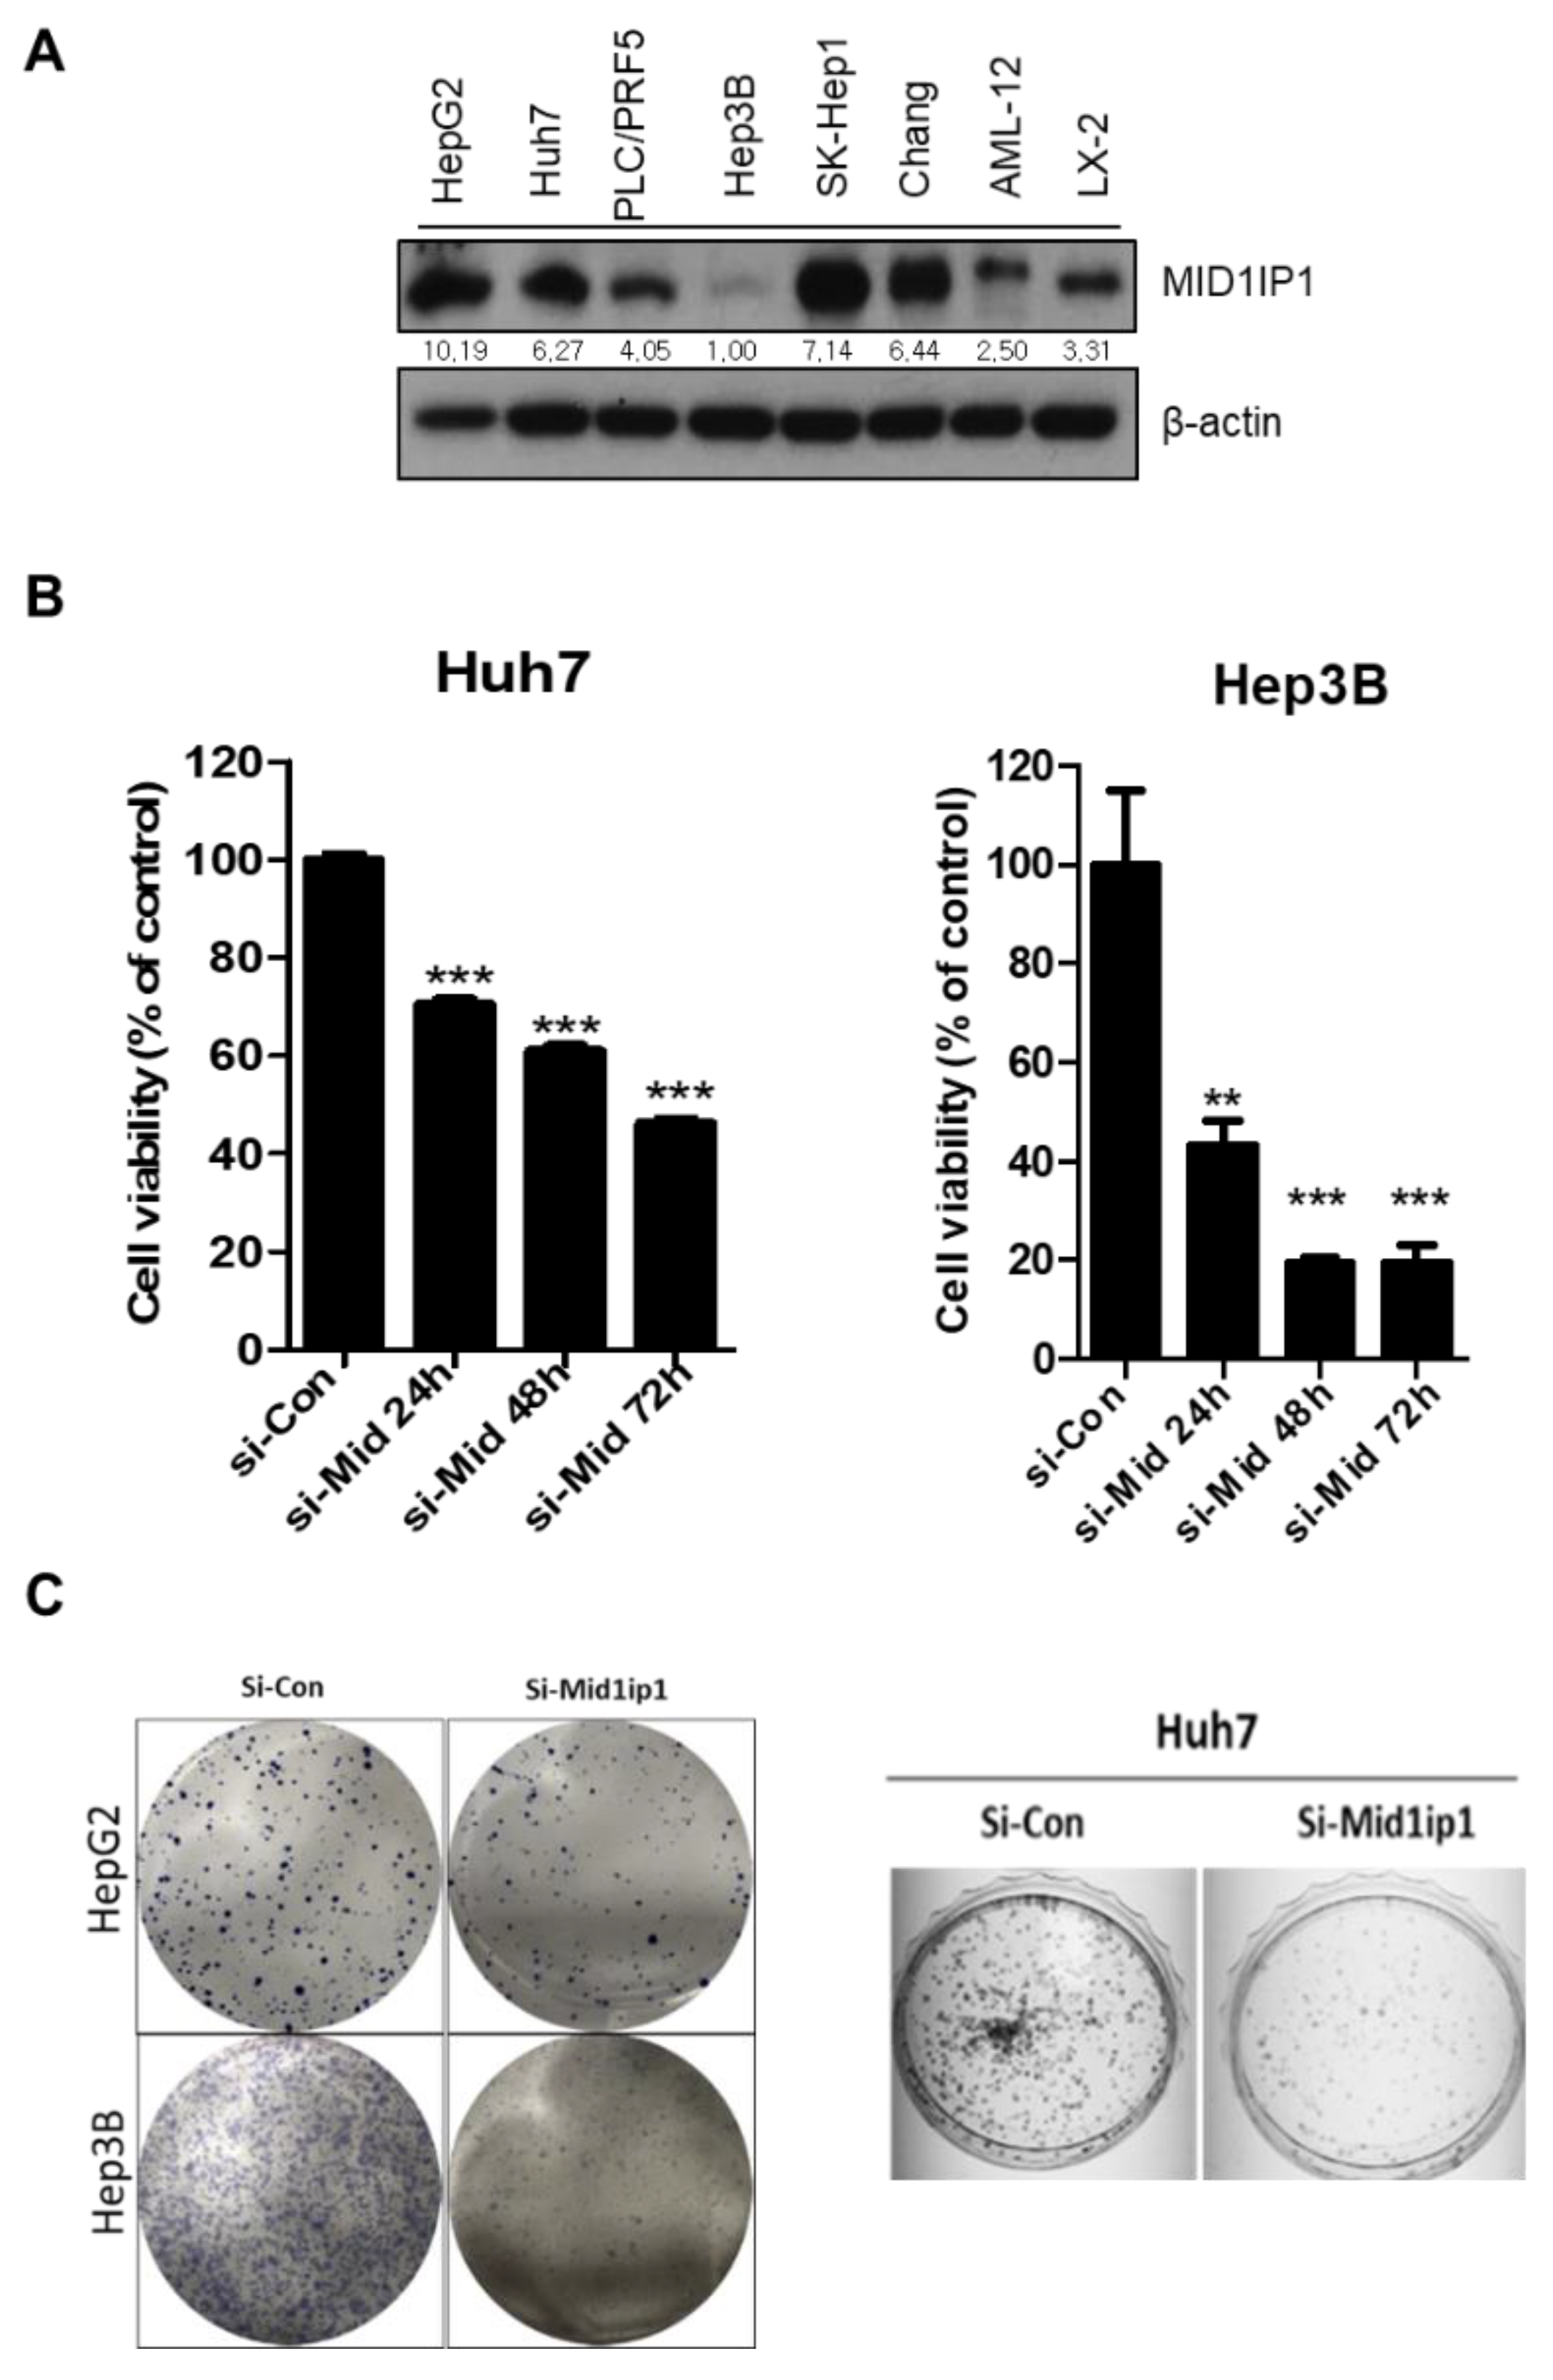
Abstract
:1. Introduction
2. Materials and Methods
2.1. Cell Culture
2.2. RNA Interference
2.3. Cytotoxicity Assay
2.4. Colony Formation Assay
2.5. Cell Cycle Analysis
2.6. Terminal Deoxynucleotidyl Transferase-dT-Mediated dUTP Nick End Labelling (TUNEL) Assay
2.7. Tissue Microarray and Immunohistochemistry
2.8. Western Blotting
2.9. c-Myc Stability Assay Using Cycloheximide
2.10. Immunofluorescence Assay
2.11. Statistical Analysis
3. Results
3.1. Endogenous Expression Levels in a Variety of Cells and Effect of MID1IP1 Depletion on the Viability and the Number of Colonies in HCCs
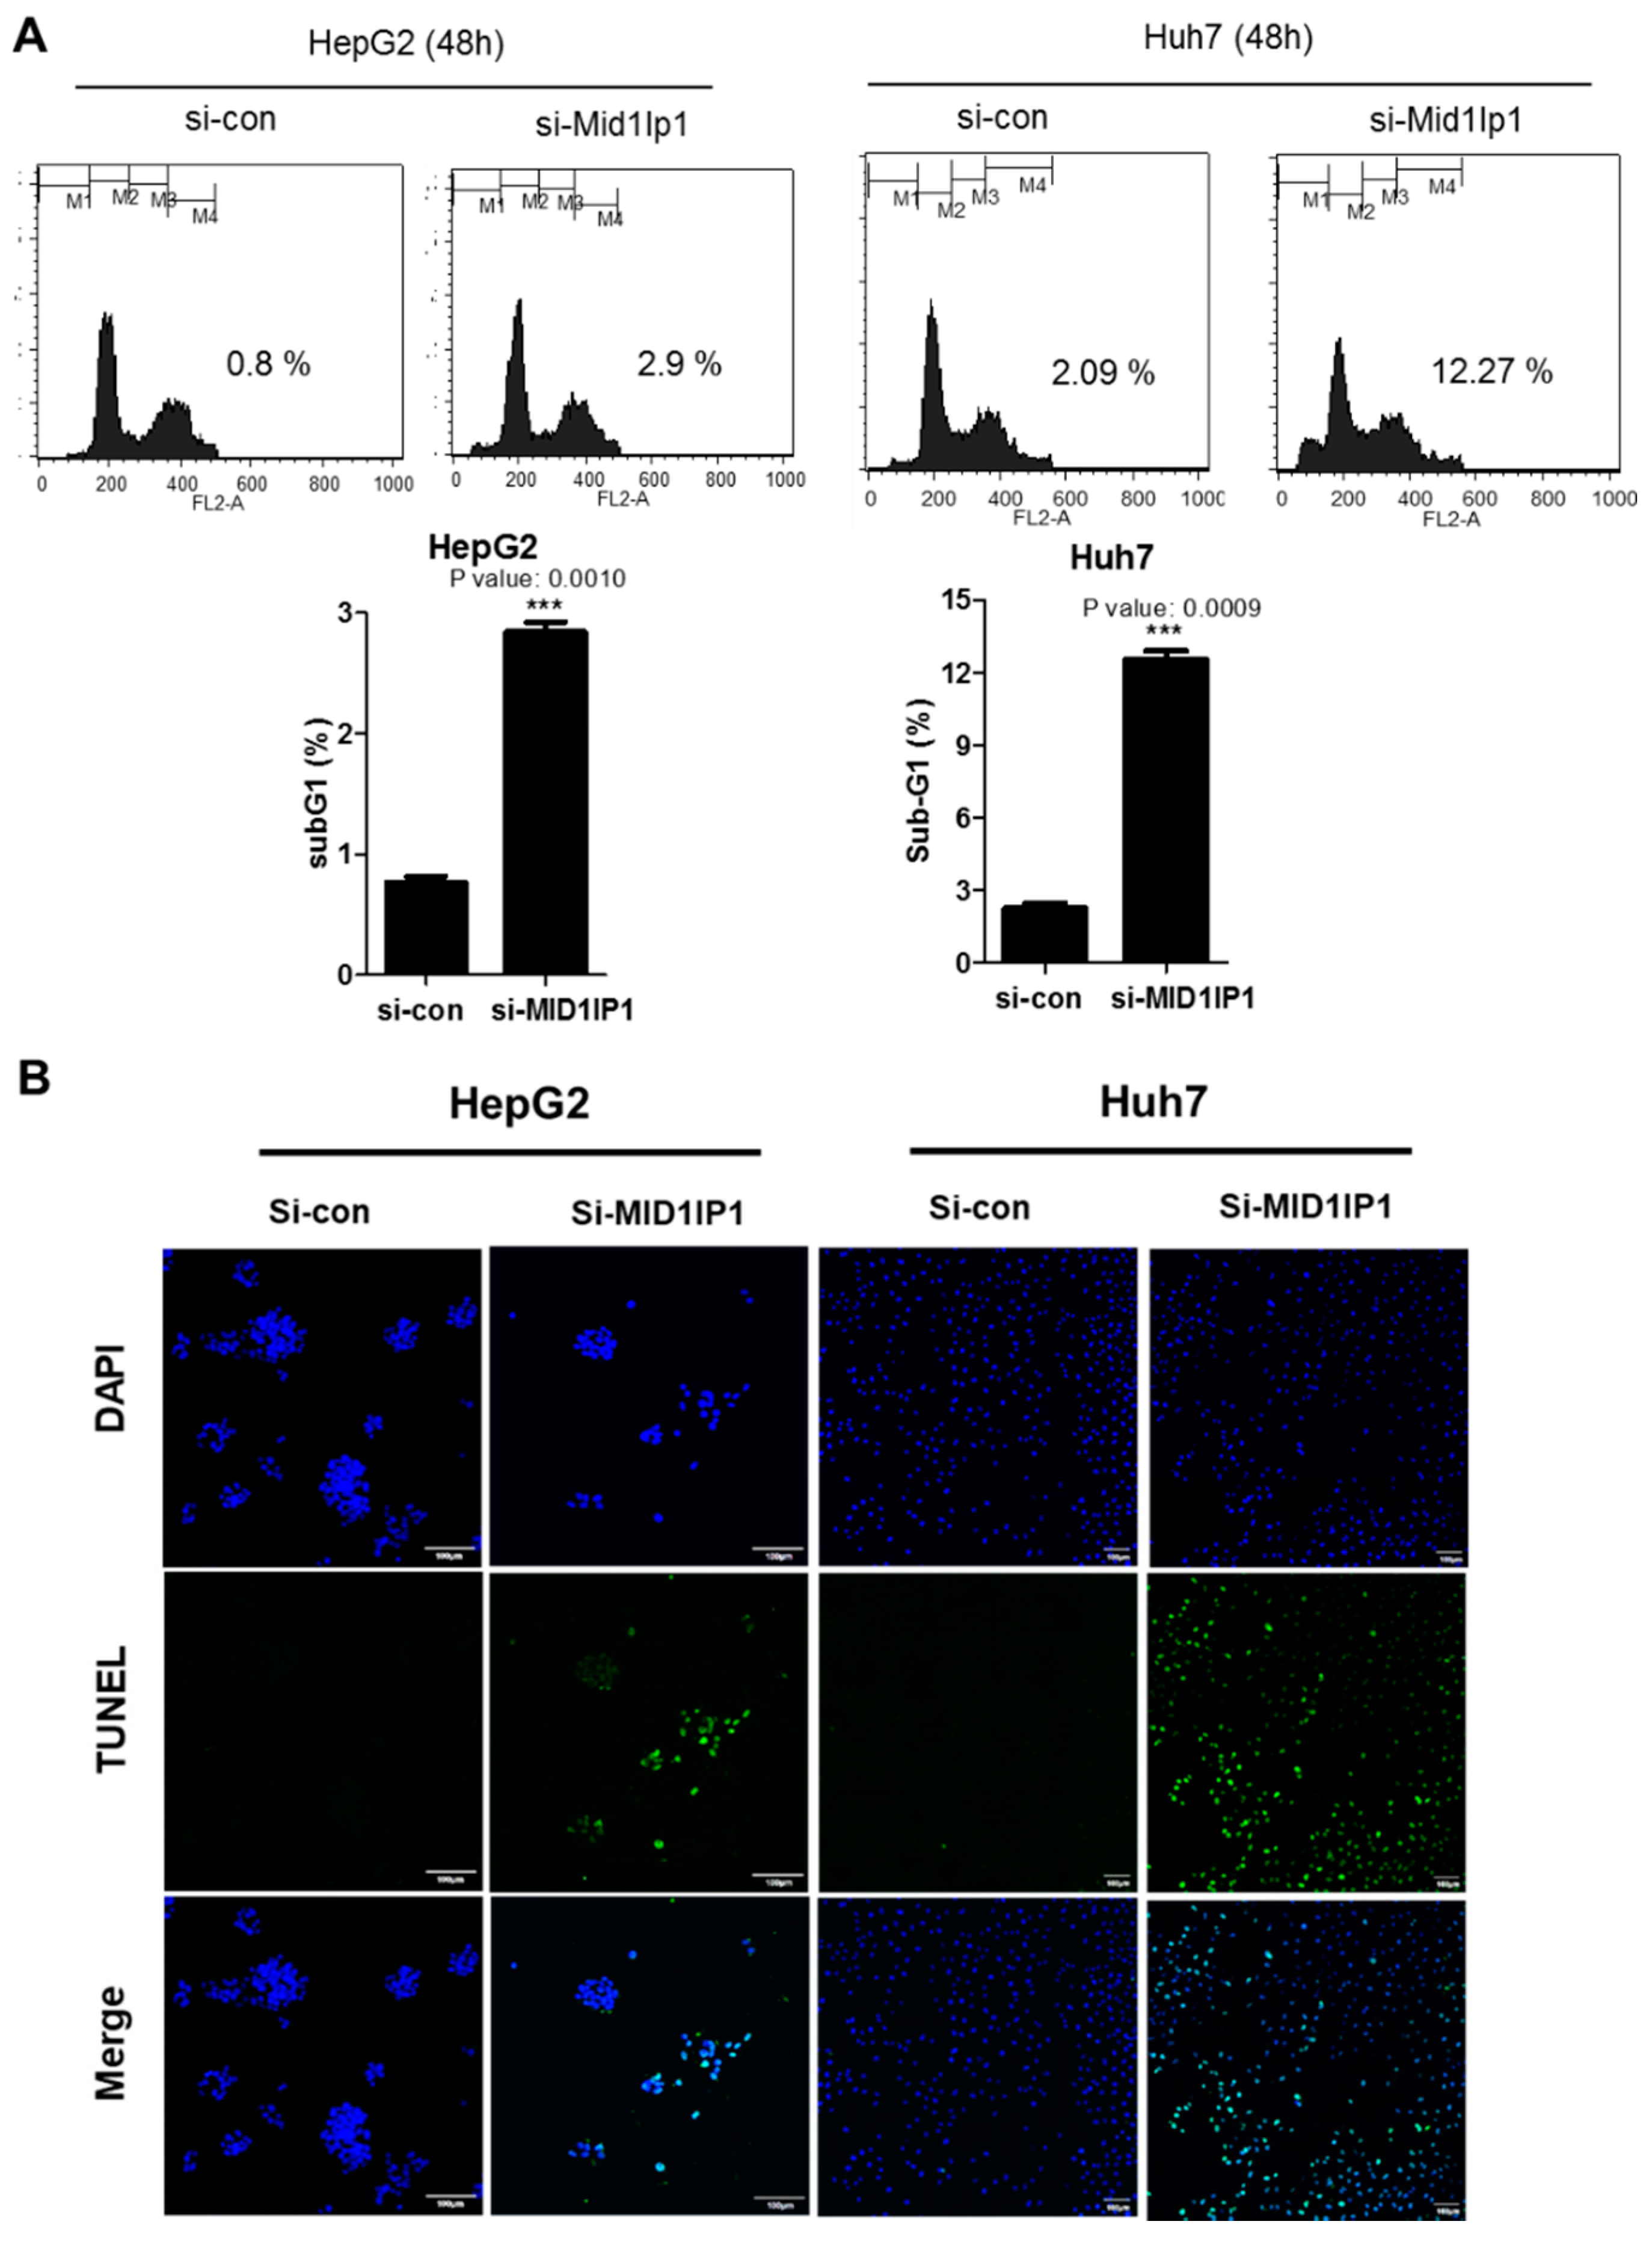
3.2. MID1IP1 Depletion Increases Sub G1 Population and Increases the Number of TUNEL-Positive Cells in HepG2 and Huh7 Cells
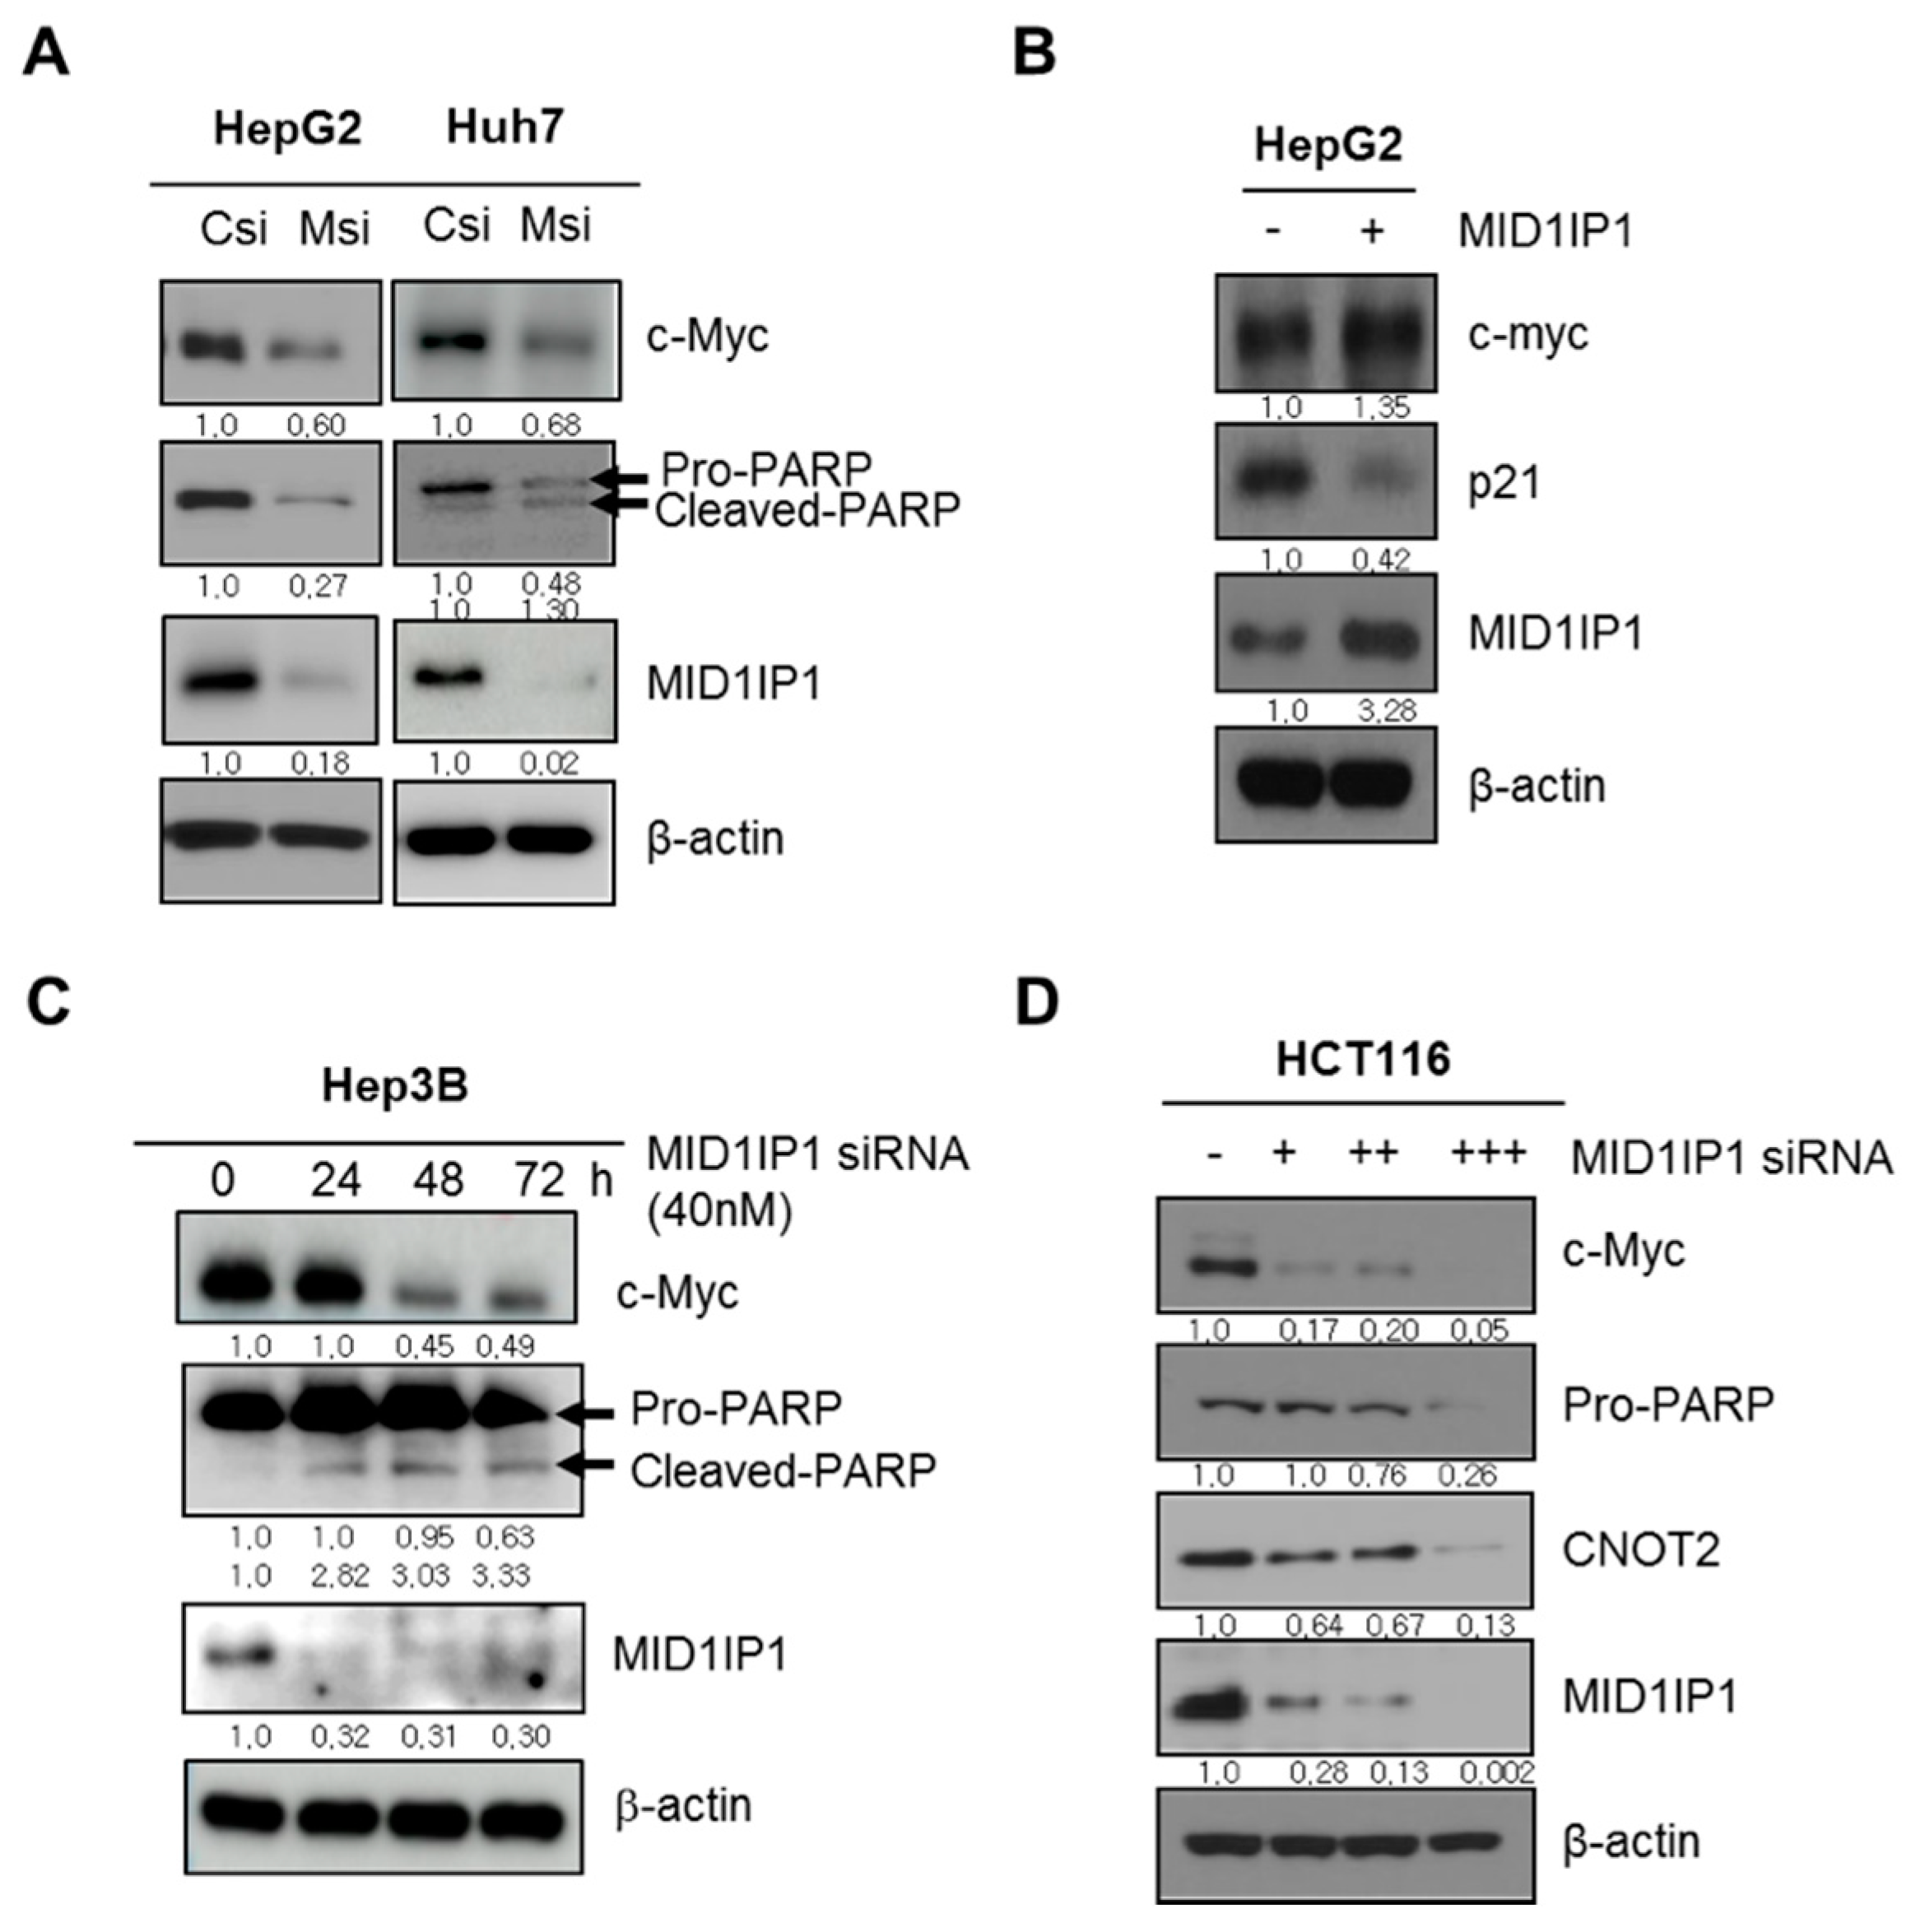
3.3. MID1IP1 Depletion Attenuates the Expression of Pro-PARP, c-Myc and CNOT2 and Activates p21 in Cancers
3.4. MID1IP1 Depletion Attenuates c-Myc Stability in HepG2 and Huh7 Cells in the Presence of Cycloheximide
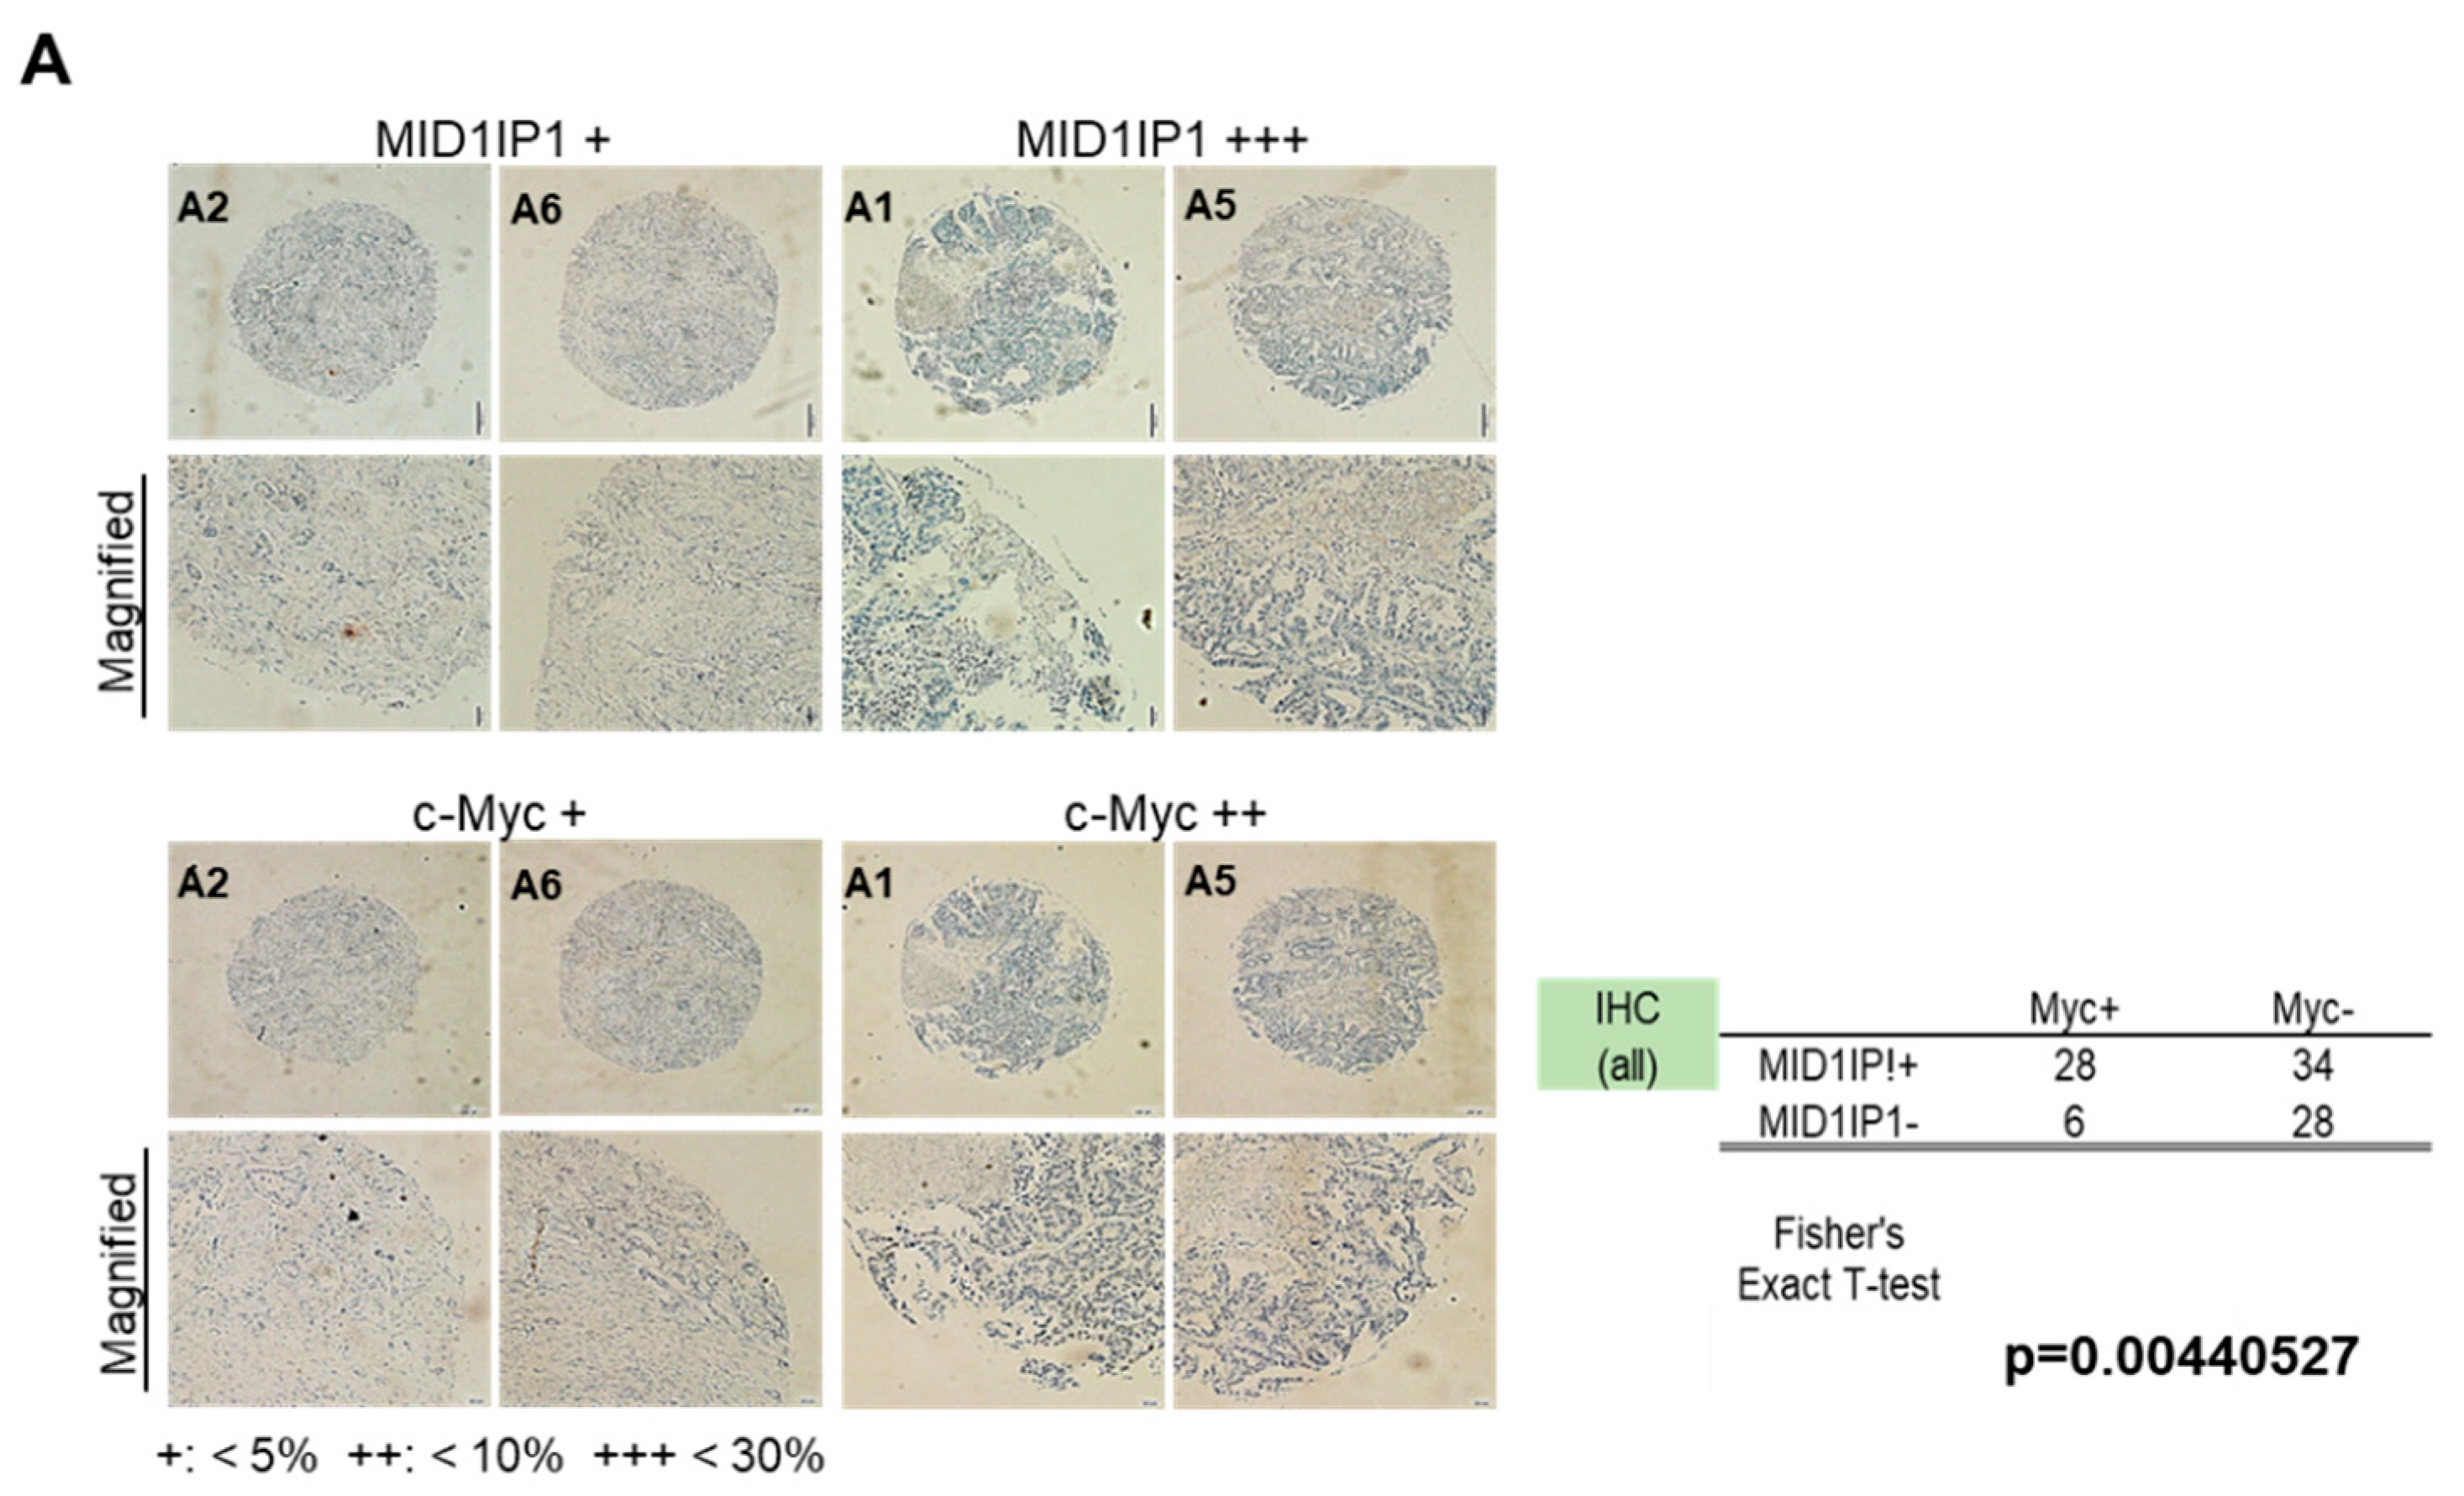
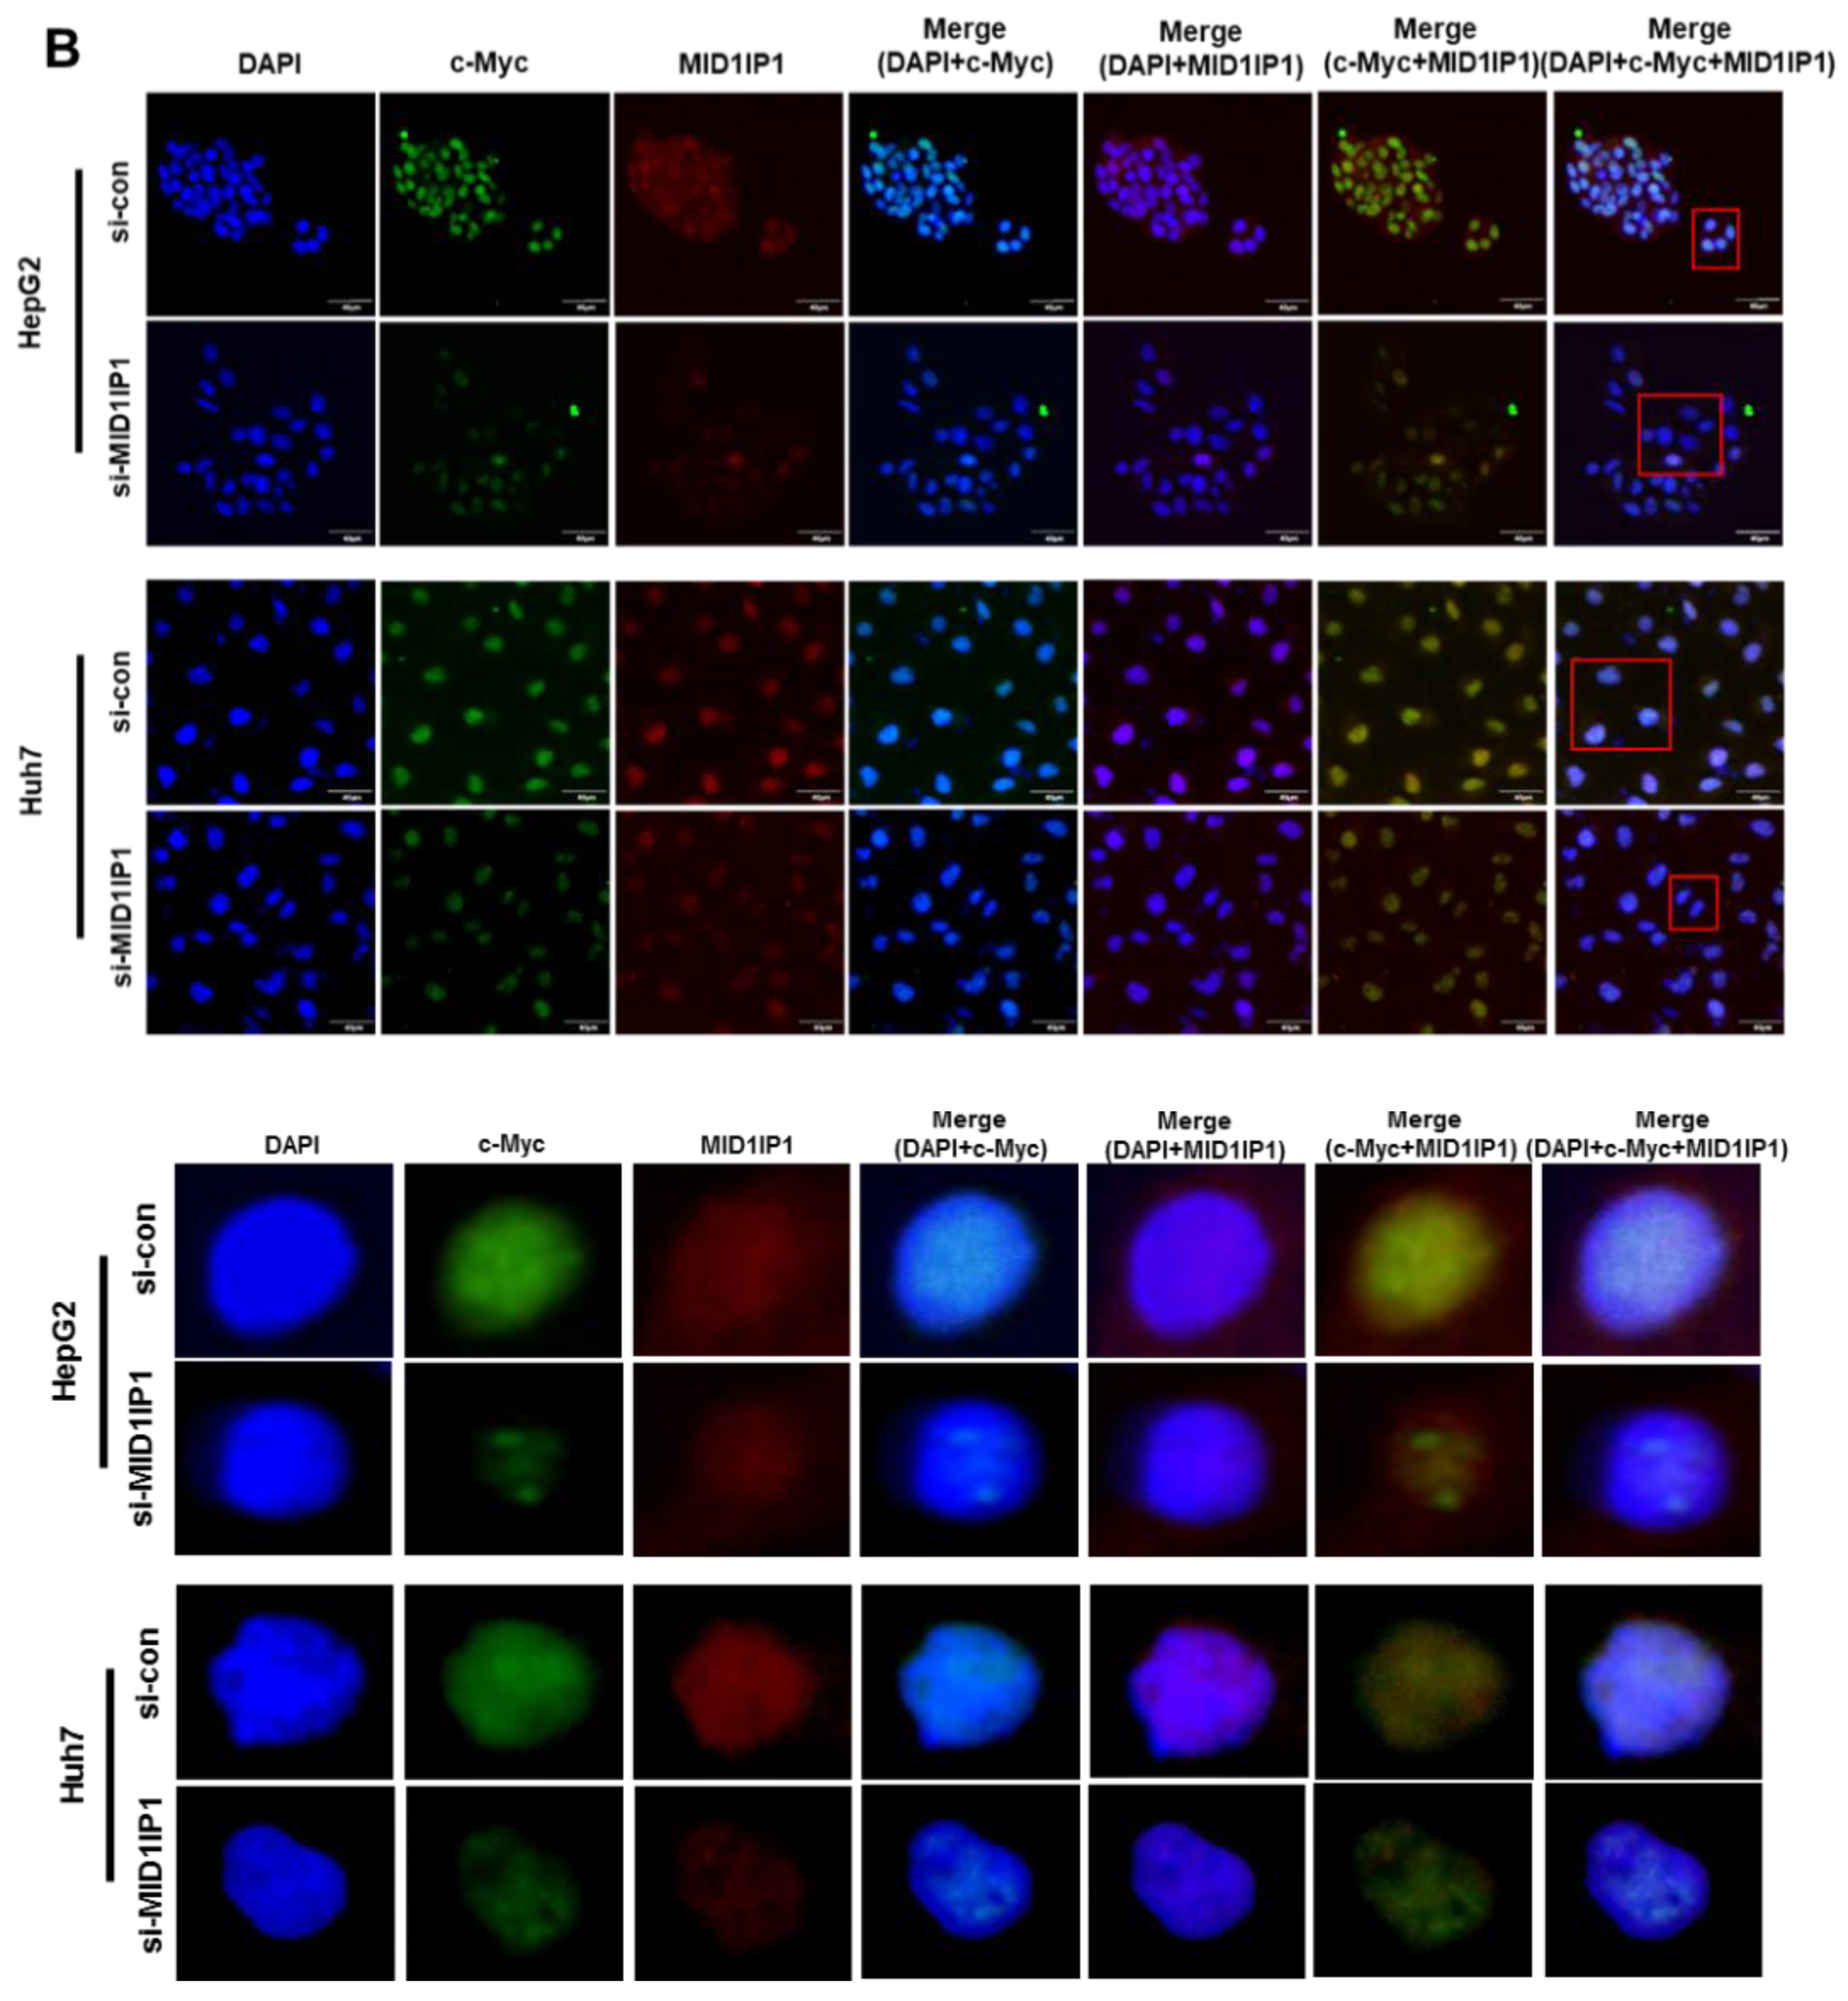
3.5. Colocalization Between MID1IP1 and c-Myc in Human HCC Tissues, HepG2 and Huh7 Cells
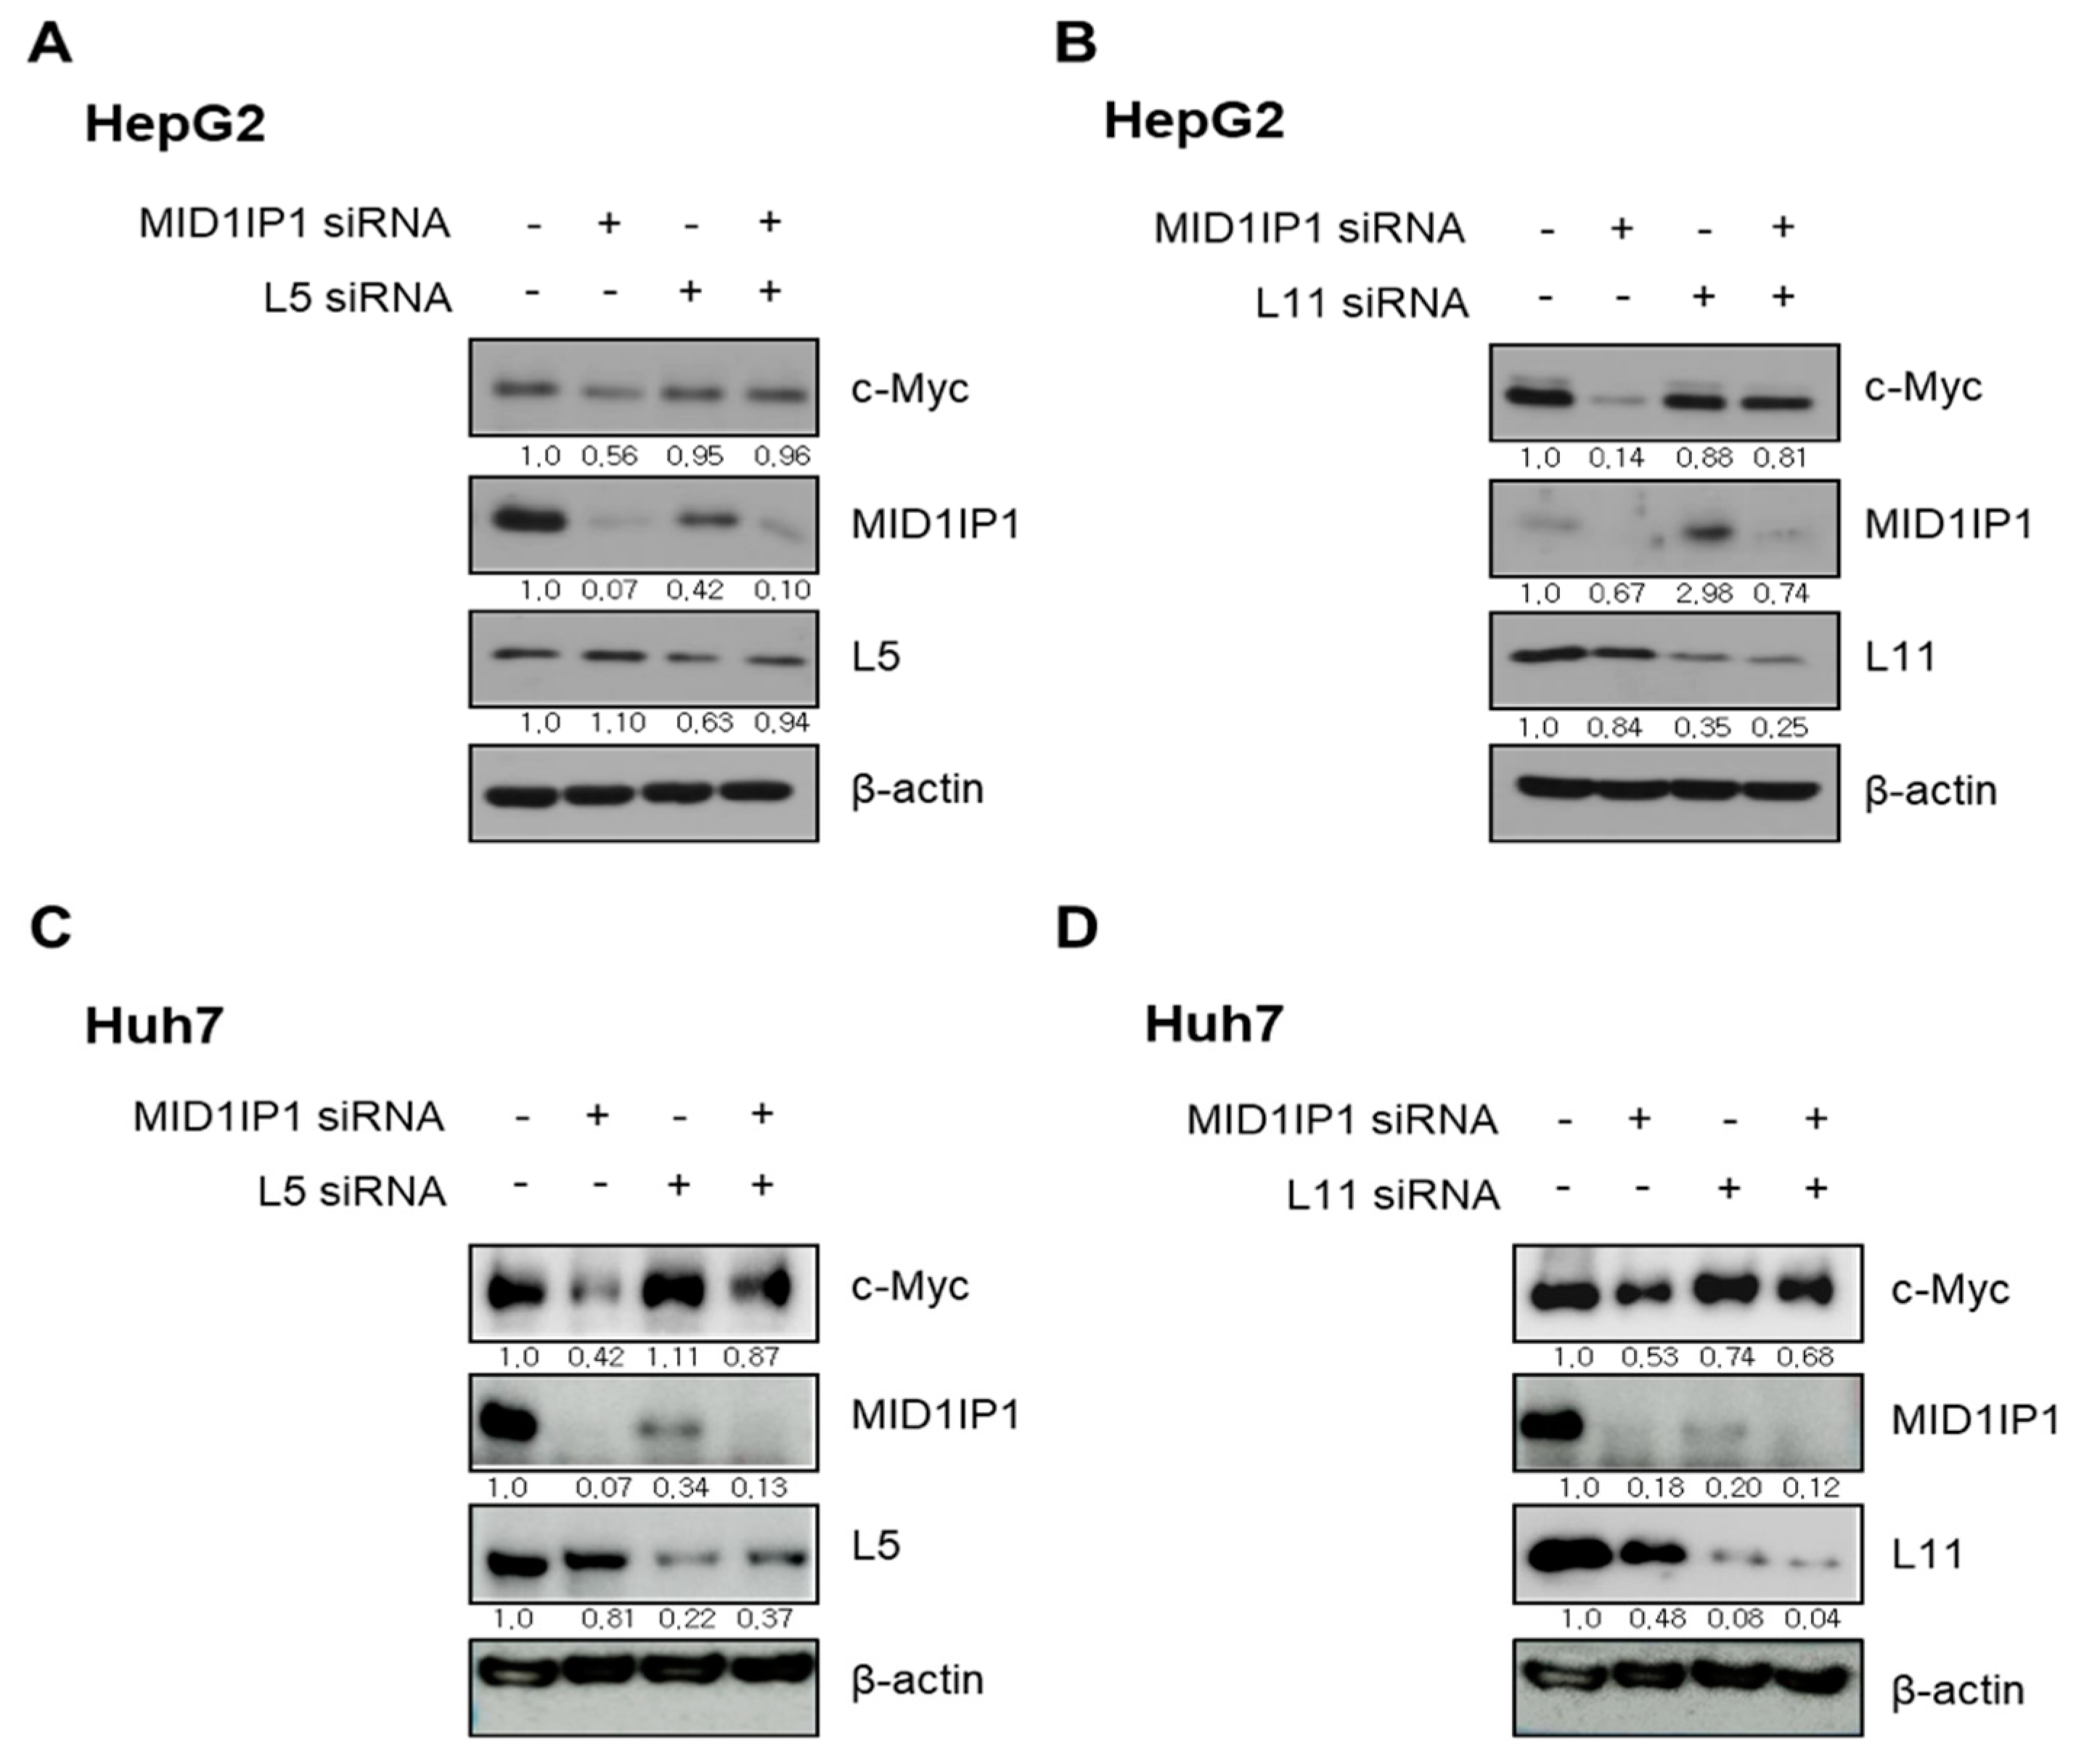
3.6. The Critical Role of Ribosomal Protein L5 or L11 in c-Myc Inhibition by MID1IP1 Depletion in HepG2 and Huh7 Cells
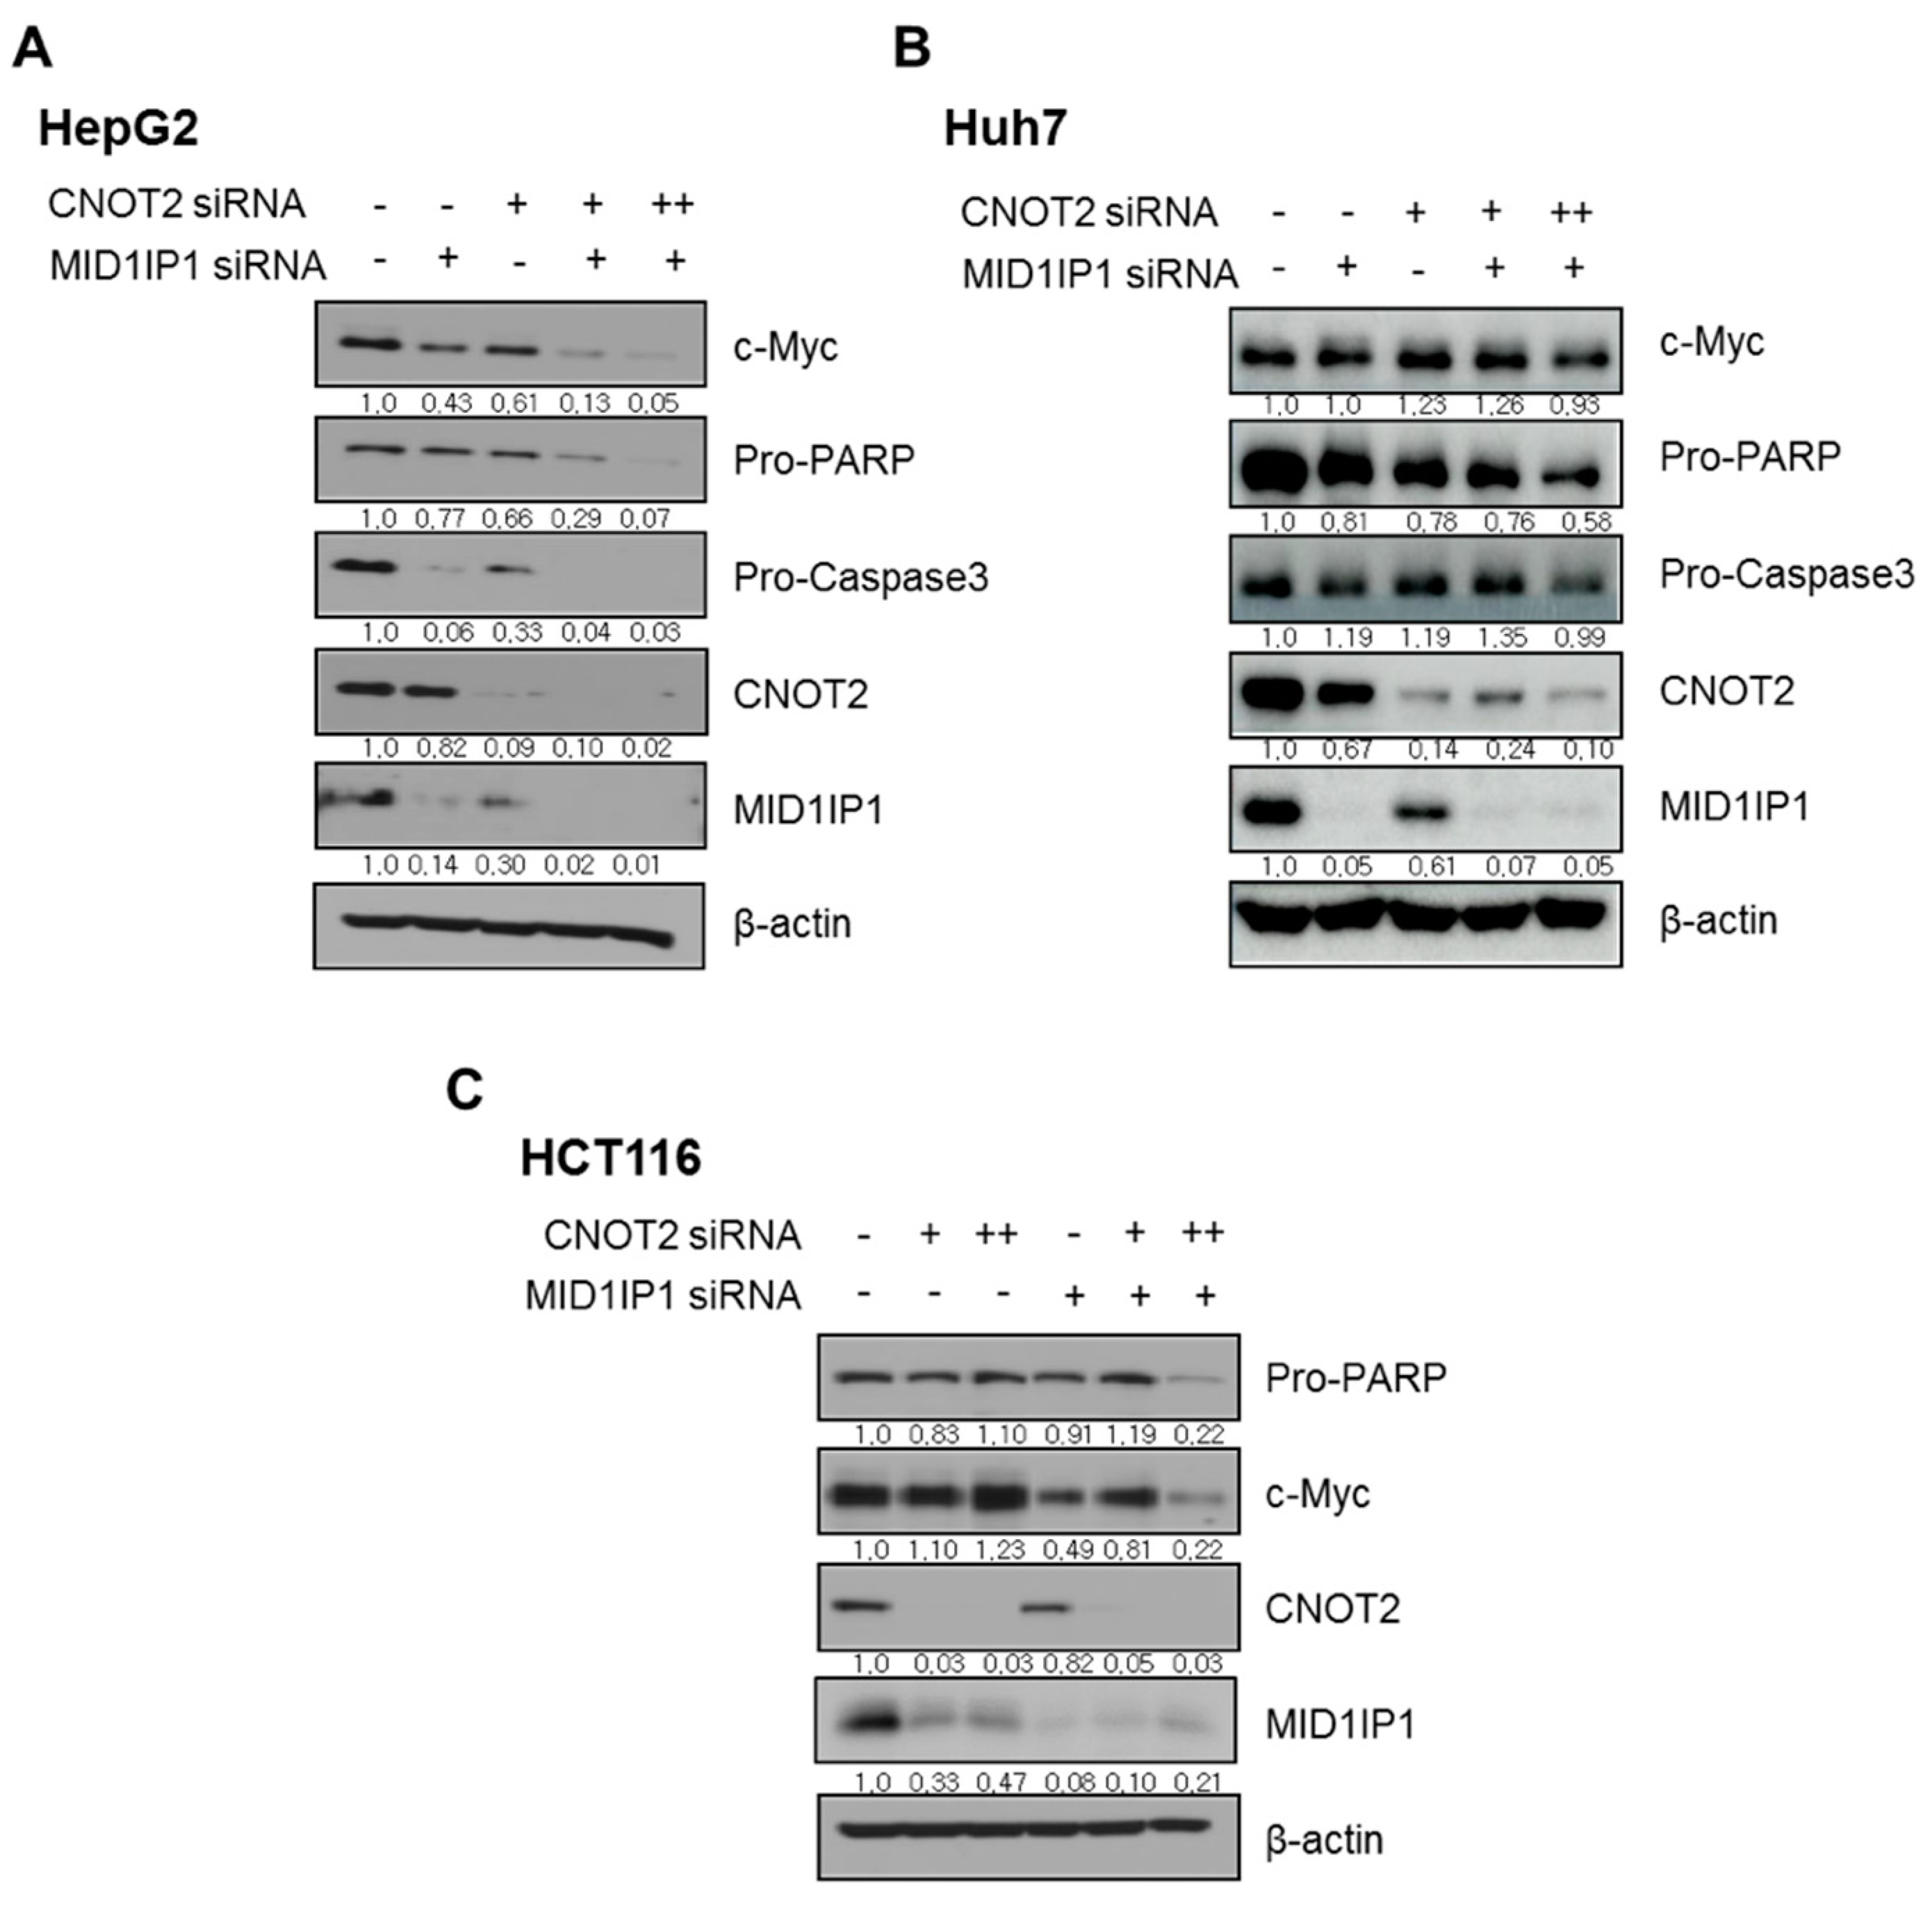
3.7. CNOT2 Knockdown Enhances Antitumor Effect of MID1IP1 Depletion in HepG2, Huh7 and HCT116 Cells
4. Discussion
5. Conclusions
Author Contributions
Funding
Acknowledgments
Conflicts of Interest
References
- Bray, F.; Ferlay, J.; Soerjomataram, I.; Siegel, R.L.; Torre, L.A.; Jemal, A. Global cancer statistics 2018: GLOBOCAN estimates of incidence and mortality worldwide for 36 cancers in 185 countries. CA Cancer J. Clin. 2018, 68, 394–424. [Google Scholar] [CrossRef] [PubMed] [Green Version]
- Wai Ling Khoo, T.S.; Rehman, A.; Olynyk, J.K. Tyrosine Kinase Inhibitors in the Treatment of Hepatocellular Carcinoma. In Hepatocellular Carcinoma; Tirnitz-Parker, J.E.E., Ed.; Codon Publications: Brisbane, Autralia, 2019; Chapter 4. [Google Scholar]
- Keating, G.M. Sorafenib: A Review in Hepatocellular Carcinoma. Target. Oncol. 2017, 12, 243–253. [Google Scholar] [CrossRef] [PubMed]
- Chedid, M.F.; Kruel, C.R.P.; Pinto, M.A.; Grezzana-Filho, T.J.M.; Leipnitz, I.; Kruel, C.D.P.; Scaffaro, L.A.; Chedid, A.D. Hepatocellular Carcinoma: Diagnosis And Operative Management. Arq. Bras. Cir. Dig. 2017, 30, 272–278. [Google Scholar] [CrossRef] [PubMed]
- Meirelles Junior, R.F.; Salvalaggio, P.; Rezende, M.B.; Evangelista, A.S.; Guardia, B.D.; Matielo, C.E.; Neves, D.B.; Pandullo, F.L.; Felga, G.E.; Alves, J.A.; et al. Liver transplantation: History, outcomes and perspectives. Einstein (Sao Paulo) 2015, 13, 149–152. [Google Scholar] [CrossRef] [PubMed] [Green Version]
- Hiesinger, K.; Wagner, K.M.; Hammock, B.D.; Proschak, E.; Hwang, S.H. Development of multitarget agents possessing soluble epoxide hydrolase inhibitory activity. Prostaglandins Other Lipid Mediat. 2019, 140, 31–39. [Google Scholar] [CrossRef]
- Ogunwobi, O.O.; Harricharran, T.; Huaman, J.; Galuza, A.; Odumuwagun, O.; Tan, Y.; Ma, G.X.; Nguyen, M.T. Mechanisms of hepatocellular carcinoma progression. World J. Gastroenterol. 2019, 25, 2279–2293. [Google Scholar] [CrossRef]
- Dang, C.V. MYC on the path to cancer. Cell 2012, 149, 22–35. [Google Scholar] [CrossRef] [Green Version]
- Hsieh, A.L.; Walton, Z.E.; Altman, B.J.; Stine, Z.E.; Dang, C.V. MYC and metabolism on the path to cancer. Semin. Cell Dev. Biol. 2015, 43, 11–21. [Google Scholar] [CrossRef] [Green Version]
- Chen, H.; Liu, H.; Qing, G. Targeting oncogenic Myc as a strategy for cancer treatment. Signal. Transduct. Target. 2018, 3, 5. [Google Scholar] [CrossRef] [Green Version]
- van Riggelen, J.; Yetil, A.; Felsher, D.W. MYC as a regulator of ribosome biogenesis and protein synthesis. Nat. Rev. Cancer 2010, 10, 301–309. [Google Scholar] [CrossRef] [PubMed]
- Lessard, F.; Brakier-Gingras, L.; Ferbeyre, G. Ribosomal Proteins Control Tumor Suppressor Pathways in Response to Nucleolar Stress. Bioessays 2019, 41, e1800183. [Google Scholar] [CrossRef] [PubMed]
- Kressler, D.; Hurt, E.; Bassler, J. A Puzzle of Life: Crafting Ribosomal Subunits. Trends Biochem. Sci. 2017, 42, 640–654. [Google Scholar] [CrossRef] [PubMed] [Green Version]
- Sulima, S.O.; Hofman, I.J.F.; De Keersmaecker, K.; Dinman, J.D. How Ribosomes Translate Cancer. Cancer Discov. 2017, 7, 1069–1087. [Google Scholar] [CrossRef] [PubMed] [Green Version]
- Takada, H.; Kurisaki, A. Emerging roles of nucleolar and ribosomal proteins in cancer, development, and aging. Cell Mol. Life Sci. 2015, 72, 4015–4025. [Google Scholar] [CrossRef] [PubMed]
- Jung, J.H.; Lee, H.; Kim, J.H.; Sim, D.Y.; Ahn, H.; Kim, B.; Chang, S.; Kim, S.H. p53-Dependent Apoptotic Effect of Puromycin via Binding of Ribosomal Protein L5 and L11 to MDM2 and its Combination Effect with RITA or Doxorubicin. Cancers (Basel) 2019, 11, 582. [Google Scholar] [CrossRef] [Green Version]
- Liao, J.M.; Zhou, X.; Gatignol, A.; Lu, H. Ribosomal proteins L5 and L11 co-operatively inactivate c-Myc via RNA-induced silencing complex. Oncogene 2014, 33, 4916–4923. [Google Scholar] [CrossRef] [Green Version]
- Zhou, X.; Hao, Q.; Zhang, Q.; Liao, J.M.; Ke, J.W.; Liao, P.; Cao, B.; Lu, H. Ribosomal proteins L11 and L5 activate TAp73 by overcoming MDM2 inhibition. Cell Death Differ. 2015, 22, 755–766. [Google Scholar] [CrossRef]
- Sae-Lee, C.; Moolsuwan, K.; Chan, L.; Poungvarin, N. ChREBP Regulates Itself and Metabolic Genes Implicated in Lipid Accumulation in beta-Cell Line. PLoS ONE 2016, 11, e0147411. [Google Scholar] [CrossRef] [Green Version]
- Kim, M.J.; Sim, D.Y.; Lee, H.M. Hypolipogenic Effect of Shikimic Acid Via Inhibition of MID1IP1 and Phosphorylation of AMPK/ACC. Int. J. Mol. Sci. 2019, 20, 582. [Google Scholar] [CrossRef] [Green Version]
- Sohn, E.J.; Jung, D.B.; Lee, J.; Yoon, S.W.; Won, G.H.; Ko, H.S.; Kim, S.H. CCR4-NOT2 Promotes the Differentiation and Lipogenesis of 3T3-L1 Adipocytes via Upregulation of PPARx03B3;, CEBPalpha and Inhibition of P-GSK3alpha/beta and beta-Catenin. Cell Physiol. Biochem. 2015, 37, 1881–1889. [Google Scholar] [CrossRef]
- Sohn, E.J.; Jung, D.B.; Lee, H.; Han, I.; Lee, J.; Lee, H.; Kim, S.H. CNOT2 promotes proliferation and angiogenesis via VEGF signaling in MDA-MB-231 breast cancer cells. Cancer Lett. 2018, 412, 88–98. [Google Scholar] [CrossRef] [PubMed]
- Ito, K.; Inoue, T.; Yokoyama, K.; Morita, M.; Suzuki, T.; Yamamoto, T. CNOT2 depletion disrupts and inhibits the CCR4-NOT deadenylase complex and induces apoptotic cell death. Genes Cells 2011, 16, 368–379. [Google Scholar] [CrossRef] [PubMed]
- Jeong, K.; Kwon, H.Y.; Jeong, M.S.; Sohn, E.J.; Kim, S.H. CNOT2 promotes degradation of p62/SQSTM1 as a negative regulator in ATG5 dependent autophagy. Oncotarget 2017, 8, 46034–46046. [Google Scholar] [CrossRef]
- Liberti, M.V.; Locasale, J.W. The Warburg Effect: How Does it Benefit Cancer Cells? Trends Biochem. Sci. 2016, 41, 211–218. [Google Scholar] [CrossRef] [Green Version]
- Schwartz, L.; Supuran, C.T.; Alfarouk, K.O. The Warburg Effect and the Hallmarks of Cancer. Anticancer Agents Med. Chem. 2017, 17, 164–170. [Google Scholar] [CrossRef] [PubMed]
- Jung, J.H.; Jung, D.B.; Kim, H.; Lee, H.; Kang, S.E.; Srivastava, S.K.; Yun, M.; Kim, S.H. Zinc finger protein 746 promotes colorectal cancer progression via c-Myc stability mediated by glycogen synthase kinase 3beta and F-box and WD repeat domain-containing 7. Oncogene 2018, 37, 3715–3728. [Google Scholar] [CrossRef]
- Jung, J.H.; Shin, E.A.; Kim, J.H.; Sim, D.Y.; Lee, H.; Park, J.E.; Lee, H.J.; Kim, S.H. NEDD9 Inhibition by miR-25-5p Activation Is Critically Involved in Co-Treatment of Melatonin- and Pterostilbene-Induced Apoptosis in Colorectal Cancer Cells. Cancers (Basel) 2019, 11, 1684. [Google Scholar] [CrossRef] [PubMed] [Green Version]
- Lee, H.; Lee, H.J.; Jung, J.H.; Shin, E.A.; Kim, S.H. Melatonin disturbs SUMOylation-mediated crosstalk between c-Myc and nestin via MT1 activation and promotes the sensitivity of paclitaxel in brain cancer stem cells. J. Pineal. Res. 2018, 65, e12496. [Google Scholar] [CrossRef]
- Bae, G.D.; Park, E.Y.; Kim, K.; Jang, S.E.; Jun, H.S.; Oh, Y.S. Upregulation of caveolin-1 and its colocalization with cytokine receptors contributes to beta cell apoptosis. Sci. Rep. 2019, 9, 16785. [Google Scholar] [CrossRef]
- Dias Carvalho, P.; Guimaraes, C.F.; Cardoso, A.P.; Mendonca, S.; Costa, A.M.; Oliveira, M.J.; Velho, S. KRAS Oncogenic Signaling Extends beyond Cancer Cells to Orchestrate the Microenvironment. Cancer Res. 2018, 78, 7–14. [Google Scholar] [CrossRef] [Green Version]
- Carabet, L.A.; Rennie, P.S.; Cherkasov, A. Therapeutic Inhibition of Myc in Cancer. Structural Bases and Computer-Aided Drug Discovery Approaches. Int. J. Mol. Sci. 2019, 20, 120. [Google Scholar] [CrossRef] [PubMed] [Green Version]
- Morales, J.; Li, L.; Fattah, F.J.; Dong, Y.; Bey, E.A.; Patel, M.; Gao, J.; Boothman, D.A. Review of poly (ADP-ribose) polymerase (PARP) mechanisms of action and rationale for targeting in cancer and other diseases. Crit. Rev. Eukaryot. Gene Expr. 2014, 24, 15–28. [Google Scholar] [CrossRef] [PubMed] [Green Version]
- McIlwain, D.R.; Berger, T.; Mak, T.W. Caspase functions in cell death and disease. Cold Spring Harb. Perspect. Biol. 2015, 7, a026716. [Google Scholar] [CrossRef] [PubMed] [Green Version]
- Chen, A.; Huang, X.; Xue, Z.; Cao, D.; Huang, K.; Chen, J.; Pan, Y.; Gao, Y. The Role of p21 in Apoptosis, Proliferation, Cell Cycle Arrest, and Antioxidant Activity in UVB-Irradiated Human HaCaT Keratinocytes. Med. Sci. Monit. Basic Res. 2015, 21, 86–95. [Google Scholar]
- Dai, M.S.; Lu, H. Crosstalk between c-Myc and ribosome in ribosomal biogenesis and cancer. J. Cell Biochem. 2008, 105, 670–677. [Google Scholar] [CrossRef] [Green Version]
- Khatter, H.; Myasnikov, A.G.; Natchiar, S.K.; Klaholz, B.P. Structure of the human 80S ribosome. Nature 2015, 520, 640–645. [Google Scholar] [CrossRef]
- Lee, J.; Jung, J.H. CNOT2 Is Critically Involved in Atorvastatin Induced Apoptotic and Autophagic Cell Death in Non-Small Cell Lung Cancers. Cancers 2019, 11, 1470. [Google Scholar] [CrossRef] [Green Version]
- Hines, I.N.; Hartwell, H.J.; Feng, Y.; Theve, E.J.; Hall, G.A.; Hashway, S.; Connolly, J.; Fecteau, M.; Fox, J.G.; Rogers, A.B. Insulin resistance and metabolic hepatocarcinogenesis with parent-of-origin effects in AxB mice. Am. J. Pathol. 2011, 179, 2855–2865. [Google Scholar] [CrossRef] [Green Version]
- Luis, C.; Duarte, F.; Faria, I.; Jarak, I.; Oliveira, P.F.; Alves, M.G.; Soares, R.; Fernandes, R. Warburg Effect Inversion: Adiposity shifts central primary metabolism in MCF-7 breast cancer cells. Life Sci. 2019, 223, 38–46. [Google Scholar] [CrossRef]


© 2020 by the authors. Licensee MDPI, Basel, Switzerland. This article is an open access article distributed under the terms and conditions of the Creative Commons Attribution (CC BY) license (http://creativecommons.org/licenses/by/4.0/).
Share and Cite
Jung, J.H.; Lee, H.-J.; Kim, J.-H.; Sim, D.Y.; Im, E.; Kim, S.; Chang, S.; Kim, S.-H. Colocalization of MID1IP1 and c-Myc is Critically Involved in Liver Cancer Growth via Regulation of Ribosomal Protein L5 and L11 and CNOT2. Cells 2020, 9, 985. https://doi.org/10.3390/cells9040985
Jung JH, Lee H-J, Kim J-H, Sim DY, Im E, Kim S, Chang S, Kim S-H. Colocalization of MID1IP1 and c-Myc is Critically Involved in Liver Cancer Growth via Regulation of Ribosomal Protein L5 and L11 and CNOT2. Cells. 2020; 9(4):985. https://doi.org/10.3390/cells9040985
Chicago/Turabian StyleJung, Ji Hoon, Hyo-Jung Lee, Ju-Ha Kim, Deok Yong Sim, Eunji Im, Sinae Kim, Suhwan Chang, and Sung-Hoon Kim. 2020. "Colocalization of MID1IP1 and c-Myc is Critically Involved in Liver Cancer Growth via Regulation of Ribosomal Protein L5 and L11 and CNOT2" Cells 9, no. 4: 985. https://doi.org/10.3390/cells9040985