A Regulatory Noncoding RNA, nc886, Suppresses Esophageal Cancer by Inhibiting the AKT Pathway and Cell Cycle Progression

 , , and
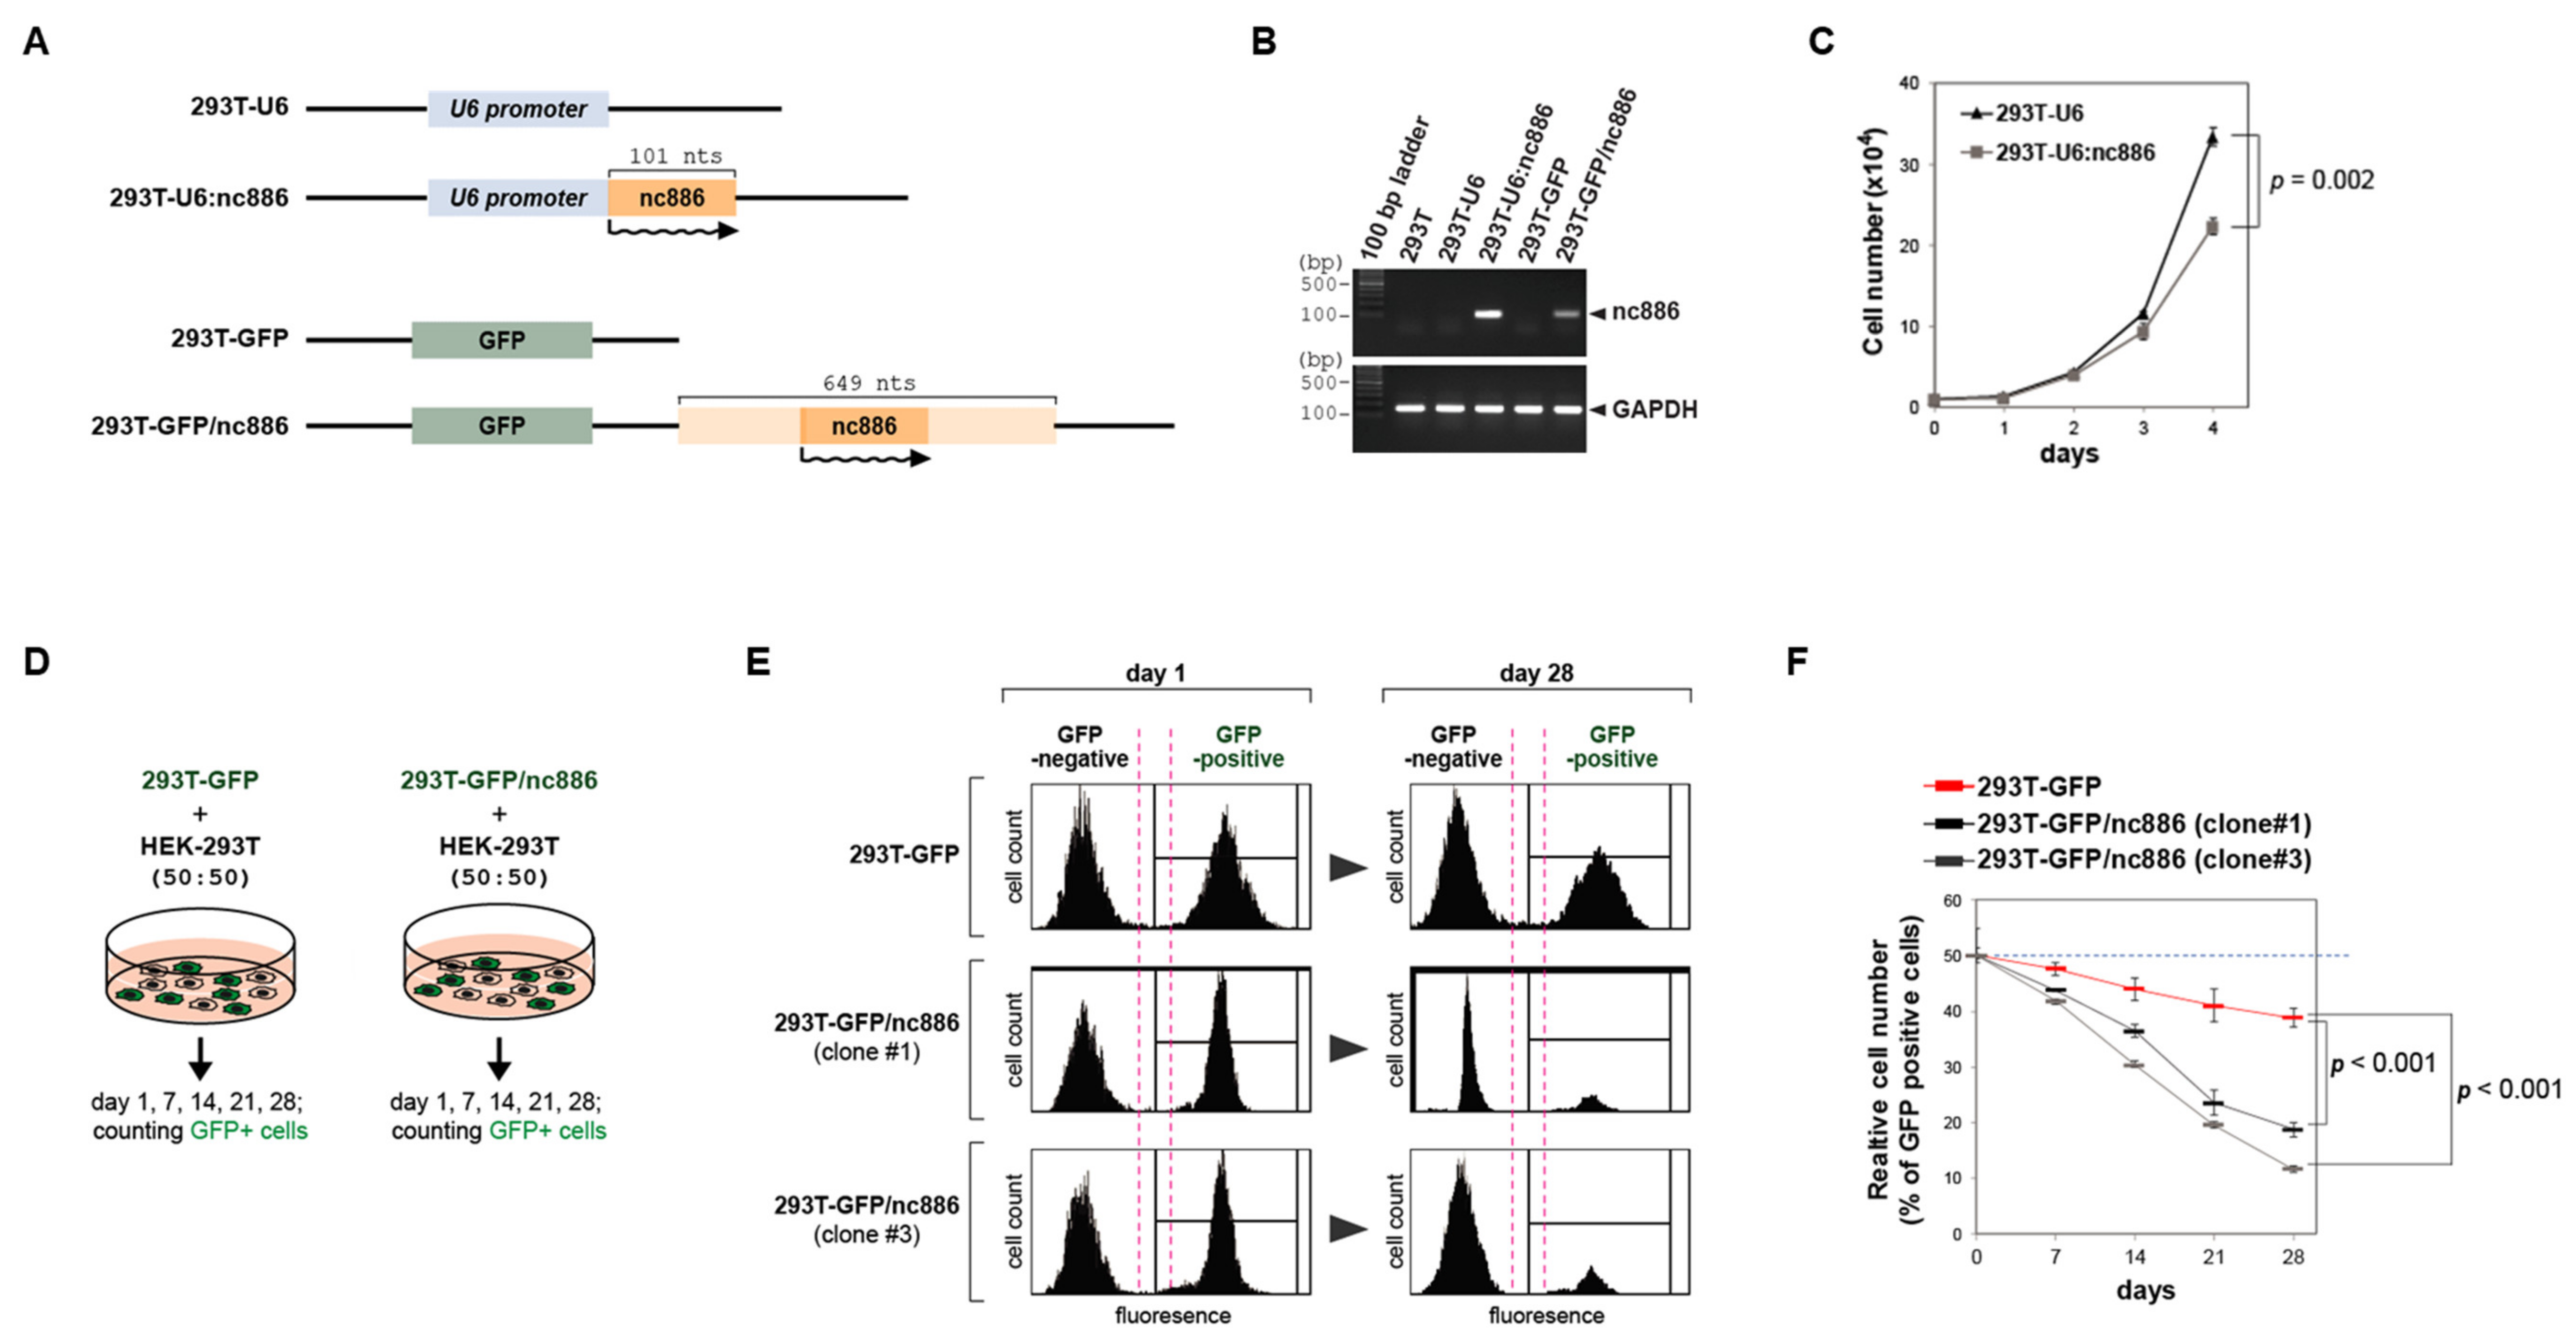
Abstract
:1. Introduction
2. Materials and Methods
2.1. Cell Lines, Plasmid DNAs, Antibodies, and Other Reagents
2.2. ESCC Patients
2.3. RNA Measurement
2.4. nc886 Knockdown (KD)
2.5. mRNA Expression Profiling (Array)
2.6. Reverse Phase Protein Arrays (RPPA)
2.7. Measurement of Cell Proliferation, Cell Synchronization, and Cell Cycle Analysis
2.8. Cell Viability and Apoptosis Assay upon Drug Treatment
2.9. Statistical Analysis
3. Results
3.1. nc886 Inhibits Cell Proliferation
3.2. nc886+ Cells Have a Longer G1 Duration than nc886− Cells
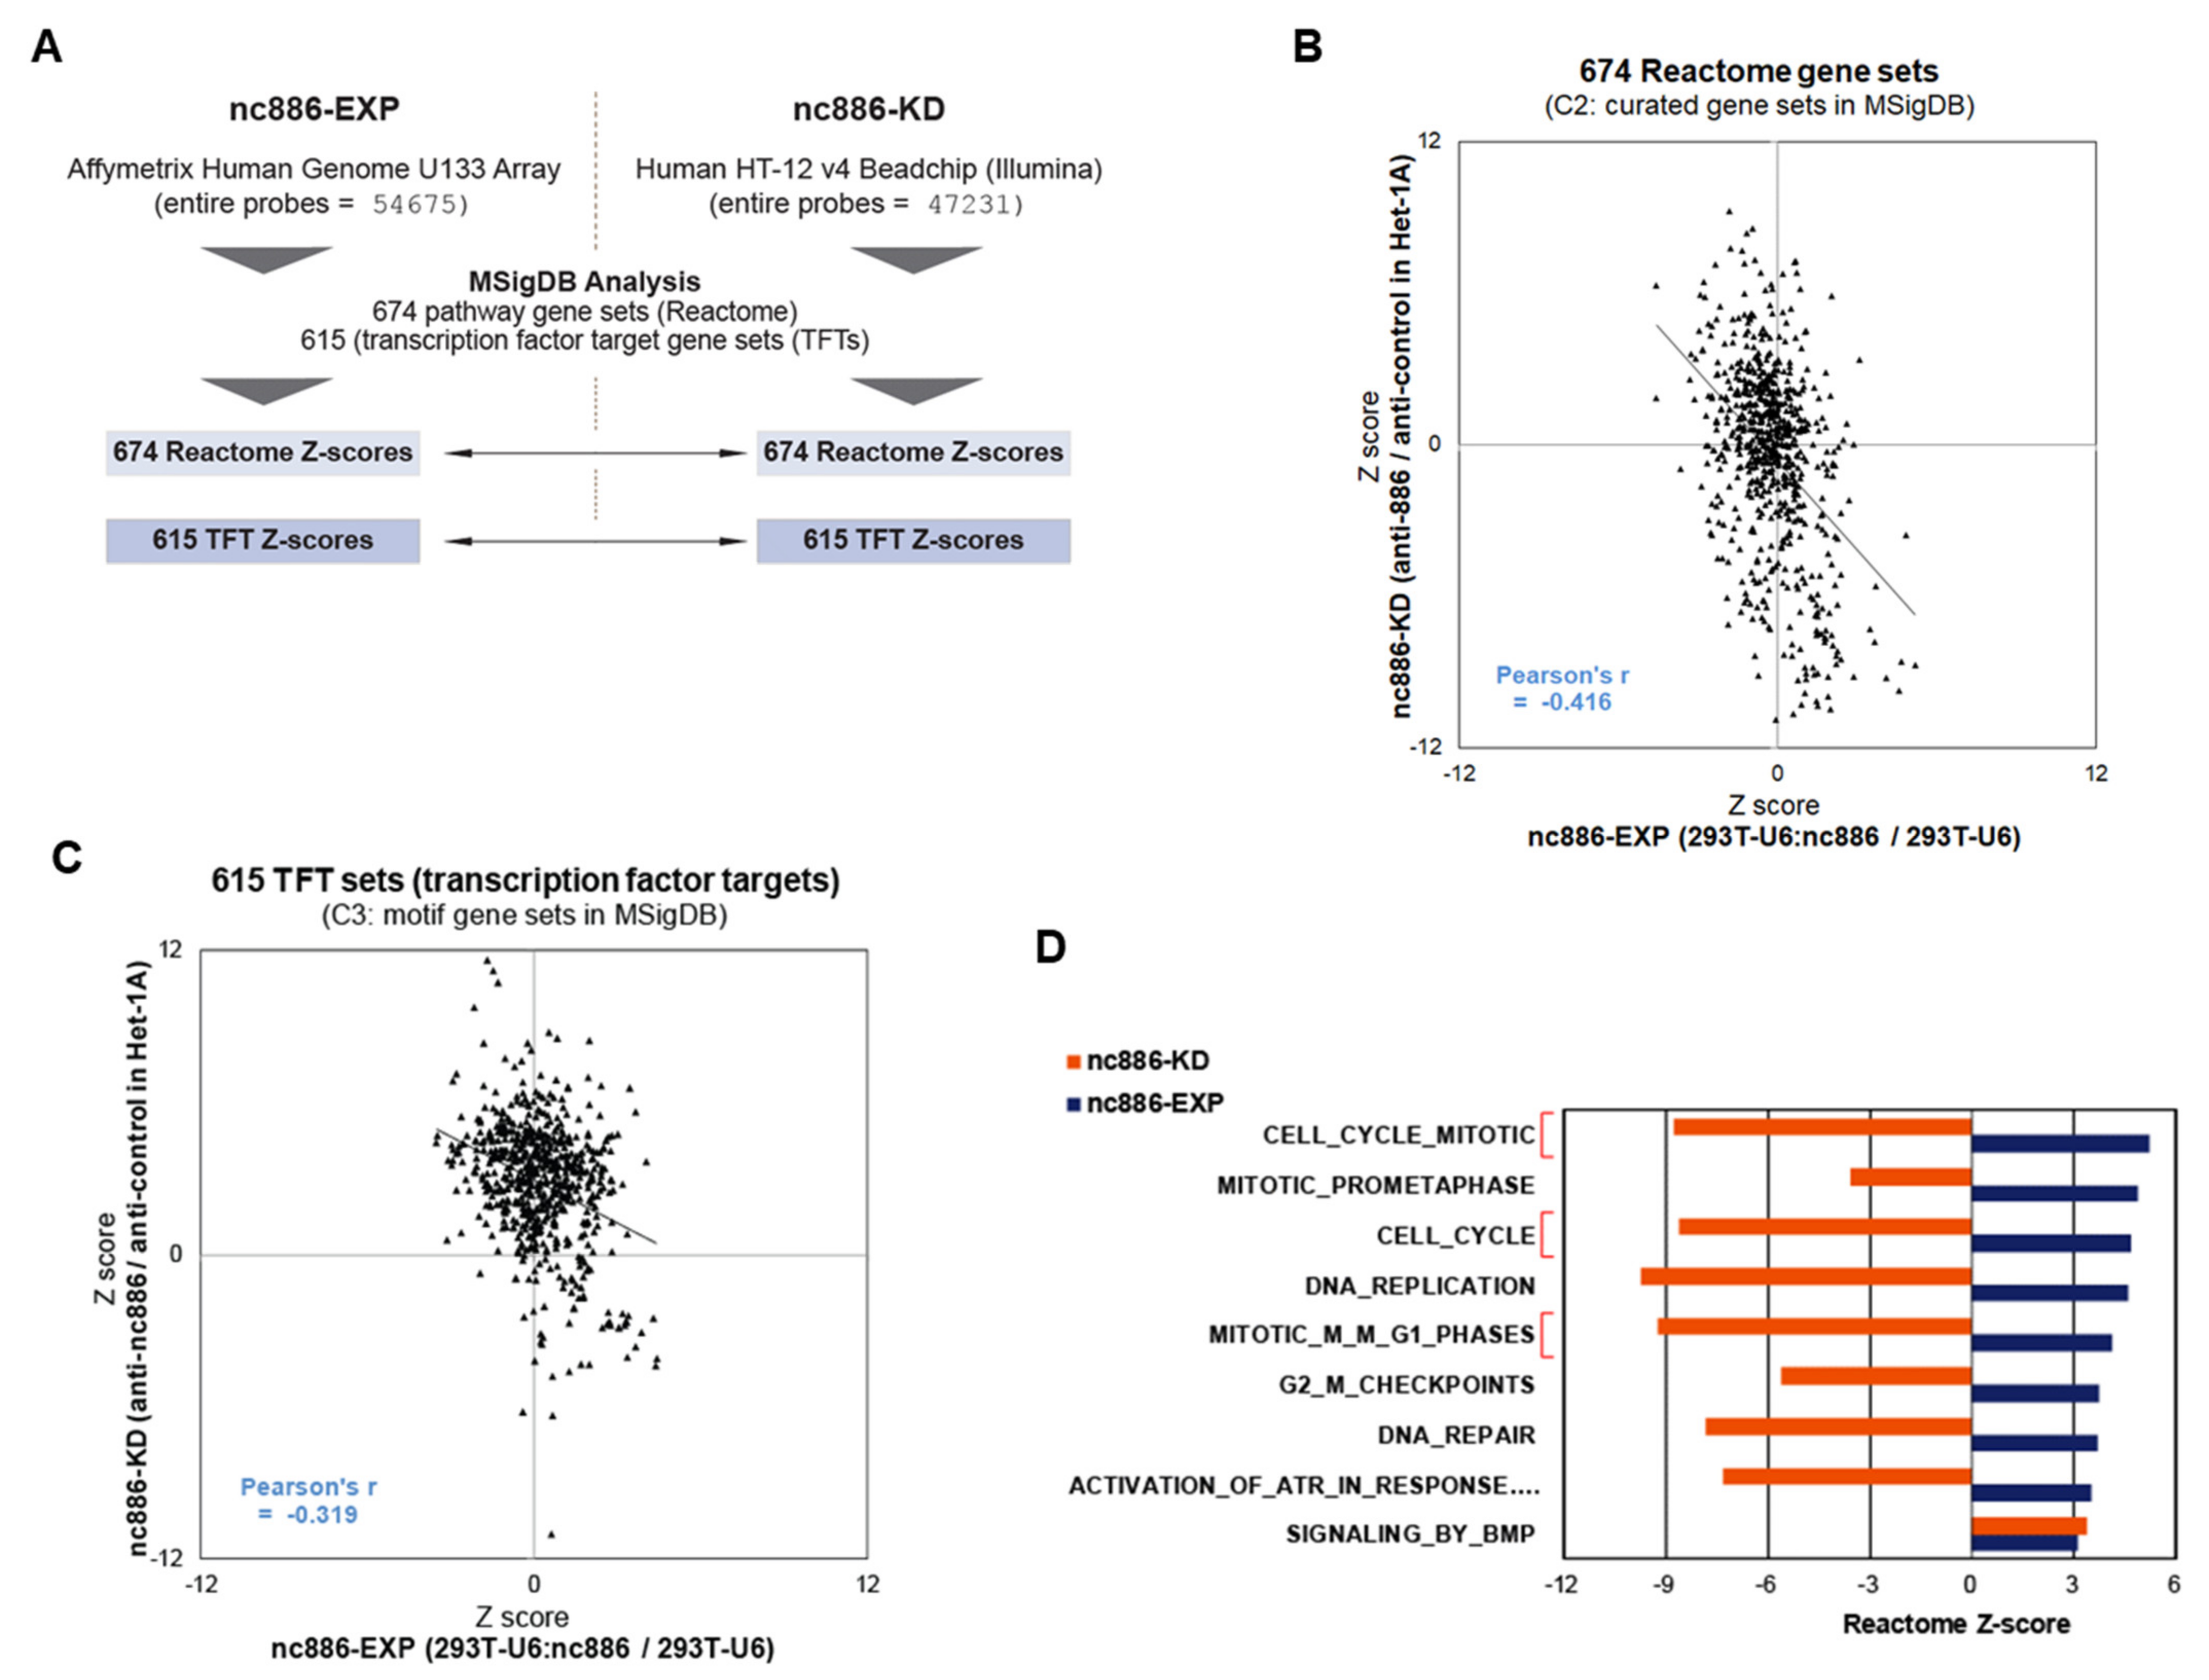
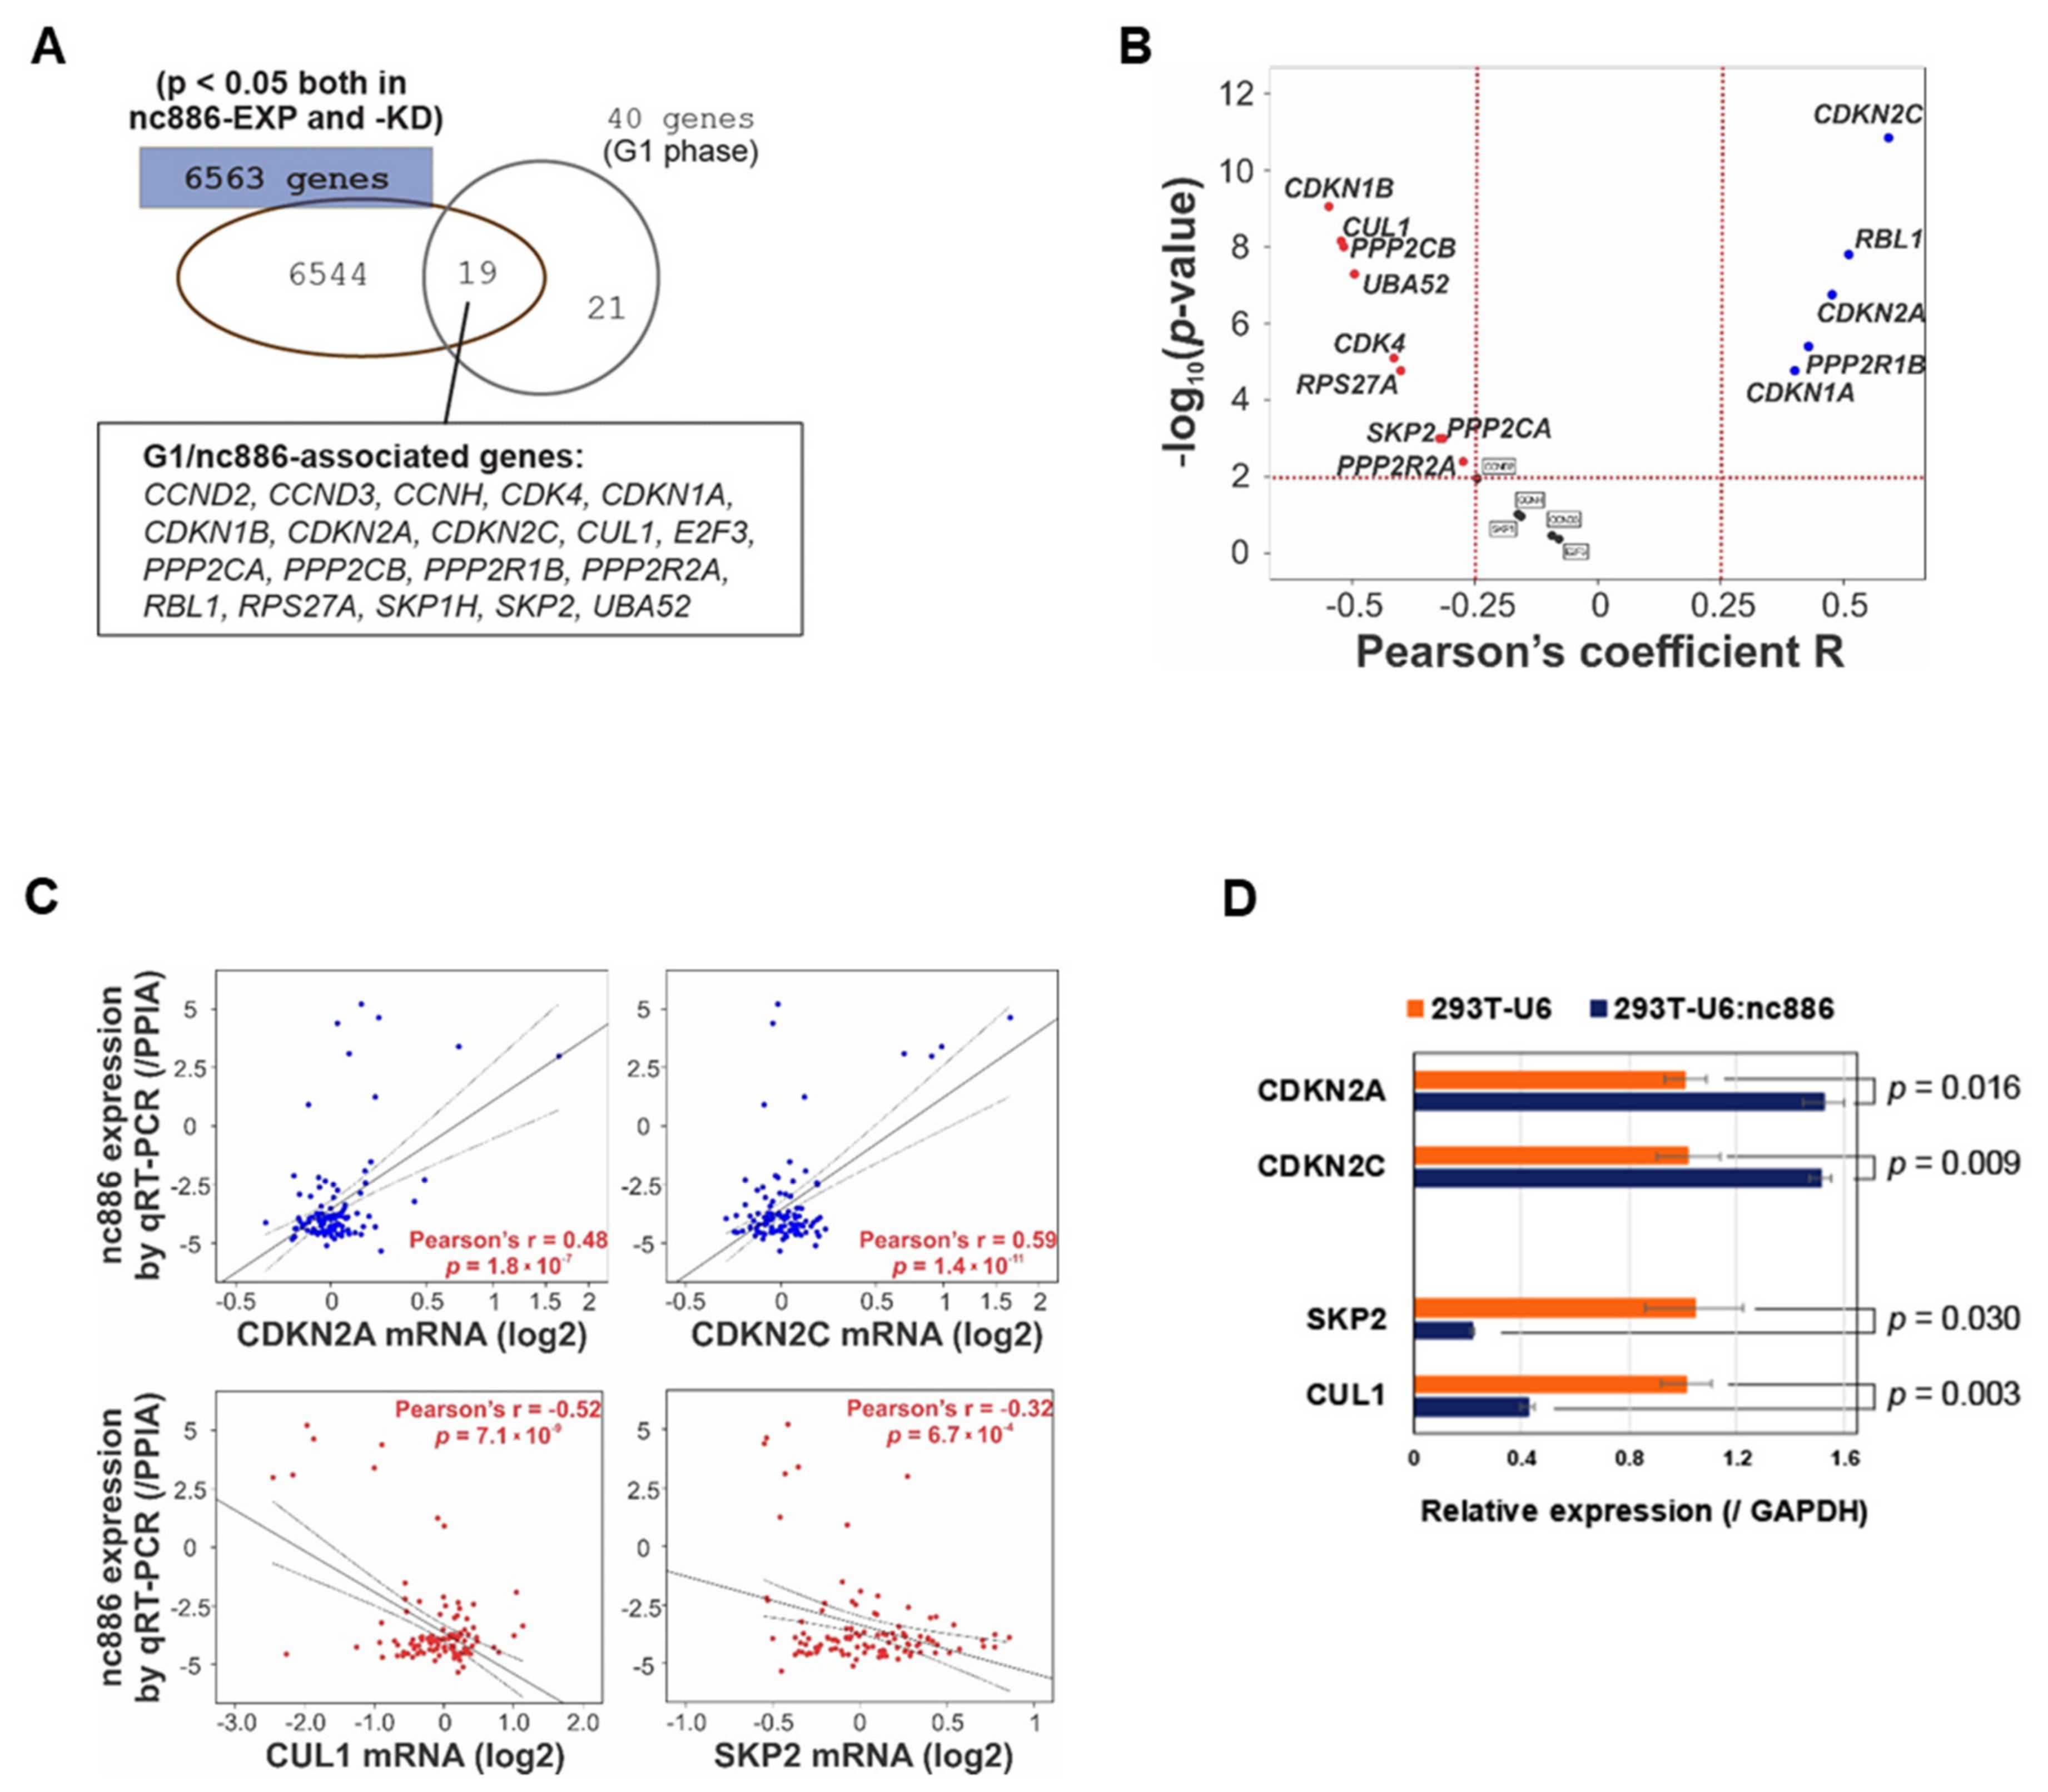
3.3. nc886 Controls Cell Cycle Genes, which Is Probably the Reason for the Extended G1 Period of nc886+ Cells
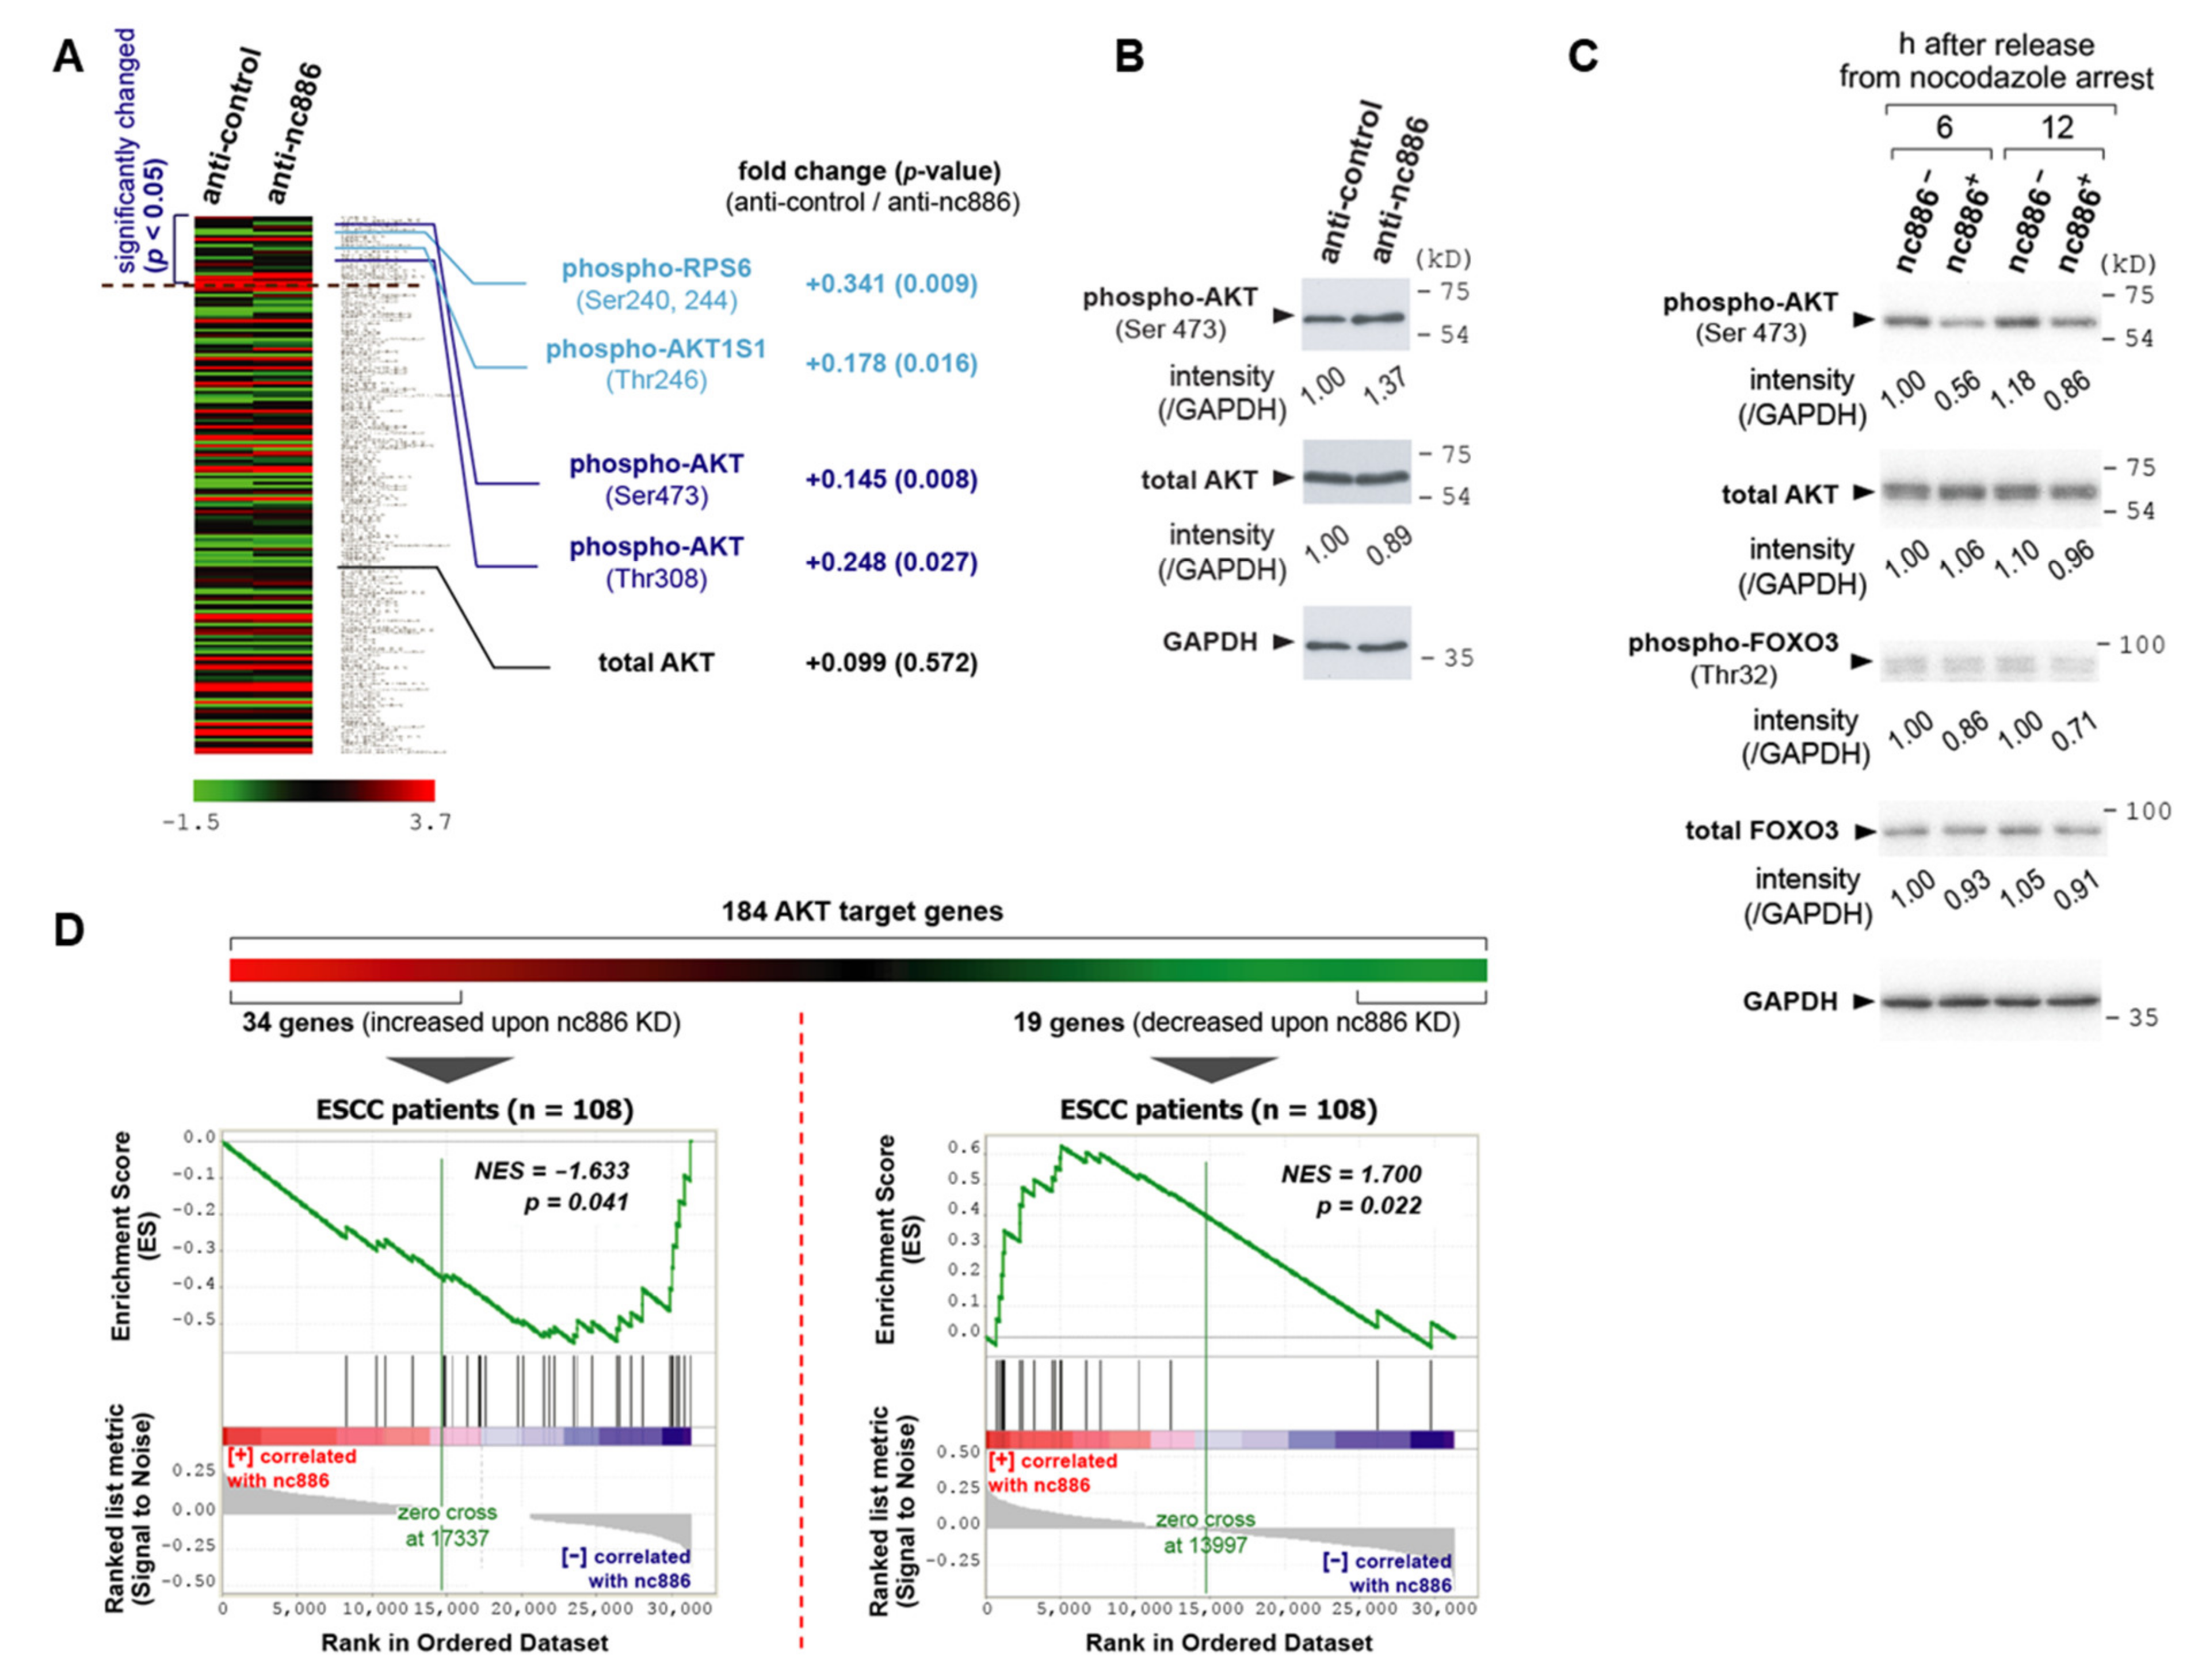
3.4. nc886 Suppresses the AKT Pathway
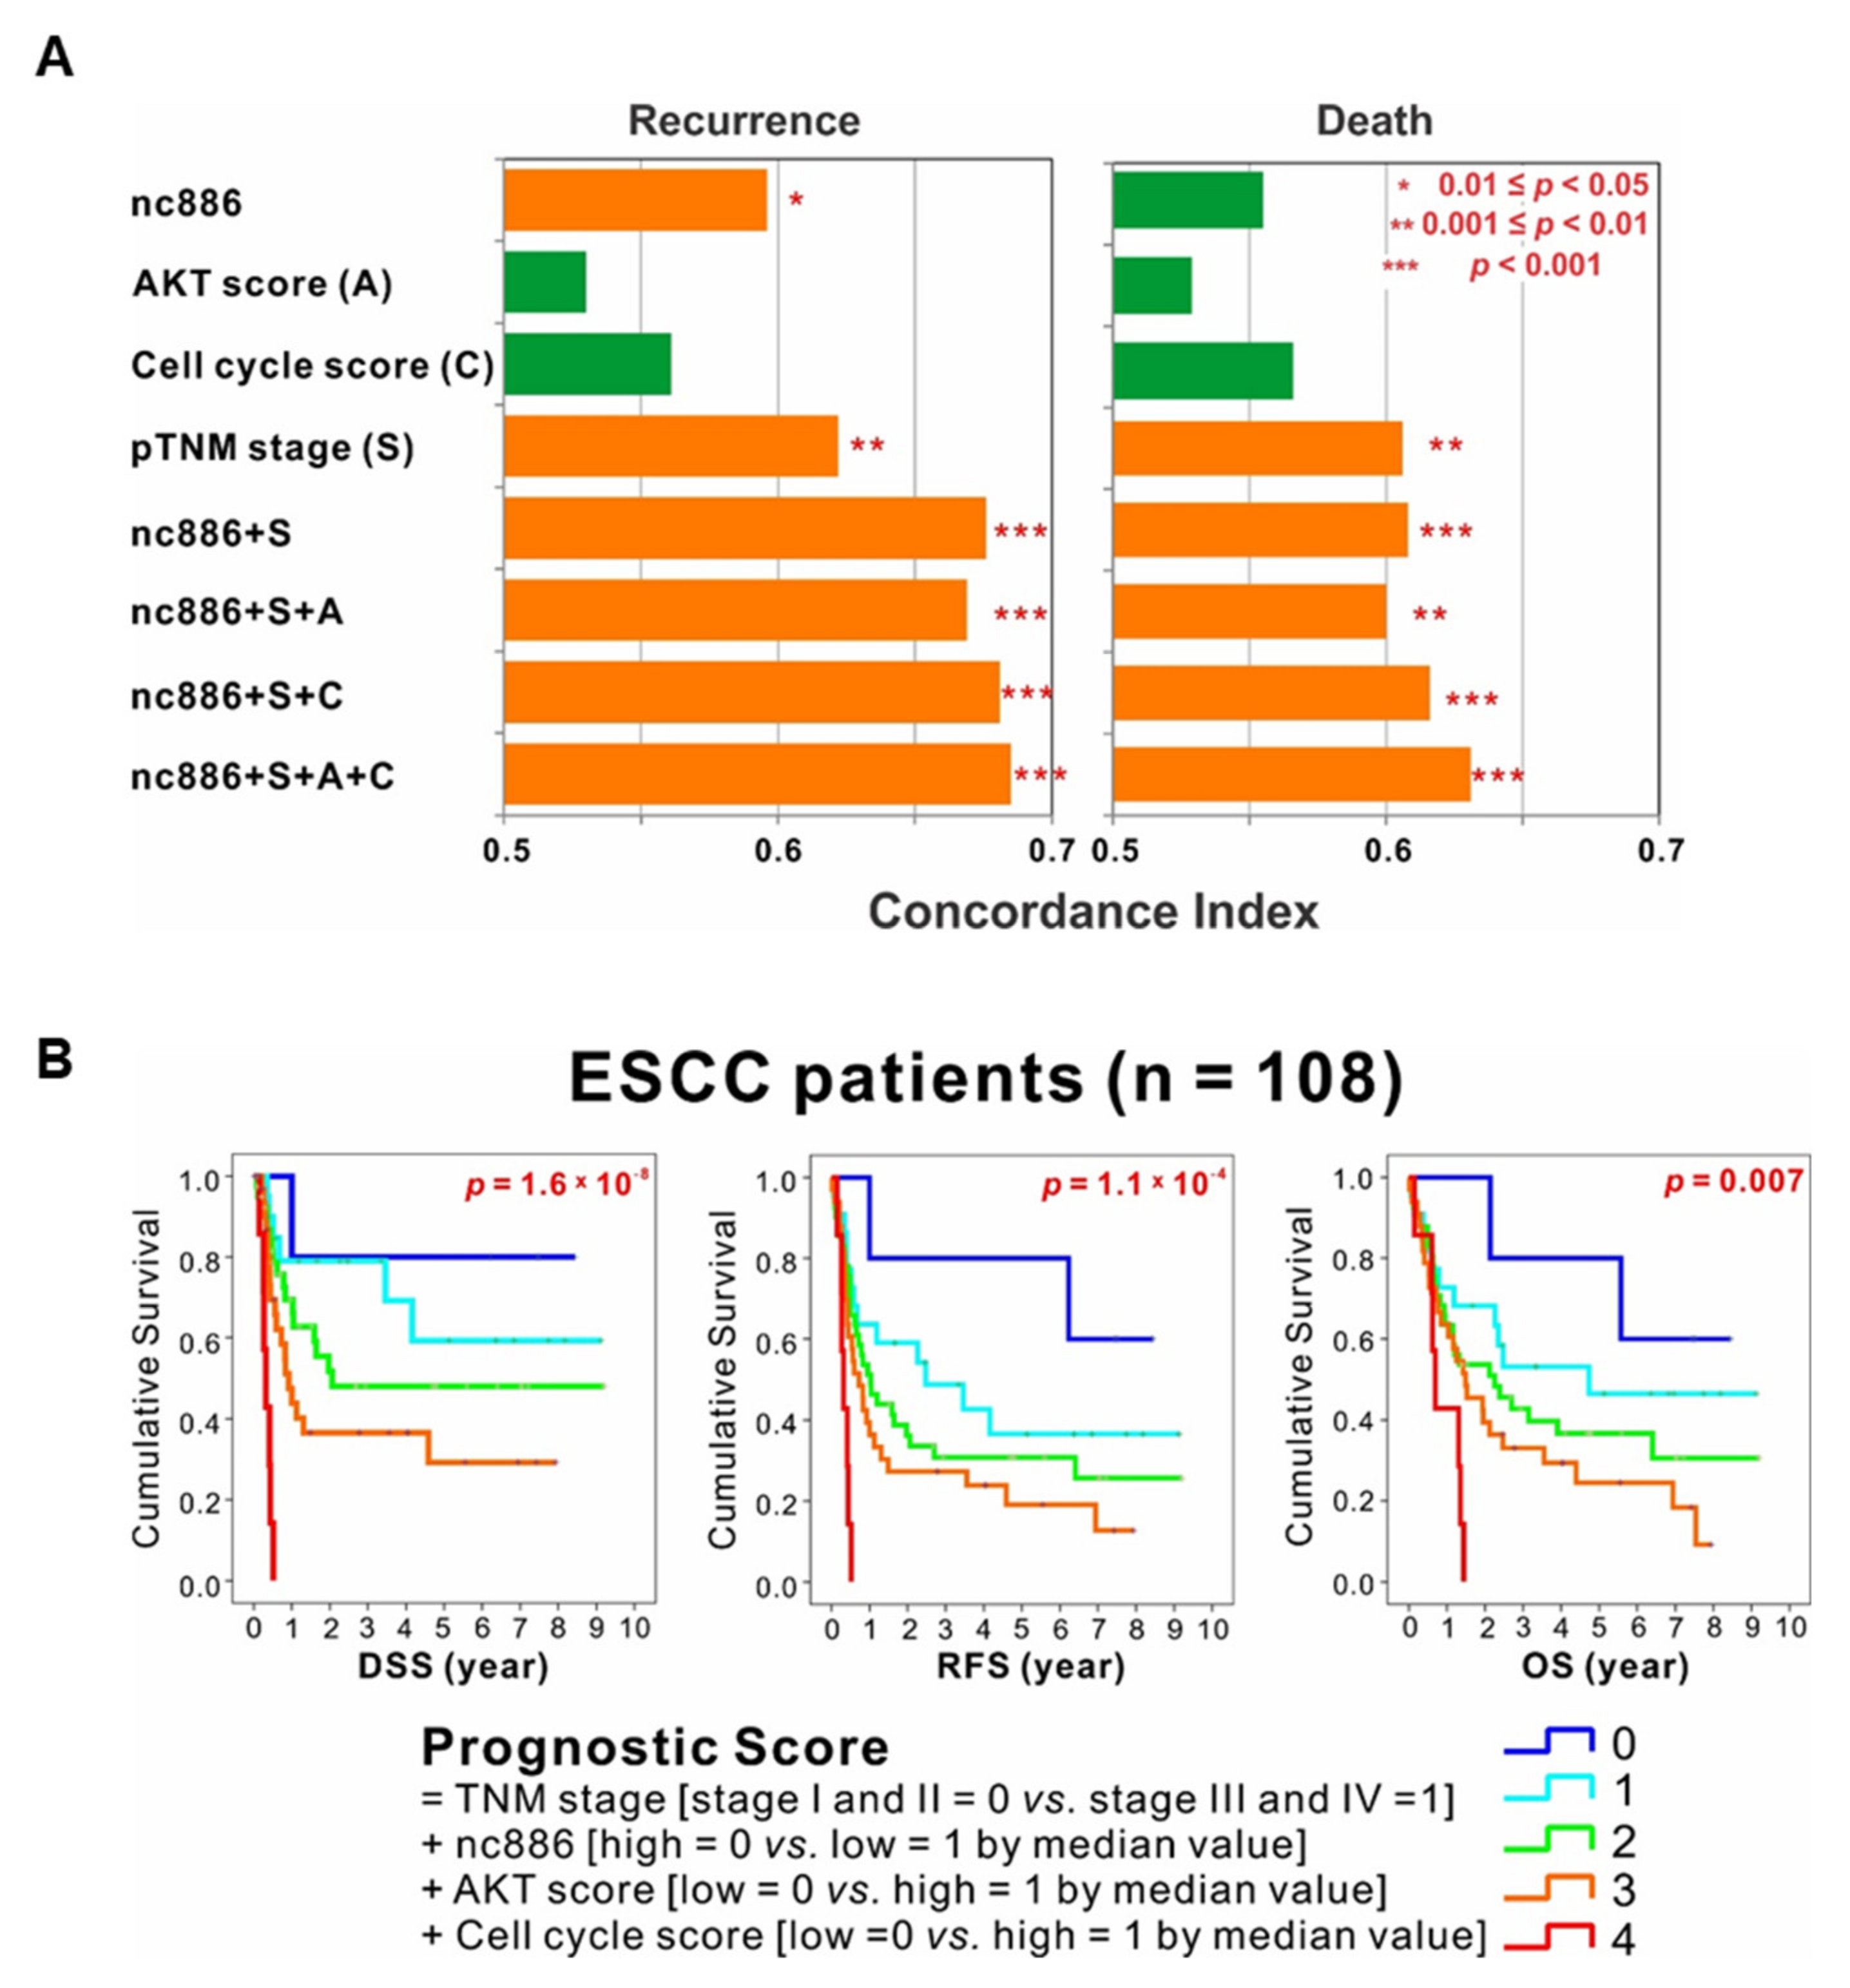
3.5. The Association among nc886, AKT, and Cell Cycle Genes is a Survival Predictor for ESCC Patients
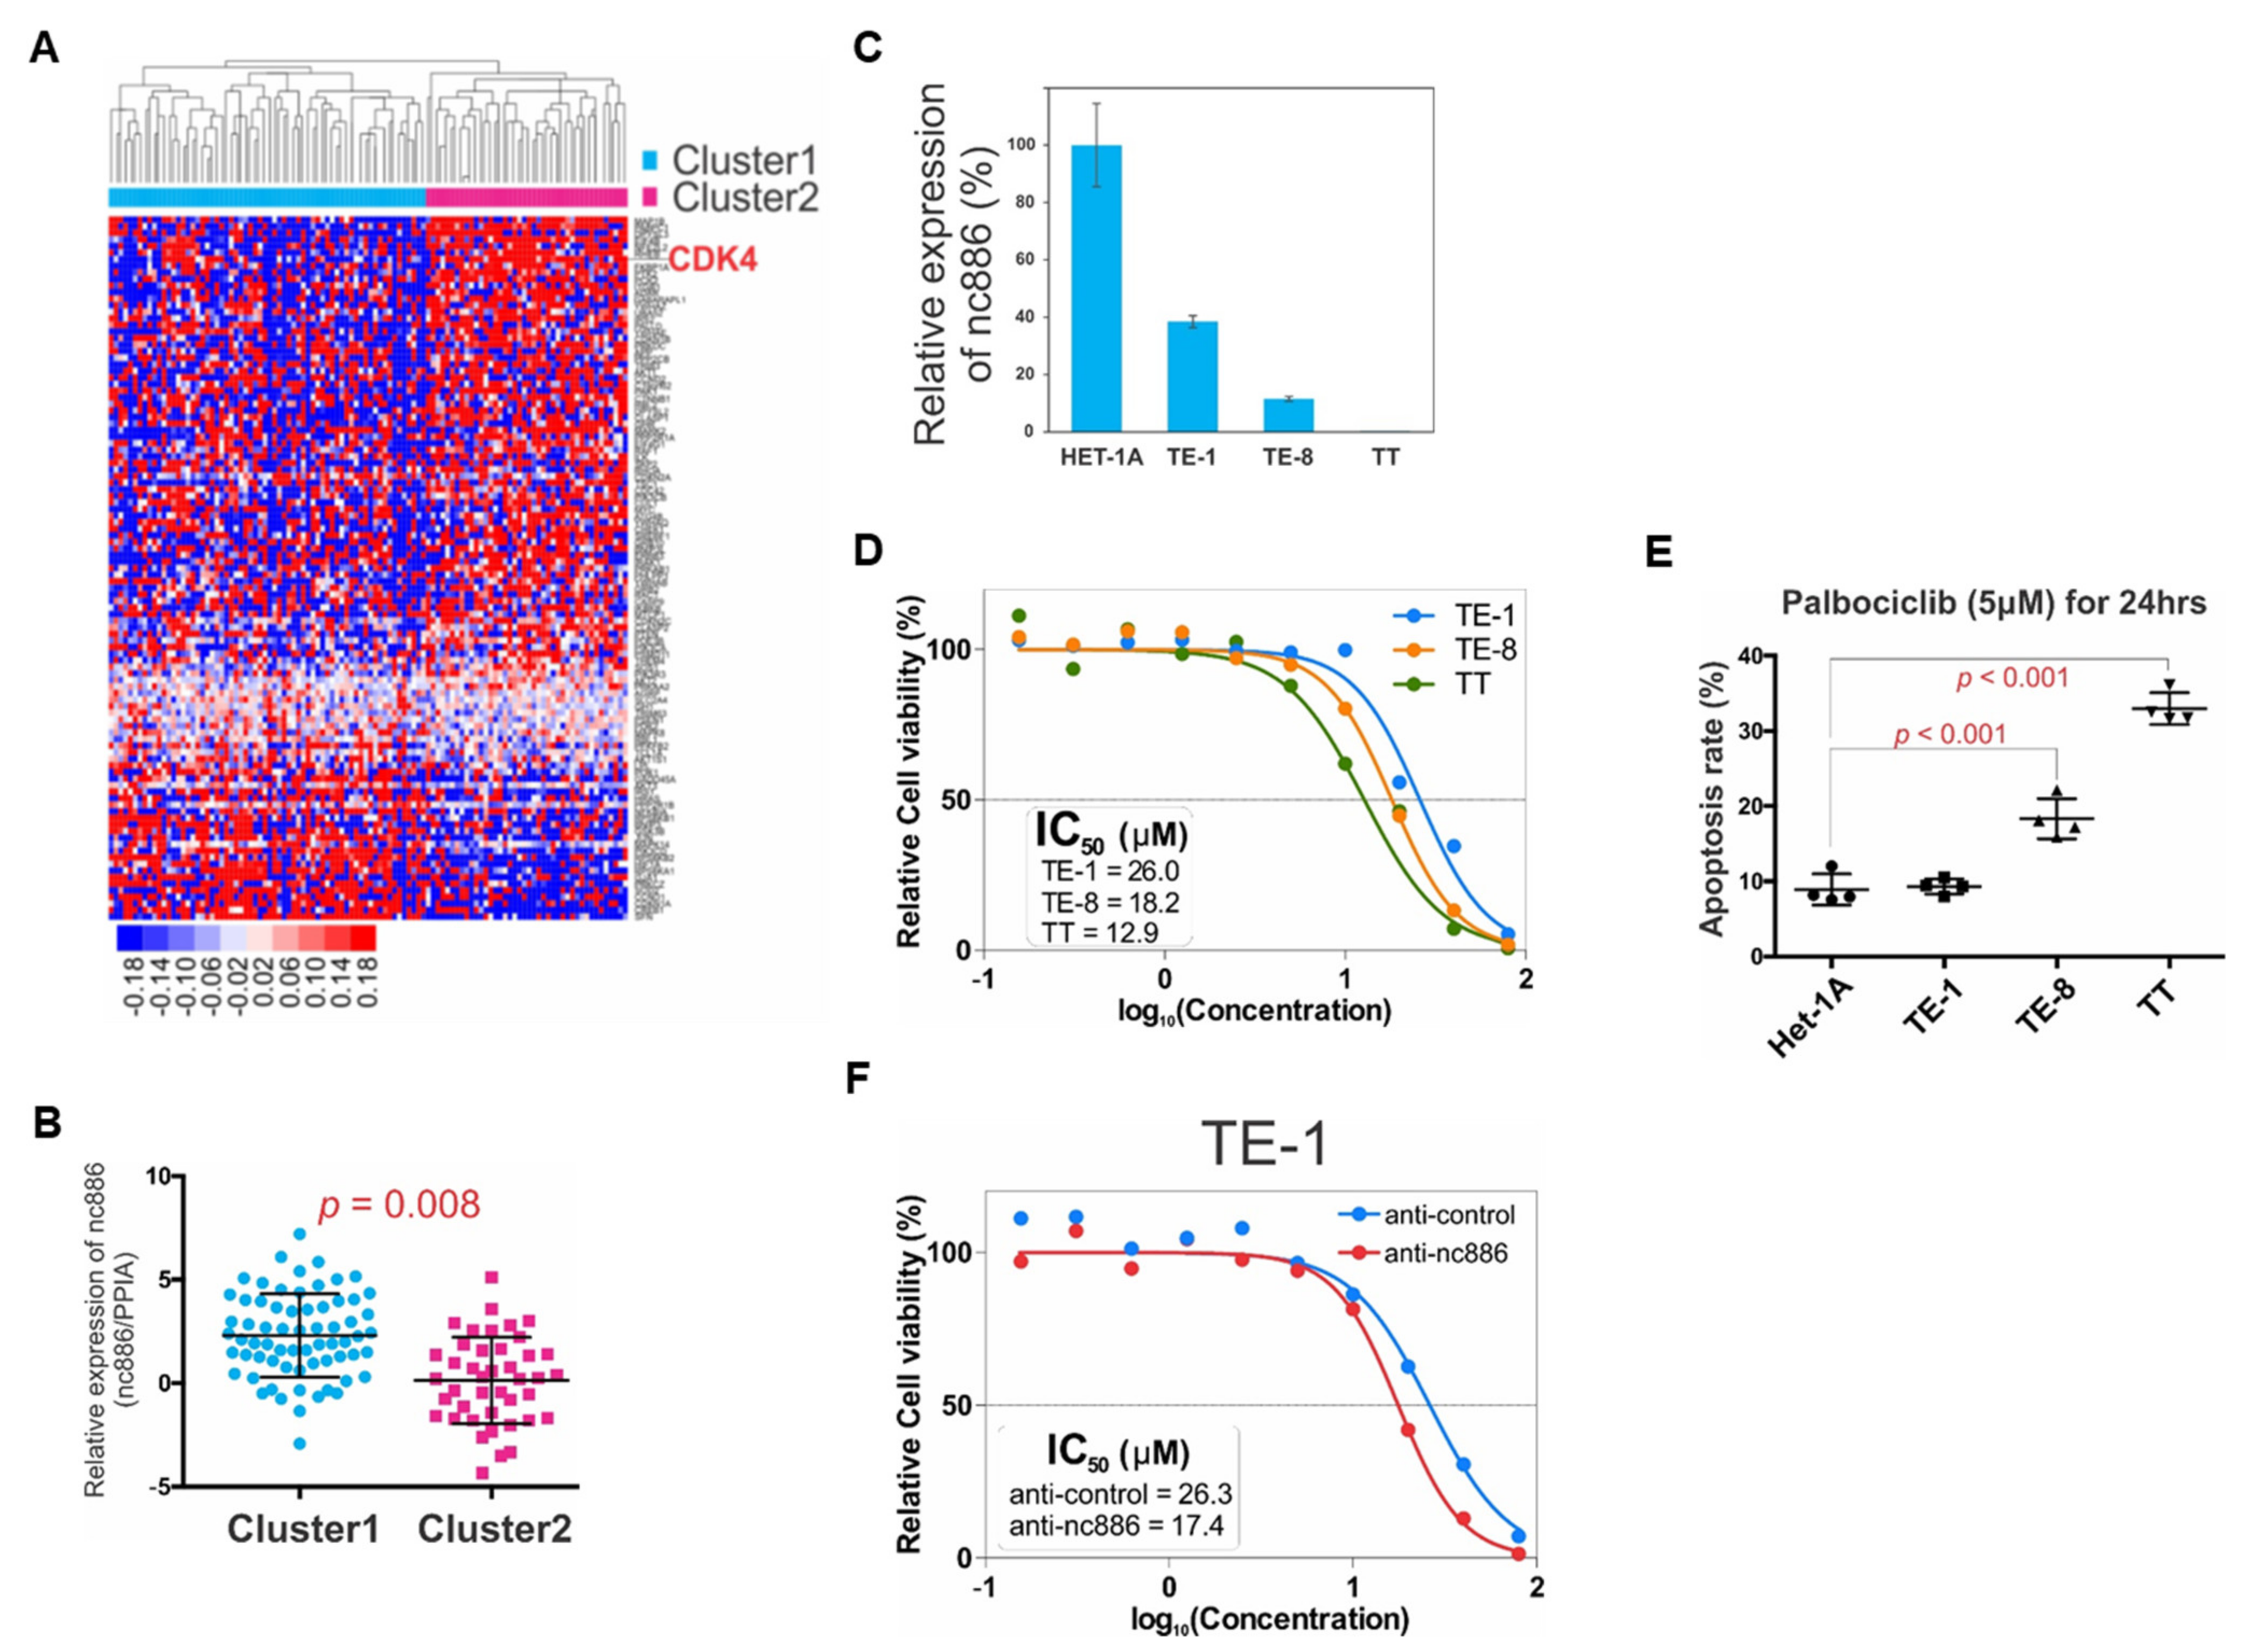
3.6. Therapeutic Implication for ESCC with Unfavorable Prognosis
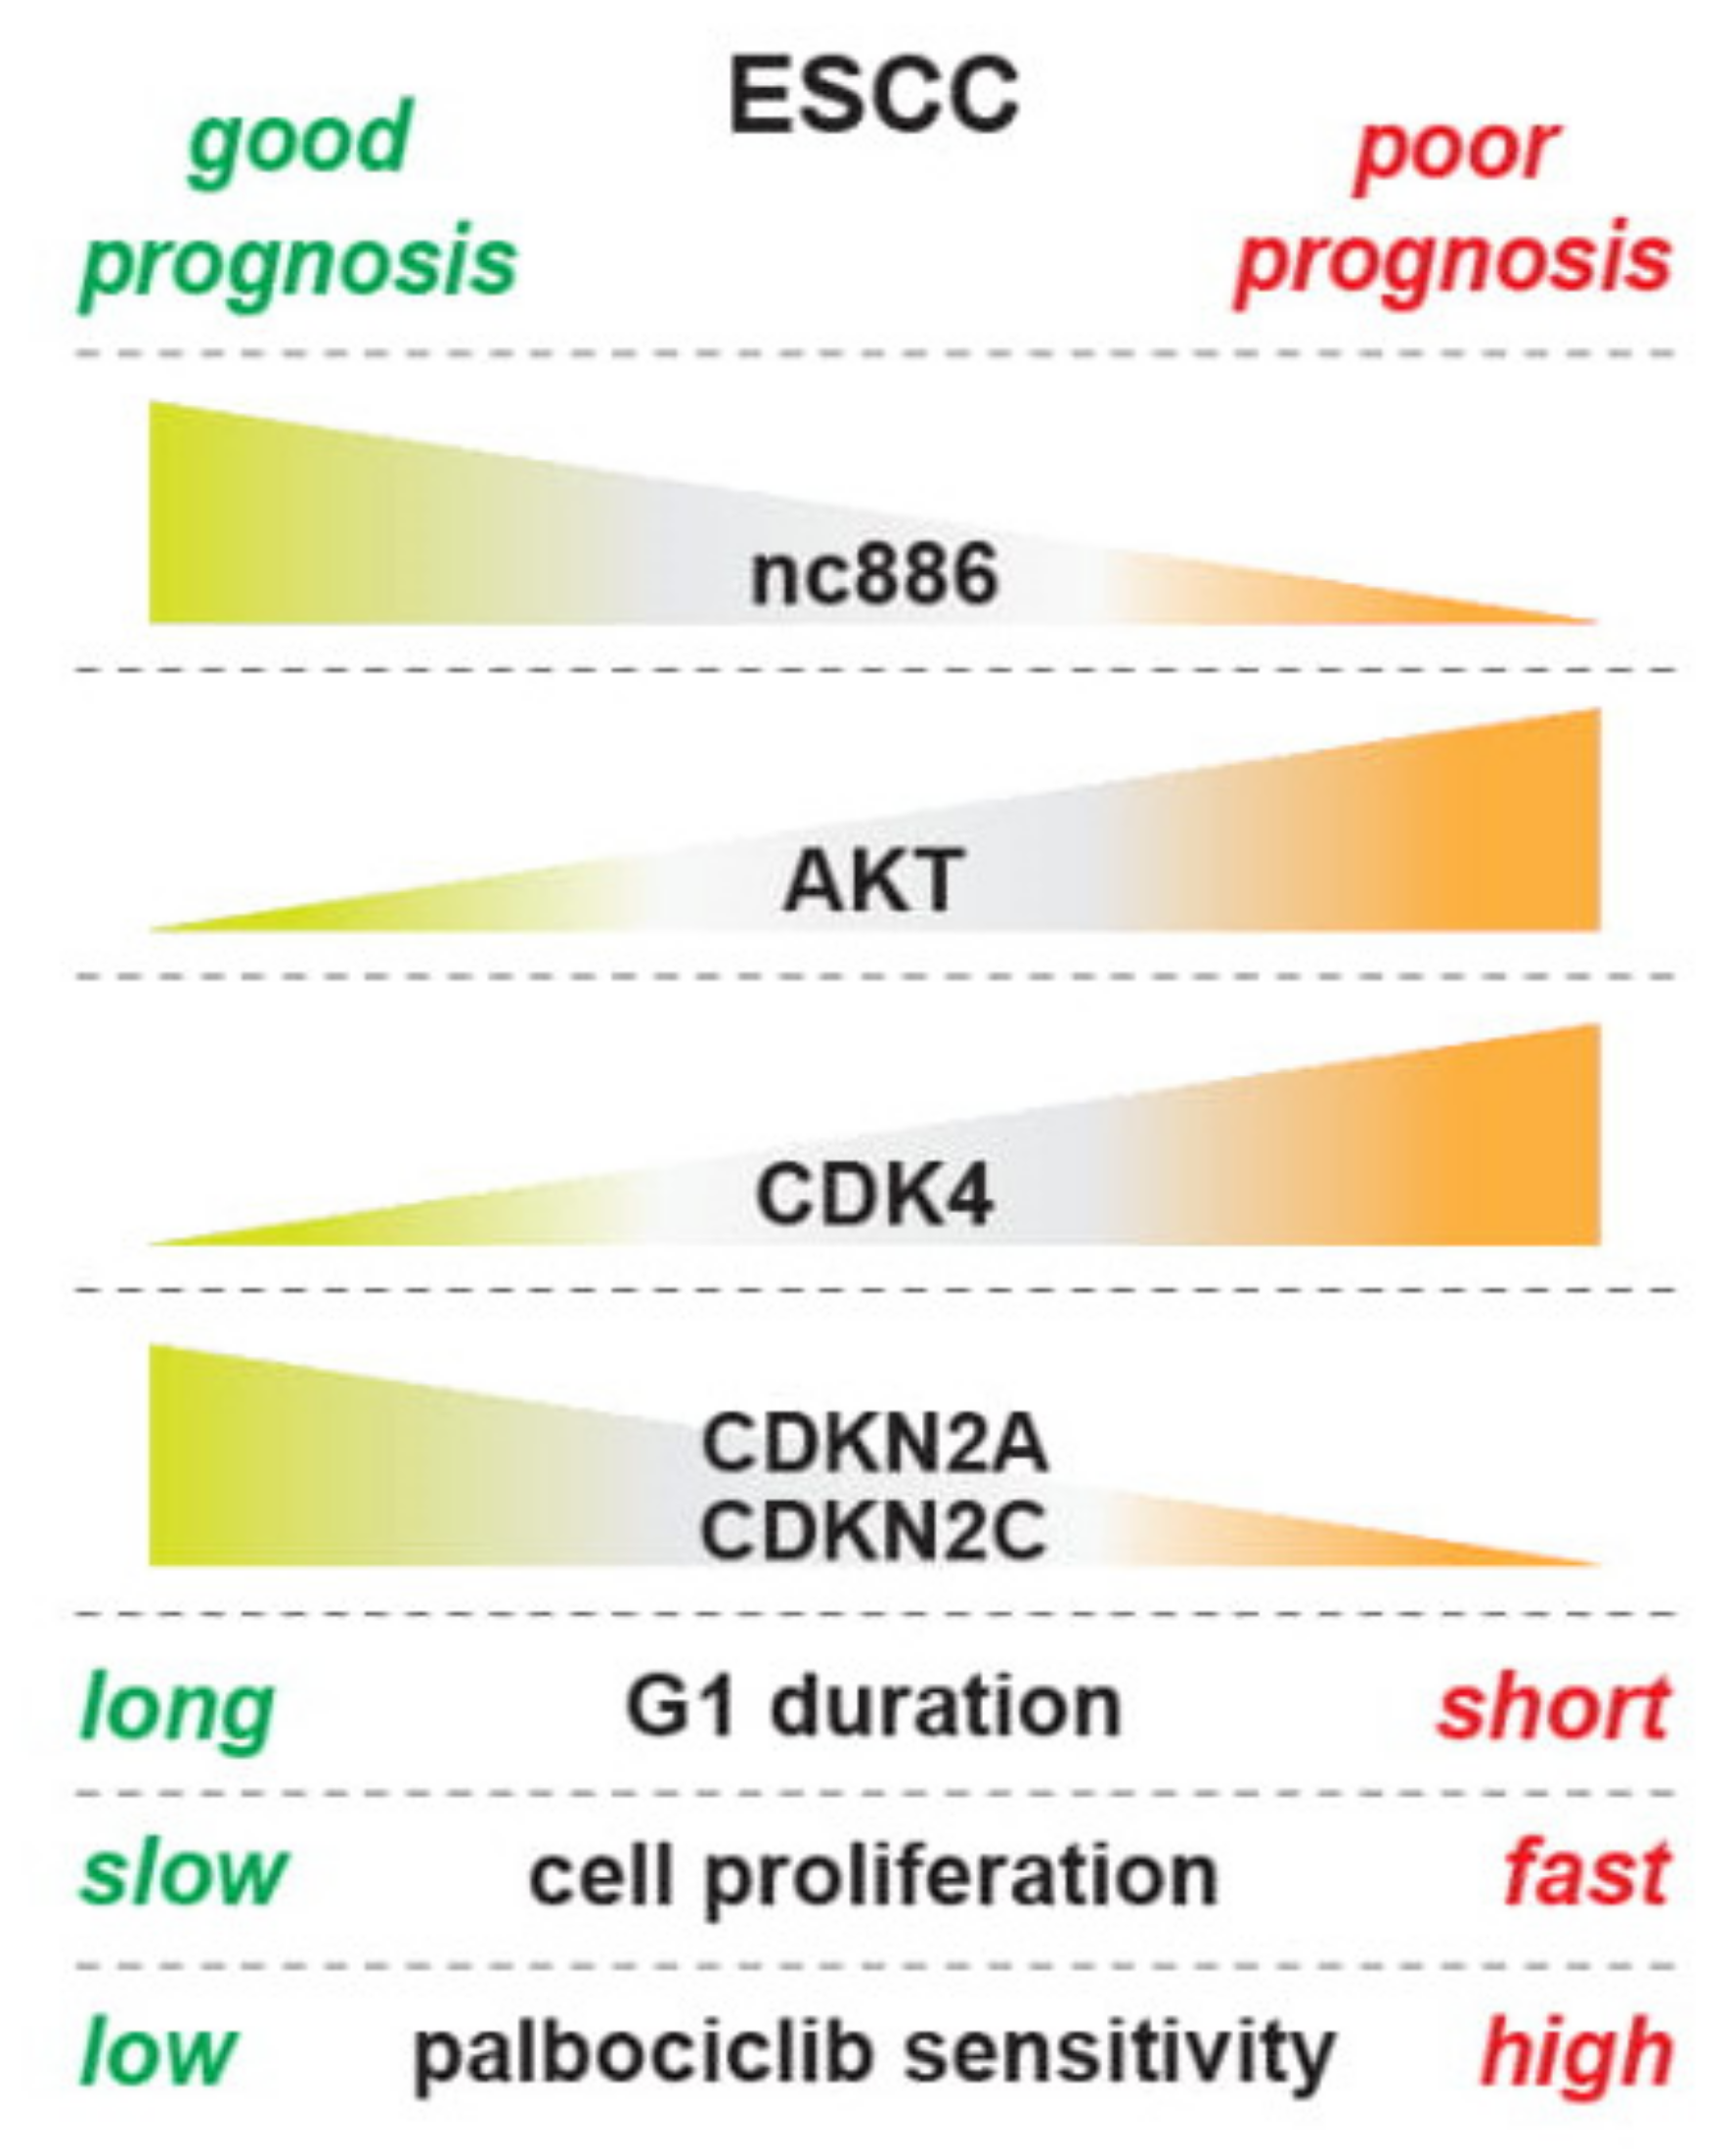
4. Discussion
Supplementary Materials
Author Contributions
Funding
Conflicts of Interest
References
- Lee, K.; Kunkeaw, N.; Jeon, S.H.; Lee, I.; Johnson, B.H.; Kang, G.Y.; Bang, J.Y.; Park, H.S.; Leelayuwat, C.; Lee, Y.S. Precursor miR-886, a novel noncoding RNA repressed in cancer, associates with PKR and modulates its activity. RNA 2011, 17, 1076–1089. [Google Scholar] [CrossRef] [PubMed] [Green Version]
- Kaikkonen, M.U.; Lam, M.T.; Glass, C.K. Non-coding RNAs as regulators of gene expression and epigenetics. Cardiovasc. Res. 2011, 90, 430–440. [Google Scholar] [CrossRef] [PubMed] [Green Version]
- Park, J.L.; Lee, Y.S.; Song, M.J.; Hong, S.H.; Ahn, J.H.; Seo, E.H.; Shin, S.P.; Lee, S.J.; Johnson, B.H.; Stampfer, M.R.; et al. Epigenetic regulation of RNA polymerase III transcription in early breast tumorigenesis. Oncogene 2017, 36, 6793–6804. [Google Scholar] [CrossRef] [Green Version]
- Rustgi, A.K.; El-Serag, H.B. Esophageal carcinoma. N. Engl. J. Med. 2014, 371, 2499–2509. [Google Scholar] [CrossRef]
- Chen, M.; Huang, J.; Zhu, Z.; Zhang, J.; Li, K. Systematic review and meta-analysis of tumor biomarkers in predicting prognosis in esophageal cancer. BMC Cancer 2013, 13, 539. [Google Scholar] [CrossRef] [PubMed] [Green Version]
- Lee, H.S.; Lee, K.; Jang, H.J.; Lee, G.K.; Park, J.L.; Kim, S.Y.; Kim, S.B.; Johnson, B.H.; Zo, J.I.; Lee, J.S.; et al. Epigenetic silencing of the non-coding RNA nc886 provokes oncogenes during human esophageal tumorigenesis. Oncotarget 2014, 5, 3472–3481. [Google Scholar] [CrossRef] [Green Version]
- Jang, H.J.; Lee, H.S.; Burt, B.M.; Lee, G.K.; Yoon, K.A.; Park, Y.Y.; Sohn, B.H.; Kim, S.B.; Kim, M.S.; Lee, J.M.; et al. Integrated genomic analysis of recurrence-associated small non-coding RNAs in oesophageal cancer. Gut 2016. [Google Scholar] [CrossRef] [Green Version]
- Lee, K.S.; Park, J.L.; Lee, K.; Richardson, L.E.; Johnson, B.H.; Lee, H.S.; Lee, J.S.; Kim, S.B.; Kwon, O.H.; Song, K.S.; et al. nc886, a non-coding RNA of anti-proliferative role, is suppressed by CpG DNA methylation in human gastric cancer. Oncotarget 2014, 5, 3944–3955. [Google Scholar] [CrossRef] [Green Version]
- Treppendahl, M.B.; Qiu, X.; Sogaard, A.; Yang, X.; Nandrup-Bus, C.; Hother, C.; Andersen, M.K.; Kjeldsen, L.; Mollgard, L.; Hellstrom-Lindberg, E.; et al. Allelic methylation levels of the noncoding VTRNA2-1 located on chromosome 5q31 1 predict outcome in AML. Blood 2012, 119, 206–216. [Google Scholar] [CrossRef]
- Ahn, J.H.; Lee, H.S.; Lee, J.S.; Lee, Y.S.; Park, J.L.; Kim, S.Y.; Hwang, J.A.; Kunkeaw, N.; Jung, S.Y.; Kim, T.J.; et al. nc886 is induced by TGF-beta and suppresses the microRNA pathway in ovarian cancer. Nat. Commun. 2018, 9. [Google Scholar] [CrossRef]
- The Cancer Genome Atlas Research Network. Integrated genomic characterization of oesophageal carcinoma. Nature 2017, 541, 169–175. [Google Scholar] [CrossRef] [Green Version]
- Subramanian, A.; Tamayo, P.; Mootha, V.K.; Mukherjee, S.; Ebert, B.L.; Gillette, M.A.; Paulovich, A.; Pomeroy, S.L.; Golub, T.R.; Lander, E.S.; et al. Gene set enrichment analysis: A knowledge-based approach for interpreting genome-wide expression profiles. Proc. Natl. Acad. Sci. USA 2005, 102, 15545–15550. [Google Scholar] [CrossRef] [Green Version]
- DuBridge, R.B.; Tang, P.; Hsia, H.C.; Leong, P.M.; Miller, J.H.; Calos, M.P. Analysis of mutation in human cells by using an Epstein-Barr virus shuttle system. Mol. Cell. Biol. 1987, 7, 379–387. [Google Scholar] [CrossRef]
- Smith, J.A.; Martin, L. Do cells cycle? Proc. Natl. Acad. Sci. USA 1973, 70, 1263–1267. [Google Scholar] [CrossRef] [PubMed] [Green Version]
- Frescas, D.; Pagano, M. Deregulated proteolysis by the F-box proteins SKP2 and beta-TrCP: Tipping the scales of cancer. Nat. Rev. Cancer 2008, 8, 438–449. [Google Scholar] [CrossRef] [Green Version]
- Williams, B.R. PKR; a sentinel kinase for cellular stress. Oncogene 1999, 18, 6112–6120. [Google Scholar] [CrossRef] [PubMed] [Green Version]
- Manning, B.D.; Toker, A. AKT/PKB Signaling: Navigating the Network. Cell 2017, 169, 381–405. [Google Scholar] [CrossRef] [PubMed] [Green Version]
- Kovacina, K.S.; Park, G.Y.; Bae, S.S.; Guzzetta, A.W.; Schaefer, E.; Birnbaum, M.J.; Roth, R.A. Identification of a proline-rich Akt substrate as a 14-3-3 binding partner. J. Biol. Chem. 2003, 278, 10189–10194. [Google Scholar] [CrossRef] [PubMed] [Green Version]
- Meyuhas, O. Ribosomal Protein S6 Phosphorylation: Four Decades of Research. Int. Rev. Cell Mol. Biol. 2015, 320, 41–73. [Google Scholar] [CrossRef]
- Cai, S.L.; Tee, A.R.; Short, J.D.; Bergeron, J.M.; Kim, J.; Shen, J.; Guo, R.; Johnson, C.L.; Kiguchi, K.; Walker, C.L. Activity of TSC2 is inhibited by AKT-mediated phosphorylation and membrane partitioning. J. Cell Biol. 2006, 173, 279–289. [Google Scholar] [CrossRef] [Green Version]
- Zhang, X.; Tang, N.; Hadden, T.J.; Rishi, A.K. Akt, FoxO and regulation of apoptosis. Biochim. Biophys. Acta 2011, 1813, 1978–1986. [Google Scholar] [CrossRef] [PubMed] [Green Version]
- Liang, J.; Slingerland, J.M. Multiple roles of the PI3K/PKB (Akt) pathway in cell cycle progression. Cell Cycle 2003, 2, 339–345. [Google Scholar] [CrossRef] [PubMed] [Green Version]
- Bai, J.; Li, Y.; Zhang, G. Cell cycle regulation and anticancer drug discovery. Cancer Biol. Med. 2017, 14, 348–362. [Google Scholar] [CrossRef] [PubMed]
- White, R.J. RNA polymerases I and III, growth control and cancer. Nat. Rev. Mol. Cell Biol. 2005, 6, 69–78. [Google Scholar] [CrossRef]
- Liu, K.; Paik, J.C.; Wang, B.; Lin, F.T.; Lin, W.C. Regulation of TopBP1 oligomerization by Akt/PKB for cell survival. EMBO J. 2006, 25, 4795–4807. [Google Scholar] [CrossRef] [Green Version]
- DeGregori, J.; Leone, G.; Miron, A.; Jakoi, L.; Nevins, J.R. Distinct roles for E2F proteins in cell growth control and apoptosis. Proc. Natl. Acad. Sci. USA 1997, 94, 7245–7250. [Google Scholar] [CrossRef] [Green Version]
- Bates, S.; Phillips, A.C.; Clark, P.A.; Stott, F.; Peters, G.; Ludwig, R.L.; Vousden, K.H. p14ARF links the tumour suppressors RB and p53. Nature 1998, 395, 124–125. [Google Scholar] [CrossRef]
- Dimova, D.K.; Dyson, N.J. The E2F transcriptional network: Old acquaintances with new faces. Oncogene 2005, 24, 2810–2826. [Google Scholar] [CrossRef] [Green Version]
- Kalu, N.N.; Johnson, F.M. Do CDK4/6 inhibitors have potential as targeted therapeutics for squamous cell cancers? Expert Opin Investig Drugs 2017, 26, 207–217. [Google Scholar] [CrossRef]
- Qie, S.; Diehl, J.A. Cyclin D1, cancer progression, and opportunities in cancer treatment. J. Mol. Med. 2016, 94, 1313–1326. [Google Scholar] [CrossRef] [Green Version]
- Ismail, A.; Bandla, S.; Reveiller, M.; Toia, L.; Zhou, Z.; Gooding, W.E.; Kalatskaya, I.; Stein, L.; D’Souza, M.; Litle, V.R.; et al. Early G(1) cyclin-dependent kinases as prognostic markers and potential therapeutic targets in esophageal adenocarcinoma. Clin. Cancer Res. 2011, 17, 4513–4522. [Google Scholar] [CrossRef] [PubMed] [Green Version]
- Chen, L.; Pan, J. Dual cyclin-dependent kinase 4/6 inhibition by PD-0332991 induces apoptosis and senescence in oesophageal squamous cell carcinoma cells. Br. J. Pharmacol. 2017, 174, 2427–2443. [Google Scholar] [CrossRef] [PubMed]


© 2020 by the authors. Licensee MDPI, Basel, Switzerland. This article is an open access article distributed under the terms and conditions of the Creative Commons Attribution (CC BY) license (http://creativecommons.org/licenses/by/4.0/).
Share and Cite
Im, W.R.; Lee, H.-S.; Lee, Y.-S.; Lee, J.-S.; Jang, H.-J.; Kim, S.-Y.; Park, J.-L.; Lee, Y.; Kim, M.S.; Lee, J.M.; et al. A Regulatory Noncoding RNA, nc886, Suppresses Esophageal Cancer by Inhibiting the AKT Pathway and Cell Cycle Progression. Cells 2020, 9, 801. https://doi.org/10.3390/cells9040801
Im WR, Lee H-S, Lee Y-S, Lee J-S, Jang H-J, Kim S-Y, Park J-L, Lee Y, Kim MS, Lee JM, et al. A Regulatory Noncoding RNA, nc886, Suppresses Esophageal Cancer by Inhibiting the AKT Pathway and Cell Cycle Progression. Cells. 2020; 9(4):801. https://doi.org/10.3390/cells9040801
Chicago/Turabian StyleIm, Wonkyun Ronny, Hyun-Sung Lee, Yeon-Su Lee, Ju-Seog Lee, Hee-Jin Jang, Seon-Young Kim, Jong-Lyul Park, Yeontaek Lee, Moon Soo Kim, Jong Mog Lee, and et al. 2020. "A Regulatory Noncoding RNA, nc886, Suppresses Esophageal Cancer by Inhibiting the AKT Pathway and Cell Cycle Progression" Cells 9, no. 4: 801. https://doi.org/10.3390/cells9040801