
Understanding Cell Model Characteristics—RNA Expression Profiling in Primary and Immortalized Human Mesothelial Cells, and in Human Vein and Microvascular Endothelial Cells
 , , , ,
  and
and 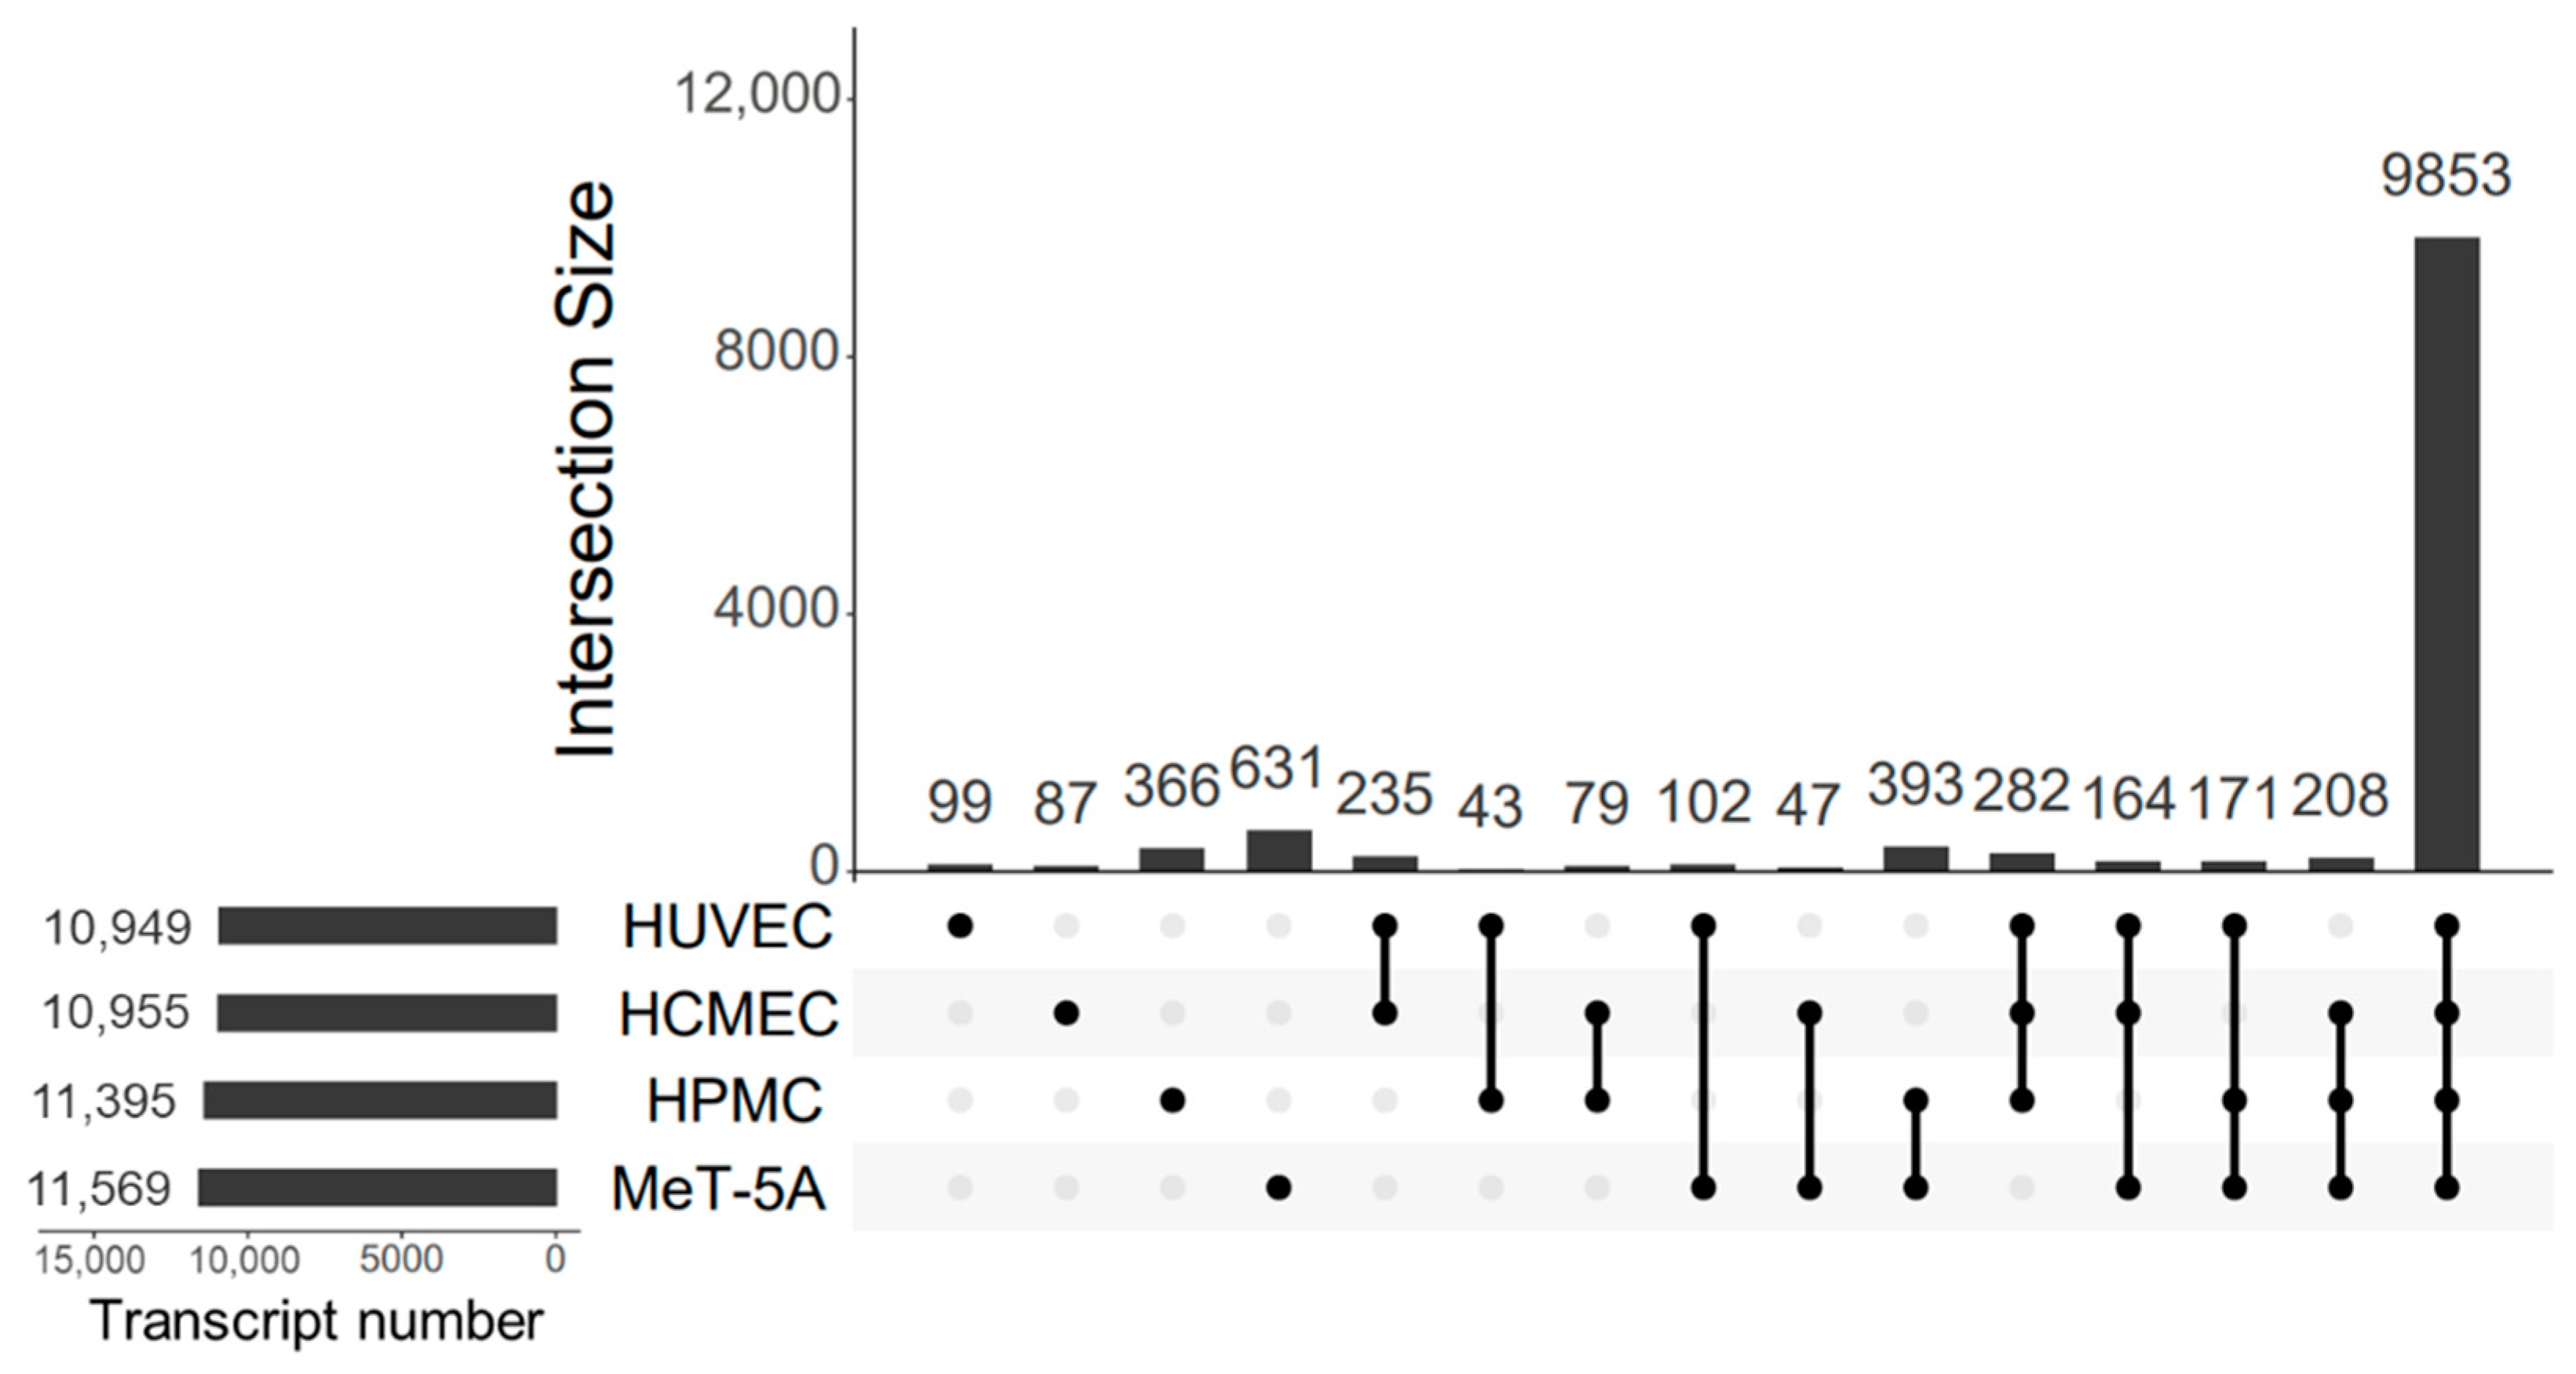
Abstract
:1. Introduction
2. Materials and Methods
2.1. Cell Culture
2.2. RNA Isolation and Sequencing
2.3. Transcriptomics Data Processing
2.4. Gene Enrichment Analysis and Visualization of Data
3. Results
3.1. Transcript Discovery Rates
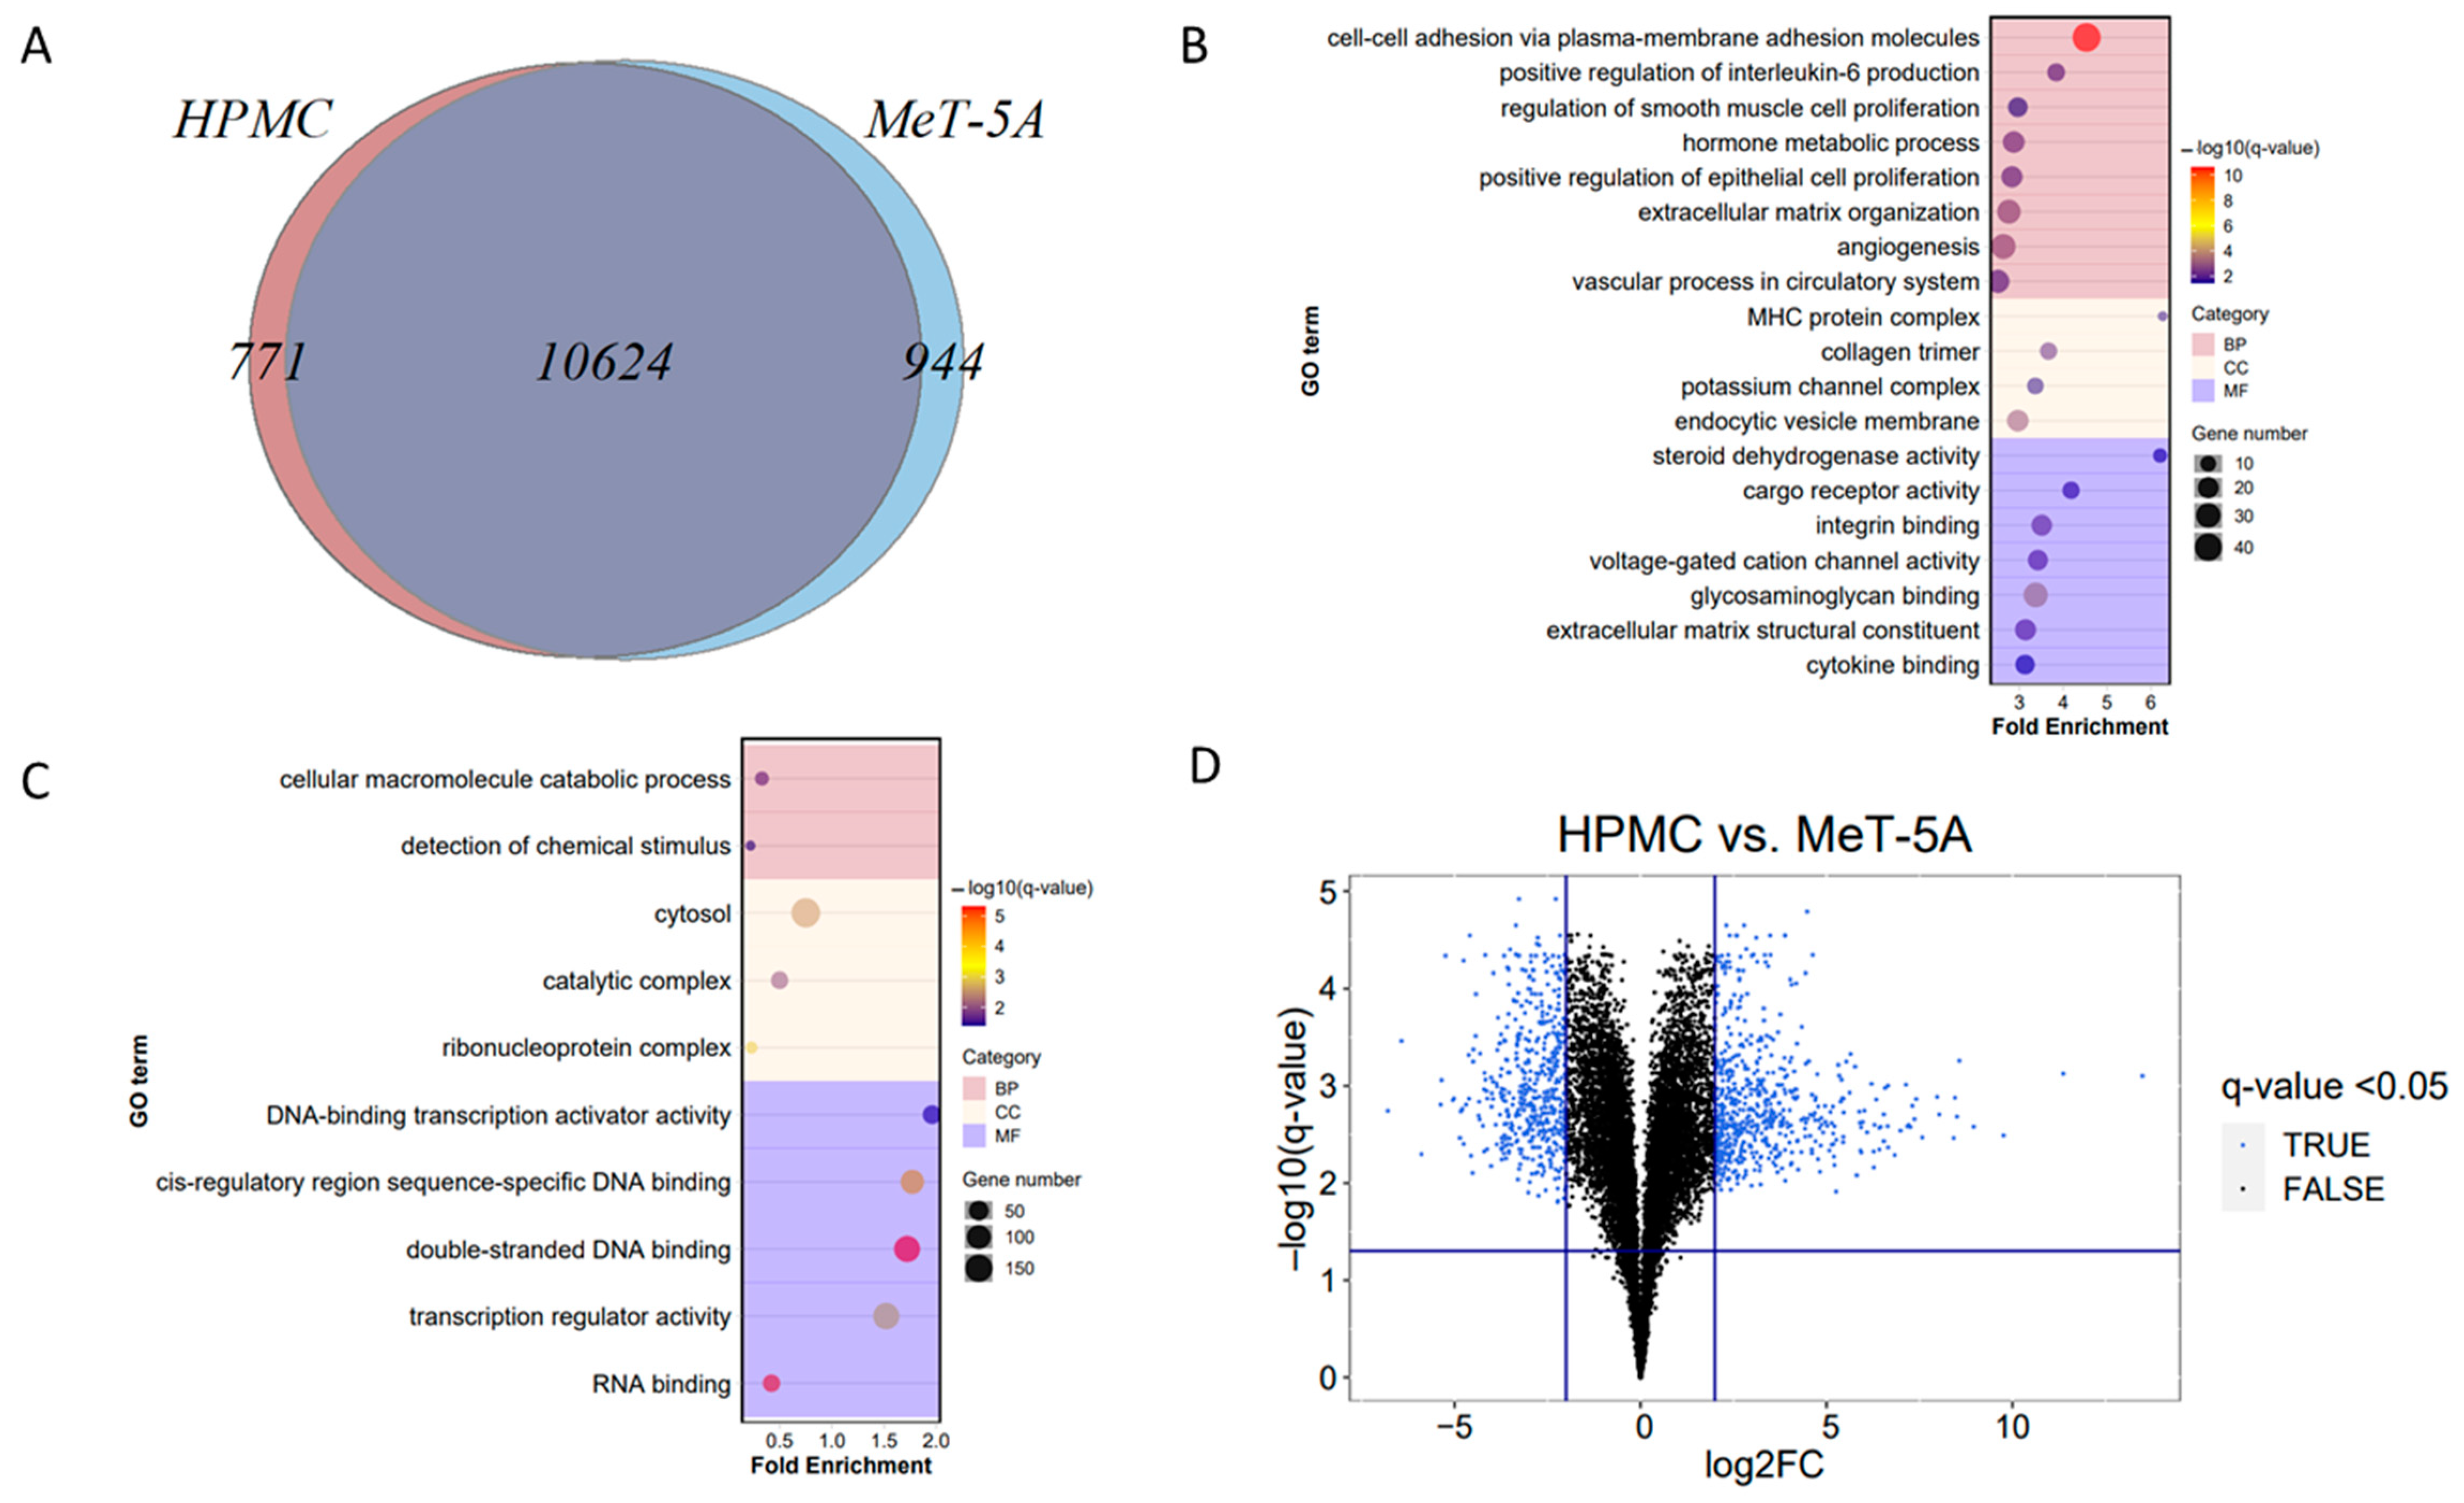
3.2. Comparison of Mesothelial Cell Models
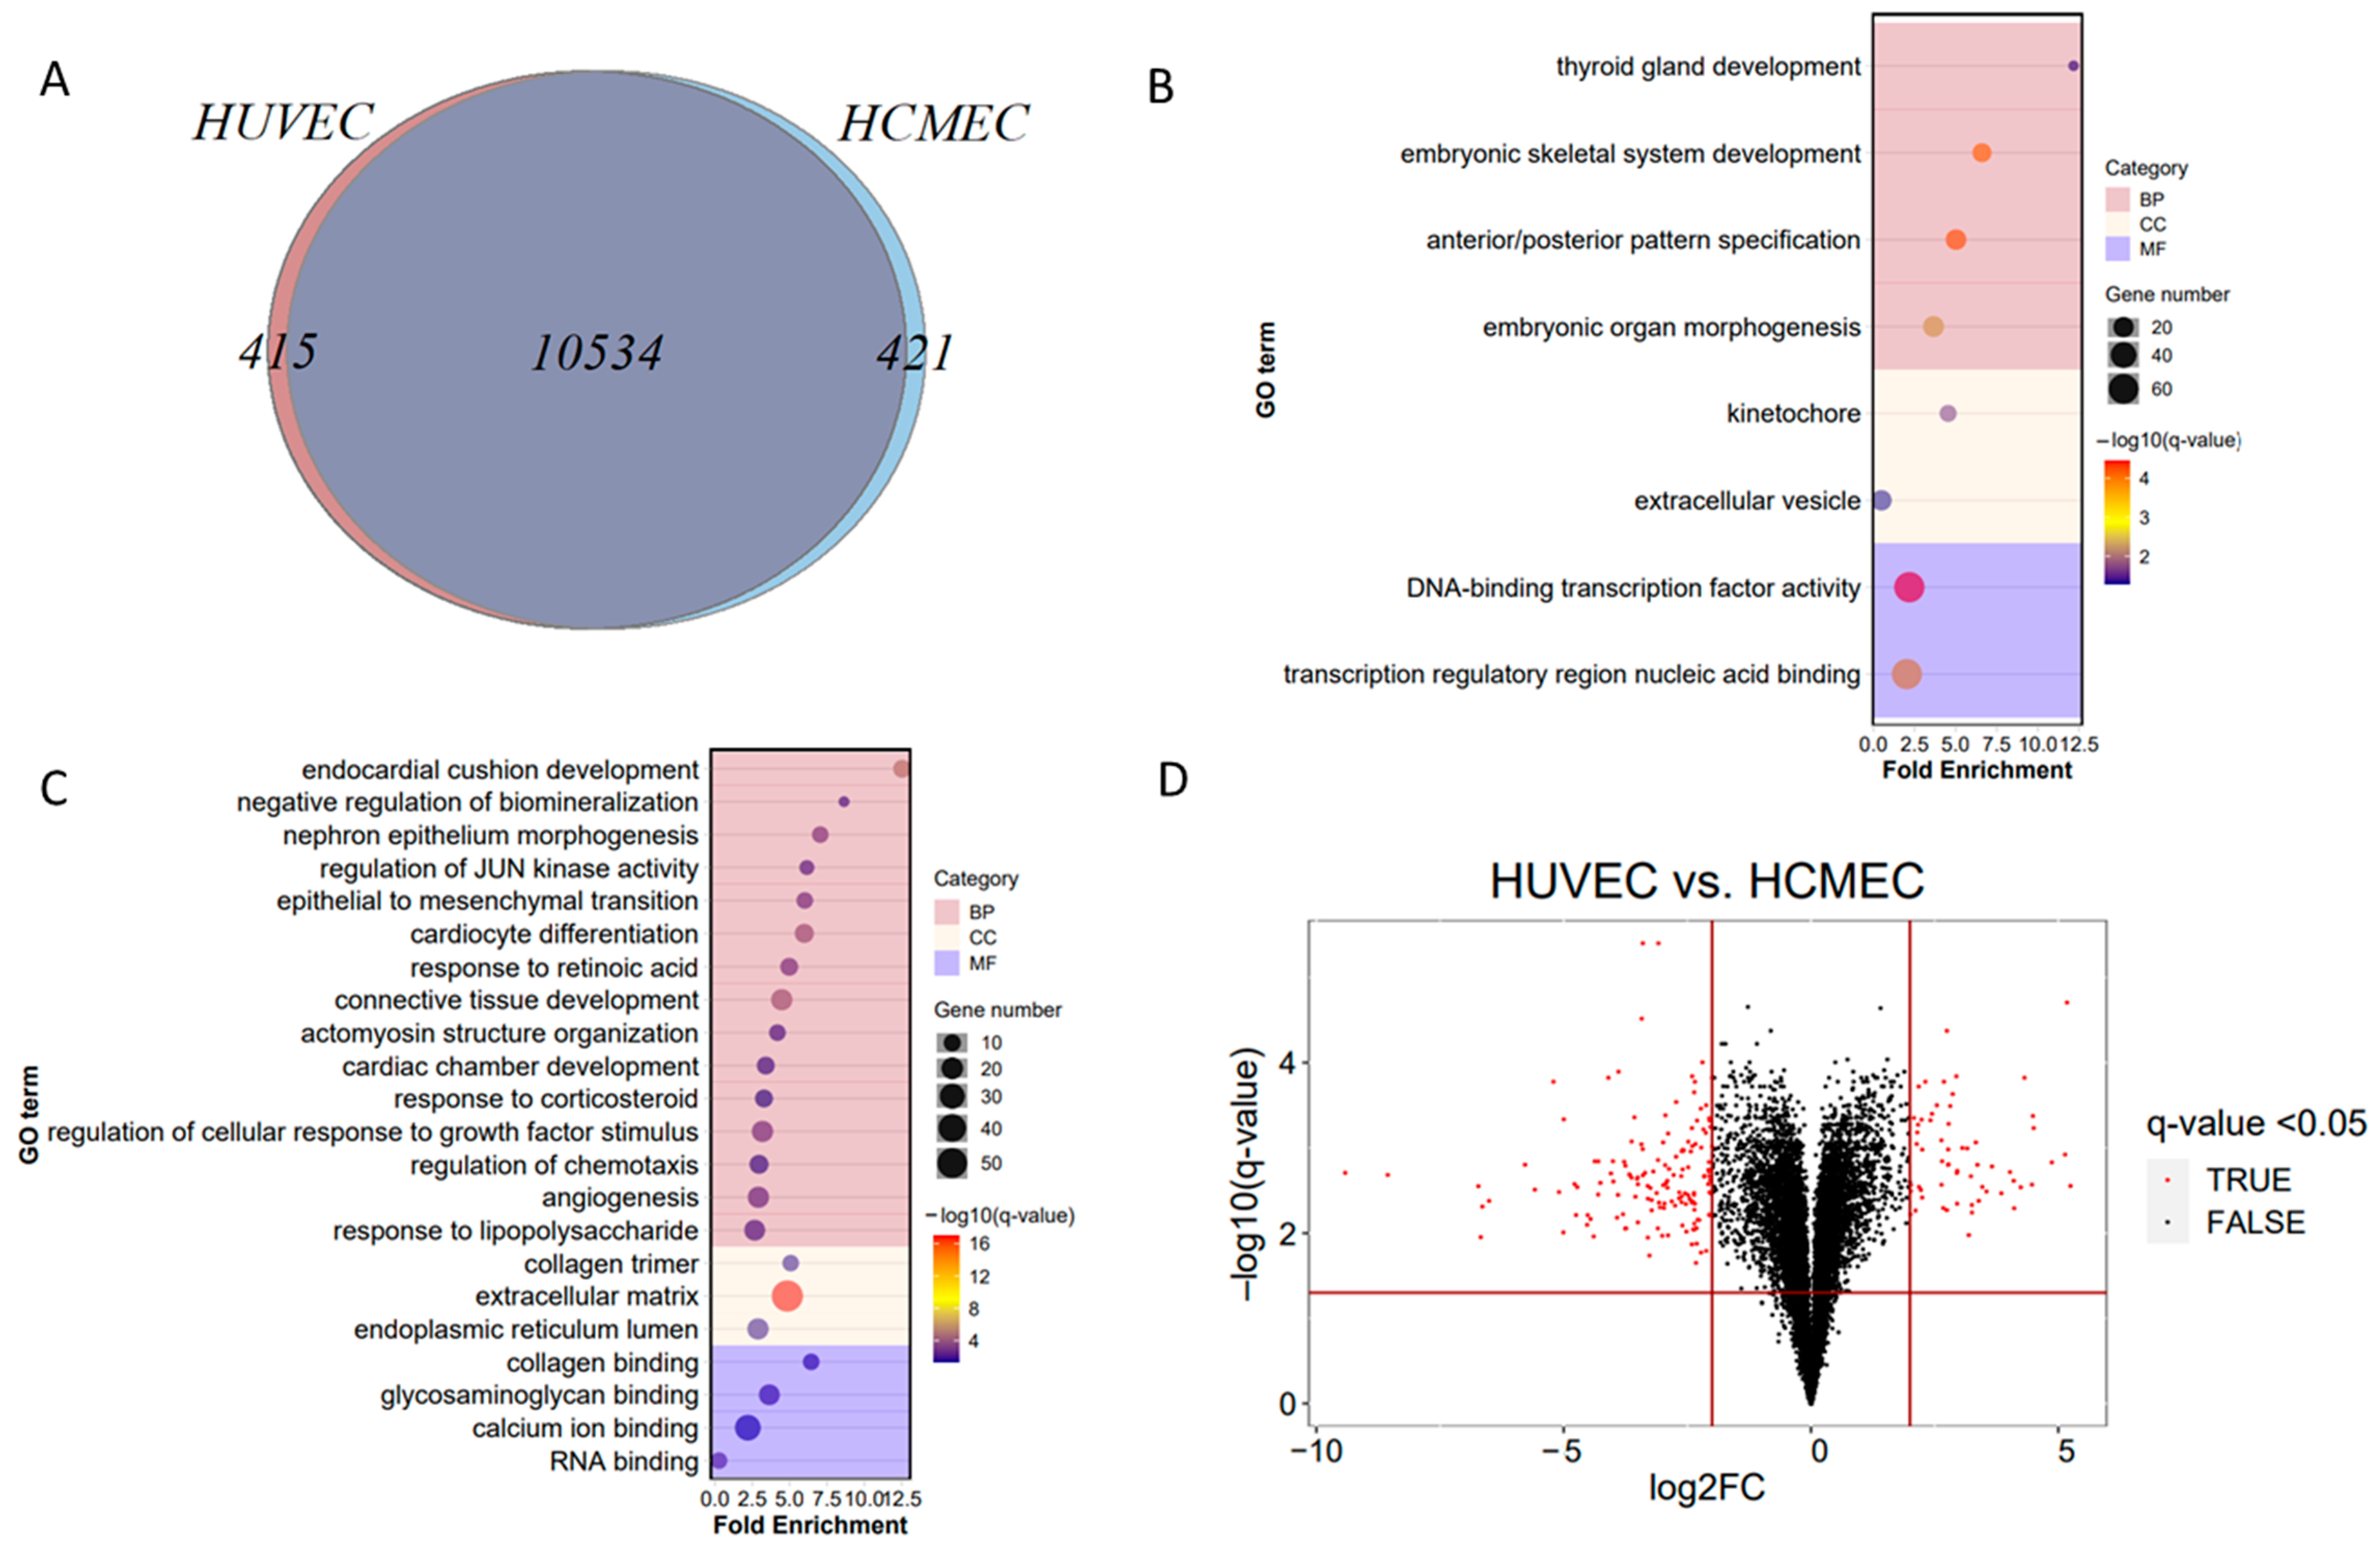
3.3. Comparison of Endothelial Cell Models
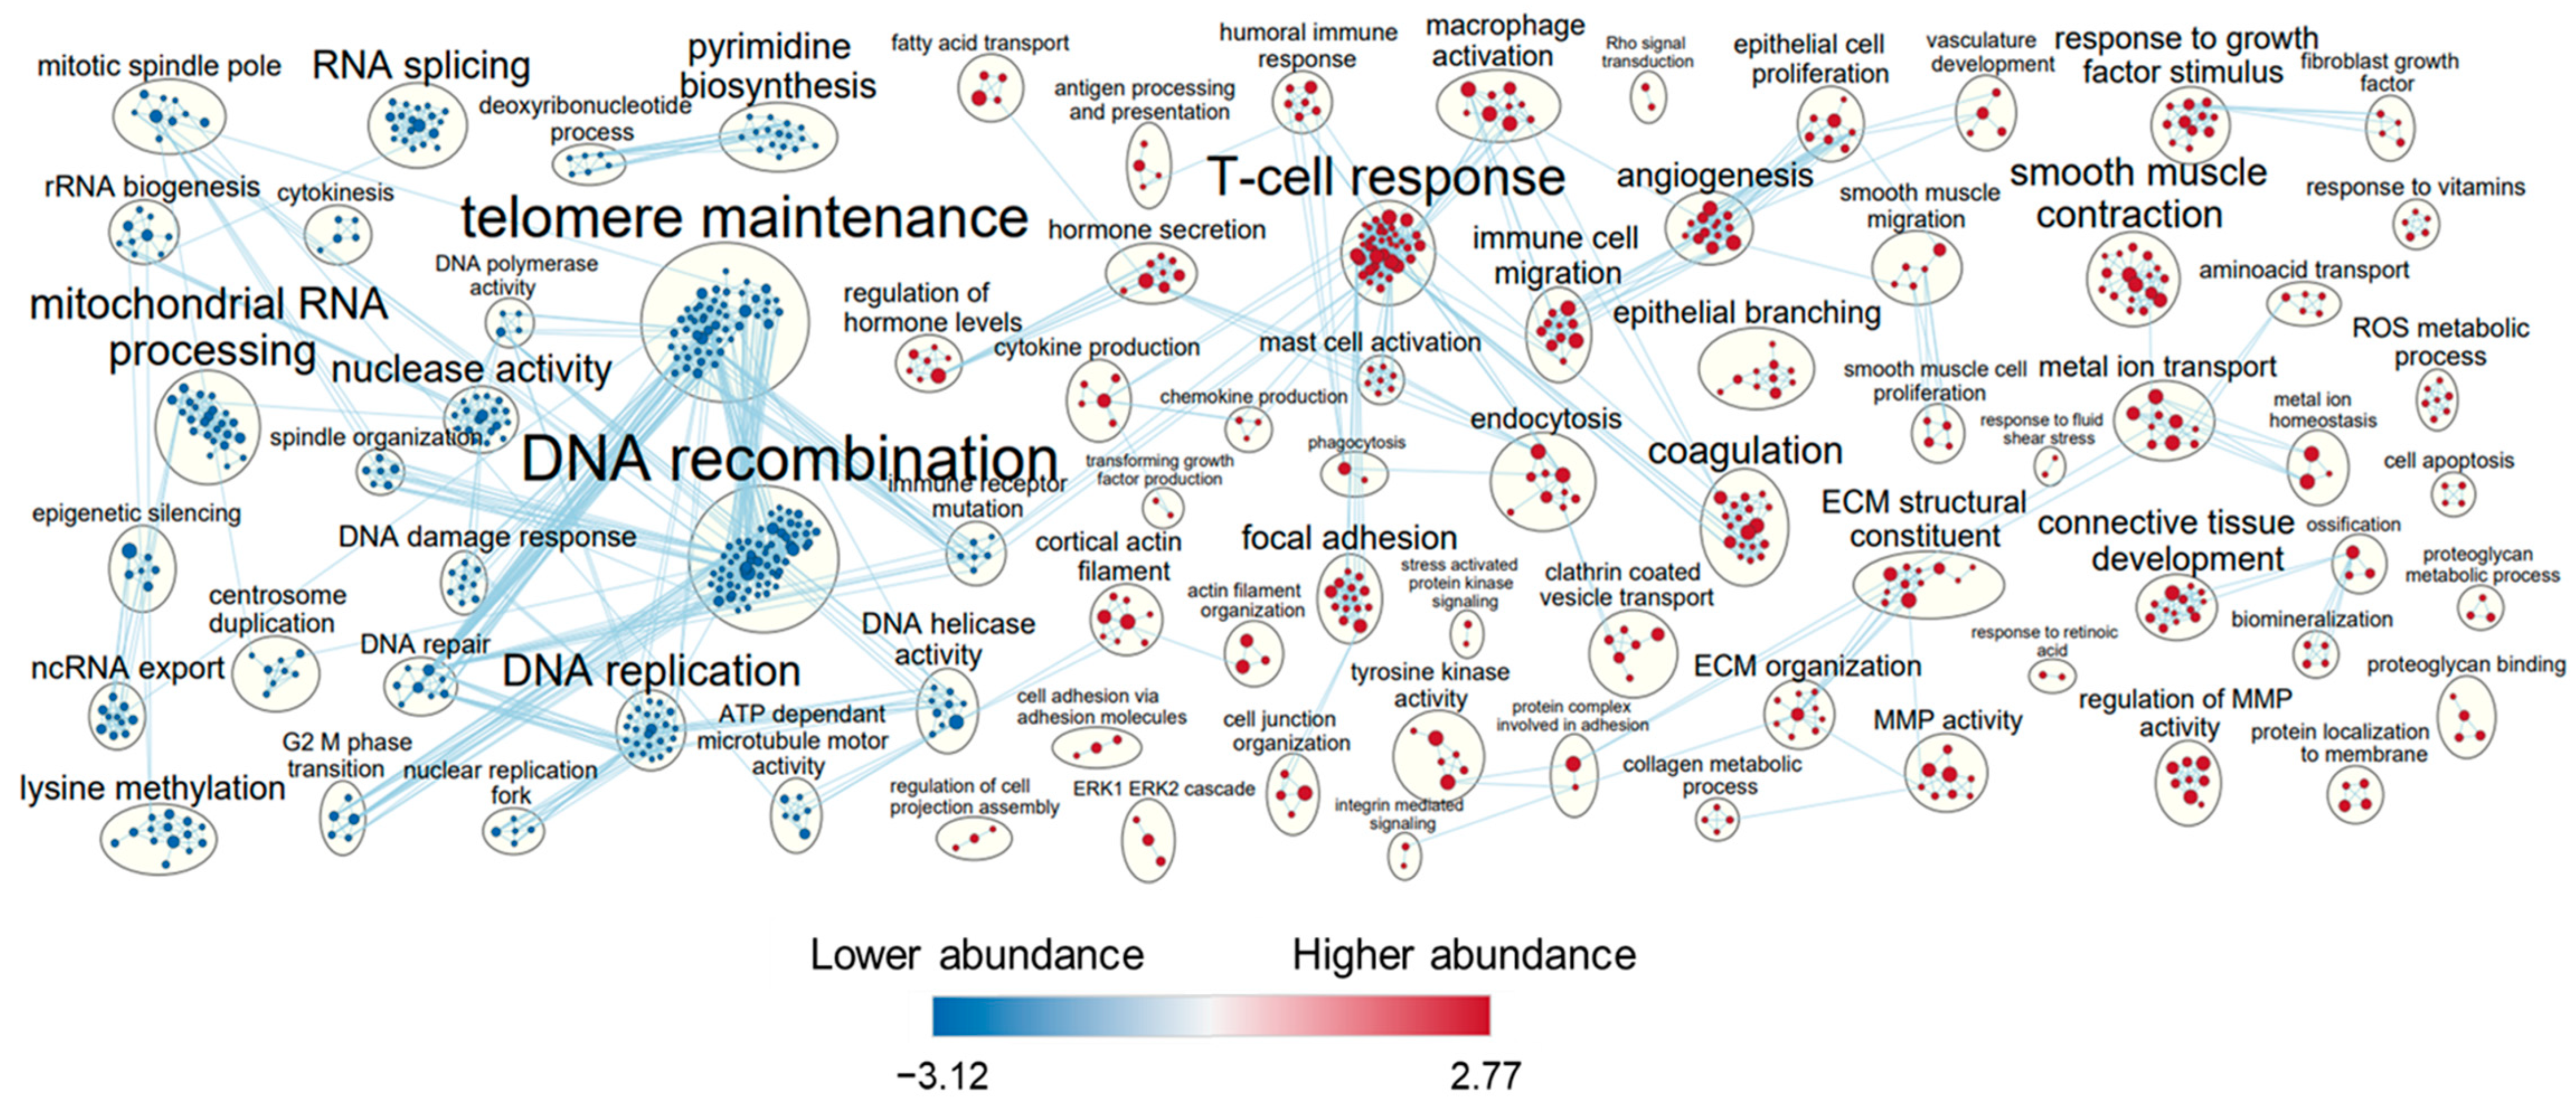
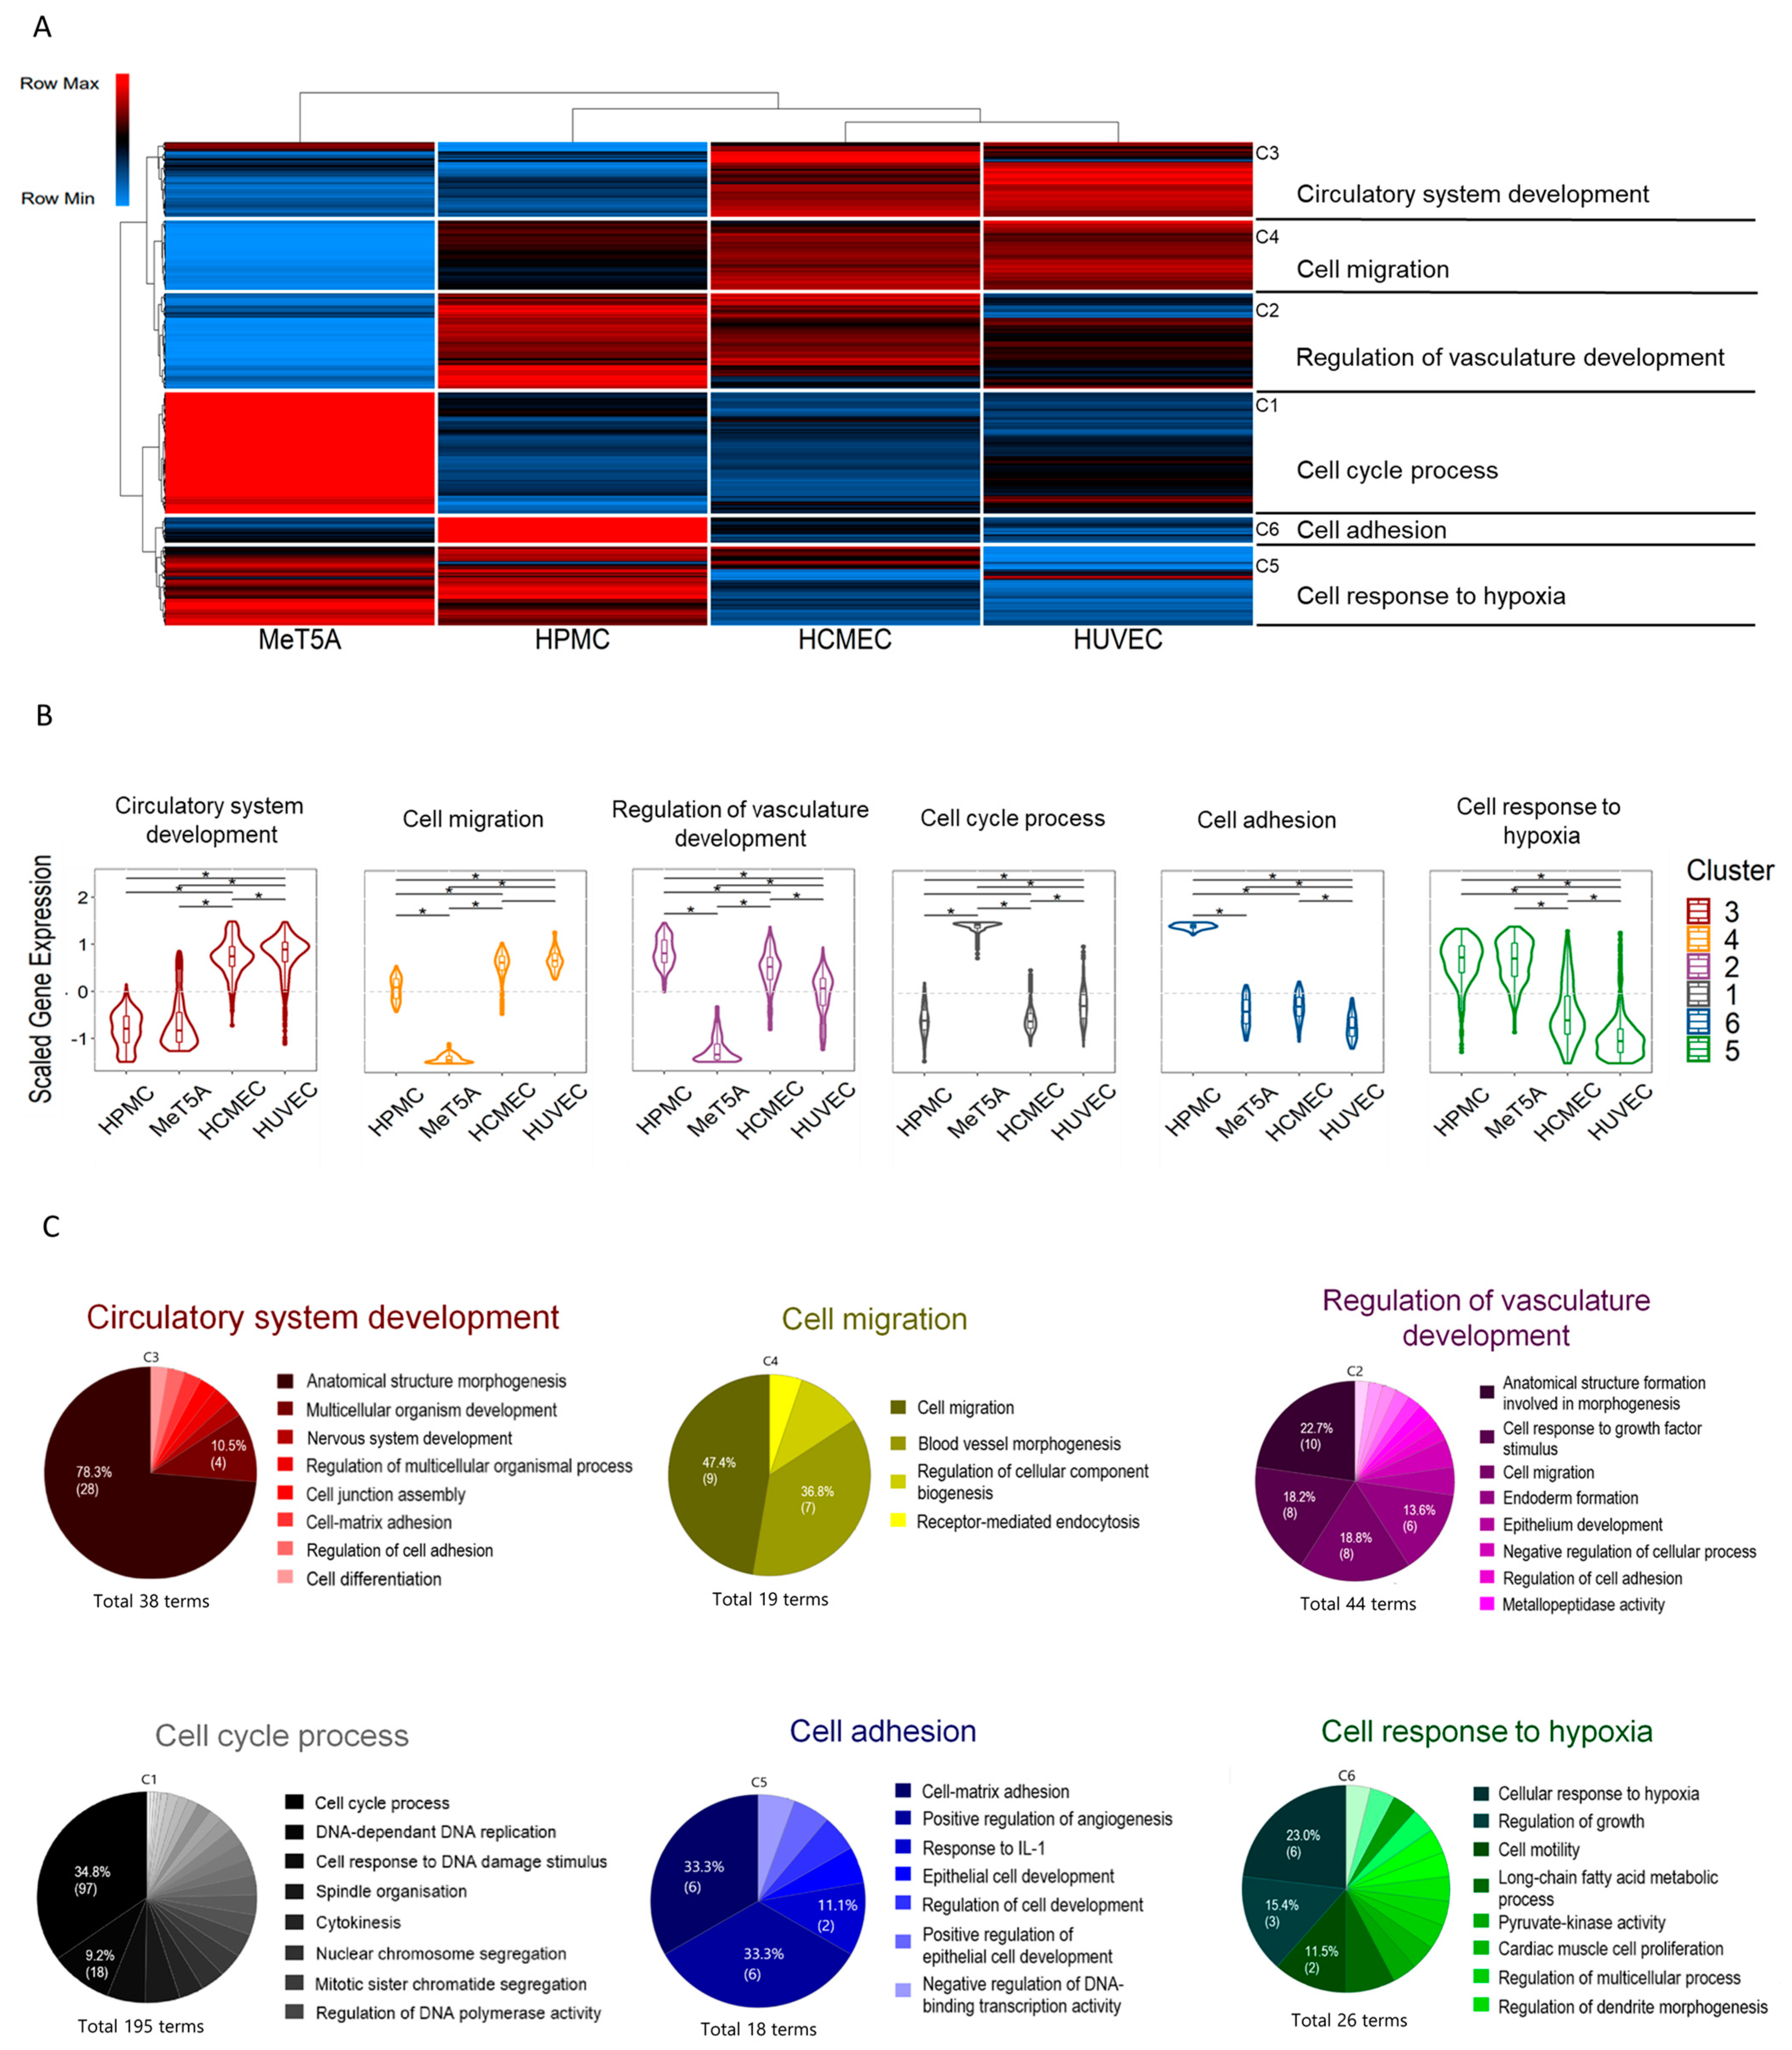
3.4. Cluster Analysis of Shared Transcripts between All Cell Lines
4. Discussion
5. Conclusions
Supplementary Materials
Author Contributions
Funding
Institutional Review Board Statement
Informed Consent Statement
Data Availability Statement
Acknowledgments
Conflicts of Interest
References
- Mutsaers, S.E.; Birnie, K.; Lansley, S.; Herrick, S.E.; Lim, C.B.; Prêle, C.M. Mesothelial cells in tissue repair and fibrosis. Front. Pharmacol. 2015, 6, 113. [Google Scholar] [CrossRef] [Green Version]
- Kawanishi, K. Diverse properties of the mesothelial cells in health and disease. Pleura Peritoneum 2016, 1, 79–89. [Google Scholar] [CrossRef]
- López-Cabrera, M. Mesenchymal Conversion of Mesothelial Cells Is a Key Event in the Pathophysiology of the Peritoneum during Peritoneal Dialysis. Adv. Med. 2014, 2014, 473134. [Google Scholar] [CrossRef] [PubMed]
- Wahiduzzaman, M.; Karnan, S.; Ota, A.; Hanamura, I.; Murakami, H.; Inoko, A.; Rahman, M.L.; Hyodo, T.; Konishi, H.; Tsuzuki, S.; et al. Establishment and characterization of CRISPR/Cas9-mediated NF2−/− human mesothelial cell line: Molecular insight into fibroblast growth factor receptor 2 in malignant pleural mesothelioma. Cancer Sci. 2019, 110, 180–193. [Google Scholar] [CrossRef] [PubMed] [Green Version]
- Schaefer, B.; Bartosova, M.; Macher-Goeppinger, S.; Ujszaszi, A.; Wallwiener, M.; Nyarangi-Dix, J.; Sallay, P.; Burkhardt, D.; Querfeld, U.; Pfeifle, V.; et al. Quantitative Histomorphometry of the Healthy Peritoneum. Sci. Rep. 2016, 6, 21344. [Google Scholar] [CrossRef] [PubMed] [Green Version]
- Rodrigues, S.F.; Granger, D.N. Blood cells and endothelial barrier function. Tissue Barriers 2015, 3, e978720. [Google Scholar] [CrossRef] [PubMed] [Green Version]
- Hadi, H.A.; Carr, C.S.; Al Suwaidi, J. Endothelial dysfunction: Cardiovascular risk factors, therapy, and outcome. Vasc. Health Risk Manag. 2005, 1, 183–198. [Google Scholar]
- Minami, T.; Muramatsu, M.; Kume, T. Organ/tissue-specific vascular endothelial cell heterogeneity in health and disease. Biol. Pharm. Bull. 2019, 42, 1609–1619. [Google Scholar] [CrossRef] [Green Version]
- Hida, K.; Ohga, N.; Akiyama, K.; Maishi, N.; Hida, Y. Heterogeneity of tumor endothelial cells. Cancer Sci. 2013, 104, 1391–1395. [Google Scholar] [CrossRef]
- Bartosova, M.; Ridinger, D.; Marinovic, I.; Heigwer, J.; Zhang, C.; Levai, E.; Westhoff, J.H.; Schaefer, F.; Terjung, S.; Hildenbrand, G.; et al. An Experimental Workflow for Studying Barrier Integrity, Permeability, and Tight Junction Composition and Localization in a Single Endothelial Cell Monolayer: Proof of Concept. Int. J. Mol. Sci. 2021, 22, 8178. [Google Scholar] [CrossRef]
- Stylianou, E.; Jenner, L.A.; Davies, M.; Coles, G.A.; Williams, J.D. Isolation, culture and characterization of human peritoneal mesothelial cells. Kidney Int. 1990, 37, 1563–1570. [Google Scholar] [CrossRef] [PubMed]
- Liao, Y.; Smyth, G.K.; Shi, W. The R package Rsubread is easier, faster, cheaper and better for alignment and quantification of RNA sequencing reads. Nucleic Acids Res. 2019, 47, e47. [Google Scholar] [CrossRef] [PubMed] [Green Version]
- Liao, Y.; Smyth, G.K.; Shi, W. featureCounts: An efficient general purpose program for assigning sequence reads to genomic features. Bioinformatics 2014, 30, 923–930. [Google Scholar] [CrossRef] [PubMed] [Green Version]
- Liao, Y.; Smyth, G.K.; Shi, W. The Subread aligner: Fast, accurate and scalable read mapping by seed-and-vote. Nucleic Acids Res. 2013, 41, e108. [Google Scholar] [CrossRef] [Green Version]
- Love, M.I.; Huber, W.; Anders, S. Moderated estimation of fold change and dispersion for RNA-seq data with DESeq2. Genome Biol. 2014, 15, 550. [Google Scholar] [CrossRef] [PubMed] [Green Version]
- Bindea, G.; Mlecnik, H.B.; Hackl, P.; Charoentong, M.; Tosolini, A.; Kirilovsky, W.H.; Fridman, F.; Pages, Z.T.; Galon, J. ClueGO: A Cytoscape plug-in to decipher functionally grouped gene ontology and pathway annotation networks. Bioinformatics 2009, 25, 1091–1093. [Google Scholar] [CrossRef] [Green Version]
- Subramanian, A.; Tamayo, P.; Mootha, V.K.; Mukherjee, S.; Ebert, B.L.; Gillette, M.A.; Paulovich, A.; Pomeroy, S.L.; Golub, T.R.; Lander, E.S.; et al. Gene set enrichment analysis: A knowledge-based approach for interpreting genome-wide expression profiles. Proc. Natl. Acad. Sci. USA 2005, 102, 15545–15550. [Google Scholar] [CrossRef] [Green Version]
- Reimand, J.; Isserlin, R.; Voisin, V.; Kucera, M.; Tannus-Lopes, C.; Rostamianfar, A.; Wadi, L.; Meyer, M.; Wong, J.; Xu, C.; et al. Pathway enrichment analysis and visualization of omics data using g:Profiler, GSEA, Cytoscape and EnrichmentMap. Nat. Protoc. 2019, 14, 482–517. [Google Scholar] [CrossRef]
- Kolde, R. Pheatmap. b333453GitHub. 2018. Available online: https://github.com/raivokolde/pheatmap (accessed on 1 December 2021).
- Wickham, H. Ggplot2: Elegant Graphics for Data Analysis, 2nd ed.; Springer International Publishing: Midtown Manhattan, NJ, USA, 2016. [Google Scholar]
- Boulanger, E.; Grossin, N.; Wautier, M.P.; Taamma, R.; Wautier, J.L. Mesothelial RAGE activation by AGEs enhances VEGF release and potentiates capillary tube formation. Kidney Int. 2007, 71, 126–133. [Google Scholar] [CrossRef] [Green Version]
- Catar, R.A.; Bartosova, M.; Kawka, E.; Chen, L.; Marinovic, I.; Zhang, C.; Zhao, H.; Wu, D.; Zickler, D.; Stadnik, H.; et al. Angiogenic Role of Mesothelium-Derived Chemokine CXCL1 During Unfavorable Peritoneal Tissue Remodeling in Patients Receiving Peritoneal Dialysis as Renal Replacement Therapy. Front. Immunol. 2022, 13, 821681. [Google Scholar] [CrossRef]
- Chung-Welch, N.; Patton, W.F.; Yen-Patton, G.P.; Hechtman, H.B.; Shepro, D. Phenotypic comparison between mesothelial and microvascular endothelial cell lineages using conventional endothelial cell markers, cytoskeletal protein markers and in vitro assays of angiogenic potential. Differ. Res. Biol. Divers. 1989, 42, 44–53. [Google Scholar] [CrossRef] [PubMed]
- Schreider, C.; Peignon, G.; Thenet, S.; Chambaz, J.; Pinçon-Raymond, M. Integrin-mediated functional polarization of Caco-2 cells through E-cadherin--actin complexes. J. Cell Sci. 2002, 115 Pt 3, 543–552. [Google Scholar] [CrossRef] [PubMed]
- Börner, C.; Scheerer, C.; Buschow, R.; Chiantera, V.; Sehouli, J.; Mechsner, S. Pain Mechanisms in Peritoneal Diseases Might Be Partially Regulated by Estrogen. Reprod. Sci. 2018, 25, 424–434. [Google Scholar] [CrossRef] [PubMed]
- Nanobashvili, J.; Jozkowicz, A.; Neumayer, C.; Fügl, A.; Sporn, E.; Polterauer, P.; Huk, I. Comparison of Angiogenic Potential of Human Microvascular Endothelial Cells and Human Umbilical Vein Endothelial Cells. Eur. Surg. 2003, 35, 214–219. [Google Scholar] [CrossRef]
- Dib, H.; Chafey, P.; Clary, G.; Federici, C.; Le Gall, M.; Dwyer, J.; Gavard, J.; Tamas, N.; Bussone, G.; Broussard, C.; et al. Proteomes of umbilical vein and microvascular endothelial cells reflect distinct biological properties and influence immune recognition. Proteomics 2012, 12, 2547–2555. [Google Scholar] [CrossRef]
- Chi, J.T.; Chang, H.Y.; Haraldsen, G.; Jahnsen, F.L.; Troyanskaya, O.G.; Chang, D.S.; Wang, Z.; Rockson, S.G.; van de Rijn, M.; Botstein, D.; et al. Endothelial cell diversity revealed by global expression profiling. Proc. Natl. Acad. Sci. USA 2003, 100, 10623–10628. [Google Scholar] [CrossRef] [Green Version]
- Herzog, R.; Bartosova, M.; Tarantino, S.; Wagner, A.; Unterwurzacher, M.; Sacnun, J.M.; Lichtenauer, A.M.; Kuster, L.; Schaefer, B.; Alper, S.L.; et al. Peritoneal Dialysis Fluid Supplementation with Alanyl-Glutamine Attenuates Conventional Dialysis Fluid-Mediated Endothelial Cell Injury by Restoring Perturbed Cytoprotective Responses. Biomolecules 2020, 10, 1678. [Google Scholar] [CrossRef]
- Henzi, T.; Blum, W.V.; Pfefferli, M.; Kawecki, T.J.; Salicio, V.; Schwaller, B. SV40-induced expression of calretinin protects mesothelial cells from asbestos cytotoxicity and may be a key factor contributing to mesothelioma pathogenesis. Am. J. Pathol. 2009, 174, 2324–2336. [Google Scholar] [CrossRef] [Green Version]
- Nunbhakdi-Craig, V.; Craig, L.; Machleidt, T.; Sontag, E. Simian virus 40 small tumor antigen induces deregulation of the actin cytoskeleton and tight junctions in kidney epithelial cells. J. Virol. 2003, 77, 2807–2818. [Google Scholar] [CrossRef] [Green Version]
- Schaefer, B.; Bartosova, M.; Macher-Goeppinger, S.; Sallay, P.; Vörös, P.; Ranchin, B.; Vondrak, K.; Ariceta, G.; Zaloszyc, A.; Bayazit, A.K.; et al. Neutral pH and low-glucose degradation product dialysis fluids induce major early alterations of the peritoneal membrane in children on peritoneal dialysis. Kidney Int. 2018, 94, 419–429. [Google Scholar] [CrossRef]
- Mikuła-Pietrasik, J.; Stryczyński, Ł.; Uruski, P.; Tykarski, A.; Książek, K. Procancerogenic activity of senescent cells: A case of the peritoneal mesothelium. Ageing Res. Rev. 2018, 43, 1–9. [Google Scholar] [CrossRef] [PubMed]
- Morishita, Y.; Ookawara, S.; Hirahara, I.; Muto, S.; Nagata, D. HIF-1α mediates Hypoxia-induced epithelial-mesenchymal transition in peritoneal mesothelial cells. Ren. Fail. 2016, 38, 282–289. [Google Scholar] [CrossRef] [PubMed] [Green Version]
- Pias, S.C. Pathways of Oxygen Diffusion in Cells and Tissues: Hydrophobic Channeling via Networked Lipids. Adv. Exp. Med. Biol. 2020, 1232, 183–190. [Google Scholar] [CrossRef] [PubMed]
- Büchel, J.; Bartosova, M.; Eich, G.; Wittenberger, T.; Klein-Hitpass, L.; Steppan, S.; Hackert, T.; Schaefer, F.; Passlick-Deetjen, J.; Schmitt, C.P. Interference of peritoneal dialysis fluids with cell cycle mechanisms. Perit. Dial. Int. J. Int. Soc. Perit. Dial. 2015, 35, 259–274. [Google Scholar] [CrossRef] [PubMed]


Publisher’s Note: MDPI stays neutral with regard to jurisdictional claims in published maps and institutional affiliations. |
© 2022 by the authors. Licensee MDPI, Basel, Switzerland. This article is an open access article distributed under the terms and conditions of the Creative Commons Attribution (CC BY) license (https://creativecommons.org/licenses/by/4.0/).
Share and Cite
Marinovic, I.; Bartosova, M.; Herzog, R.; Sacnun, J.M.; Zhang, C.; Hoogenboom, R.; Unterwurzacher, M.; Hackert, T.; Teleman, A.A.; Kratochwill, K.; et al. Understanding Cell Model Characteristics—RNA Expression Profiling in Primary and Immortalized Human Mesothelial Cells, and in Human Vein and Microvascular Endothelial Cells. Cells 2022, 11, 3133. https://doi.org/10.3390/cells11193133
Marinovic I, Bartosova M, Herzog R, Sacnun JM, Zhang C, Hoogenboom R, Unterwurzacher M, Hackert T, Teleman AA, Kratochwill K, et al. Understanding Cell Model Characteristics—RNA Expression Profiling in Primary and Immortalized Human Mesothelial Cells, and in Human Vein and Microvascular Endothelial Cells. Cells. 2022; 11(19):3133. https://doi.org/10.3390/cells11193133
Chicago/Turabian StyleMarinovic, Iva, Maria Bartosova, Rebecca Herzog, Juan Manuel Sacnun, Conghui Zhang, Robin Hoogenboom, Markus Unterwurzacher, Thilo Hackert, Aurelio A. Teleman, Klaus Kratochwill, and et al. 2022. "Understanding Cell Model Characteristics—RNA Expression Profiling in Primary and Immortalized Human Mesothelial Cells, and in Human Vein and Microvascular Endothelial Cells" Cells 11, no. 19: 3133. https://doi.org/10.3390/cells11193133