
Evaluation of the Effectiveness of Herbal Components Based on Their Regulatory Signature on Carcinogenic Cancer Cells

 ,
,
Abstract
:1. Introduction
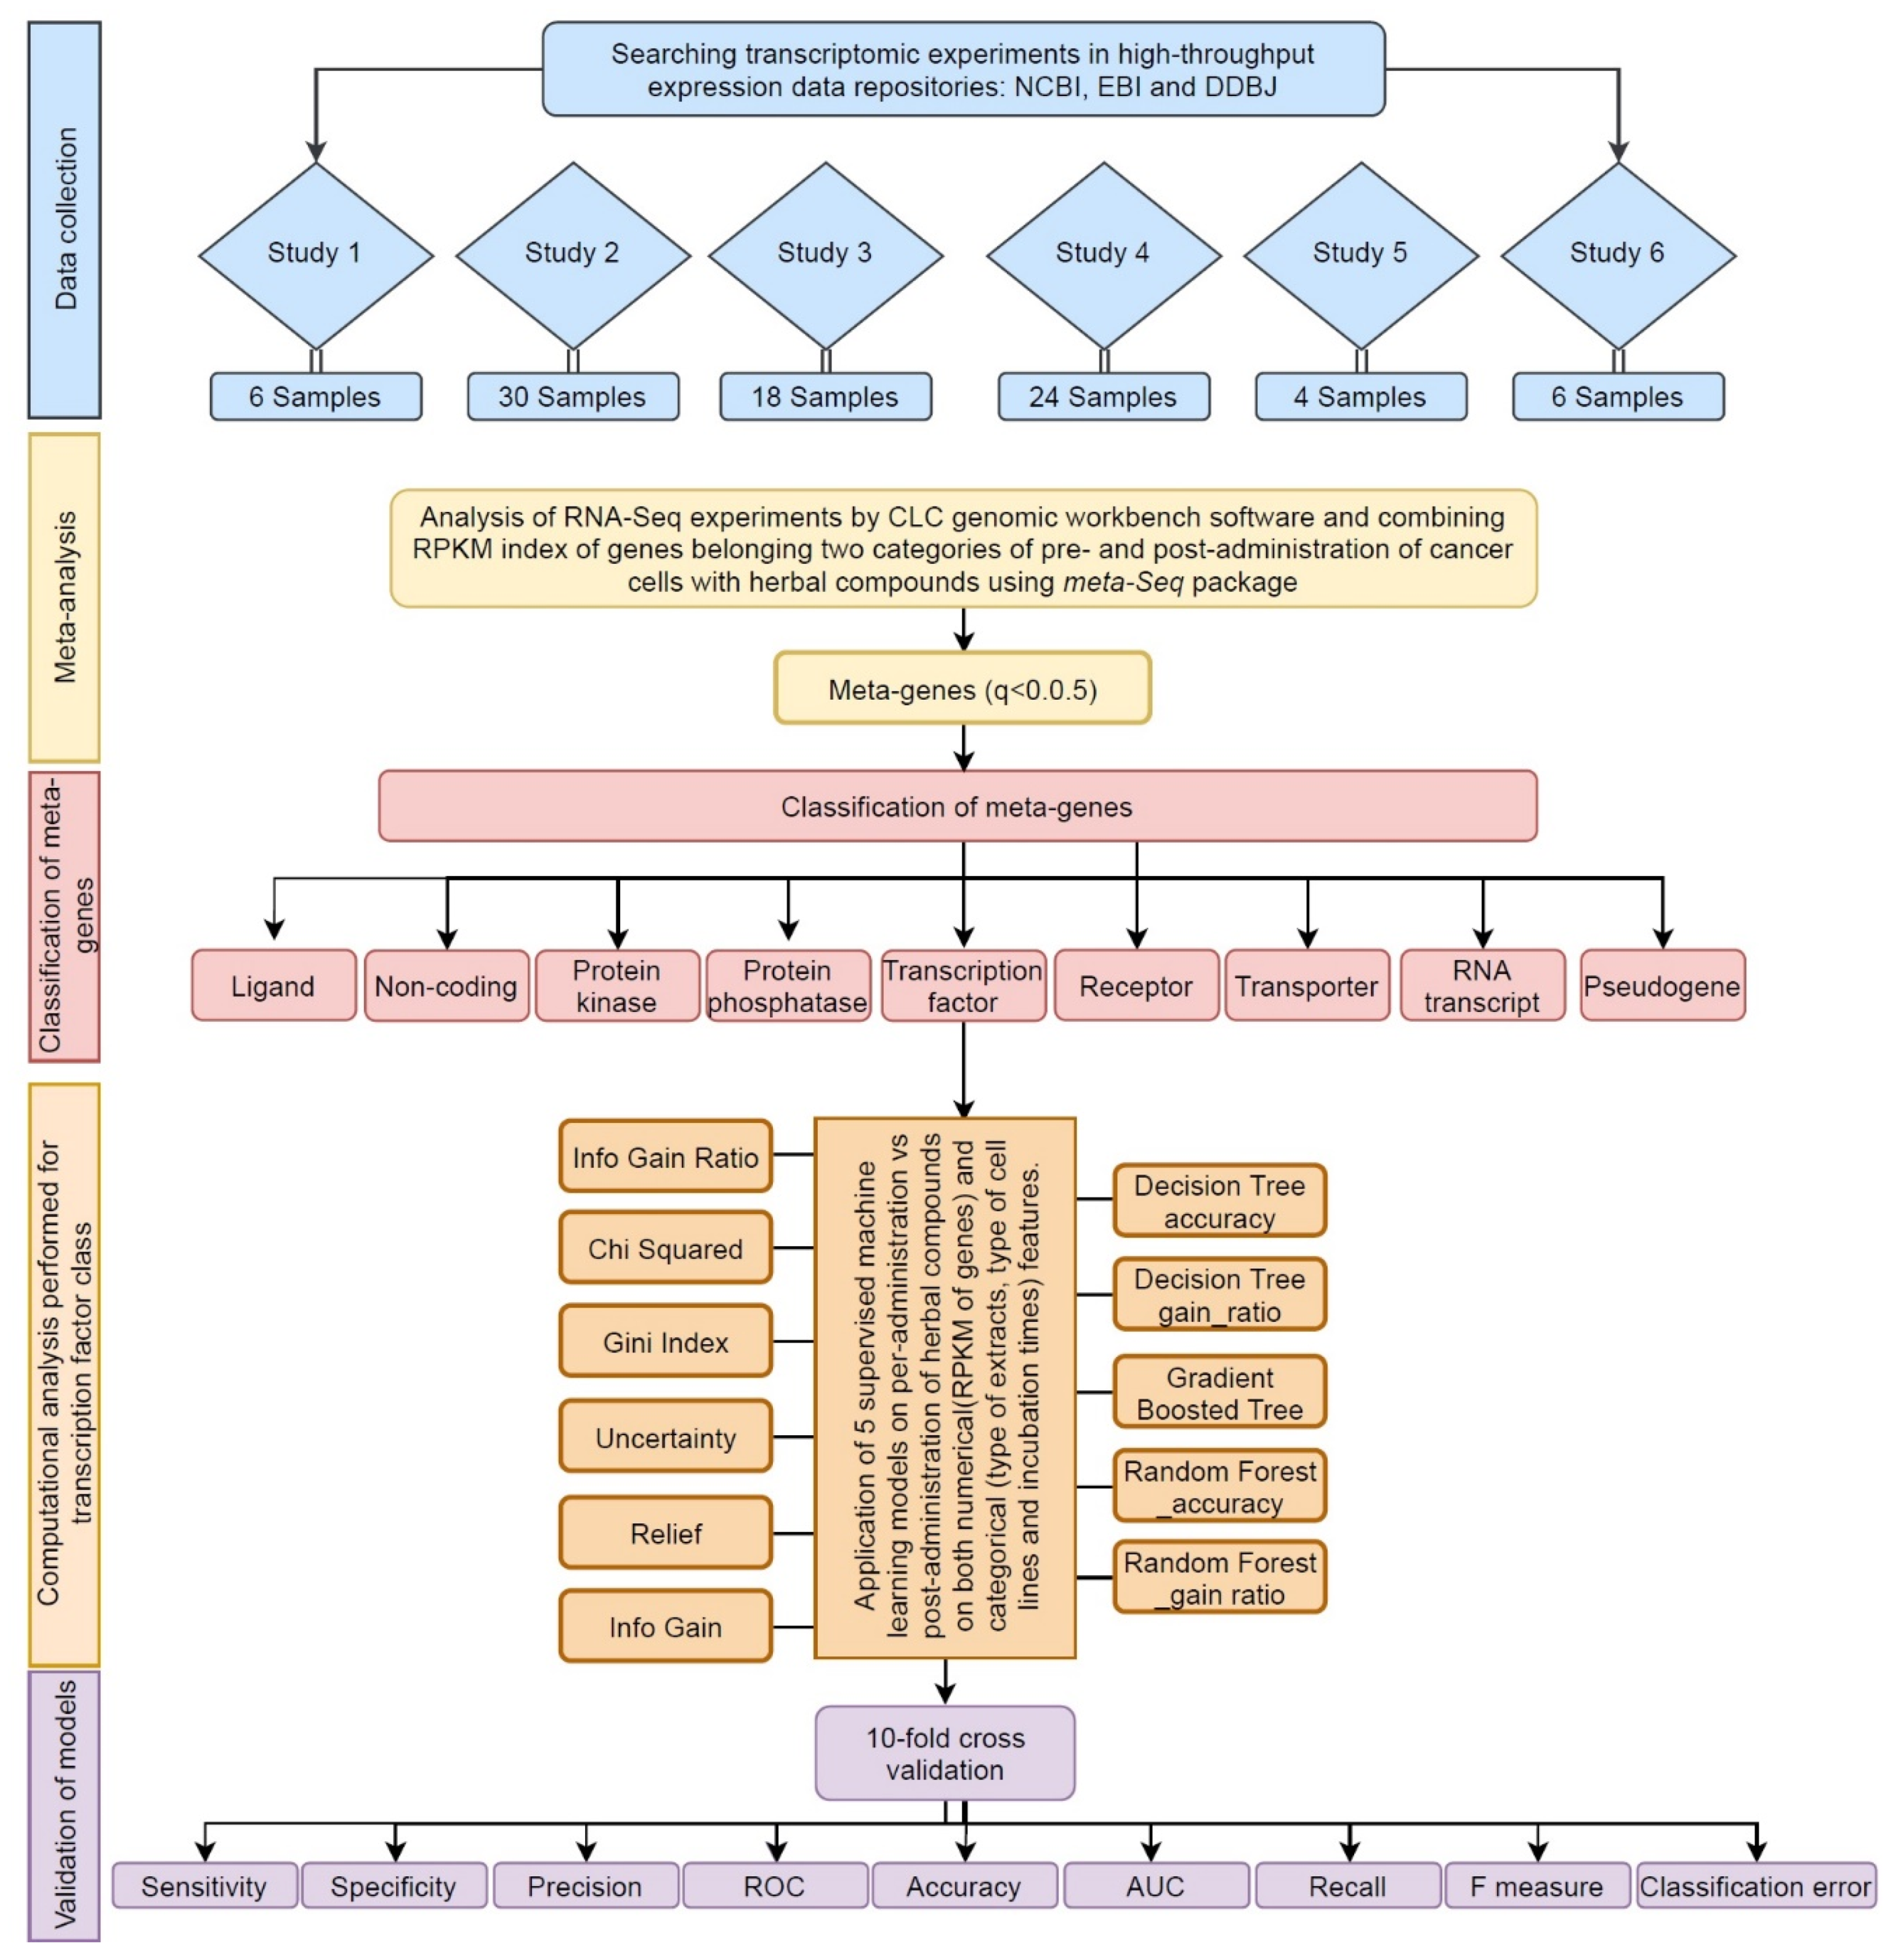
2. Methods
2.1. Data Collection
2.2. Meta-Analysis
2.3. Gene Ontology Analysis of Transcription Factors
2.4. Categorical Feature Analysis by Decision Tree Algorithms
2.5. Validation and Comparison of Predictive Algorithms
2.6. Meta-Analysis of Individual Signature genes
2.7. External Validation for Effectiveness of the Predictive TFs on New Herbal Compound
3. Results
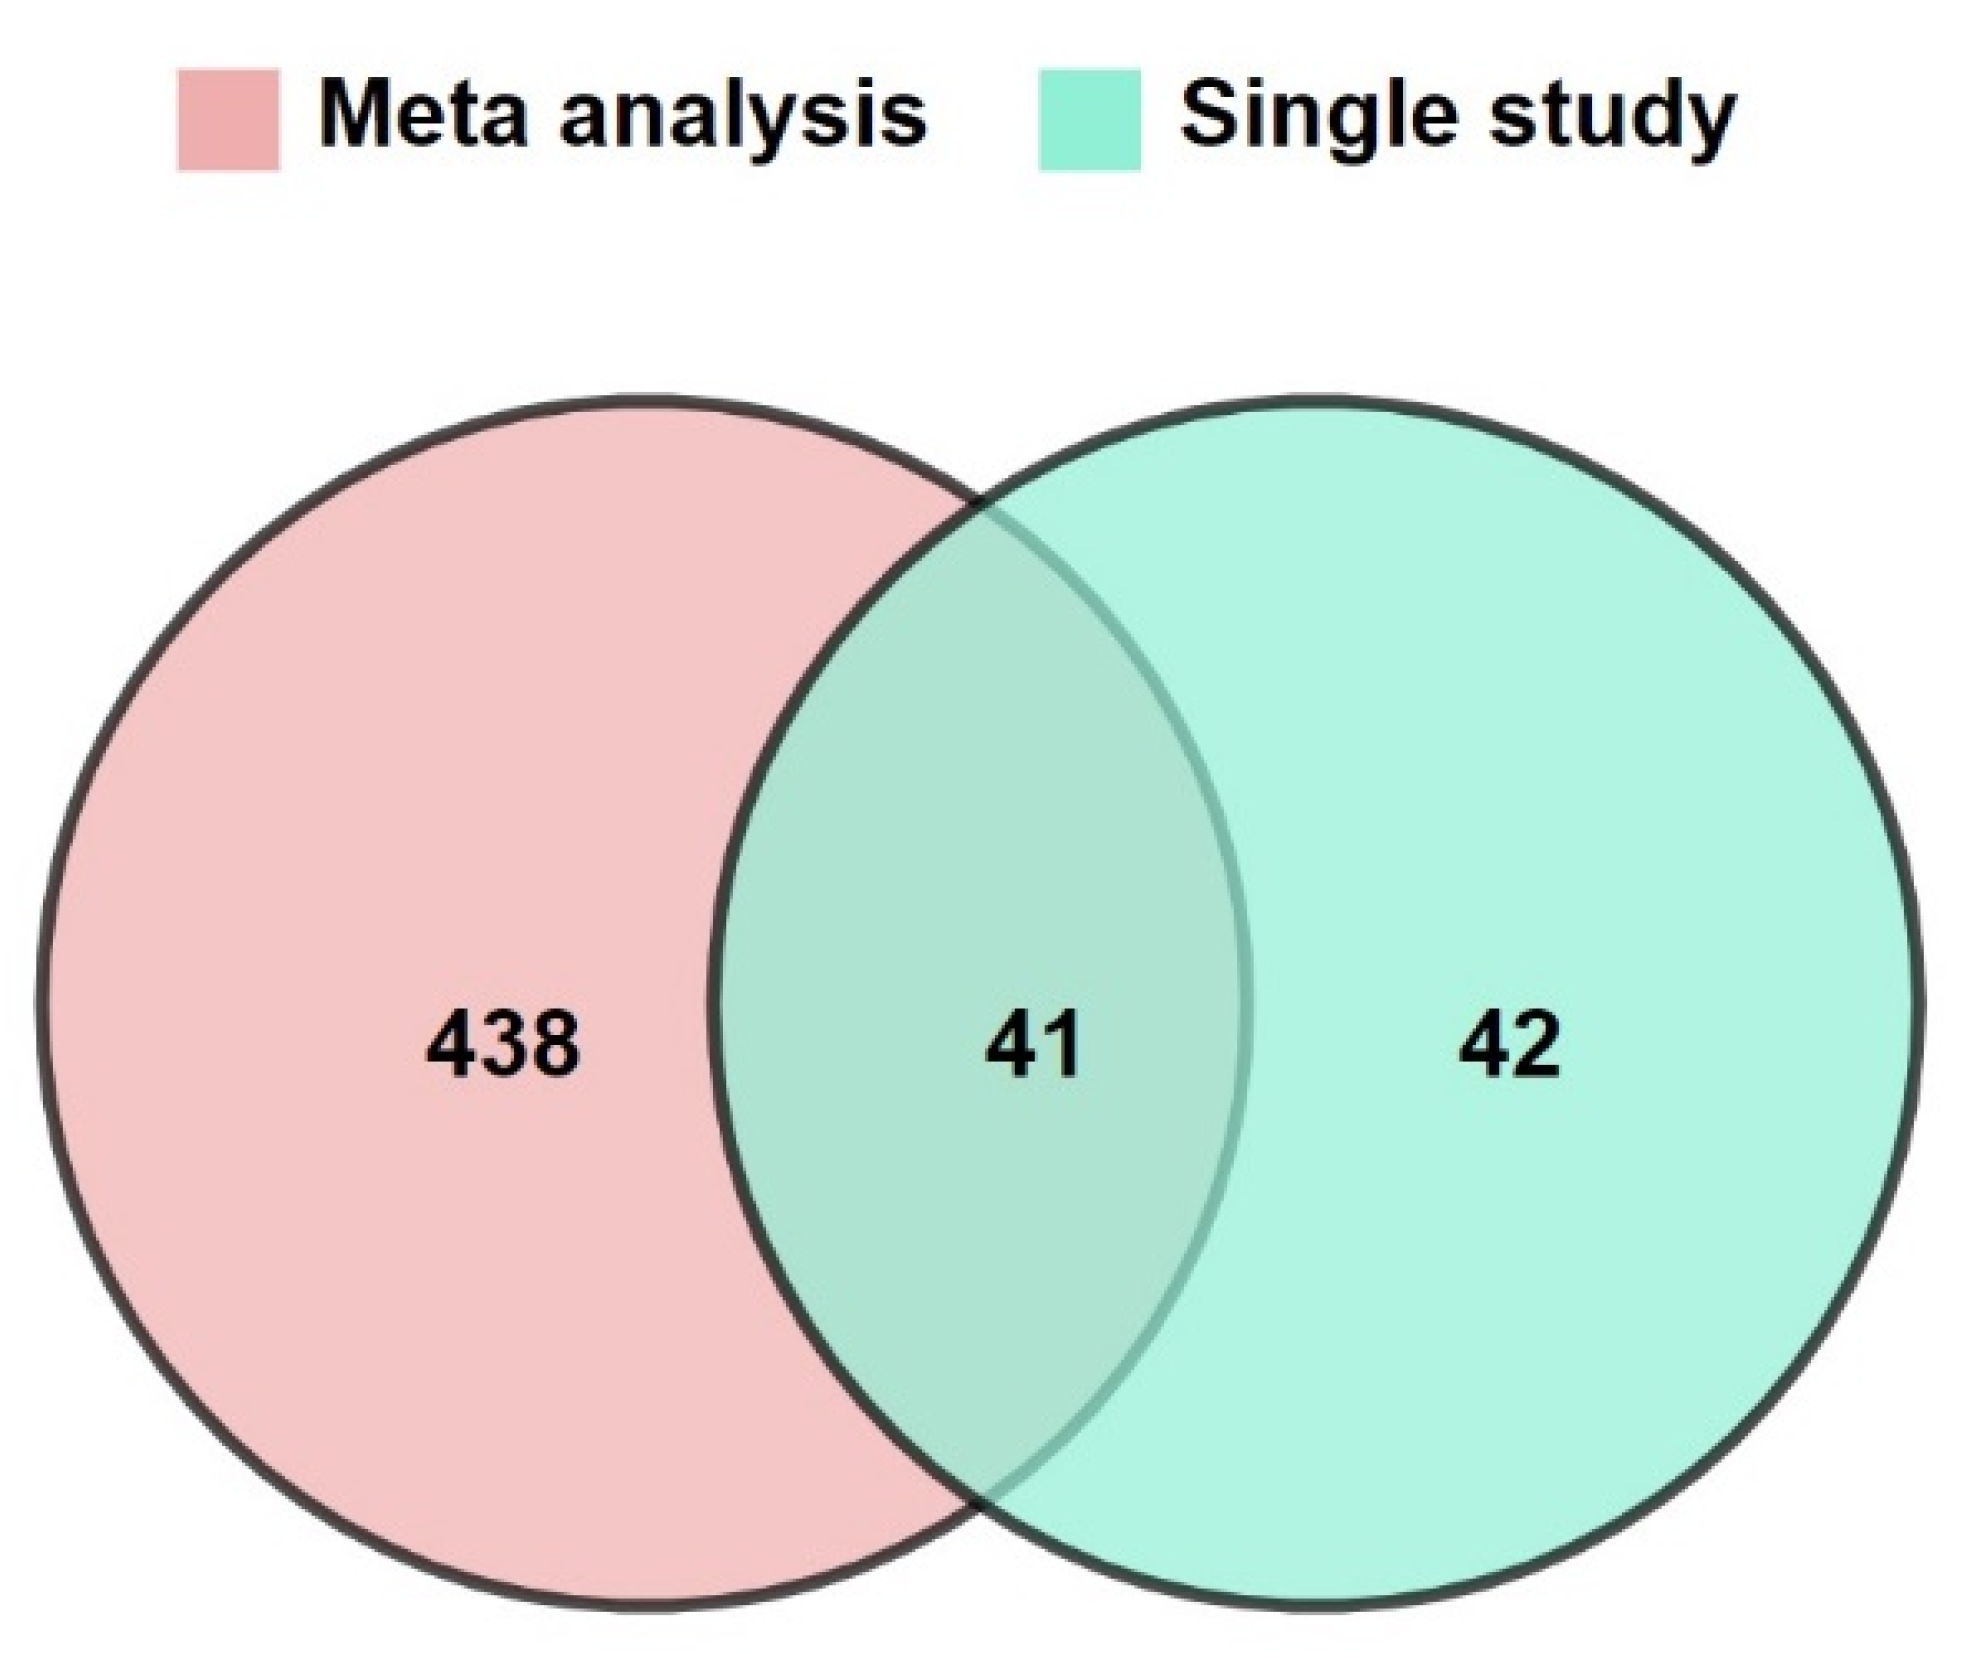
3.1. Increasing the Size of Dataset by Meta-Analysis
3.2. Classification of Meta-Genes
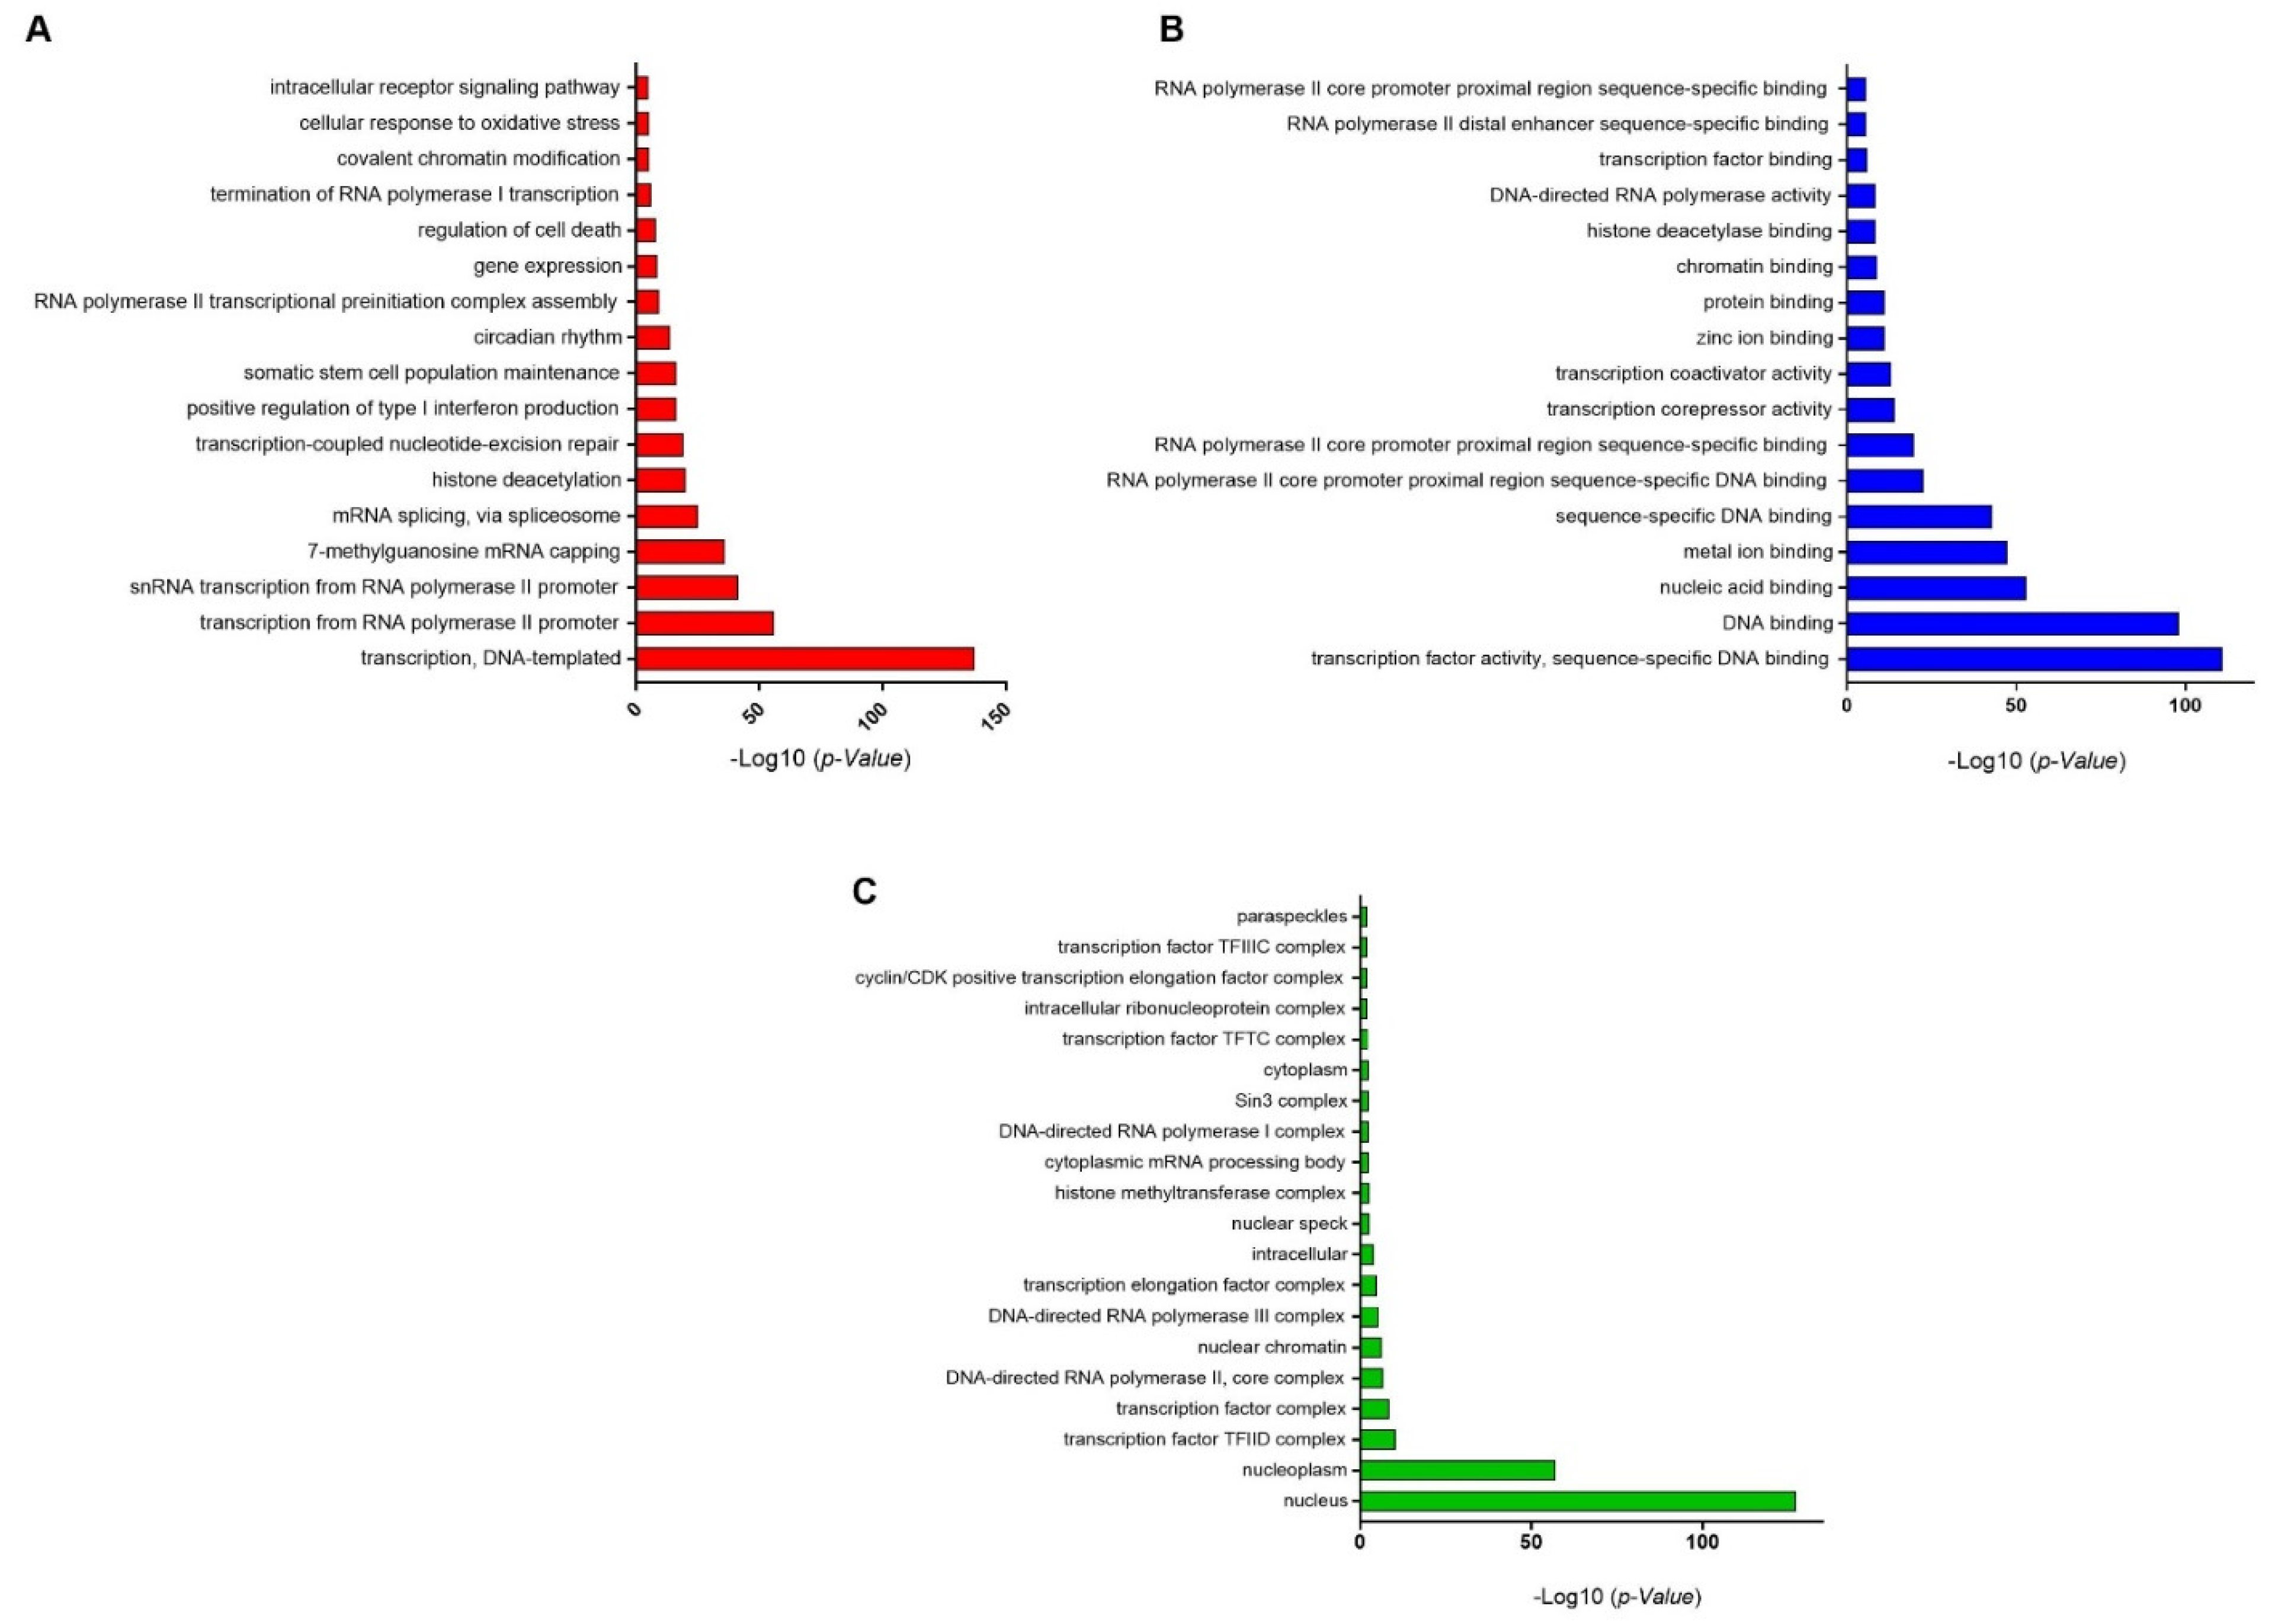
3.3. GO-Enrichment Analysis of Herbal-Induced TFs
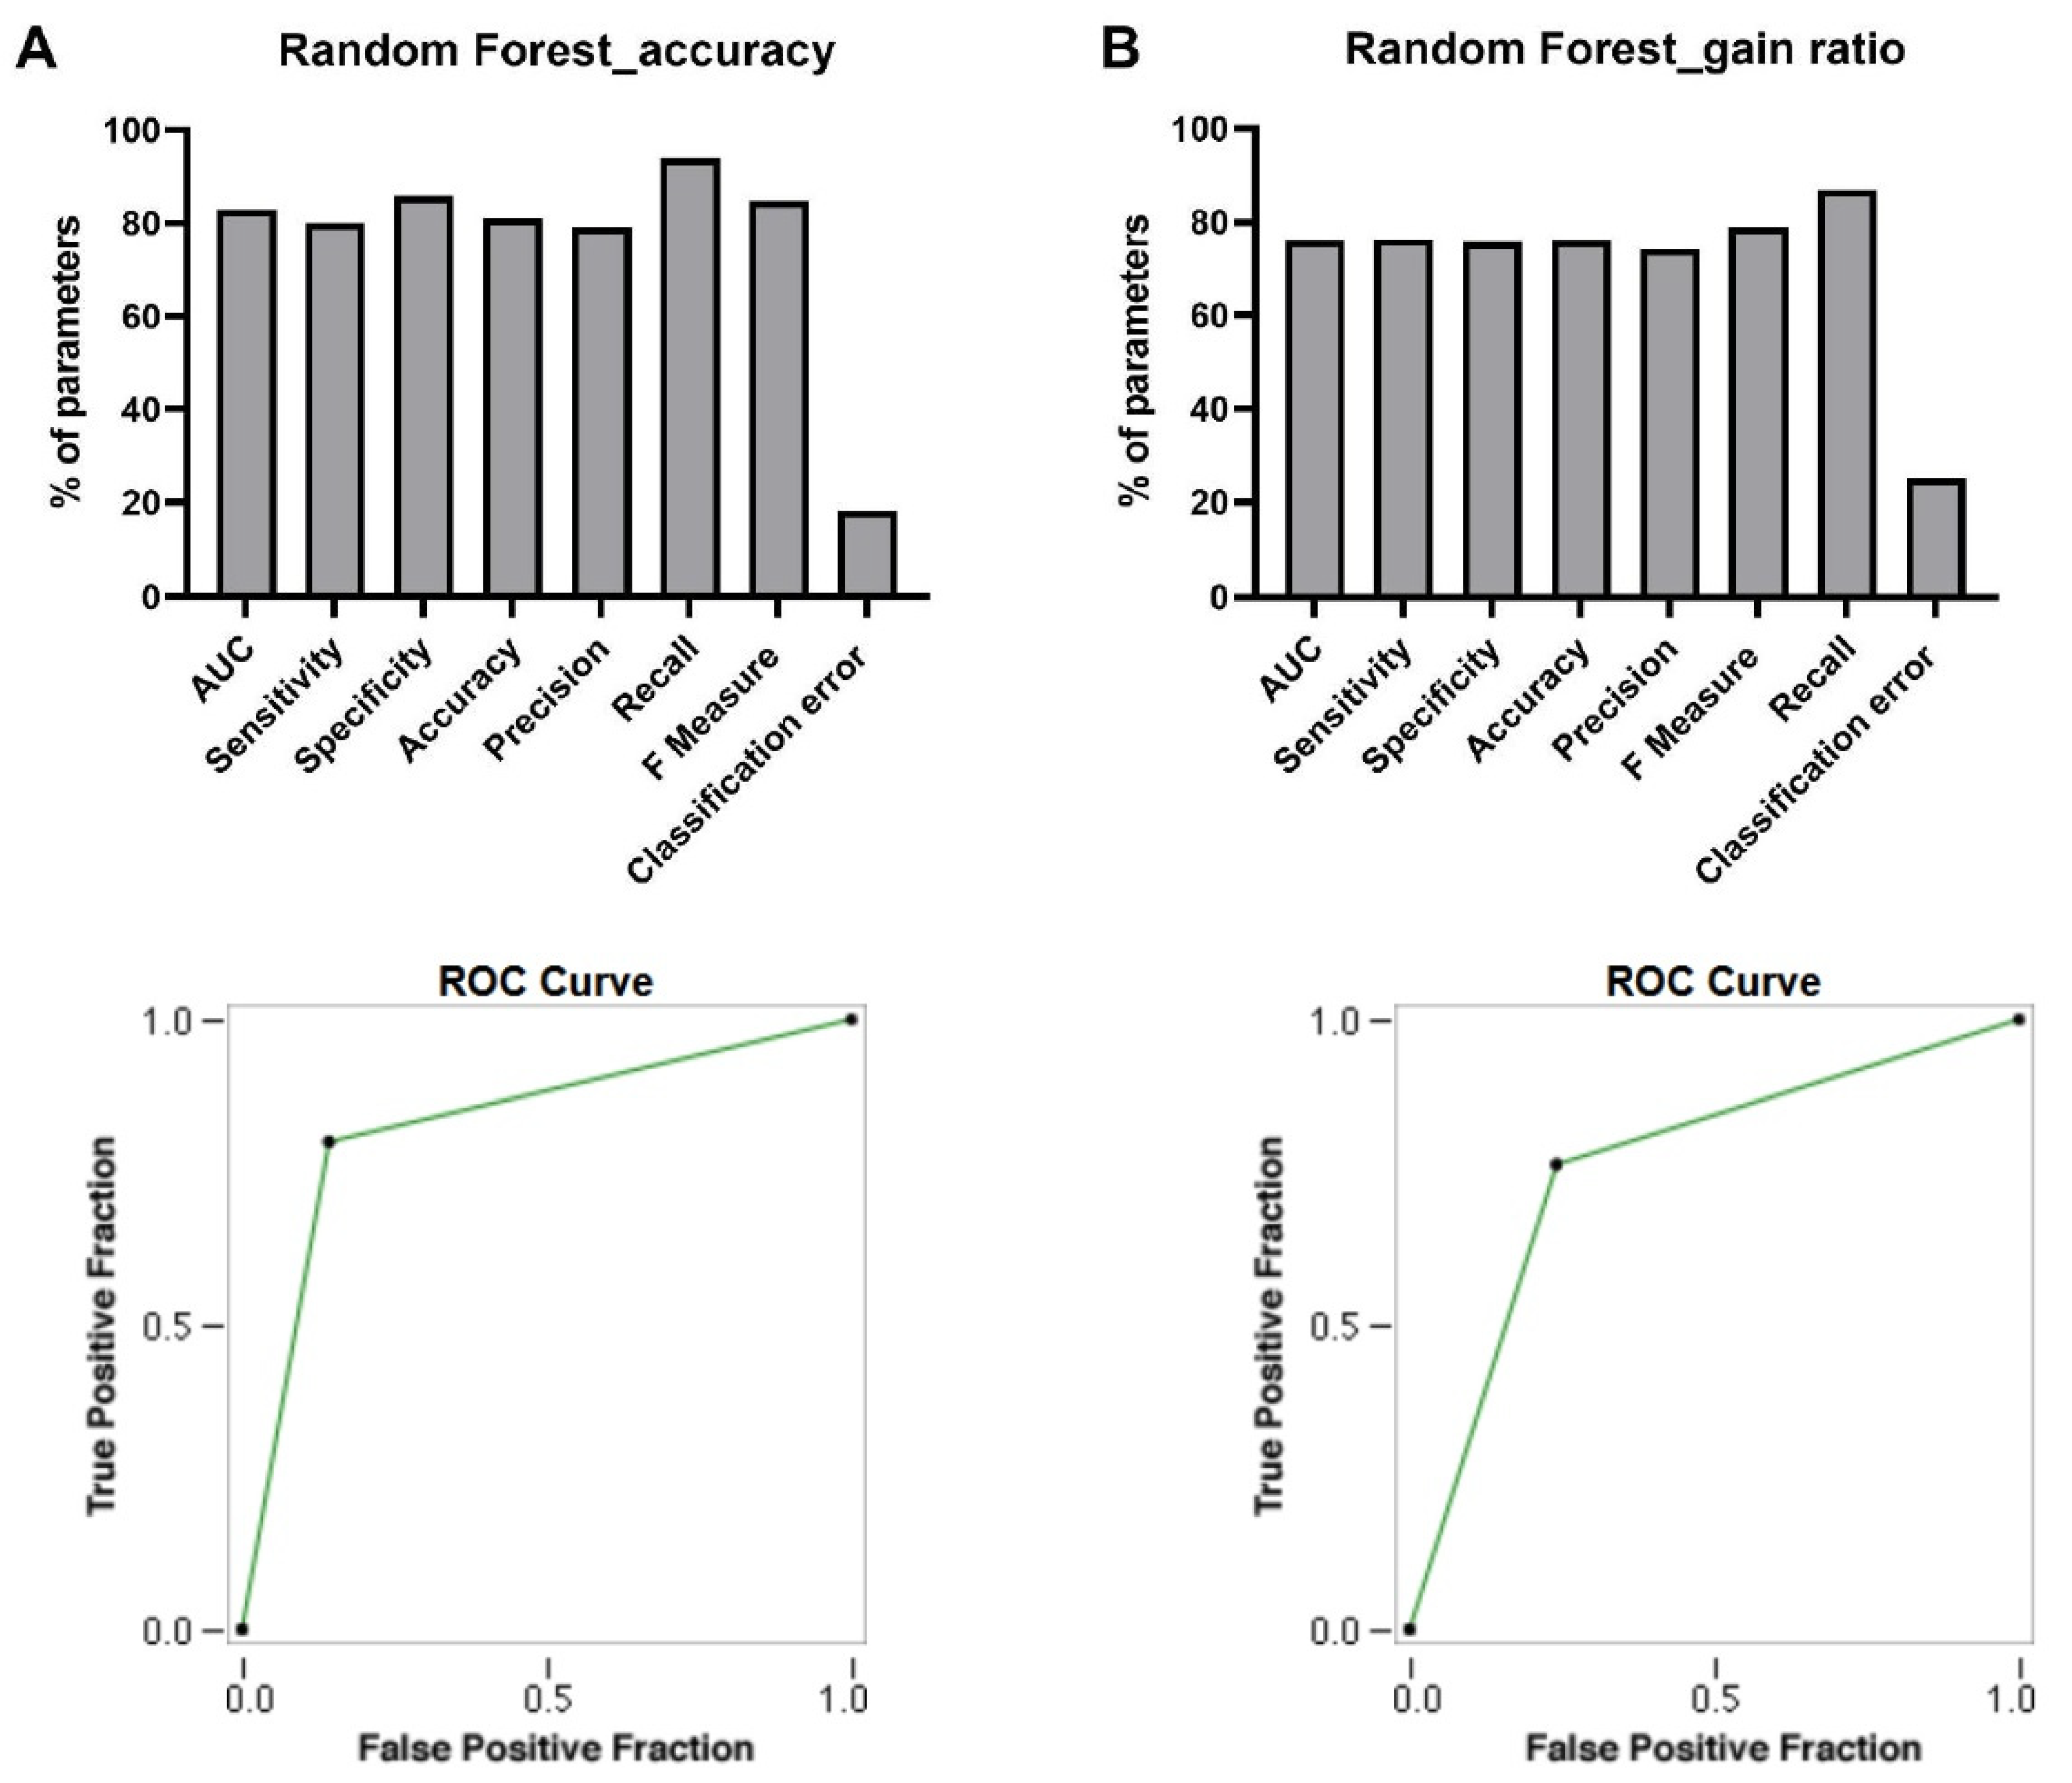
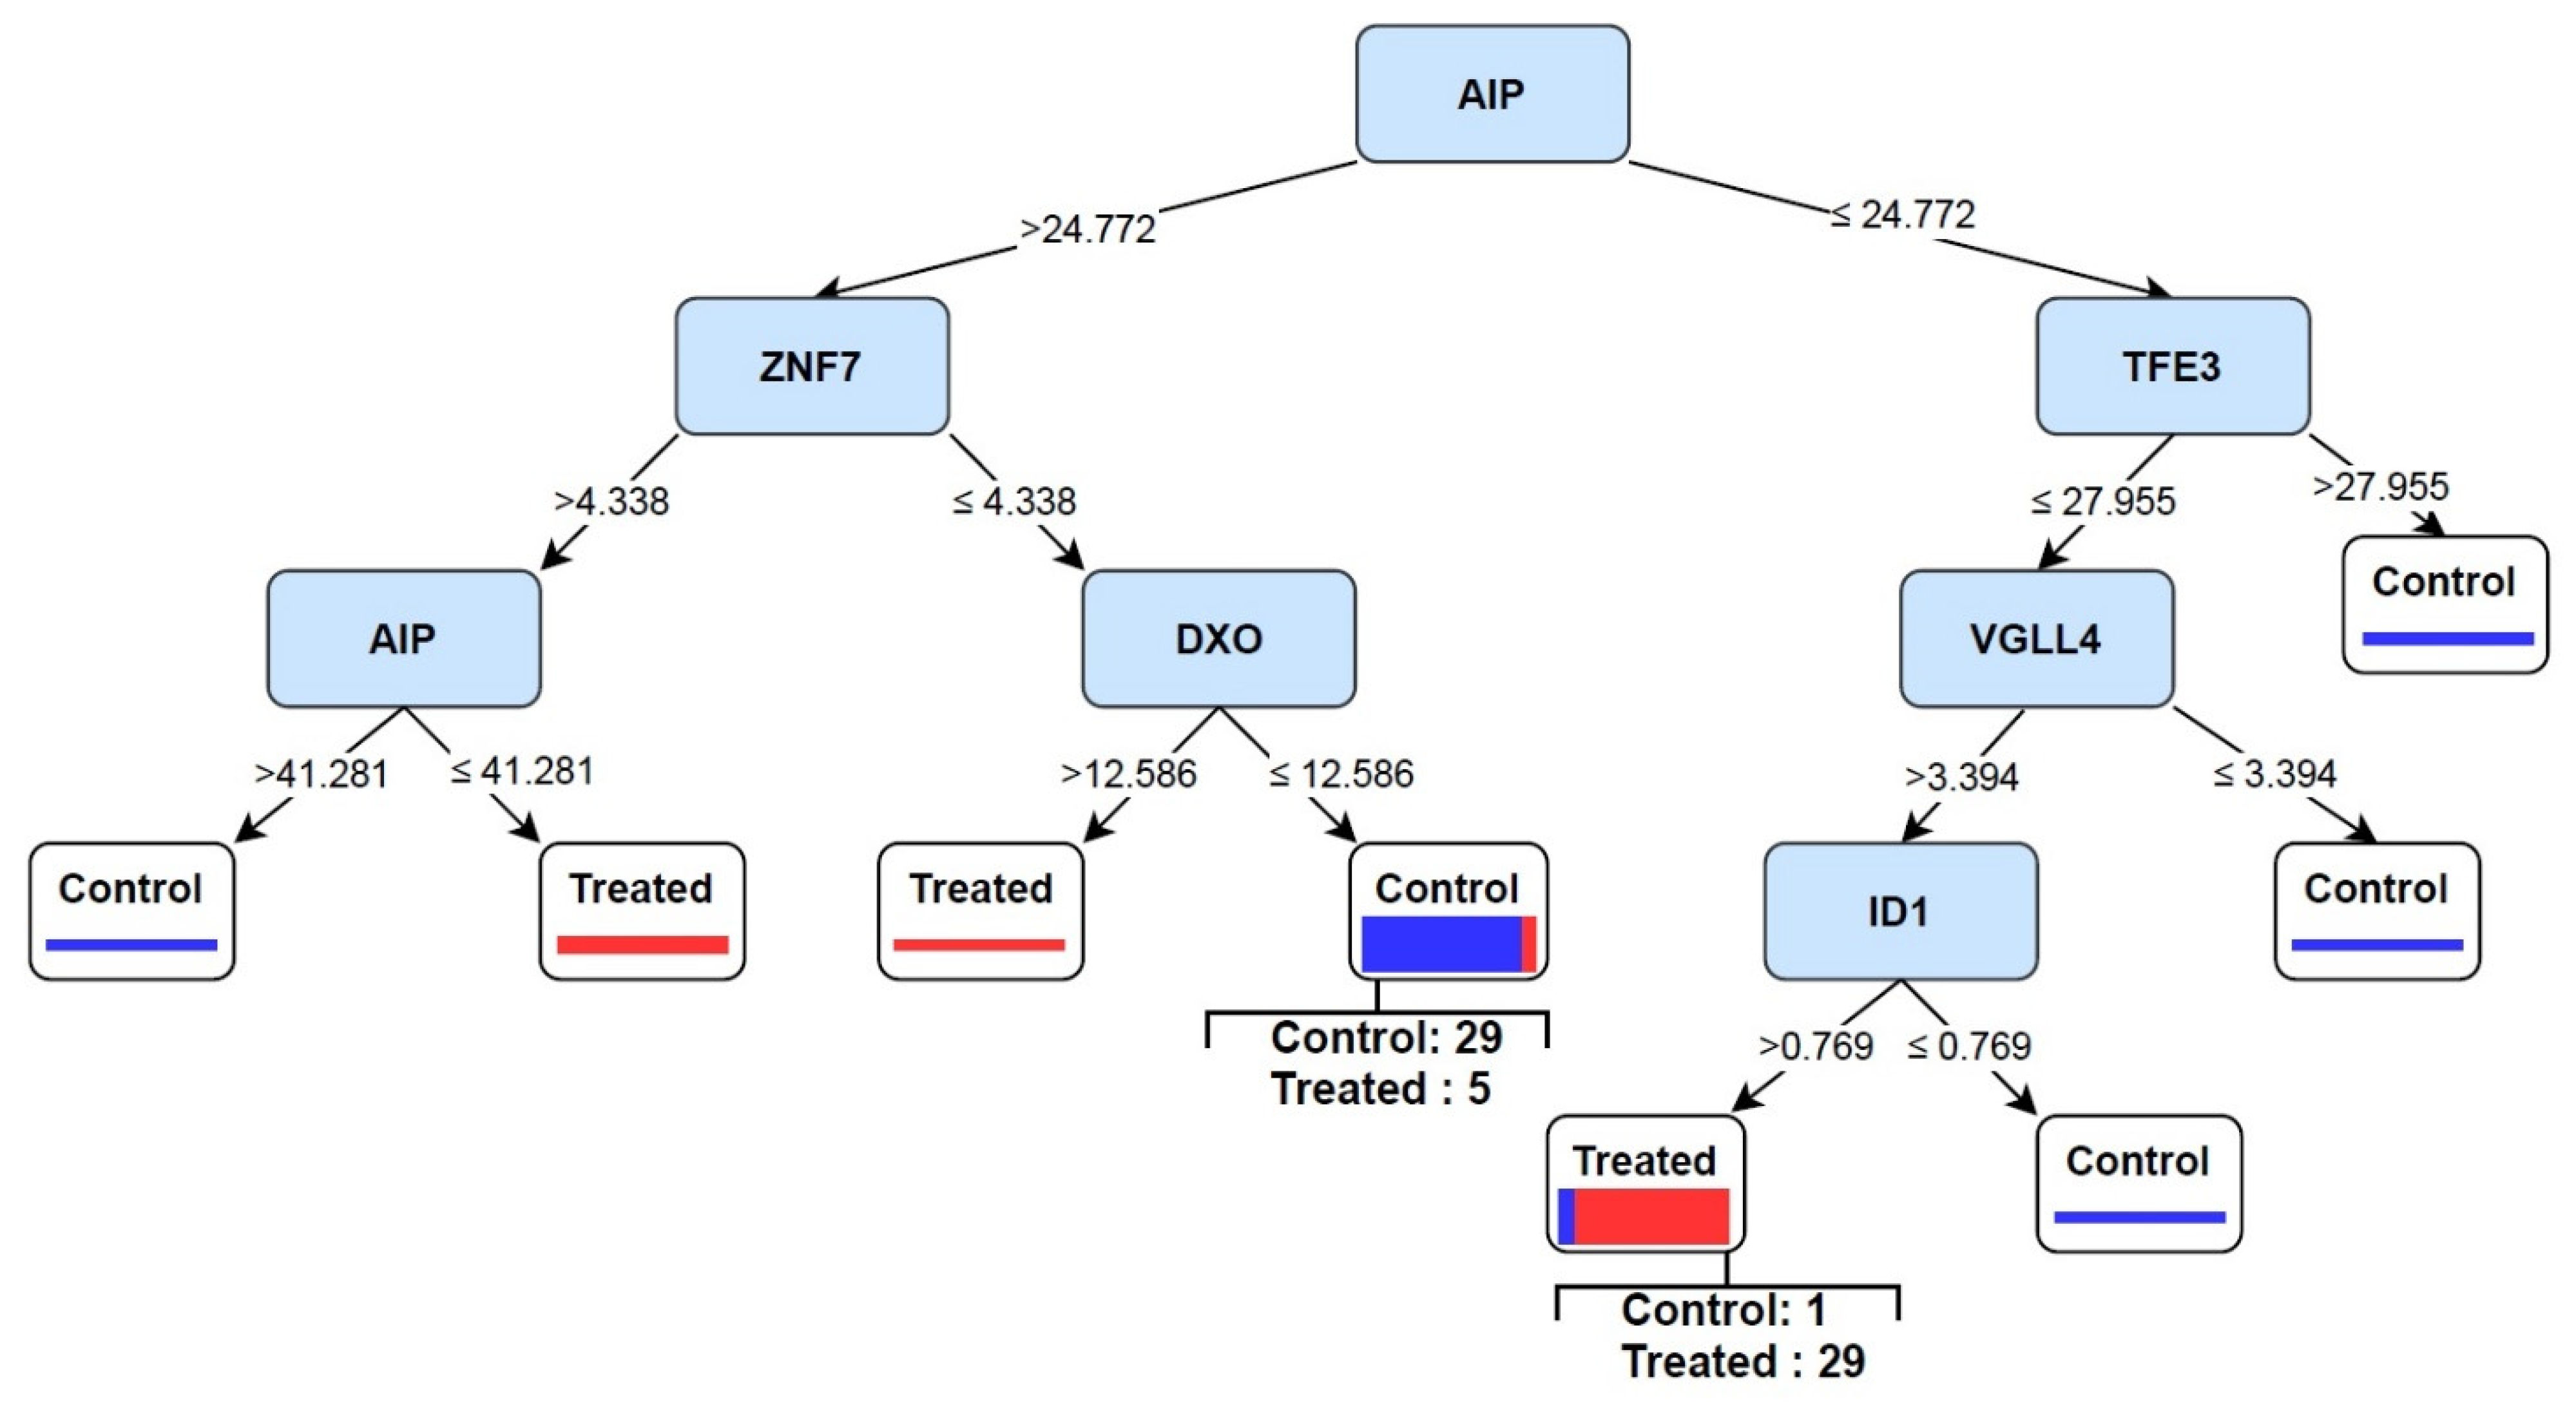
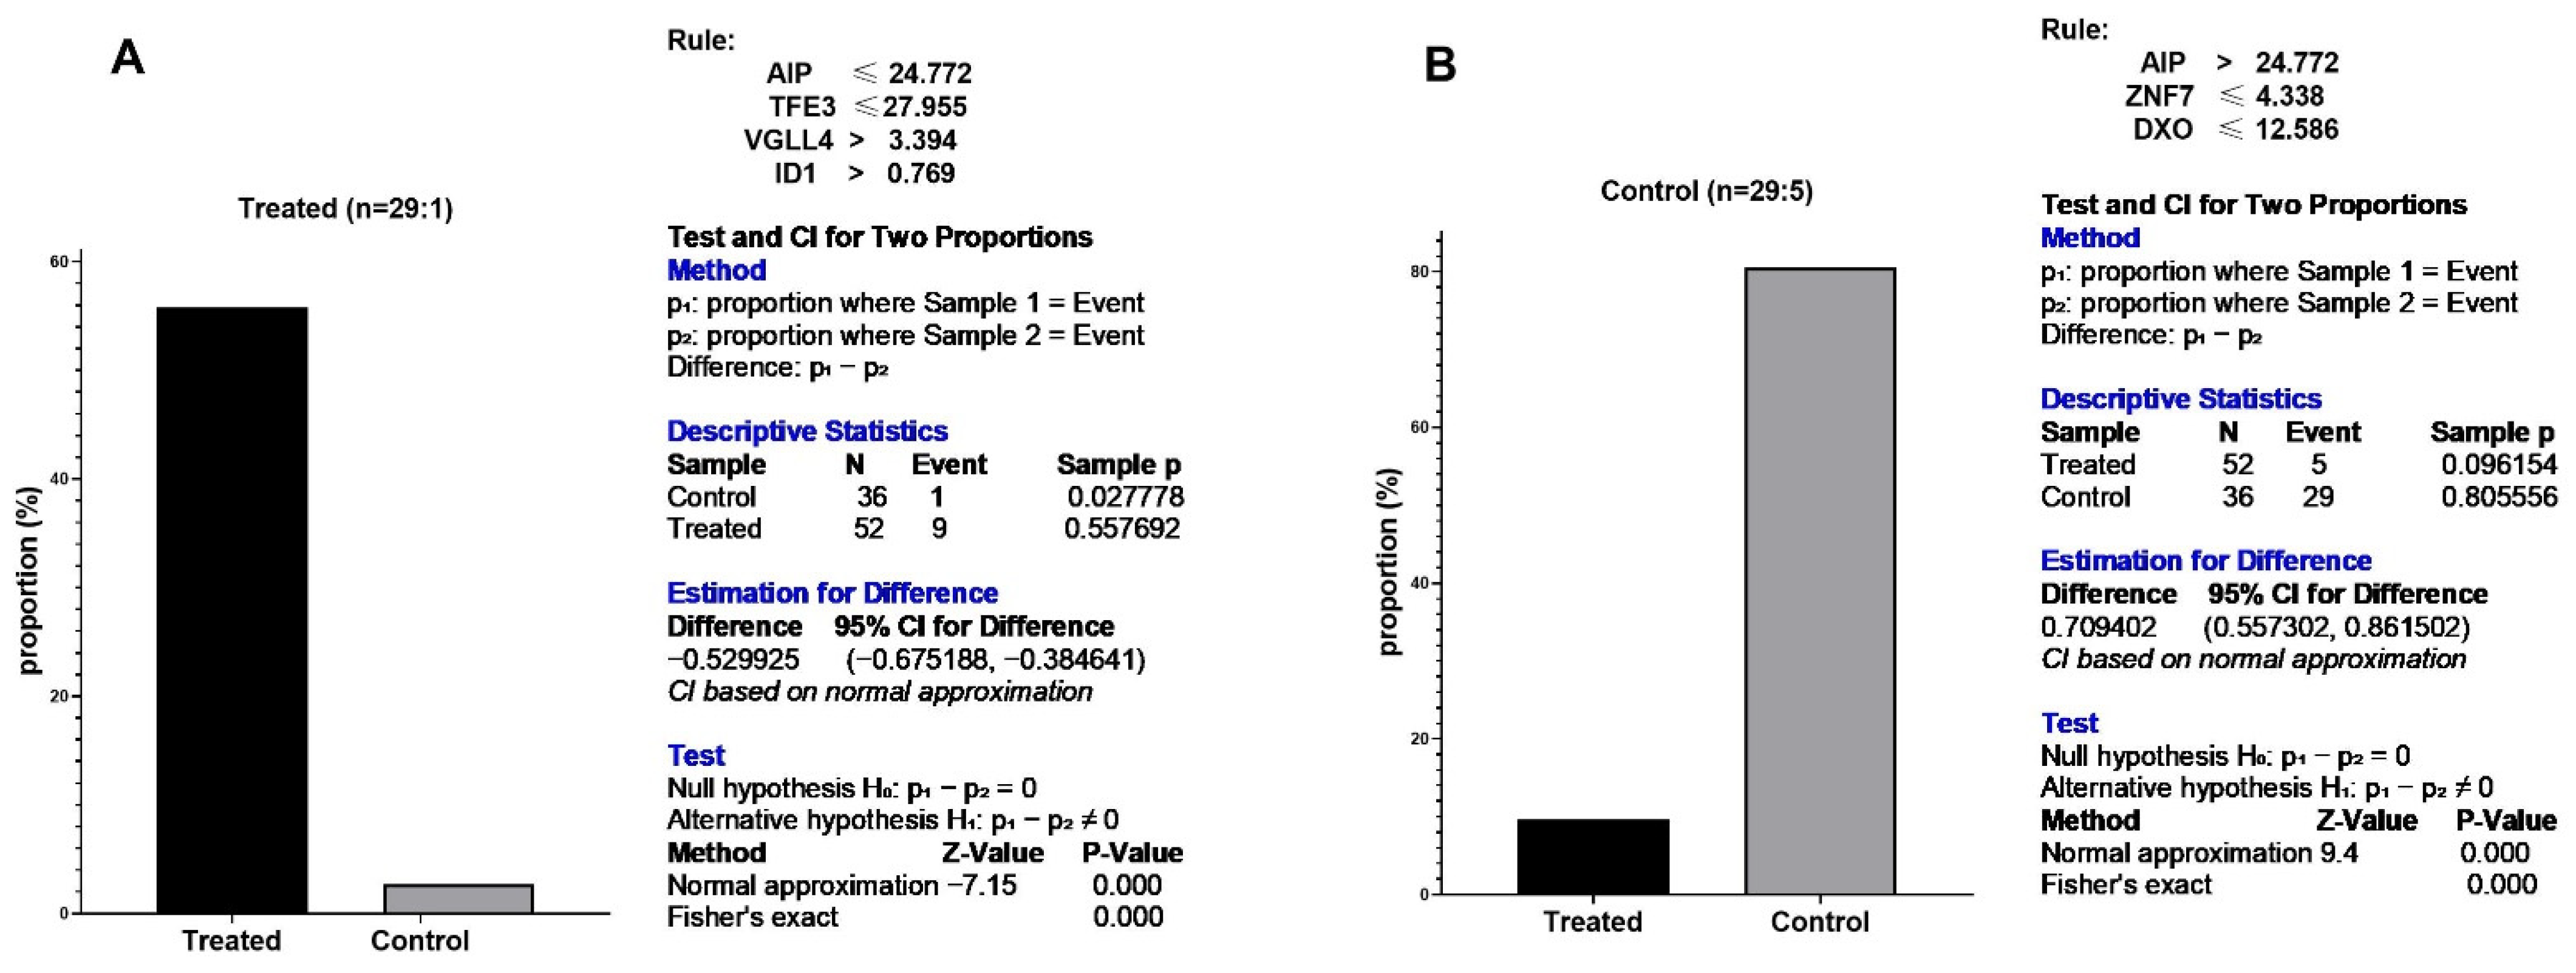
3.4. Discovery of Signature of Herbal Transcription Factors on Cancer Cells by Pattern Discovery
AUC
Sensitivity
Specificity
Accuracy
Precision
Recall
F Measure
Classification Error
ROC
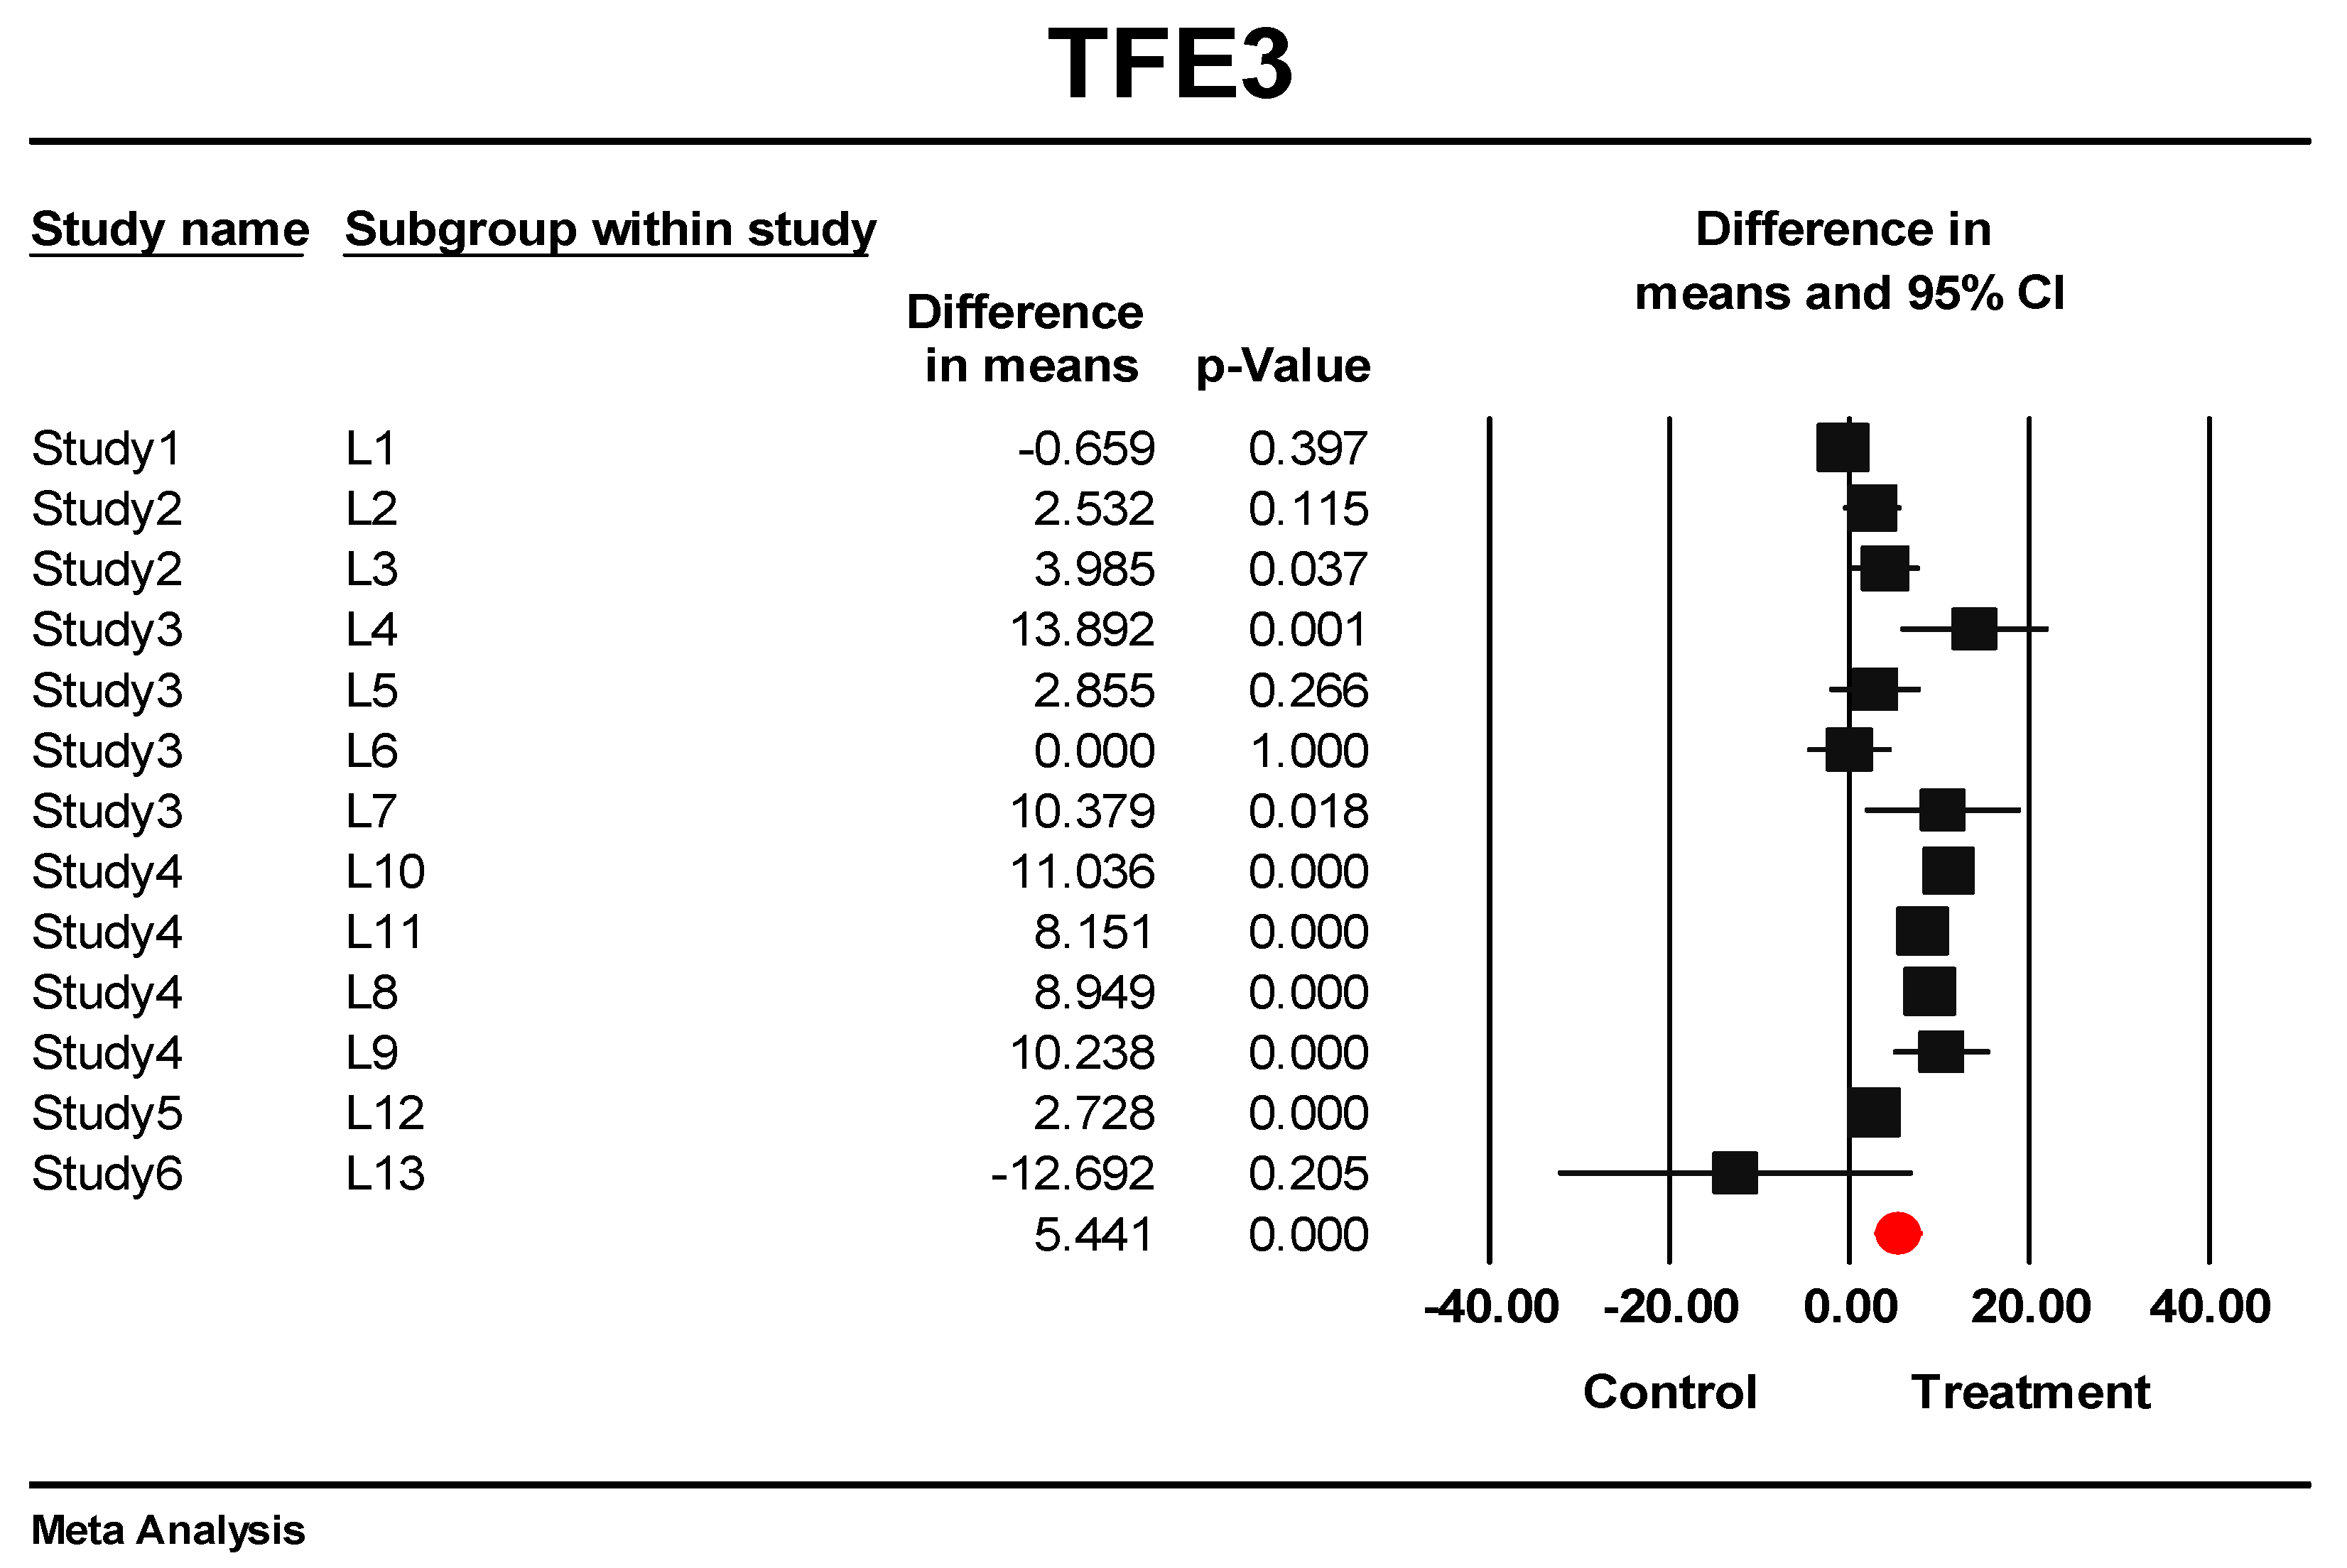
3.5. Predictive Signature Genes between Treated and Control Samples Are Corroborated by Individual Gene Meta-Analysis
3.6. Eternal Validation of AIP, TFE3, VGLL4, and ID1
4. Discussion
5. Conclusions
Supplementary Materials
Author Contributions
Funding
Institutional Review Board Statement
Informed Consent Statement
Data Availability Statement
Acknowledgments
Conflicts of Interest
References
- Yang, X.; Kui, L.; Tang, M.; Li, D.; Wei, K.; Chen, W.; Miao, J.; Dong, Y. High-throughput transcriptome profiling in drug and biomarker discovery. Front. Genet. 2020, 11, 19. [Google Scholar] [CrossRef]
- Mahn, A.; Reyes, A. An overview of health-promoting compounds of broccoli (Brassica oleracea var. italica) and the effect of processing. Food Sci. Technol. Int. 2012, 18, 503–514. [Google Scholar] [CrossRef]
- Cui, W.; Aouidate, A.; Wang, S.; Yu, Q.; Li, Y.; Yuan, S. Discovering anti-cancer drugs via computational methods. Front. Pharmacol. 2020, 11, 733. [Google Scholar] [CrossRef]
- Veeresham, C. Natural products derived from plants as a source of drugs. J. Adv. Pharm. Technol. Res. 2012, 3, 200. [Google Scholar] [CrossRef]
- Gromova, M.; Vaggelas, A.; Dallmann, G.; Seimetz, D. Biomarkers: Opportunities and Challenges for Drug Development in the Current Regulatory Landscape. Biomark. Insights 2020, 15, 1177271920974652. [Google Scholar] [CrossRef]
- Liu, J.; Dong, C.; Jiang, G.; Lu, X.; Liu, Y.; Wu, H. Transcription factor expression as a predictor of colon cancer prognosis: A machine learning practice. BMC Med. Genom. 2020, 13, 1–10. [Google Scholar] [CrossRef]
- Garcia-Alonso, L.; Iorio, F.; Matchan, A.; Fonseca, N.; Jaaks, P.; Peat, G.; Pignatelli, M.; Falcone, F.; Benes, C.H.; Dunham, I.; et al. Transcription factor activities enhance markers of drug sensitivity in cancer. Cancer Res. 2018, 78, 769–780. [Google Scholar] [CrossRef] [Green Version]
- Saeidnia, S.; Abdollahi, M. Antioxidants: Friends or foe in prevention or treatment of cancer: The debate of the century. Toxicol. Appl. Pharmacol. 2013, 271, 49–63. [Google Scholar] [CrossRef]
- Hanson, C.; Cairnset, J.; Wang, L.; Sinha, S. Computational discovery of transcription factors associated with drug response. Pharmacogenom. J. 2016, 16, 573–582. [Google Scholar] [CrossRef]
- Kaur, M.; MacPherson, C.R.; Schmeier, S.; Narasimhan, K.; Choolani, M.; Bajic, V.B. In Silico discovery of transcription factors as potential diagnostic biomarkers of ovarian cancer. BMC Syst. Biol. 2011, 5, 1–13. [Google Scholar] [CrossRef] [Green Version]
- Vishnoi, K.; Viswakarma, N.; Rana, A.; Rana, B. Transcription Factors in Cancer Development and Therapy. Cancers 2020, 12, 2296. [Google Scholar] [CrossRef]
- Aubrey, B.J.; Kelly, G.L.; Janic, A.; Herold, M.J.; Strasser, A. How does p53 induce apoptosis and how does this relate to p53-mediated tumour suppression? Cell Death Differ. 2018, 25, 104–113. [Google Scholar] [CrossRef] [Green Version]
- Shanmugam, M.K.; Lee, J.H.; Chai, E.Z.P.; Kanchi, M.M.; Kar, S.; Arfuso, F.; Dharmarajan, A.; Kumar, A.P.; Ramar, P.S.; Looi, C.Y.; et al. Cancer prevention and therapy through the modulation of transcription factors by bioactive natural compounds. Semin. Cancer Biol. 2016, 40–41, 35–47. [Google Scholar] [CrossRef]
- Adam, G.; Rampášek, L.; Safikhani, Z.; Smirnov, P.; Haibe-Kains, B.; Goldenberg, A. Machine learning approaches to drug response prediction: Challenges and recent progress. NPJ Precis. Oncol. 2020, 4, 1–10. [Google Scholar] [CrossRef]
- Matthews, H.; Hanison, J.; Nirmalan, N. “Omics”-informed drug and biomarker discovery: Opportunities, challenges and future perspectives. Proteomes 2016, 4, 28. [Google Scholar] [CrossRef] [Green Version]
- Paananen, J.; Fortino, V. An omics perspective on drug target discovery platforms. Brief. Bioinform. 2020, 21, 1937–1953. [Google Scholar] [CrossRef] [Green Version]
- Farhadian, M.; Rafat, S.A.; Hasanpur, K.; Ebrahimi, M.; Ebrahimie, E. Cross-species meta-analysis of transcriptomic data in combination with supervised machine learning models identifies the common gene signature of lactation process. Front. Genet. 2018, 9, 235. [Google Scholar] [CrossRef]
- Sharifi, S.; Pakdel, A.; Ebrahimi, M.; Reecy, J.M.; Fazeli Farsani, S.; Ebrahimie, E. Integration of machine learning and meta-analysis identifies the transcriptomic bio-signature of mastitis disease in cattle. PLoS ONE 2018, 13, e0191227. [Google Scholar] [CrossRef] [Green Version]
- Réda, C.; Kaufmann, E.; Delahaye-Duriez, A. Machine learning applications in drug development. Comput. Struct. Biotechnol. J. 2020, 18, 241–252. [Google Scholar] [CrossRef]
- Ebrahimie, E.; Ebrahimi, F.; Ebrahimi, M.; Tomlinson, S.; Petrovski, K.R. Hierarchical pattern recognition in milking parameters predicts mastitis prevalence. Comput. Electron. Agric. 2018, 147, 6–11. [Google Scholar] [CrossRef]
- Bhamare, D.; Suryawanshi, P. Review on reliable pattern recognition with machine learning techniques. Fuzzy Inf. Eng. 2018, 10, 362–377. [Google Scholar] [CrossRef] [Green Version]
- Mohammadi-Dehcheshmeh, M.; Niazi, A.; Ebrahimi, M.; Tahsili, M.; Nurollah, Z.; Ebrahimi Khaksefid, R.; Ebrahimi, M.; Ebrahimie, E. Unified transcriptomic signature of arbuscular mycorrhiza colonization in roots of Medicago truncatula by integration of machine learning, promoter analysis, and direct merging meta-analysis. Front. Plant Sci. 2018, 9, 1550. [Google Scholar] [CrossRef] [PubMed] [Green Version]
- Ebrahimi, M.; Aghagolzadeh, P.; Shamabadi, N.; Tahmasebi, A.; Alsharifi, M.; Adelson, D.L.; Hemmatzadeh, F.; Ebrahimie, E. Understanding the underlying mechanism of HA-subtyping in the level of physic-chemical characteristics of protein. PLoS ONE 2014, 9, e96984. [Google Scholar] [CrossRef] [PubMed] [Green Version]
- Ebrahimi, M.; Mohammadi-Dehcheshmeh, M.; Ebrahimie, E.; Petrovski, K.R. Comprehensive analysis of machine learning models for prediction of sub-clinical mastitis: Deep Learning and Gradient-Boosted Trees outperform other models. Comput. Biol. Med. 2019, 114, 103456. [Google Scholar] [CrossRef]
- Chen, L.-J.; Hsu, T.-C.; Yeh, P.-J.; Yow, J.L.; Chang, C.-L.; Lin, C.-H.; Tzang, B.-S. Differential Effects of Wedelia chinensis on Human Glioblastoma Multiforme Cells. Integr. Cancer Ther. 2021, 20, 15347354211000119. [Google Scholar] [CrossRef] [PubMed]
- Leone, A.; Longo, C.; Gerardi, C.; Trosko, J.E. Pro-apoptotic effect of grape seed extract on MCF-7 involves transient increase of gap junction intercellular communication and Cx43 up-regulation: A mechanism of chemoprevention. Int. J. Mol. Sci. 2019, 20, 3244. [Google Scholar] [CrossRef] [Green Version]
- Toden, S.; Ravindranathan, P.; Gu, J.; Cardenas, J.; Yuchang, M.; Goel, A. Oligomeric proanthocyanidins (OPCs) target cancer stem-like cells and suppress tumor organoid formation in colorectal cancer. Sci. Rep. 2018, 8, 1–13. [Google Scholar]
- Beaver, L.M.; Buchanan, A.; Sokolowski, E.I.; Riscoe, A.N.; Wong, C.P.; Chang, J.H.; Löhr, C.V.; Williams, D.E.; Dashwood, R.H.; Ho, E. Transcriptome analysis reveals a dynamic and differential transcriptional response to sulforaphane in normal and prostate cancer cells and suggests a role for Sp1 in chemoprevention. Mol. Nutr. Food Res. 2014, 58, 2001–2013. [Google Scholar] [CrossRef] [PubMed] [Green Version]
- Uddin, M.S.; Al Mamun, A.; Jakaria, M.; Thangapandiyan, S.; Ahmad, J.; Rahman, M.A.; Mathew, B.; Abdel-Daim, M.M.; Aleya, L. Emerging promise of sulforaphane-mediated Nrf2 signaling cascade against neurological disorders. Sci. Total Environ. 2020, 707, 135624. [Google Scholar] [CrossRef]
- Lin, K.-H.; Huang, M.-Y.; Cheng, W.-C.; Wang, S.-C.; Fang, S.-H.; Tu, H.-P.; Su, C.-C.; Hung, Y.-L.; Liu, P.-L.; Chen, C.-S.; et al. RNA-seq transcriptome analysis of breast cancer cell lines under shikonin treatment. Sci. Rep. 2018, 8, 1–11. [Google Scholar] [CrossRef] [PubMed] [Green Version]
- Qu, Z.; Cui, J.; Harata-Lee, Y.; Aung, T.N.; Feng, Q.; Raison, J.M.; Kortschak, R.D.; Adelson, D.L. Identification of candidate anti-cancer molecular mechanisms of compound kushen injection using functional genomics. Oncotarget 2016, 7, 66003–66019. [Google Scholar] [CrossRef] [Green Version]
- Lu, J.; Chen, J.; Kang, Y.; Wu, J.; Shi, H.; Fu, Y.; Jiao, L.; Dong, C.; Li, X.; Jin, Y.; et al. Jinfukang induces cellular apoptosis through activation of Fas and DR4 in A549 cells. Oncol. Lett. 2018, 16, 4343–4352. [Google Scholar] [CrossRef] [PubMed] [Green Version]
- Tsuyuzaki, K.; Nikaido, I. metaSeq: Meta-analysis of RNA-seq count data. Tokyo Univ. Sci. Tokyo. 2013. Available online: https://www.bioconductor.org/packages/devel/bioc/vignettes/metaSeq/inst/doc/metaSeq.pdf (accessed on 10 June 2020).
- Begg, C.B.; Mazumdar, M. Operating characteristics of a rank correlation test for publication bias. Biometrics 1994, 50, 1088–1101. [Google Scholar] [CrossRef]
- Harbord, R.M.; Egger, M.; Sterne, J.A. A modified test for small-study effects in meta-analyses of controlled trials with binary endpoints. Stat. Med. 2006, 25, 3443–3457. [Google Scholar] [CrossRef] [PubMed]
- Zhen, A.W.; Nguyen, N.H.; Gibert, Y.; Motola, S.; Buckett, P.; Wessling-Resnick, M.; Fraenkel, E.; Fraenkel, P.G. The small molecule, genistein, increases hepcidin expression in human hepatocytes. Hepatology 2013, 58, 1315–1325. [Google Scholar] [CrossRef] [Green Version]
- Zhou, P.; Wang, C.; Hu, Z.; Chen, W.; Qi, W.; Li, A. Genistein induces apoptosis of colon cancer cells by reversal of epithelial-to-mesenchymal via a Notch1/NF-κB/slug/E-cadherin pathway. BMC Cancer 2017, 17, 1–10. [Google Scholar] [CrossRef] [PubMed]
- Verbist, B.; Klambauer, G.; Vervoort, L.; Talloen, W.; Shkedy, Z.; Thas, O.; Bender, A.; Göhlmann, H.W.; Hochreiter, S.; Consortium, Q. Using transcriptomics to guide lead optimization in drug discovery projects: Lessons learned from the QSTAR project. Drug Discov. Today 2015, 20, 505–513. [Google Scholar] [CrossRef] [PubMed] [Green Version]
- Panahi, B.; Frahadian, M.; Dums, J.T.; Hejazi, M.A. Integration of cross species RNA-Seq meta-analysis and machine-learning models identifies the most important salt stress–responsive pathways in microalga Dunaliella. Front. Genet. 2019, 10, 752. [Google Scholar] [CrossRef] [Green Version]
- Sarica, A.; Cerasa, A.; Quattrone, A. Random forest algorithm for the classification of neuroimaging data in Alzheimer’s disease: A systematic review. Front. Aging Neurosci. 2017, 9, 329. [Google Scholar] [CrossRef]
- Parmar, A.; Katariya, R.; Patel, V. A review on random forest: An ensemble classifier. In Proceedings of the International Conference on Intelligent Data Communication Technologies and Internet of Things, Coimbatore, India, 7–8 August 2017; pp. 758–763. [Google Scholar]
- Raitila, A.; Lehtonen, H.J.; Arola, J.; Heliövaara, E.; Ahlsten, M.; Georgitsi, M.; Jalanko, A.; Paetau, A.; Aaltonen, L.A.; Karhu, A. Mice with inactivation of aryl hydrocarbon receptor-interacting protein (Aip) display complete penetrance of pituitary adenomas with aberrant ARNT expression. Am. J. Pathol. 2010, 177, 1969–1976. [Google Scholar] [CrossRef]
- Schernthaner-Reiter, M.H.; Trivellin, G.; Stratakis, C.A. Interaction of AIP with protein kinase A (cAMP-dependent protein kinase). Hum. Mol. Genet. 2018, 27, 2604–2613. [Google Scholar] [CrossRef] [Green Version]
- Formosa, R.; Xuereb-Anastasi, A.; Vassallo, J. Aip regulates cAMP signalling and GH secretion in GH3 cells. Endocr.-Relat. Cancer 2013, 20, 495–505. [Google Scholar] [CrossRef] [Green Version]
- Bolger, G.B.; Peden, A.H.; Steele, M.R.; MacKenzie, C.; McEwan, D.G.; Wallace, D.A.; Huston, E.; Baillie, G.S.; Houslay, M.D. Attenuation of the activity of the cAMP-specific phosphodiesterase PDE4A5 by interaction with the immunophilin XAP2. J. Biol. Chem. 2003, 278, 33351–33363. [Google Scholar] [CrossRef] [Green Version]
- Goldblum, J.R.; Weiss, S.W.; Folpe, A.L. Enzinger and Weiss’s Soft Tissue Tumors E-Book; Elsevier Health Sciences: Amsterdam, The Netherlands, 2013. [Google Scholar]
- Martina, J.A.; Diab, H.I.; Lishu, L.; Patange, S.; Raben, N.; Puertollano, R. The nutrient-responsive transcription factor TFE3 promotes autophagy, lysosomal biogenesis, and clearance of cellular debris. Sci. Signal. 2014, 7, ra9. [Google Scholar] [CrossRef] [PubMed] [Green Version]
- Brady, O.A.; Jeong, E.; Martina, J.A.; Pirooznia, M.; Tunc, I.; Puertollano, R. The transcription factors TFE3 and TFEB amplify p53 dependent transcriptional programs in response to DNA damage. eLife 2018, 7, e40856. [Google Scholar] [PubMed]
- Deng, X.; Fang, L. VGLL4 is a transcriptional cofactor acting as a novel tumor suppressor via interacting with TEADs. Am. J. Cancer Res. 2018, 8, 932. [Google Scholar]
- Jiang, W.; Yao, F.; He, J.; Lv, B.; Fang, W.; Zhu, W.; He, G.; Chen, J.; He, J. Downregulation of VGLL4 in the progression of esophageal squamous cell carcinoma. Tumor Biol. 2015, 36, 1289–1297. [Google Scholar] [CrossRef]
- Jiao, S.; Li, C.; Hao, Q.; Miao, H.; Zhang, L.; Li, L.; Zhou, Z. VGLL4 targets a TCF4–TEAD4 complex to coregulate Wnt and Hippo signalling in colorectal cancer. Nat. Commun. 2017, 8, 14058. [Google Scholar] [CrossRef] [Green Version]
- Li, H.; Wang, Z.; Zhang, W.; Qian, K.; Liao, G.; Xu, W.; Zhang, S. VGLL4 inhibits EMT in part through suppressing Wnt/β-catenin signaling pathway in gastric cancer. Med. Oncol. 2015, 32, 83. [Google Scholar] [CrossRef]
- Liu, X.; Kong, C.; Zhang, Z. miR-130b promotes bladder cancer cell proliferation, migration and invasion by targeting VGLL4. Oncol. Rep. 2018, 39, 2324–2332. [Google Scholar] [CrossRef] [PubMed]
- Mann, K.M.; Ward, J.M.; Yew, C.C.K.; Kovochich, A.; Dawson, D.W.; Black, M.A.; Brett, B.T.; Sheetz, T.E.; Dupuy, A.J.; Chang, D.K.; et al. Sleeping Beauty mutagenesis reveals cooperating mutations and pathways in pancreatic adenocarcinoma. Proc. Natl. Acad. Sci. USA 2012, 109, 5934–5941. [Google Scholar] [CrossRef] [Green Version]
- Shivakumar, M.; Lee, Y.; Bang, L.; Garg, T.; Sohn, K.-A.; Kim, D. Identification of epigenetic interactions between miRNA and DNA methylation associated with gene expression as potential prognostic markers in bladder cancer. BMC Med. Genom. 2017, 10, 65–75. [Google Scholar] [CrossRef] [PubMed] [Green Version]
- Zhang, W.; Gao, Y.; Li, P.; Shi, Z.; Guo, T.; Li, F.; Han, X.; Feng, Y.; Zheng, C.; Wang, Z. VGLL4 functions as a new tumor suppressor in lung cancer by negatively regulating the YAP-TEAD transcriptional complex. Cell Res. 2014, 24, 331–343. [Google Scholar] [CrossRef] [PubMed] [Green Version]
- Huang, J.; Wu, S.; Barrera, J.; Matthews, K.; Pan, D. The Hippo signaling pathway coordinately regulates cell proliferation and apoptosis by inactivating Yorkie, the Drosophila Homolog of YAP. Cell 2005, 122, 421–434. [Google Scholar] [CrossRef] [Green Version]
- Tan, H.-Y.; Wang, N.; Chan, Y.-T.; Zhang, C.; Guo, W.; Chen, F.; Zhong, Z.; Li, S.; Feng, Y. ID1 overexpression increases gefitinib sensitivity in non-small cell lung cancer by activating RIP3/MLKL-dependent necroptosis. Cancer Lett. 2020, 475, 109–118. [Google Scholar] [CrossRef] [PubMed]
- Yamaguchi, N.; Yamaguchi, N. The seventh zinc finger motif of A20 is required for the suppression of TNF-α-induced apoptosis. FEBS Lett. 2015, 589, 1369–1375. [Google Scholar] [CrossRef] [Green Version]
- Lu, B.-S.; Yin, Y.-W.; Zhang, Y.-P.; Guo, P.-Y.; Li, W.; Liu, K.-L. Upregulation of NPL4 promotes bladder cancer cell proliferation by inhibiting DXO destabilization of cyclin D1 mRNA. Cancer Cell Int. 2019, 19, 1–11. [Google Scholar] [CrossRef] [Green Version]
- Jiang, H.; Wong, W.H. Statistical inferences for isoform expression in RNA-Seq. Bioinformatics 2009, 25, 1026–1032. [Google Scholar] [CrossRef] [Green Version]


| Study | Reference | Accession of Experiment | No. of Arrays (Control: Treatment) | Organism | Cell Line(s) | Herbal Treatment | Incubation Time | Dose of Compound | Platform |
|---|---|---|---|---|---|---|---|---|---|
| 1 | PMC:5688072 | GSE99820 | 6 (3:3) | Homo sapiens | PCa | Wedelia chinensis extract (WCE) | 10 weeks | 10 mg/mL/kg | Illumina HiScanSQ |
| 2 | PMID: 29463813 | GSE109607 | 30 (10:20) | Homo sapiens | HCT116, SW480, SW620, HT29, RKO | Oligomeric proanthocyanidins (OPC) Grape seed extract (GSE) | 18 h | 100 ng/µL | Illumina HiSeq 2500 |
| 3 | PMID: 27602759 | GSE78512 | 24 (12:12) | Homo sapiens | MCF-7 | Compound Kushen Injection (CKI) | 24 and 48 h | 1 mg/mL and 2 mg/mL | Illumina HiSeq 2500 (Homo sapiens) |
| 4 | PMID: 25044704 | GSE48812 | 36 (12:24) | Homo sapiens | LNCaP, PC3 | Sulforaphane (SFN) | 6 and 24 h | 15 μM | Illumina HiSeq 2000 |
| 5 | PMID: 28771580 | ENA-ERP010522 | 4 (2:2) | Homo sapiens | A549 | Jinfukang (JFK) | 48 h | 30 μg/mL | Illumina HiSeq 2000 |
| 6 | PMID:29422643 | GSE100687 | 6 (3:3) | Homo sapiens | MCF-7, SK-BR-3, MDA-MB-231 | shikonin | 6 h | 10 μM | Illumina HiSeq 2500 |
| No. of Levels | Study | Cell Line | Extract | Time | Concentration |
|---|---|---|---|---|---|
| 1 | 1 | PCa | Wedelia Chinensis Extract (WCE) | 10 weeks | 10 mg/mL/kg |
| 2 | 2 | HCT116, HT29,RKO, SW480, SW620 | Grape Seed Extract (GSE) | 18 h | 100 ng/µL |
| 3 | 2 | HCT116, HT29, RKO, SW480,SW620 | Oligomeric Proanthocyanidins (OPC) | 18 h | 100 ng/µL |
| 4 | 3 | MCF-7 | Compound Kushen Injection (CKI) | 24 h and 48 h | 1 mg/mL |
| 5 | 3 | MCF-7 | Compound Kushen Injection (CKI) | 24 h and 48 h | 2 mg/mL |
| 6 | 3 | MCF-7 | Compound Kushen Injection (CKI) | 24 h | 1 and 2 mg/mL |
| 7 | 3 | MCF-7 | Compound Kushen Injection (CKI) | 48 h | 1 and 2 mg/mL |
| 8 | PC-3 | Sulforaphane (SFN) | 6 h and 24 h | 15 µM | |
| 9 | 4 | LNCAP | Sulforaphane (SFN) | 6 h and 24 h | 15 µM |
| 10 | 4 | PC3, LNCAP | Sulforaphane (SFN) | 6 h | 15 µM |
| 11 | 4 | PC3, LNCAP | Sulforaphane (SFN) | 24 h | 15 µM |
| 12 | 5 | A549 | Jinfukang (JFK) | 48 h | 30 µg/mL |
| 13 | 6 | MCF-7, SK-BR-3, MBDA-MB-231 | Shikonin | 6 h | 10 µM |
| Begg and Mazumdar Rank Correlation | Egger’s Regression Intercept | |||||||
|---|---|---|---|---|---|---|---|---|
| TFs | Tau | z-Value for Tau | p-Value (1 Tailed) | p-Value (2-Tailed) | Intercept | Standard Error | p-Value (1-Tailed) | p-Value (2-Tailed) |
| AIP | 0.25641 | 1.22018 | 0.11120 | 0.22240 | −1.81915 | 1.72920 | 0.15766 | 0.31533 |
| TFE3 | 0.02546 | 0.12202 | 0.45144 | 0.90288 | 1.30813 | 1.64424 | 0.22155 | 0.44311 |
| VGLL4 | 0.10256 | 0.48807 | 0.31275 | 0.62550 | 1.6753 | 1.15997 | 0.16790 | 0.33579 |
| ID1 | 0.28205 | 1.34220 | 0.08997 | 0.17953 | −170452 | 0.98115 | 0.055511 | 0.11022 |
| GeneID | logFC | logCPM | F | p-Value | FDR |
|---|---|---|---|---|---|
| AIP | 2.761854 | 6.441737 | 53.73853 | 2.31 × 10⁻¹³ | 1.08 × 10⁻¹¹ |
| VGLL4 | 0.868611 | 3.701739 | 5.621917 | 0.017739 | 0.065989 |
| TFE3 | 1.695222 | 5.920831 | 22.33107 | 2.30 × 10⁻⁶ | 2.46 × 10⁻⁵ |
| ID1 | 2.212446 | 7.433711 | 33.69819 | 6.45 × 10⁻⁹ | 1.22 × 10⁻⁷ |
Publisher’s Note: MDPI stays neutral with regard to jurisdictional claims in published maps and institutional affiliations. |
© 2021 by the authors. Licensee MDPI, Basel, Switzerland. This article is an open access article distributed under the terms and conditions of the Creative Commons Attribution (CC BY) license (https://creativecommons.org/licenses/by/4.0/).
Share and Cite
Esmaeili, F.; Lohrasebi, T.; Mohammadi-Dehcheshmeh, M.; Ebrahimie, E. Evaluation of the Effectiveness of Herbal Components Based on Their Regulatory Signature on Carcinogenic Cancer Cells. Cells 2021, 10, 3139. https://doi.org/10.3390/cells10113139
Esmaeili F, Lohrasebi T, Mohammadi-Dehcheshmeh M, Ebrahimie E. Evaluation of the Effectiveness of Herbal Components Based on Their Regulatory Signature on Carcinogenic Cancer Cells. Cells. 2021; 10(11):3139. https://doi.org/10.3390/cells10113139
Chicago/Turabian StyleEsmaeili, Fazileh, Tahmineh Lohrasebi, Manijeh Mohammadi-Dehcheshmeh, and Esmaeil Ebrahimie. 2021. "Evaluation of the Effectiveness of Herbal Components Based on Their Regulatory Signature on Carcinogenic Cancer Cells" Cells 10, no. 11: 3139. https://doi.org/10.3390/cells10113139