
Single-Cell RNA-Seq Reveals Transcriptomic Heterogeneity and Post-Traumatic Osteoarthritis-Associated Early Molecular Changes in Mouse Articular Chondrocytes

 , , , , and
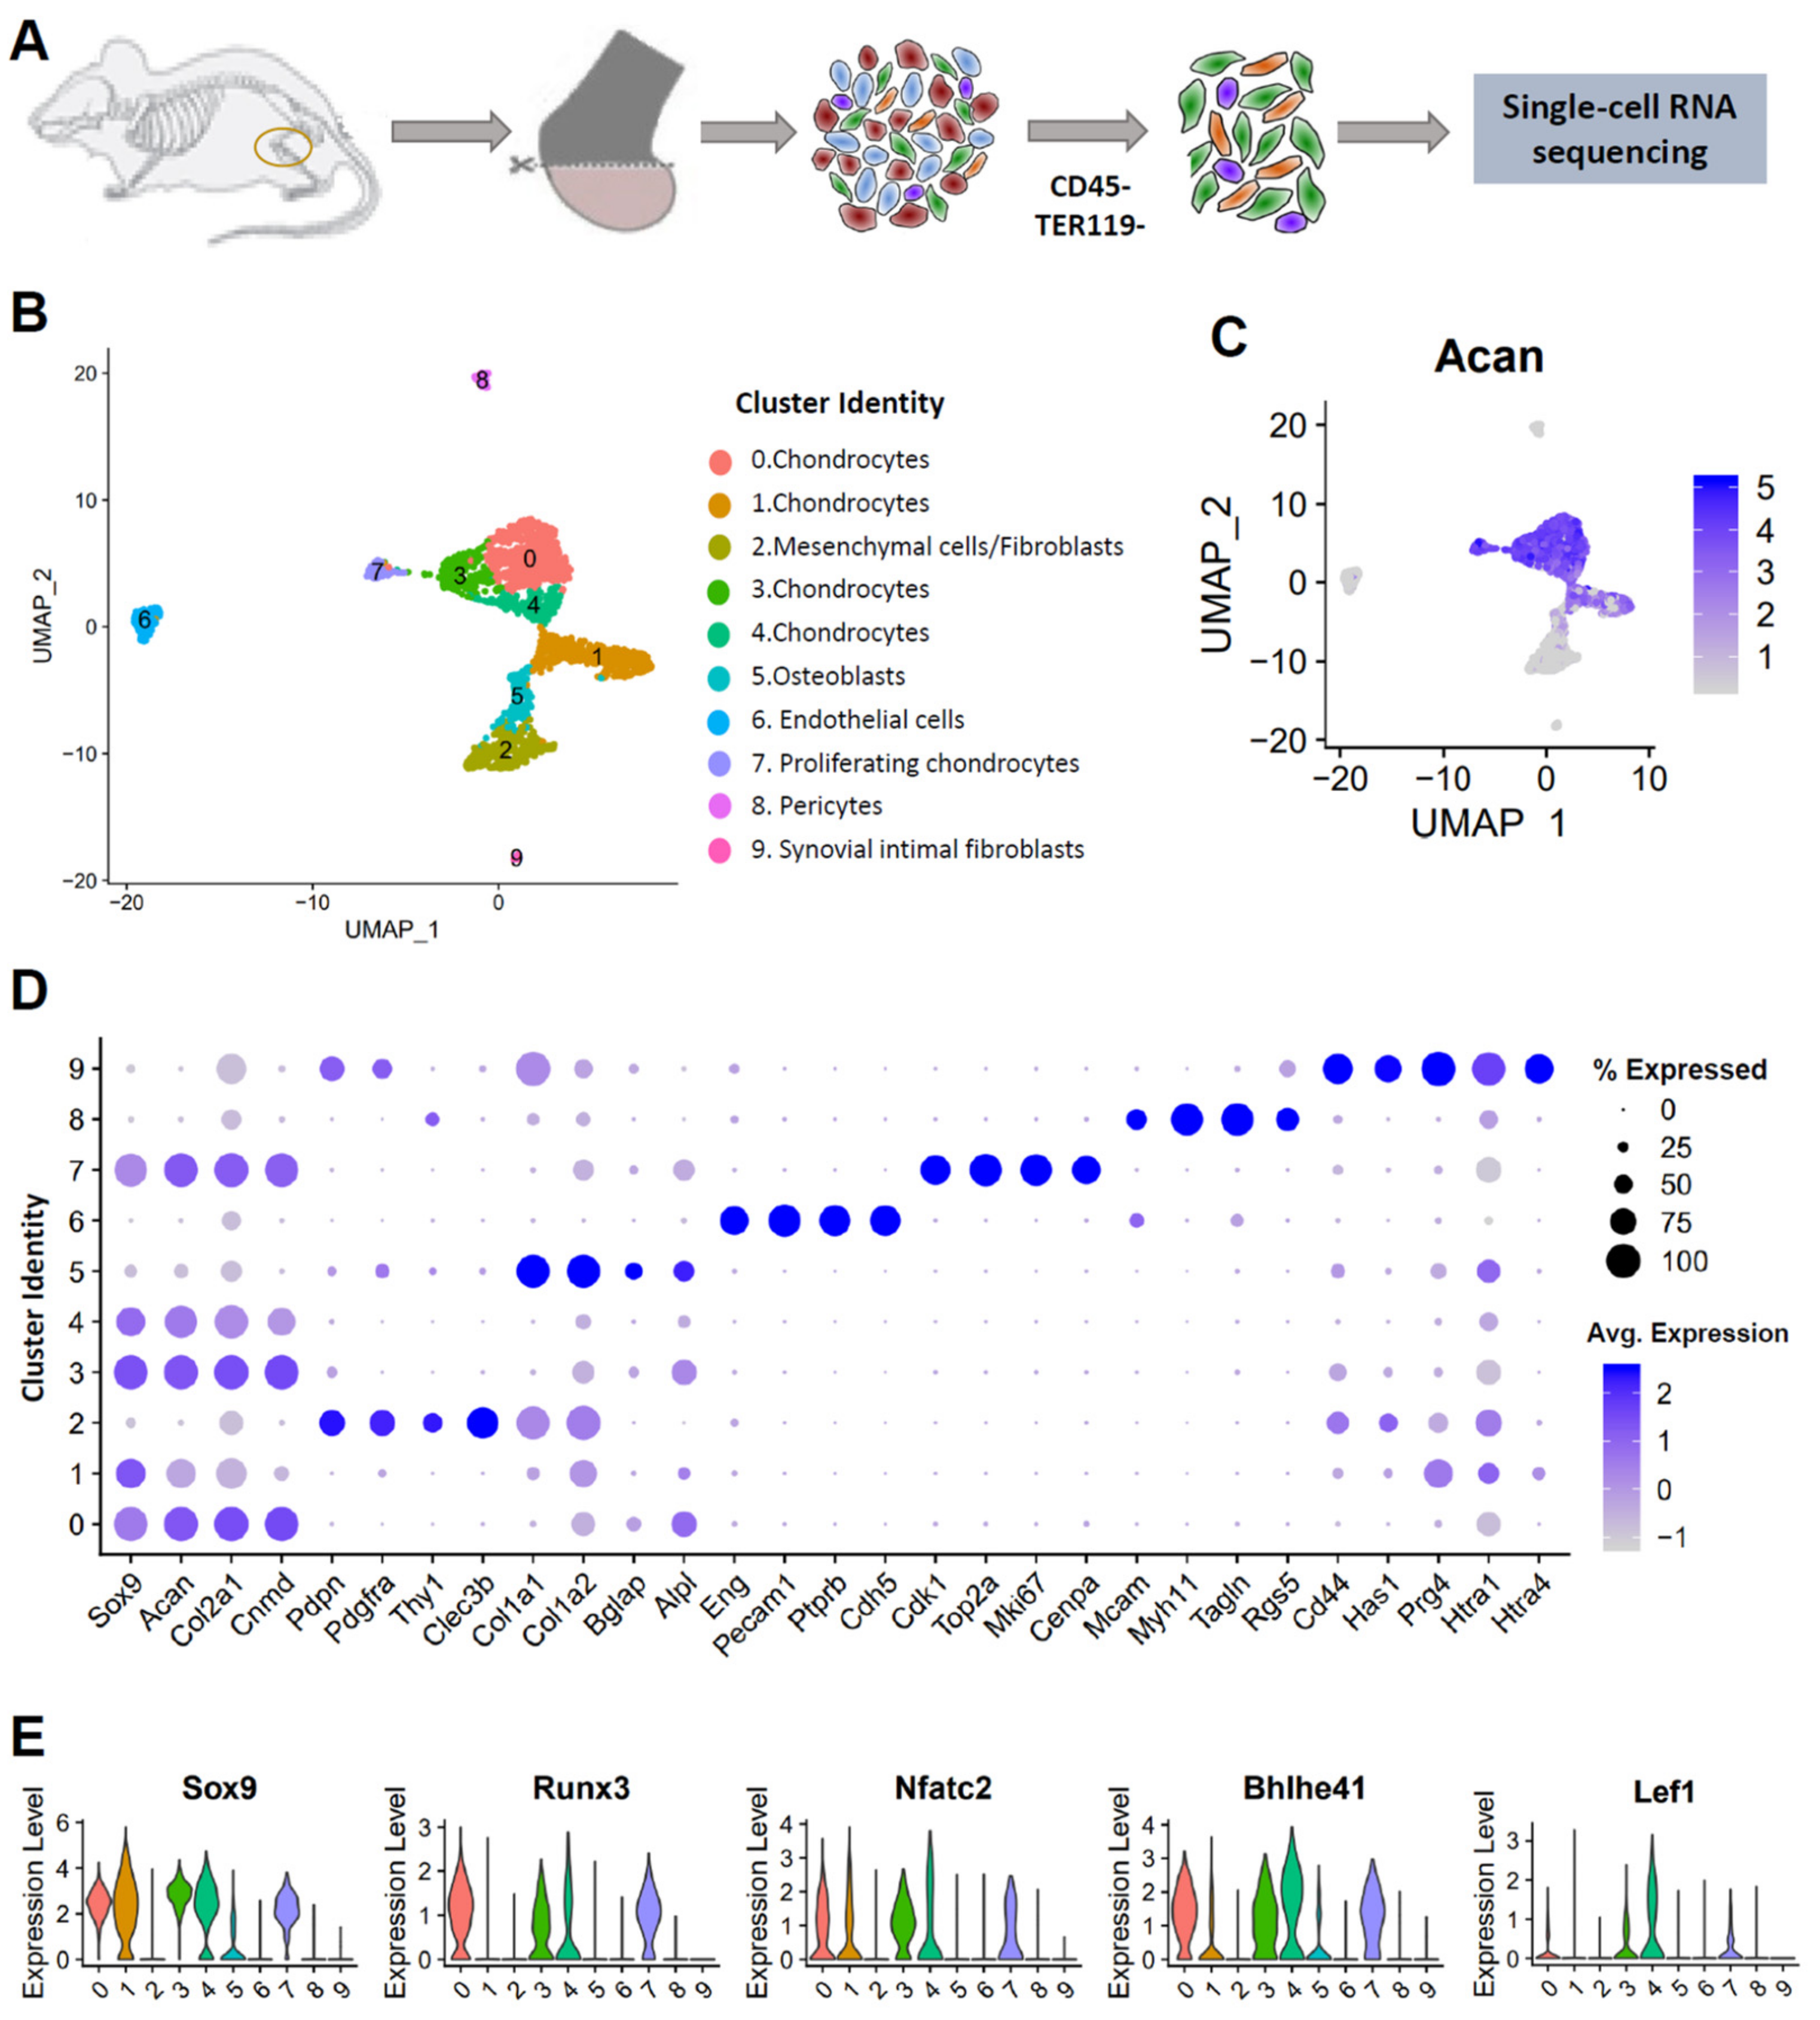
Abstract
:1. Introduction
2. Materials and Methods
2.1. Anterior Cruciate Ligament (ACL) Injury Model
2.2. Histological Assessment of Disease Severity
2.3. Immunohistochemistry (IHC)
2.4. Single-Cell RNA Sequencing (scRNA-seq)
2.5. scRNA-seq Data Analysis of Chondrocytes from Uninjured Joints
2.6. Analysis of Human Chondrocyte scRNA-seq Data
2.7. Comparison of Chondrocytes from Uninjured and Injured Joints
2.8. Pseudotime Trajectory Finding
2.9. Ontology Enrichment Analysis
3. Results
3.1. Single-Cell Profiling Reveals Cellular Heterogeneity in Healthy Murine Knee Joints
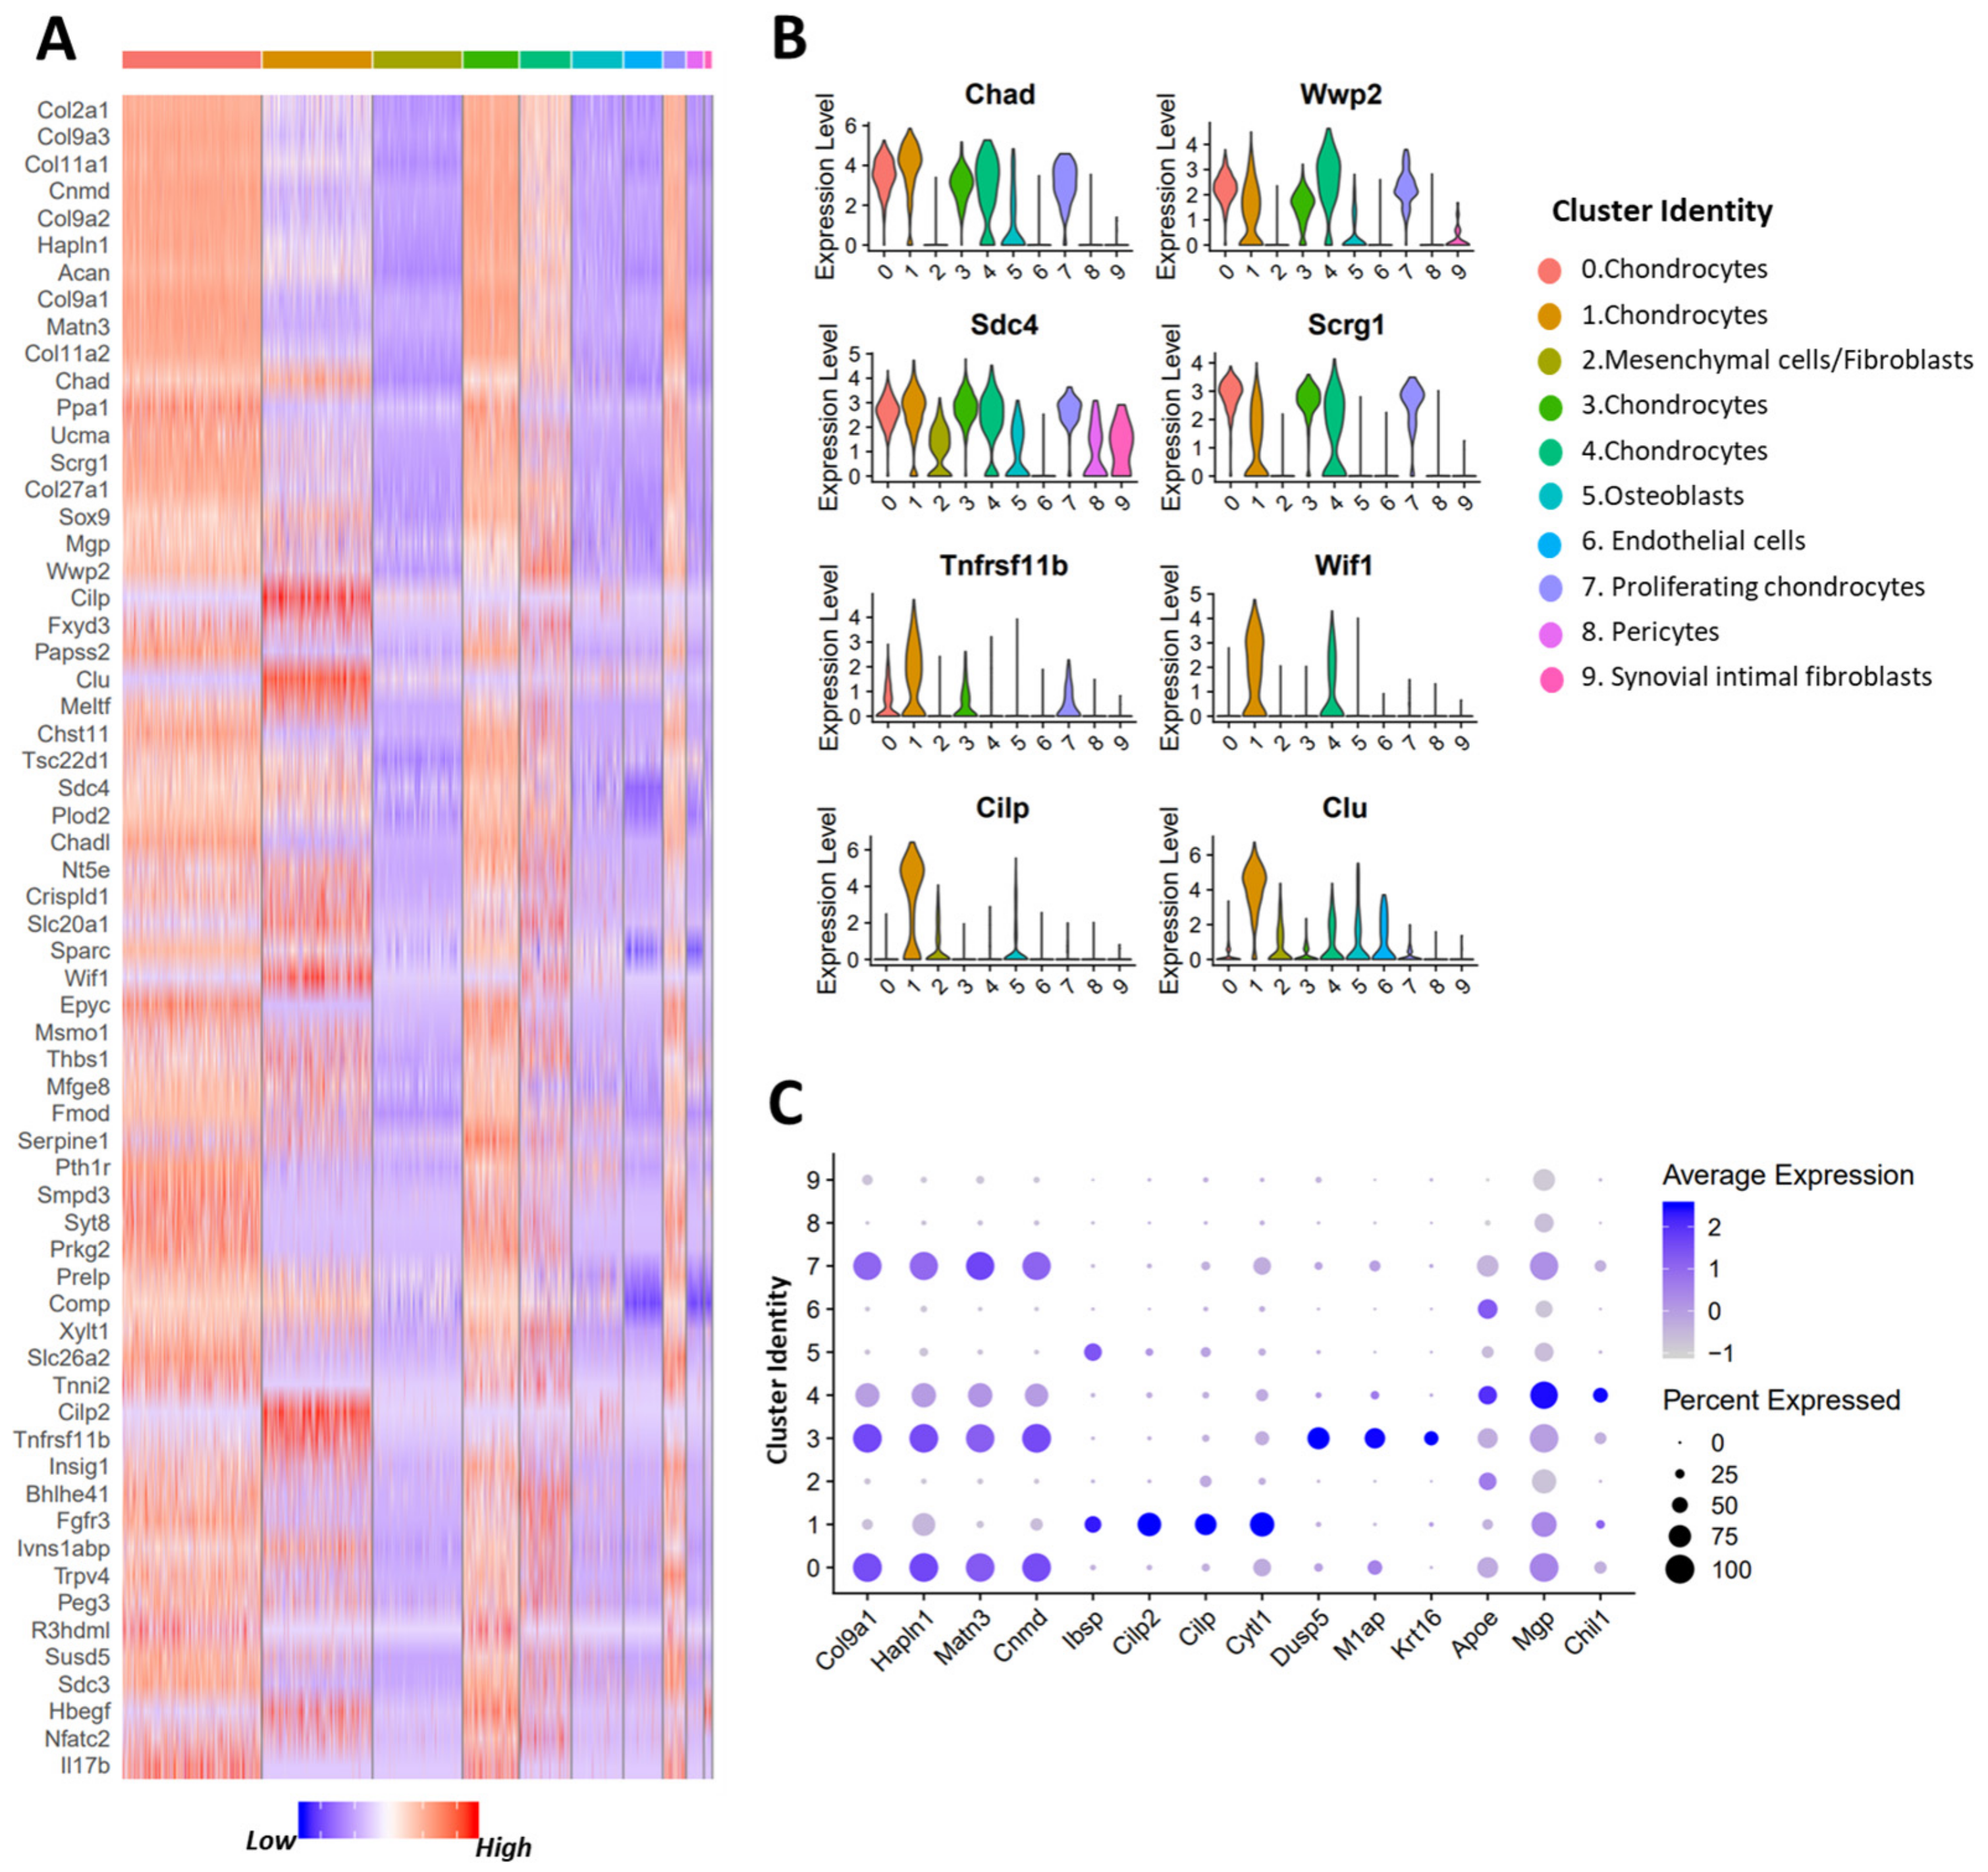
3.2. Identification of Potential OA Targets Enriched in Chondrocytes
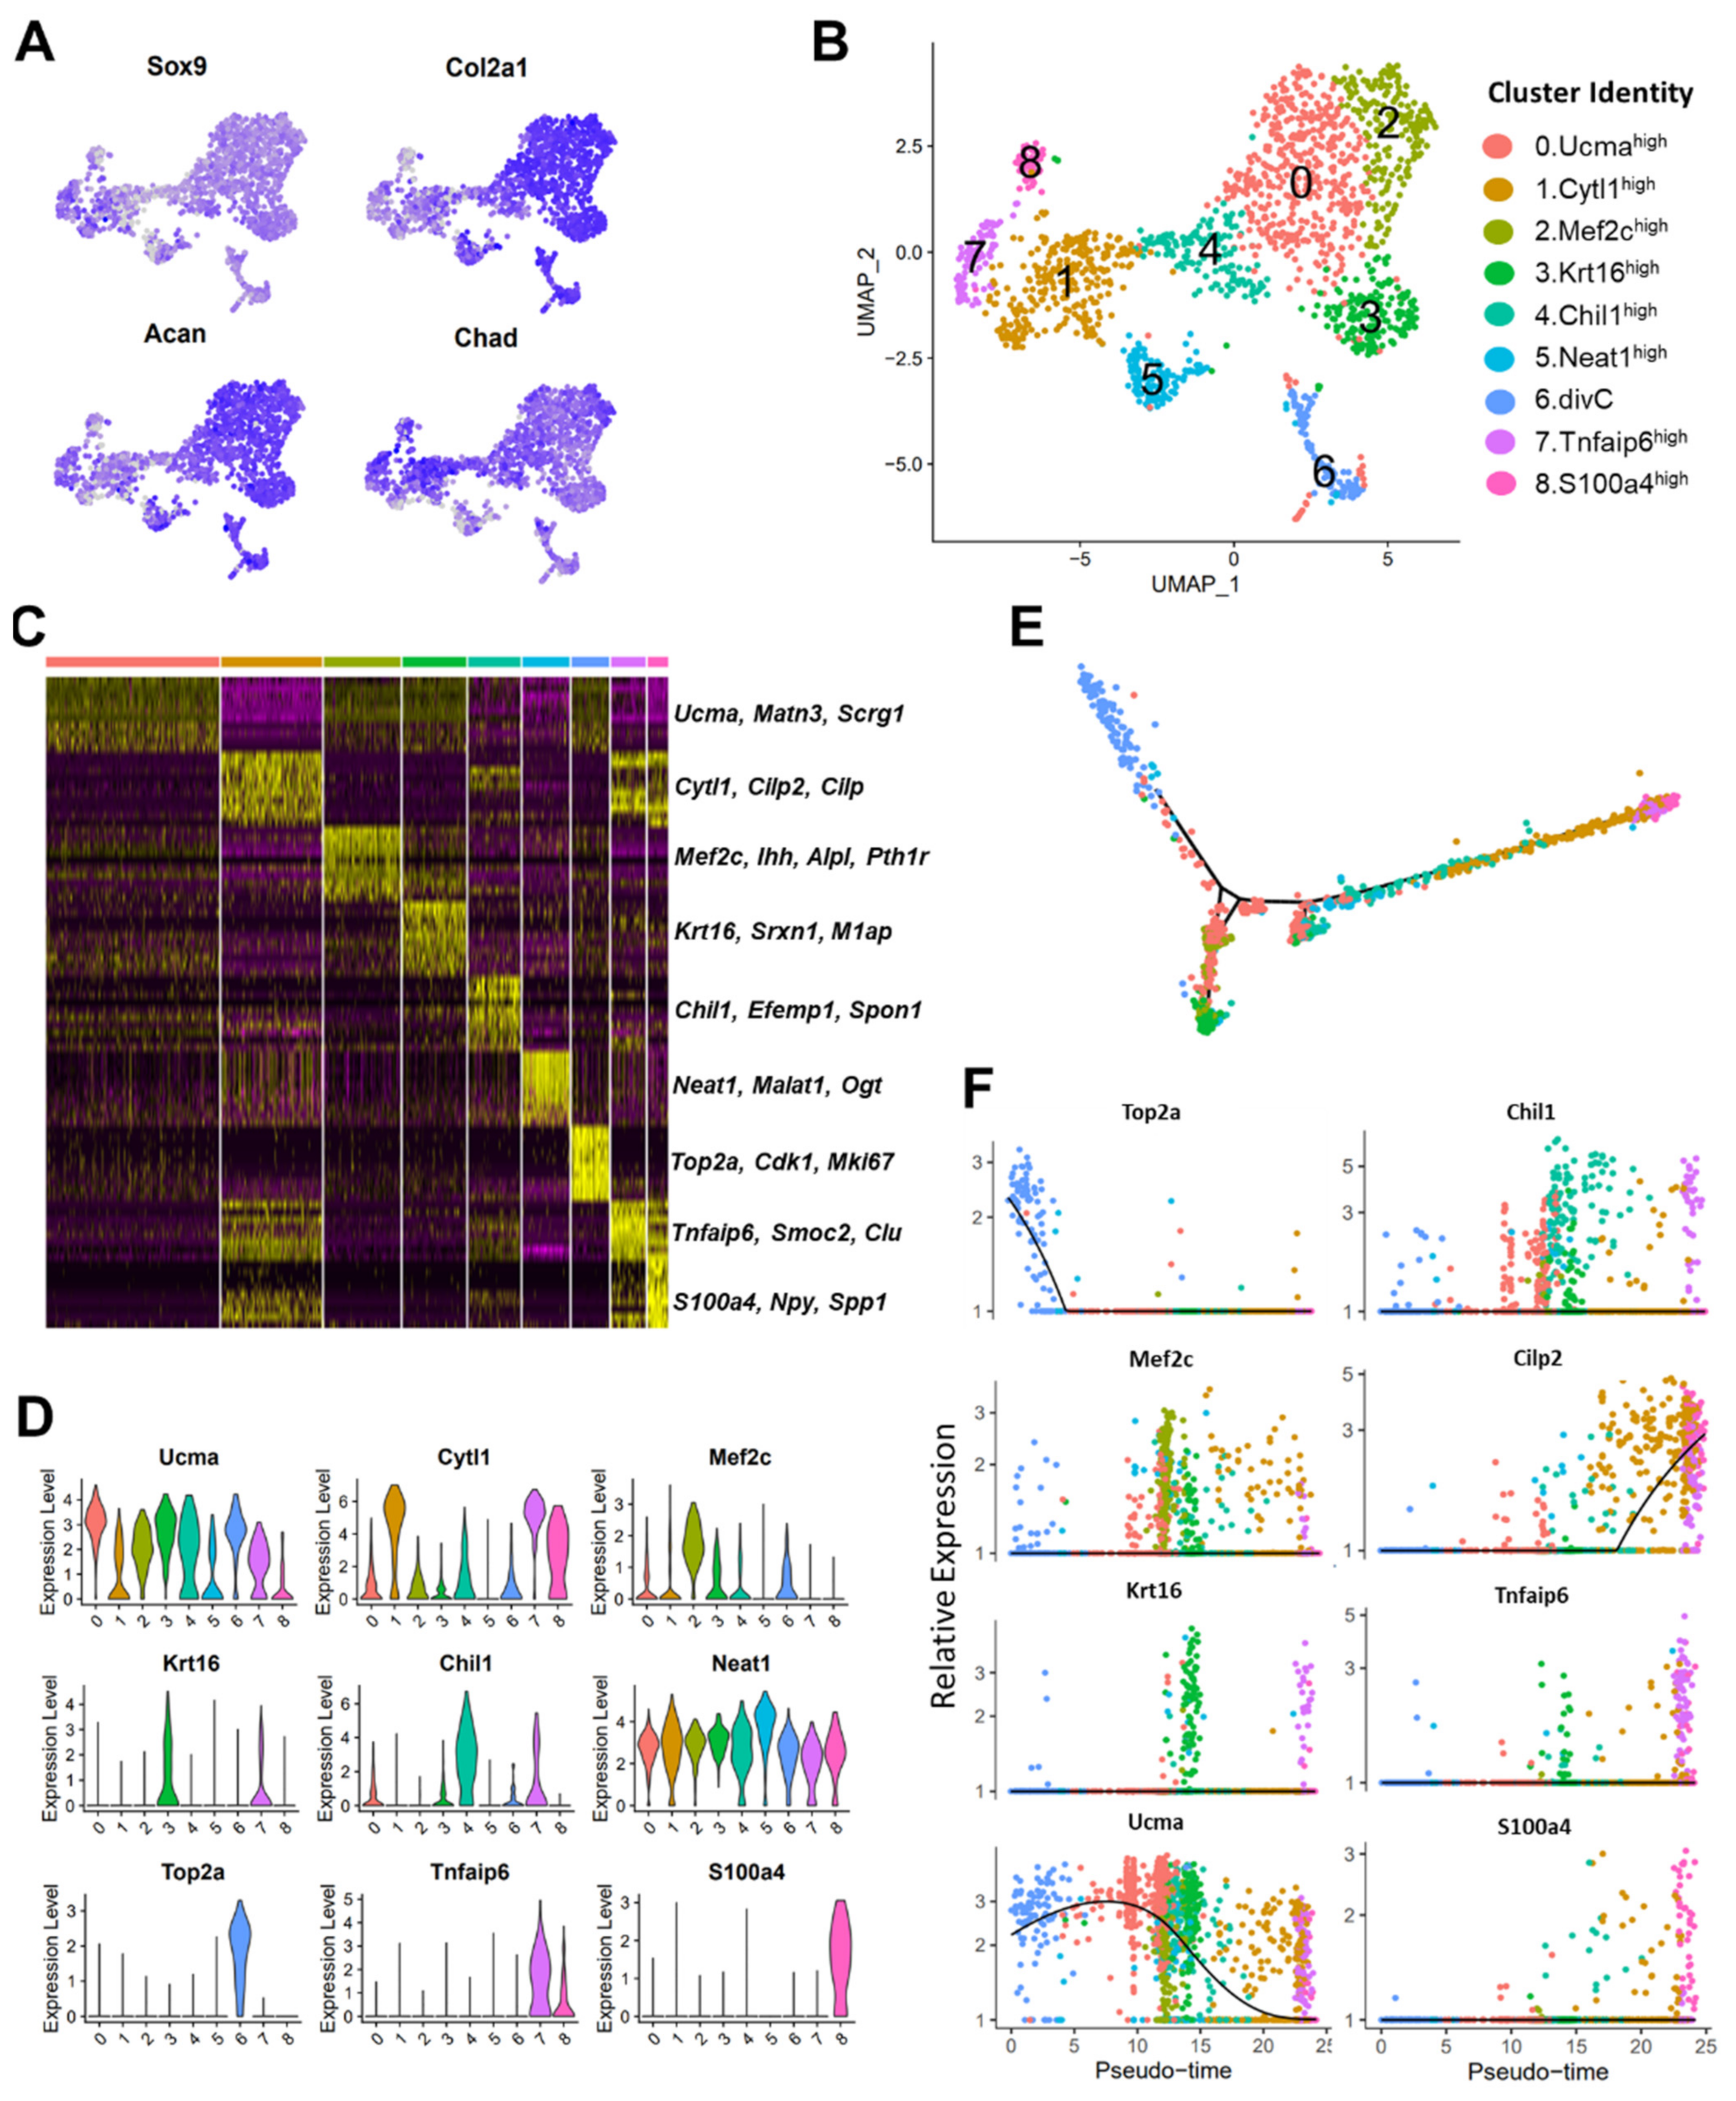
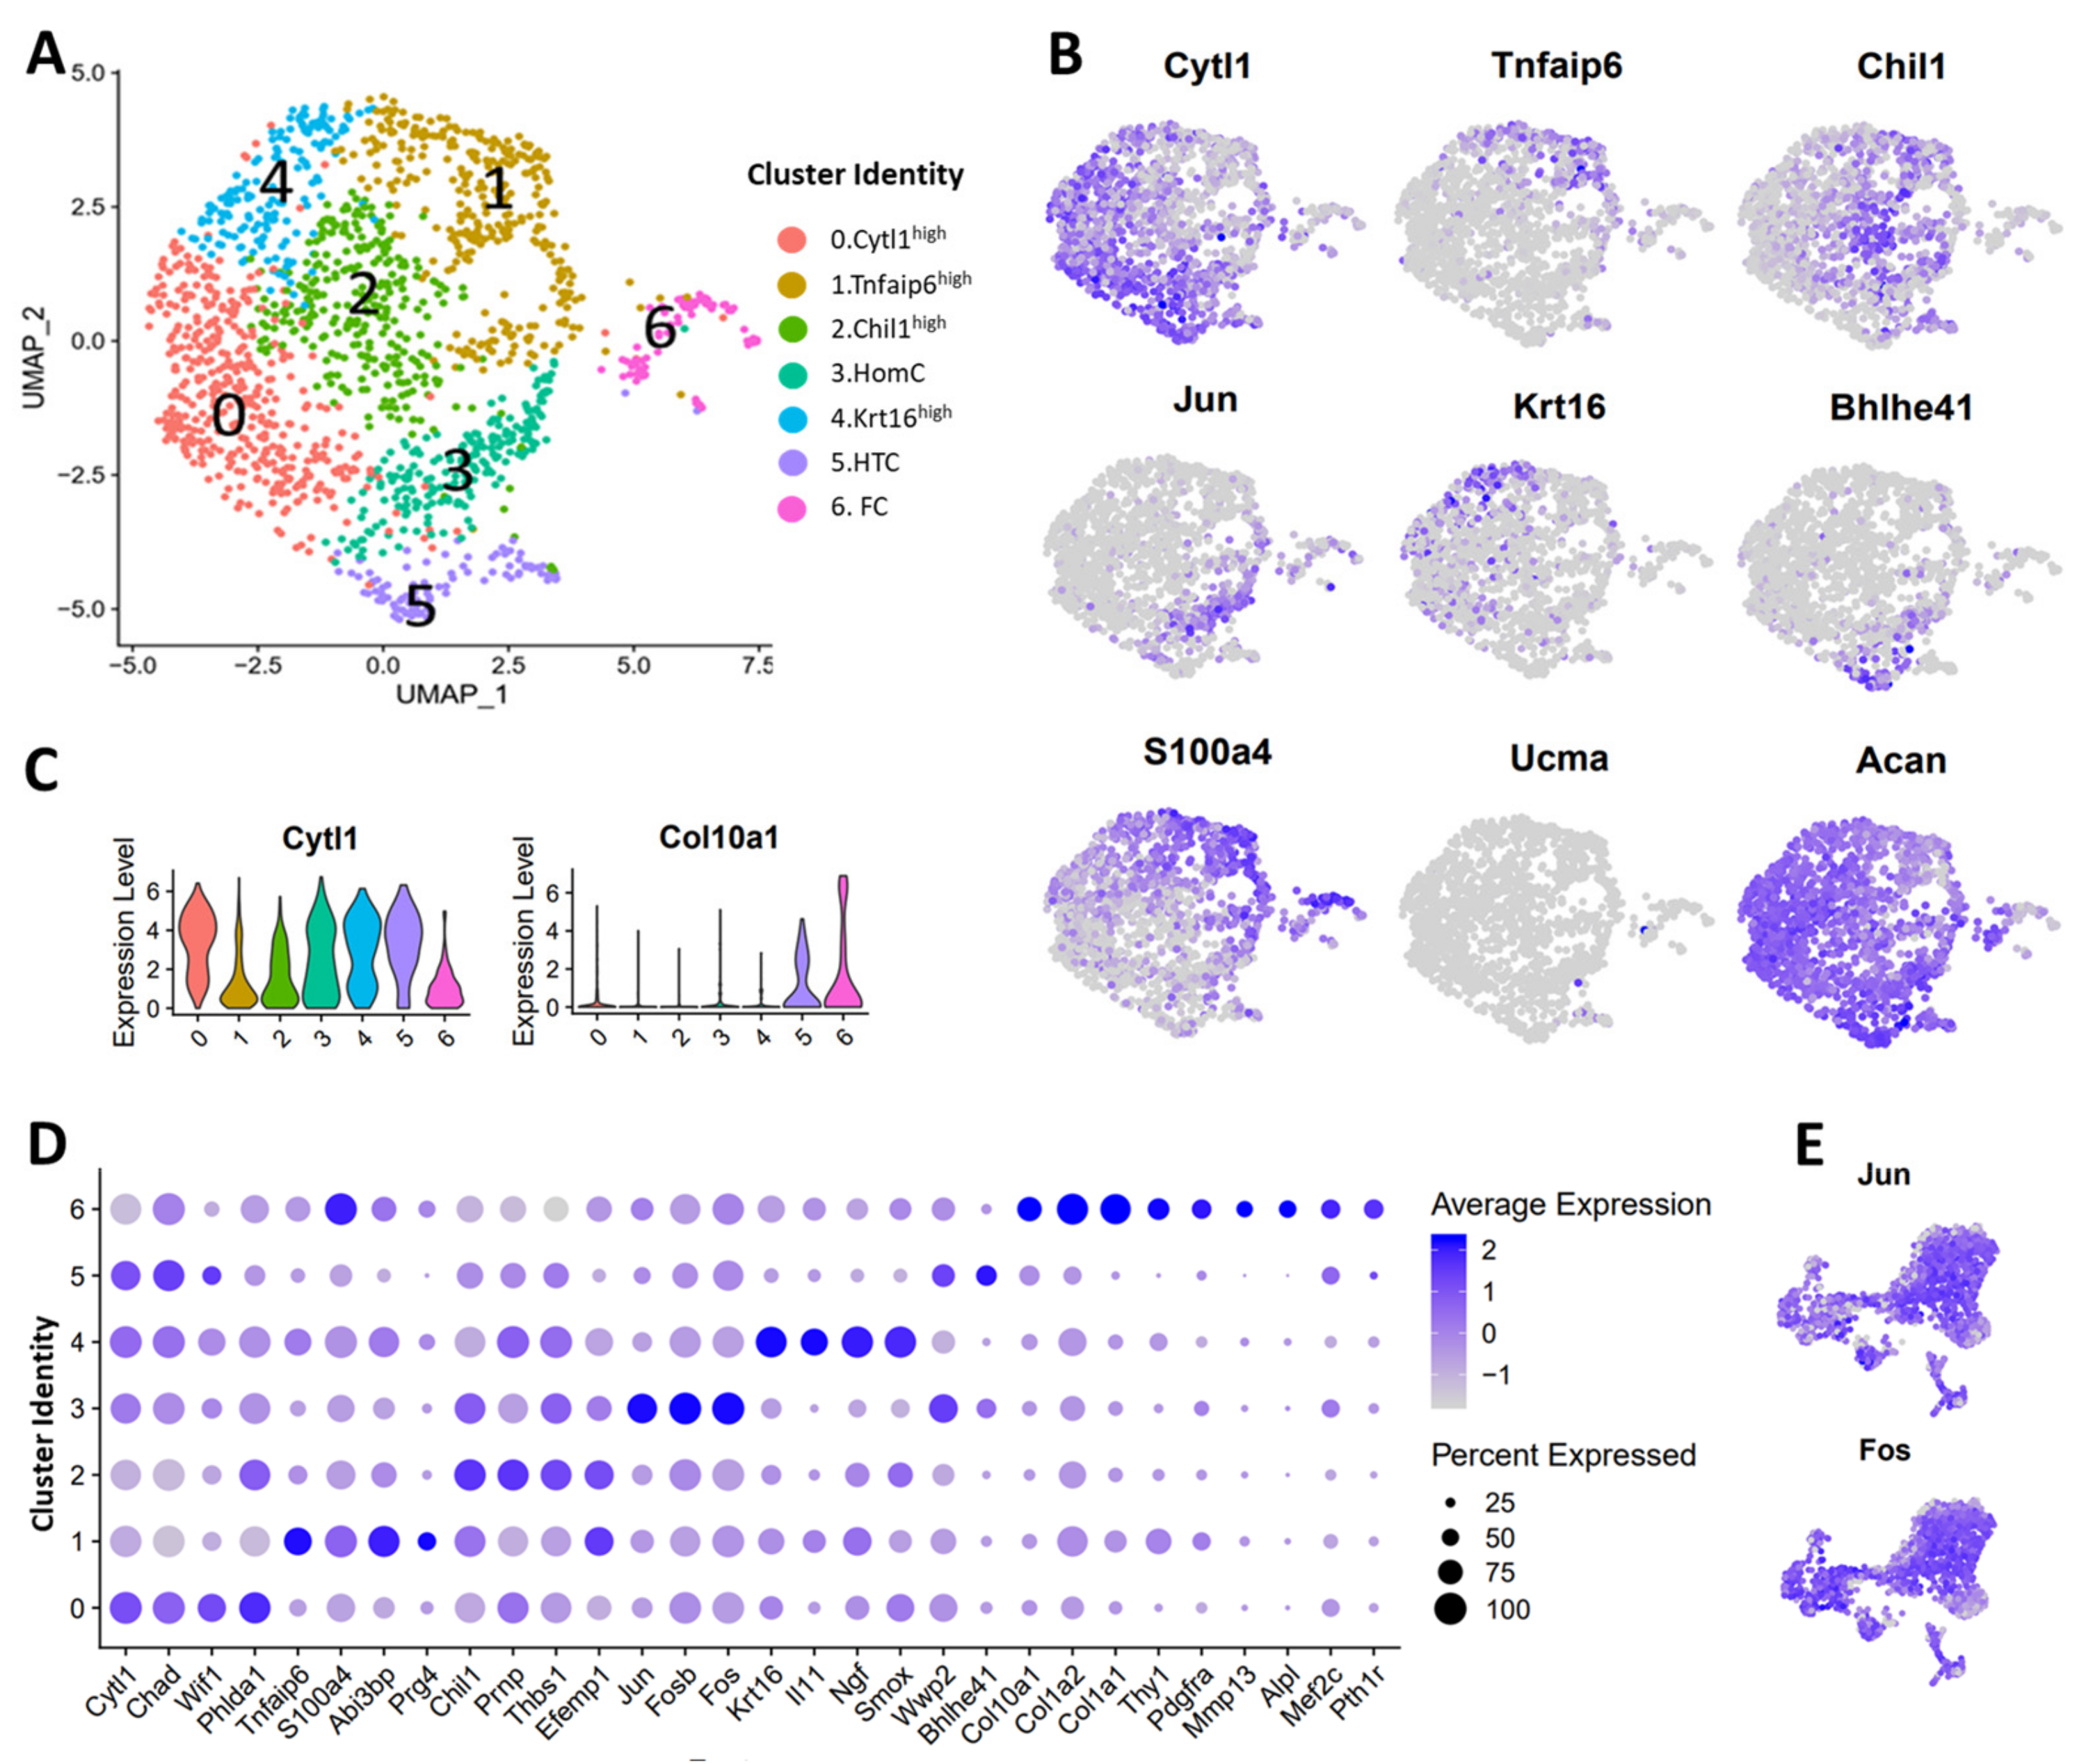
3.3. scRNA-seq Analysis Identified Nine Chondrocyte Subtypes in Mouse Knee Joints
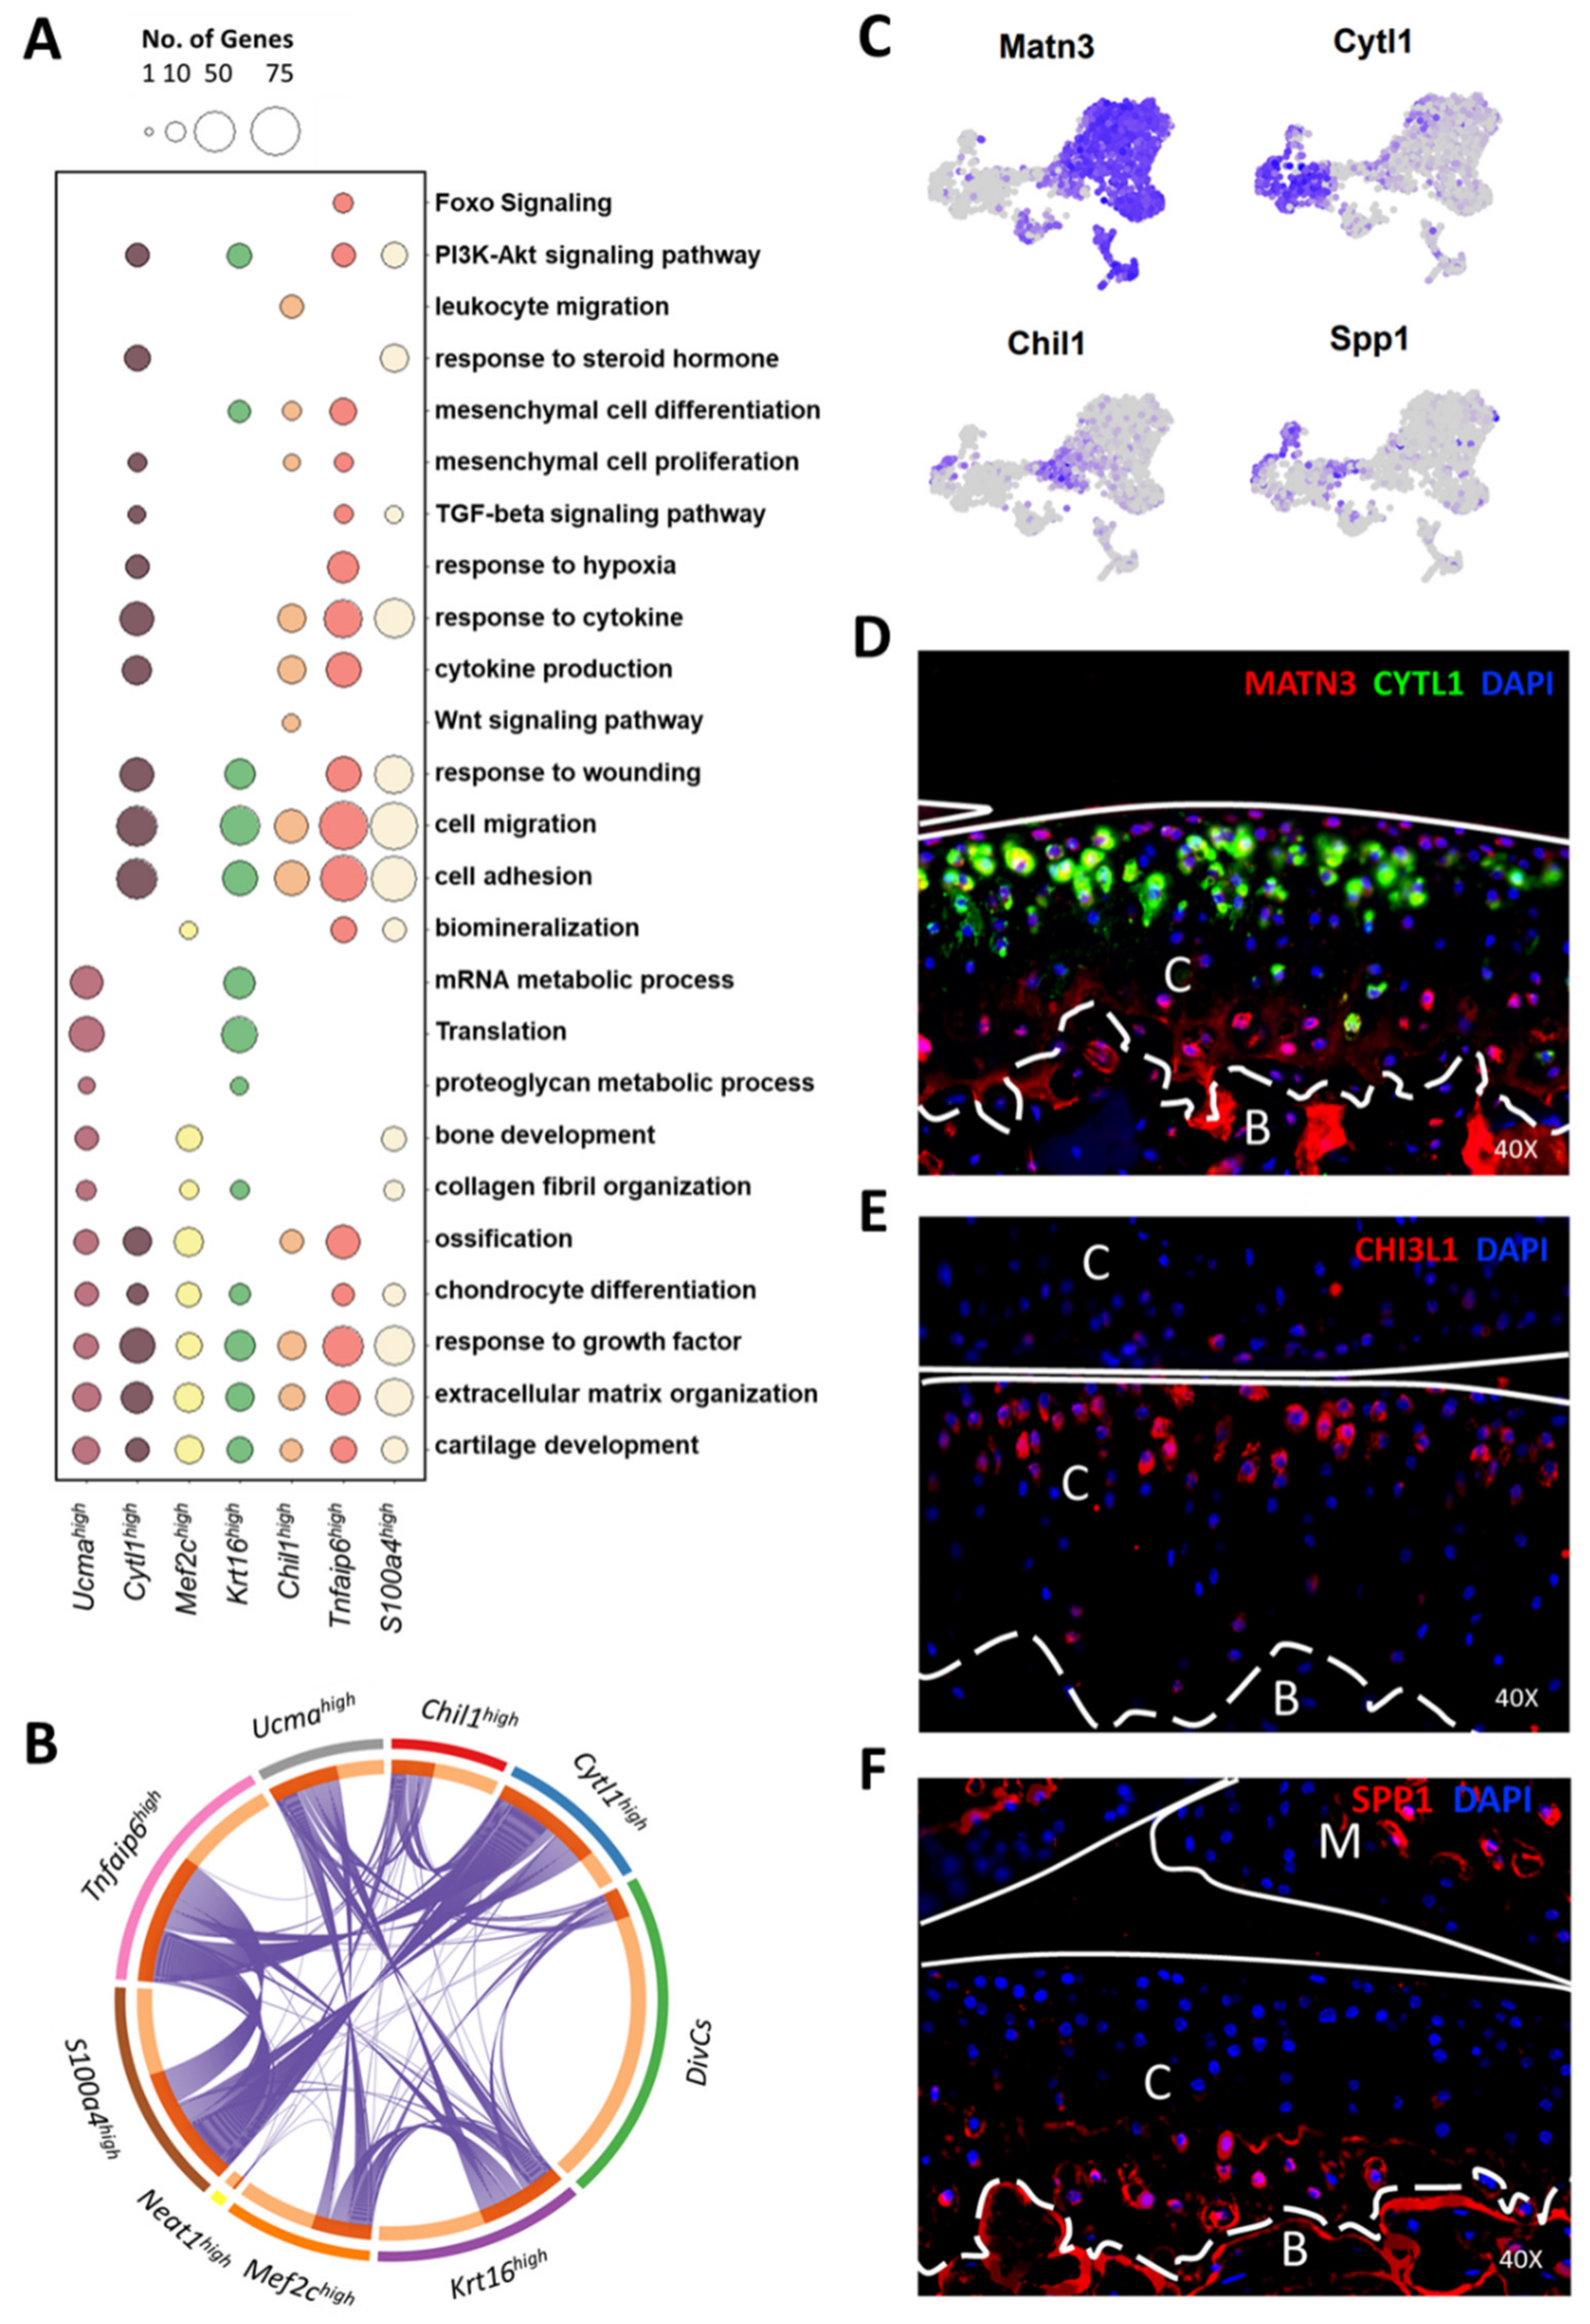
3.4. Molecular and Functional-Level Characterization of Chondrocyte Subpopulations
3.5. Comparative Transcriptomic Analysis Identified Similarities and Differences between Mouse and Human Chondrocyte Subtypes
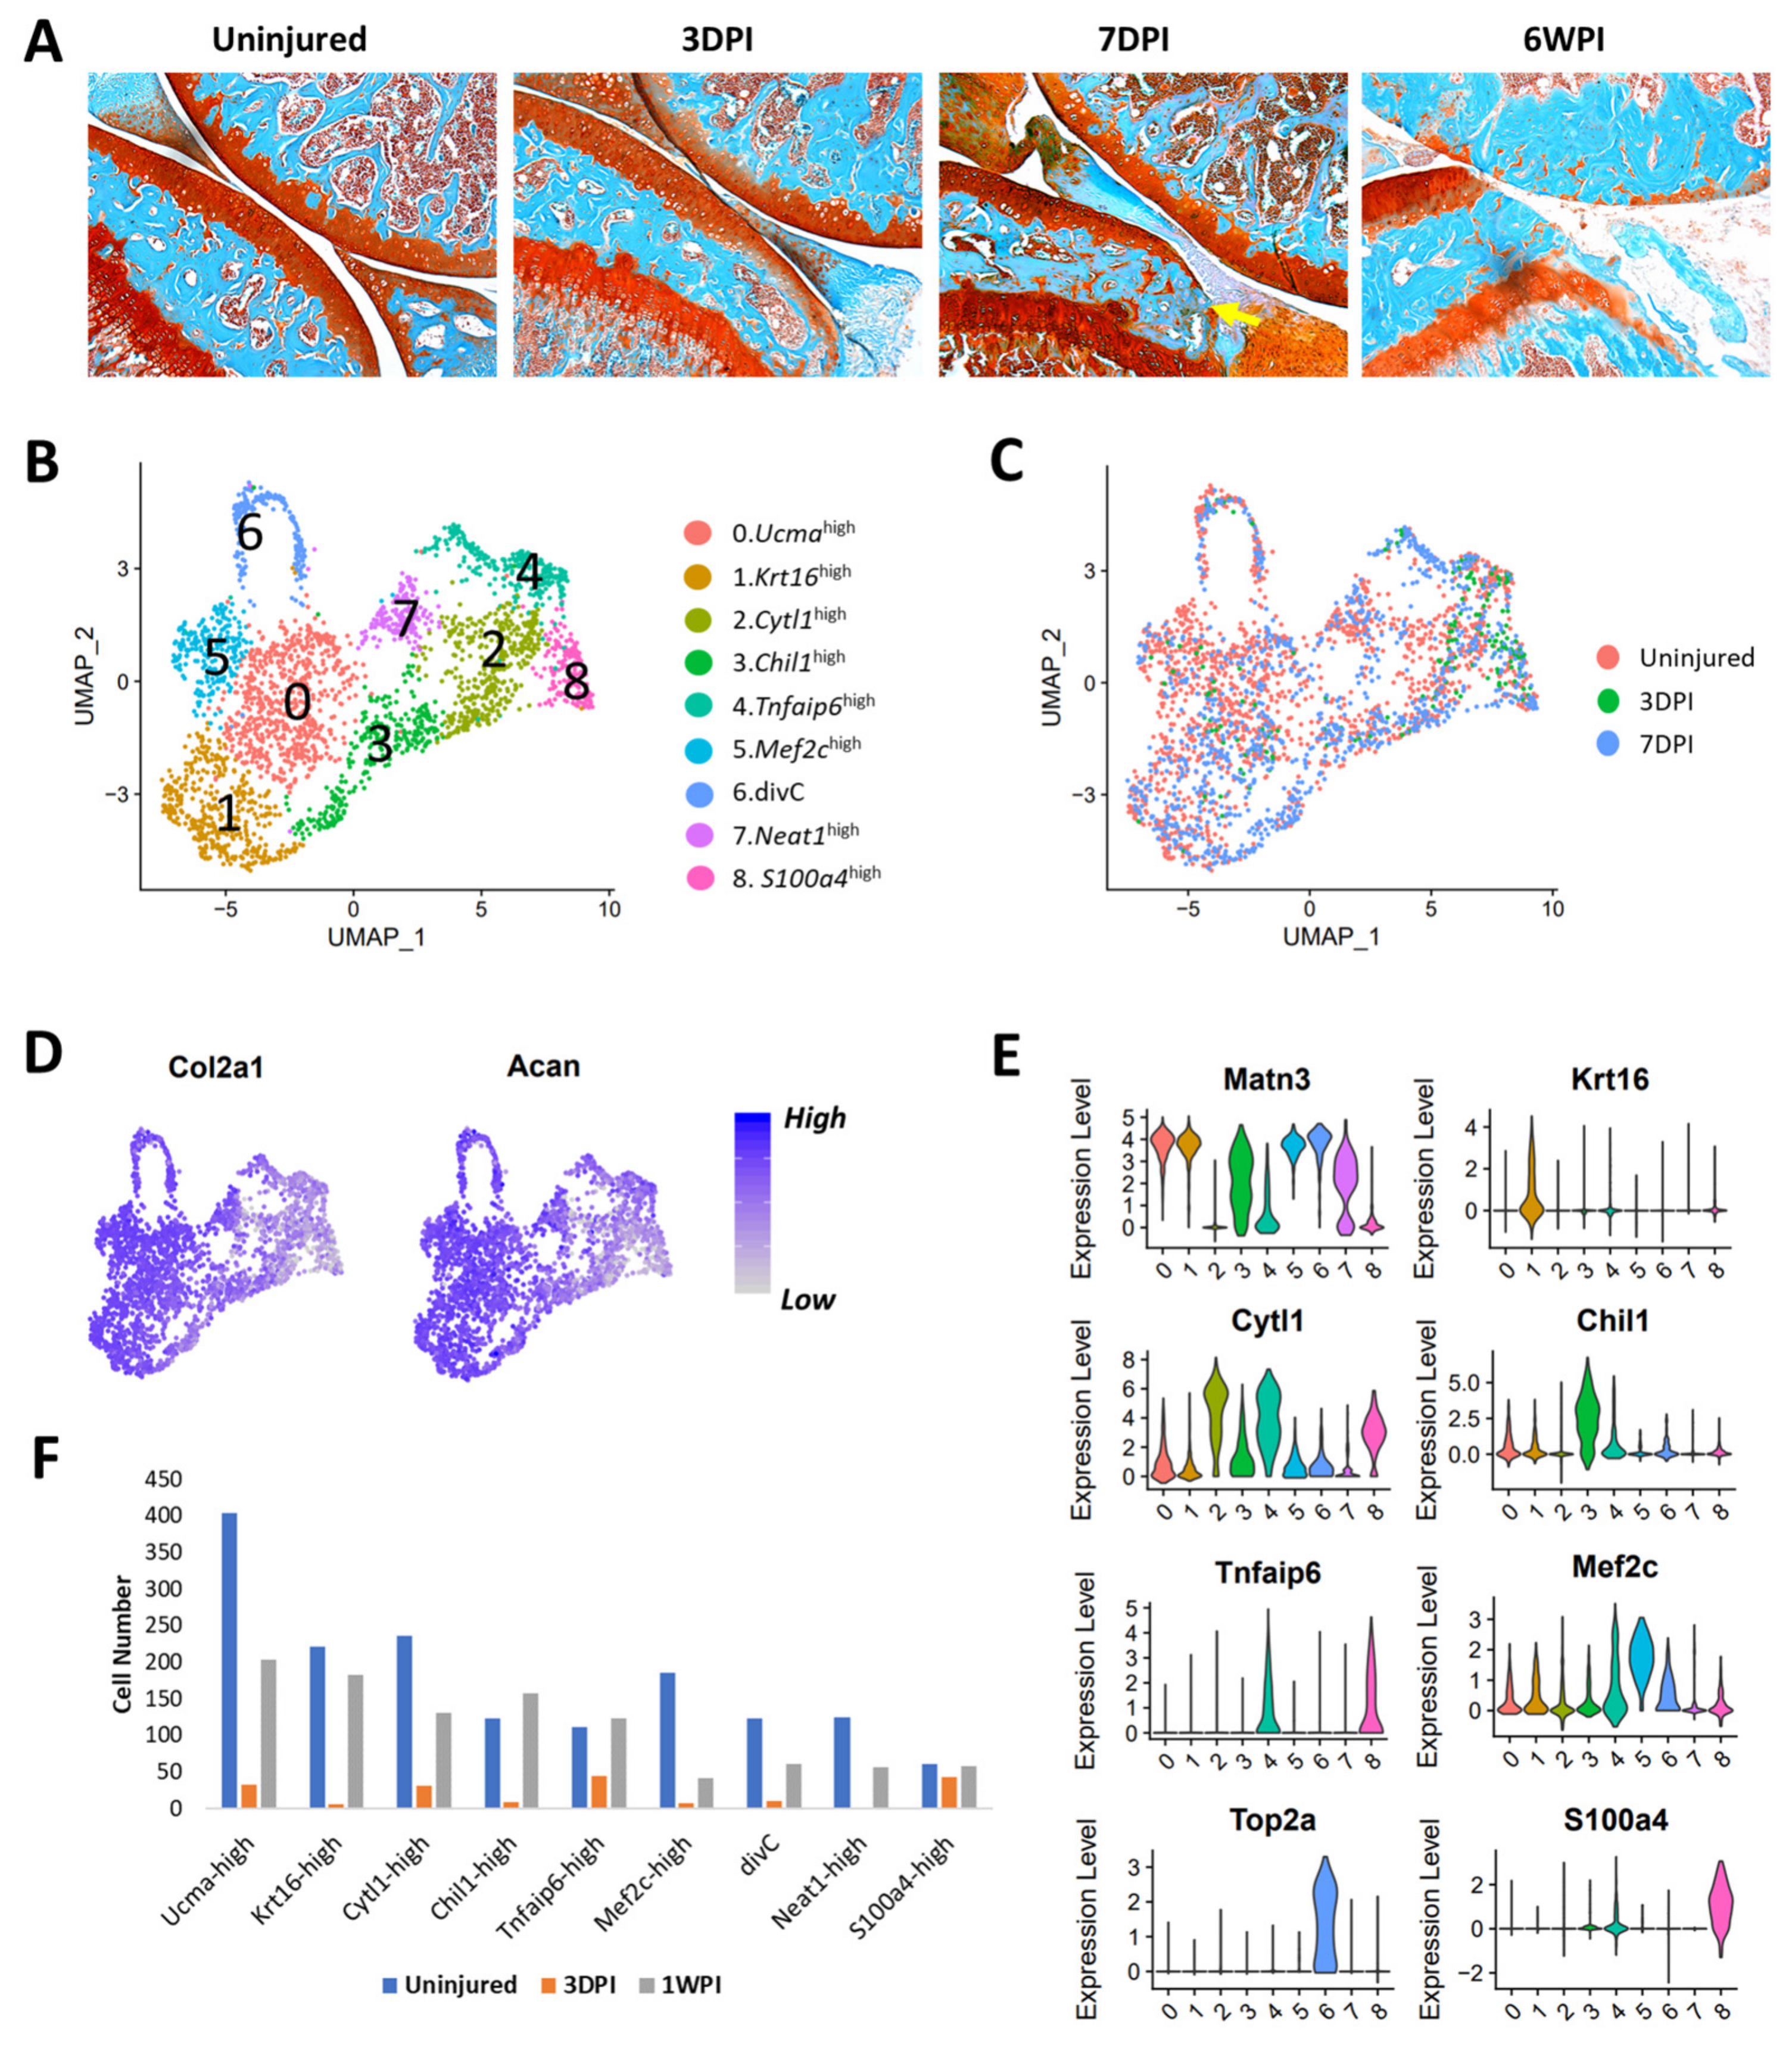
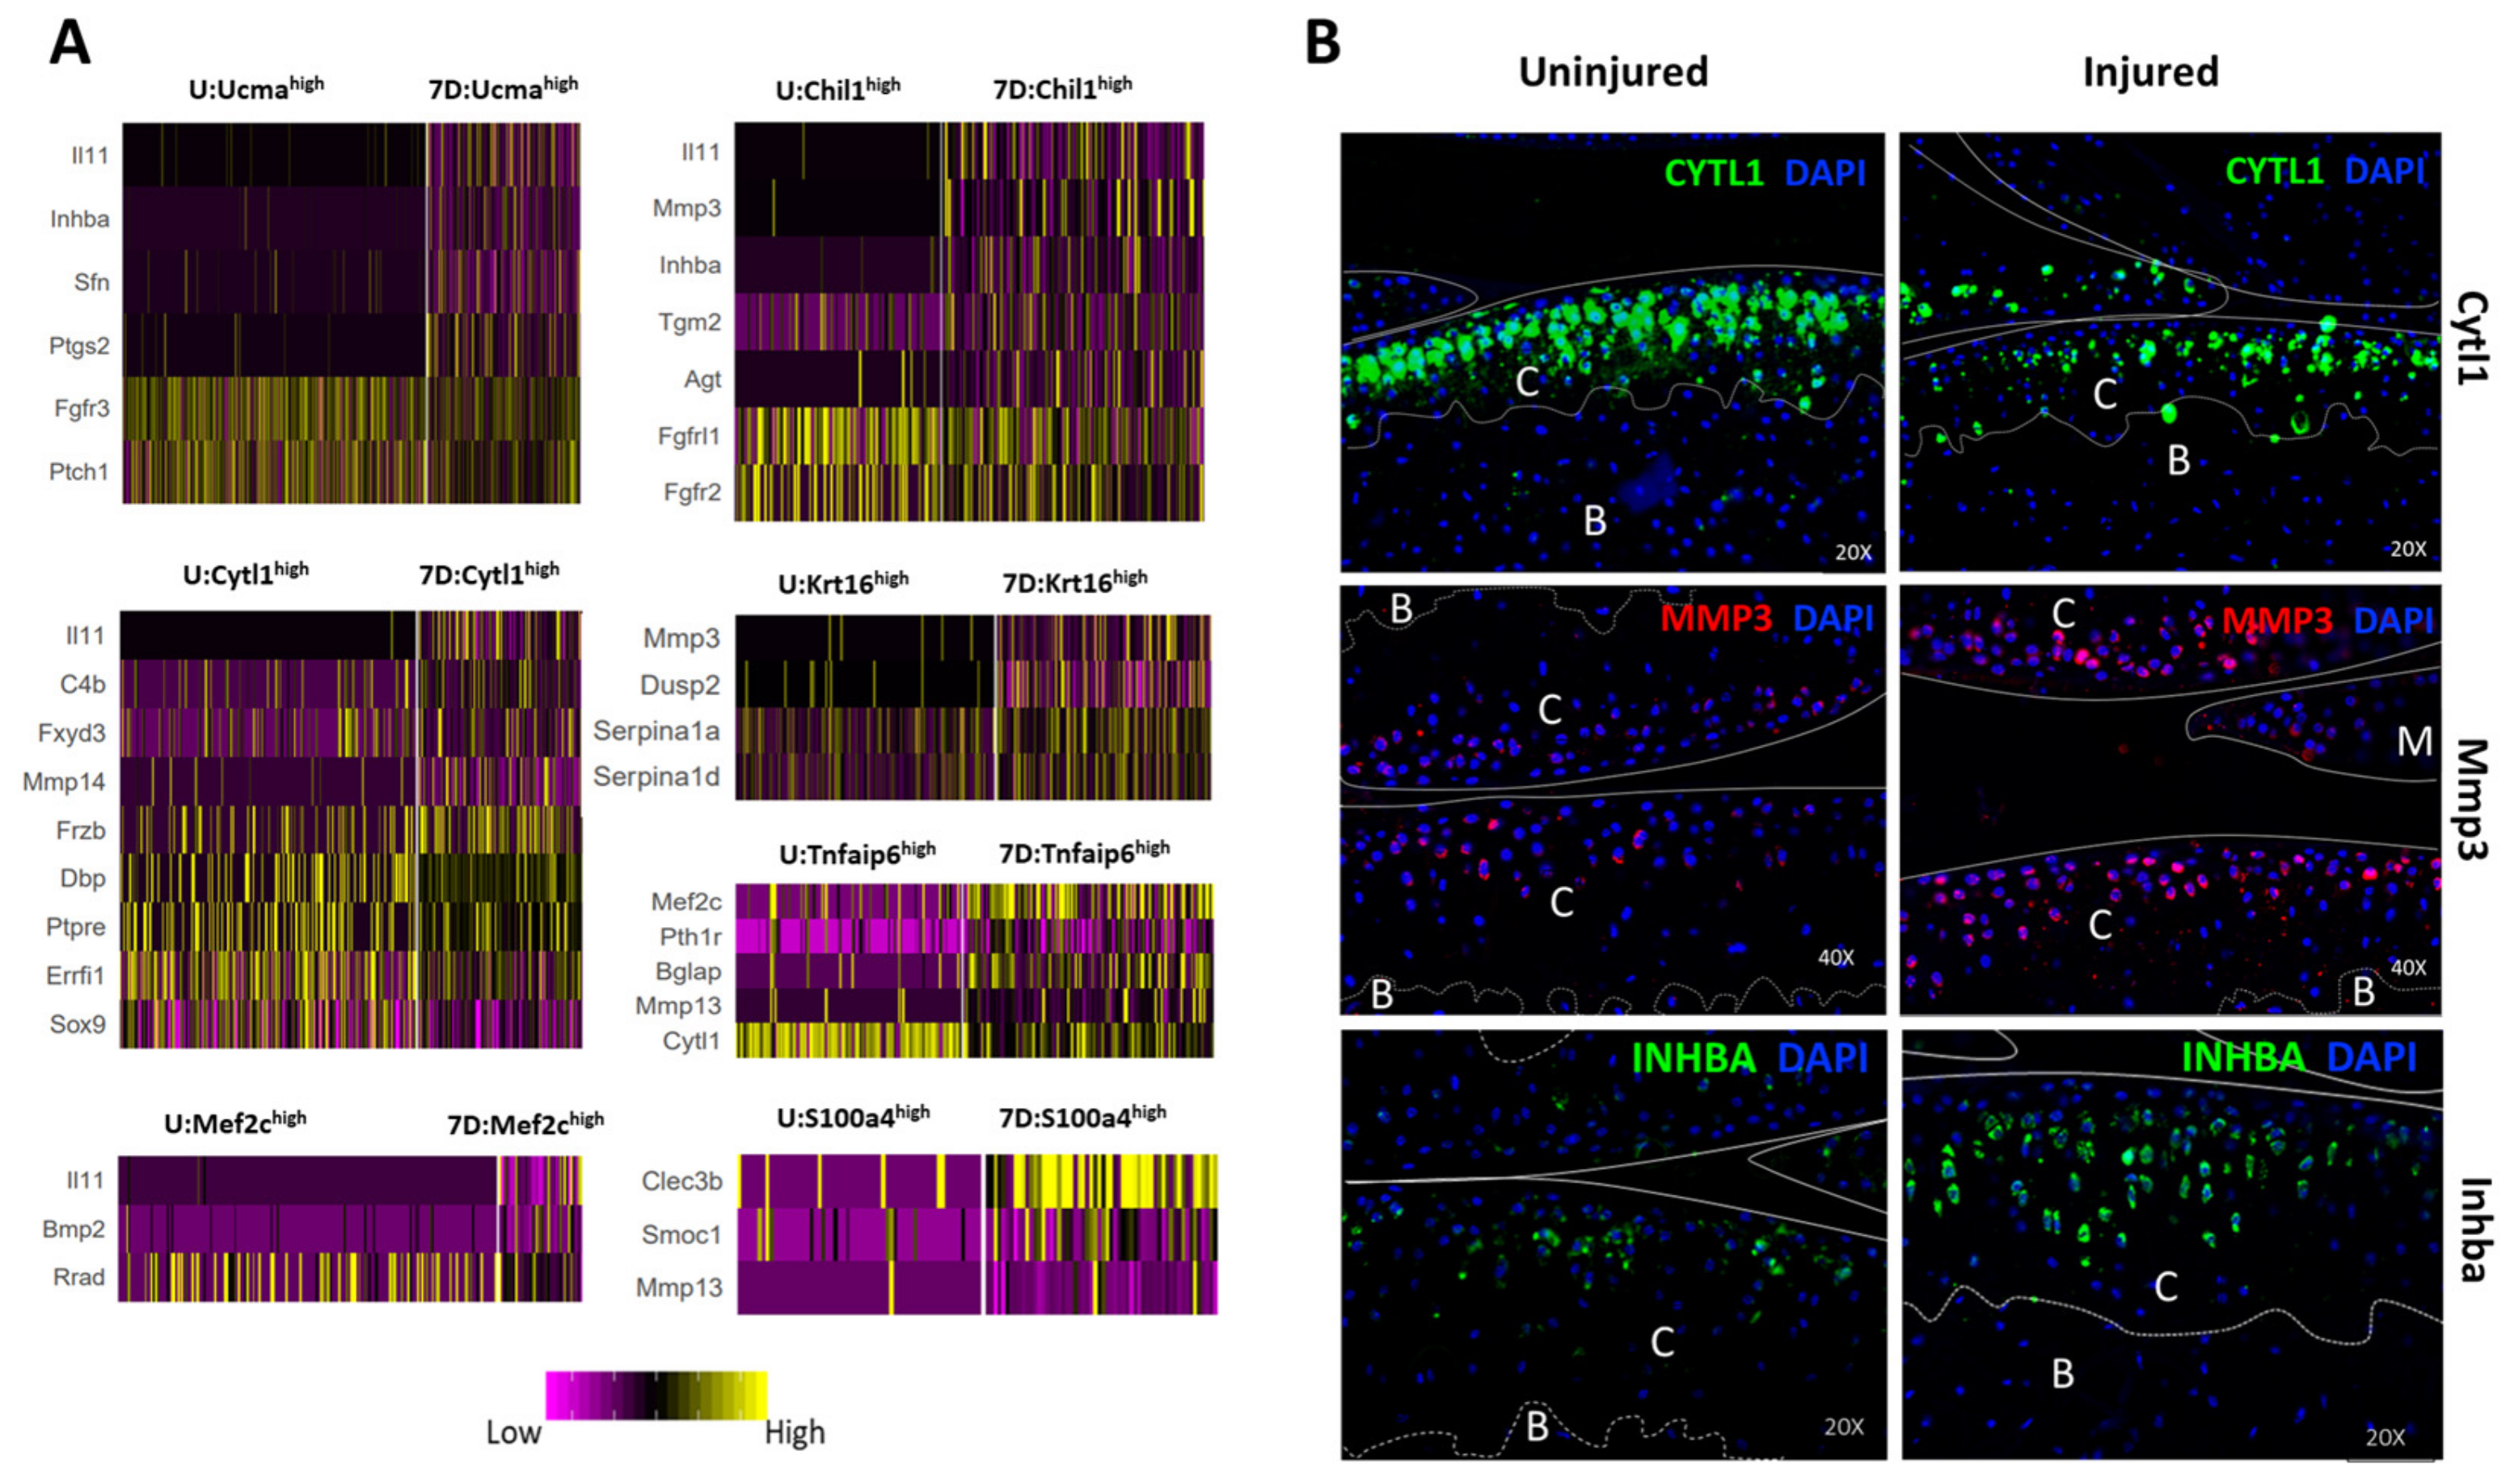
3.6. Identification of Injury-Induced Early Molecular Changes in the Articular Chondrocytes
4. Discussion
Supplementary Materials
Author Contributions
Funding
Institutional Review Board Statement
Informed Consent Statement
Data Availability Statement
Acknowledgments
Conflicts of Interest
References
- Chen, D.; Shen, J.; Zhao, W.; Wang, T.; Han, L.; Hamilton, J.L.; Im, H.J. Osteoarthritis: Toward a comprehensive understanding of pathological mechanism. Bone Res. 2017, 5, 16044. [Google Scholar] [CrossRef] [PubMed]
- Blixen, C.E.; Kippes, C. Depression, social support, and quality of life in older adults with osteoarthritis. Image J. Nurs. Sch. 1999, 31, 221–226. [Google Scholar] [CrossRef] [PubMed]
- Blalock, D.; Miller, A.; Tilley, M.; Wang, J. Joint instability and osteoarthritis. Clin. Med. Insights Arthritis Musculoskelet. Disords 2015, 8, 15–23. [Google Scholar] [CrossRef]
- Steinert, A.F.; Ghivizzani, S.C.; Rethwilm, A.; Tuan, R.S.; Evans, C.H.; Noth, U. Major biological obstacles for persistent cell-based regeneration of articular cartilage. Arthritis Res. Ther. 2007, 9, 213. [Google Scholar] [CrossRef] [PubMed] [Green Version]
- Sophia Fox, A.J.; Bedi, A.; Rodeo, S.A. The basic science of articular cartilage: Structure, composition, and function. Sports Health 2009, 1, 461–468. [Google Scholar] [CrossRef] [PubMed]
- Ji, Q.; Zheng, Y.; Zhang, G.; Hu, Y.; Fan, X.; Hou, Y.; Wen, L.; Li, L.; Xu, Y.; Wang, Y.; et al. Single-cell RNA-seq analysis reveals the progression of human osteoarthritis. Ann. Rheum. Dis. 2019, 78, 100–110. [Google Scholar] [CrossRef] [PubMed]
- Chou, C.H.; Jain, V.; Gibson, J.; Attarian, D.E.; Haraden, C.A.; Yohn, C.B.; Laberge, R.M.; Gregory, S.; Kraus, V.B. Synovial cell cross-talk with cartilage plays a major role in the pathogenesis of osteoarthritis. Sci. Rep. 2020, 10, 10868. [Google Scholar] [CrossRef] [PubMed]
- Ramos, Y.F.; den Hollander, W.; Bovee, J.V.; Bomer, N.; van der Breggen, R.; Lakenberg, N.; Keurentjes, J.C.; Goeman, J.J.; Slagboom, P.E.; Nelissen, R.G.; et al. Genes involved in the osteoarthritis process identified through genome wide expression analysis in articular cartilage; the RAAK study. PLoS ONE 2014, 9, e103056. [Google Scholar] [CrossRef] [Green Version]
- He, A.; Ning, Y.; Wen, Y.; Cai, Y.; Xu, K.; Cai, Y.; Han, J.; Liu, L.; Du, Y.; Liang, X.; et al. Use of integrative epigenetic and mRNA expression analyses to identify significantly changed genes and functional pathways in osteoarthritic cartilage. Bone Joint Res. 2018, 7, 343–350. [Google Scholar] [CrossRef]
- Little, C.B.; Hunter, D.J. Post-traumatic osteoarthritis: From mouse models to clinical trials. Nat. Rev. Rheumatol. 2013, 9, 485–497. [Google Scholar] [CrossRef]
- Loeser, R.F.; Olex, A.L.; McNulty, M.A.; Carlson, C.S.; Callahan, M.; Ferguson, C.; Fetrow, J.S. Disease progression and phasic changes in gene expression in a mouse model of osteoarthritis. PLoS ONE 2013, 8, e54633. [Google Scholar] [CrossRef] [Green Version]
- JChang, C.; Sebastian, A.; Murugesh, D.K.; Hatsell, S.; Economides, A.N.; Christiansen, B.A.; Loots, G.G. Global molecular changes in a tibial compression induced ACL rupture model of post-traumatic osteoarthritis. J. Orthop. Res. 2017, 35, 474–485. [Google Scholar] [CrossRef]
- Sebastian, A.; Chang, J.C.; Mendez, M.E.; Murugesh, D.K.; Hatsell, S.; Economides, A.N.; Christiansen, B.A.; Loots, G.G. Comparative Transcriptomics Identifies Novel Genes and Pathways Involved in Post-Traumatic Osteoarthritis Development and Progression. Int. J. Mol. Sci. 2018, 19, 2657. [Google Scholar] [CrossRef] [Green Version]
- Kung, L.H.W.; Ravi, V.; Rowley, L.; Bell, K.M.; Little, C.B.; Bateman, J.F. Comprehensive Expression Analysis of microRNAs and mRNAs in Synovial Tissue from a Mouse Model of Early Post-Traumatic Osteoarthritis. Sci. Rep. 2017, 7, 17701. [Google Scholar] [CrossRef] [Green Version]
- Zhang, R.; Fang, H.; Chen, Y.; Shen, J.; Lu, H.; Zeng, C.; Ren, J.; Zeng, H.; Li, Z.; Chen, S.; et al. Gene expression analyses of subchondral bone in early experimental osteoarthritis by microarray. PLoS ONE 2012, 7, e32356. [Google Scholar] [CrossRef] [Green Version]
- Tang, F.; Lao, K.; Surani, M.A. Development and applications of single-cell transcriptome analysis. Nat. Methods 2011, 8, S6–S11. [Google Scholar] [CrossRef]
- Jonason, J.H.; Hoak, D.; O′Keefe, R.J. Primary murine growth plate and articular chondrocyte isolation and cell culture. Methods Mol. Biol. 2015, 1226, 11–18. [Google Scholar]
- Christiansen, B.A.; Anderson, M.J.; Lee, C.A.; Williams, J.C.; Yik, J.H.; Haudenschild, D.R. Musculoskeletal changes following non-invasive knee injury using a novel mouse model of post-traumatic osteoarthritis. Osteoarthr. Cartil. 2012, 20, 773–782. [Google Scholar] [CrossRef] [Green Version]
- Chang, J.C.; Christiansen, B.A.; Murugesh, D.K.; Sebastian, A.; Hum, N.R.; Collette, N.M.; Hatsell, S.; Economides, A.N.; Blanchette, C.D.; Loots, G.G. SOST/Sclerostin Improves Posttraumatic Osteoarthritis and Inhibits MMP2/3 Expression After Injury. J. Bone Miner Res. 2018, 33, 1105–1113. [Google Scholar] [CrossRef] [Green Version]
- Butler, A.; Hoffman, P.; Smibert, P.; Papalexi, E.; Satija, R. Integrating single-cell transcriptomic data across different conditions, technologies, and species. Nat. Biotechnol. 2018, 36, 411–420. [Google Scholar] [CrossRef]
- Sebastian, A.; Hum, N.R.; Martin, K.A.; Gilmore, S.F.; Peran, I.; Byers, S.W.; Wheeler, E.K.; Coleman, M.A.; Loots, G.G. Single-Cell Transcriptomic Analysis of Tumor-Derived Fibroblasts and Normal Tissue-Resident Fibroblasts Reveals Fibroblast Heterogeneity in Breast Cancer. Cancers 2020, 12, 1307. [Google Scholar] [CrossRef]
- Trapnell, C.; Cacchiarelli, D.; Grimsby, J.; Pokharel, P.; Li, S.; Morse, M.; Lennon, N.J.; Livak, K.J.; Mikkelsen, T.S.; Rinn, J.L. The dynamics and regulators of cell fate decisions are revealed by pseudotemporal ordering of single cells. Nat. Biotechnol. 2014, 32, 381–386. [Google Scholar] [CrossRef] [Green Version]
- Chen, J.; Bardes, E.E.; Aronow, B.J.; Jegga, A.G. ToppGene Suite for gene list enrichment analysis and candidate gene prioritization. Nucleic Acids Res. 2009, 37, W305–W311. [Google Scholar] [CrossRef]
- Zhou, Y.; Zhou, B.; Pache, L.; Chang, M.; Khodabakhshi, A.H.; Tanaseichuk, O.; Benner, C.; Chanda, S.K. Metascape provides a biologist-oriented resource for the analysis of systems-level datasets. Nat. Commun. 2019, 10, 1523. [Google Scholar] [CrossRef]
- Haseeb, A.; Kc, R.; Angelozzi, M.; de Charleroy, C.; Rux, D.; Tower, R.J.; Yao, L.; da Silva, R.P.; Pacifici, M.; Qin, L.; et al. SOX9 keeps growth plates and articular cartilage healthy by inhibiting chondrocyte dedifferentiation/osteoblastic redifferentiation. Proc. Natl. Acad. Sci. USA 2021, 118, e2019152118. [Google Scholar] [CrossRef]
- Scott, R.E.; Ghule, P.N.; Stein, J.L.; Stein, G.S. Cell cycle gene expression networks discovered using systems biology: Significance in carcinogenesis. J. Cell Physiol. 2015, 230, 2533–2542. [Google Scholar] [CrossRef] [Green Version]
- Zhong, L.; Yao, L.; Tower, R.J.; Wei, Y.; Miao, Z.; Park, J.; Shrestha, R.; Wang, L.; Yu, W.; Holdreith, N.; et al. Single cell transcriptomics identifies a unique adipose lineage cell population that regulates bone marrow environment. Elife 2020, 9, e54695. [Google Scholar] [CrossRef] [Green Version]
- Muhl, L.; Genove, G.; Leptidis, S.; Liu, J.; He, L.; Mocci, G.; Sun, Y.; Gustafsson, S.; Buyandelger, B.; Chivukula, I.V.; et al. Single-cell analysis uncovers fibroblast heterogeneity and criteria for fibroblast and mural cell identification and discrimination. Nat. Commun. 2020, 11, 3953. [Google Scholar] [CrossRef] [PubMed]
- Tikhonova, A.N.; Dolgalev, I.; Hu, H.; Sivaraj, K.K.; Hoxha, E.; Cuesta-Dominguez, A.; Pinho, S.; Akhmetzyanova, I.; Gao, J.; Witkowski, M.; et al. The bone marrow microenvironment at single-cell resolution. Nature 2019, 569, 222–228. [Google Scholar] [CrossRef]
- Thomson, B.R.; Carota, I.A.; Souma, T.; Soman, S.; Vestweber, D.; Quaggin, S.E. Targeting the vascular-specific phosphatase PTPRB protects against retinal ganglion cell loss in a pre-clinical model of glaucoma. Elife 2019, 8, e48474. [Google Scholar] [CrossRef]
- Esteves, C.L.; Donadeu, F.X. Pericytes and their potential in regenerative medicine across species. Cytom. A 2018, 93, 50–59. [Google Scholar] [CrossRef] [PubMed] [Green Version]
- Shen, J.; Shrestha, S.; Yen, Y.H.; Scott, M.A.; Soo, C.; Ting, K.; Peault, B.; Dry, S.M.; James, A.W. The pericyte antigen RGS5 in perivascular soft tissue tumors. Hum. Pathol. 2016, 47, 121–131. [Google Scholar] [CrossRef] [PubMed] [Green Version]
- Hess, D.L.; Kelly-Goss, M.R.; Cherepanova, O.A.; Nguyen, A.T.; Baylis, R.A.; Tkachenko, S.; Annex, B.H.; Peirce, S.M.; Owens, G.K. Perivascular cell-specific knockout of the stem cell pluripotency gene Oct4 inhibits angiogenesis. Nat. Commun. 2019, 10, 967. [Google Scholar] [CrossRef] [PubMed]
- Gault, C.R.; Obeid, L.M.; Hannun, Y.A. An overview of sphingolipid metabolism: From synthesis to breakdown. Adv. Exp. Med. Biol. 2010, 688, 1–23. [Google Scholar]
- Luo, M.; Chen, J.; Li, S.; Sun, H.; Zhang, Z.; Fu, Q.; Li, J.; Wang, J.; Hughes, C.E.; Caterson, B.; et al. Changes in the metabolism of chondroitin sulfate glycosaminoglycans in articular cartilage from patients with Kashin-Beck disease. Osteoarthr. Cartil. 2014, 22, 986–995. [Google Scholar] [CrossRef] [Green Version]
- Tasdelen, I.; Berger, R.; Kalkhoven, E. PPARgamma regulates expression of carbohydrate sulfotransferase 11 (CHST11/C4ST1), a regulator of LPL cell surface binding. PLoS ONE 2013, 8, e64284. [Google Scholar] [CrossRef] [Green Version]
- Soul, J.; Barter, M.J.; Little, C.B.; Young, D.A. OATargets: A knowledge base of genes associated with osteoarthritis joint damage in animals. Ann. Rheum. Dis. 2020. [Google Scholar] [CrossRef]
- Li, J.; Dong, S. The Signaling Pathways Involved in Chondrocyte Differentiation and Hypertrophic Differentiation. Stem. Cells Int. 2016, 2016, 2470351. [Google Scholar] [CrossRef] [Green Version]
- Bian, Q.; Cheng, Y.H.; Wilson, J.P.; Su, E.Y.; Kim, D.W.; Wang, H.; Yoo, S.; Blackshaw, S.; Cahan, P. A single cell transcriptional atlas of early synovial joint development. Development 2020, 147, dev185777. [Google Scholar] [CrossRef]
- Kozhemyakina, E.; Lassar, A.B.; Zelzer, E. A pathway to bone: Signaling molecules and transcription factors involved in chondrocyte development and maturation. Development 2015, 142, 817–831. [Google Scholar] [CrossRef] [Green Version]
- Myllarniemi, M.; Tikkanen, J.; Hulmi, J.J.; Pasternack, A.; Sutinen, E.; Ronty, M.; Lepparanta, O.; Ma, H.; Ritvos, O.; Koli, K. Upregulation of activin-B and follistatin in pulmonary fibrosis—A translational study using human biopsies and a specific inhibitor in mouse fibrosis models. BMC Pulm. Med. 2014, 14, 170. [Google Scholar] [CrossRef] [Green Version]
- Song, Z.; Chen, W.; Athavale, D.; Ge, X.; Desert, R.; Das, S.; Han, H.; Nieto, N. Osteopontin takes center stage in chronic liver disease. Hepatology 2020. [Google Scholar] [CrossRef]
- Kishimoto, H.; Akagi, M.; Zushi, S.; Teramura, T.; Onodera, Y.; Sawamura, T.; Hamanishi, C. Induction of hypertrophic chondrocyte-like phenotypes by oxidized LDL in cultured bovine articular chondrocytes through increase in oxidative stress. Osteoarthr. Cartil. 2010, 18, 1284–1290. [Google Scholar] [CrossRef] [Green Version]
- Mokuda, S.; Nakamichi, R.; Matsuzaki, T.; Ito, Y.; Sato, T.; Miyata, K.; Inui, M.; Olmer, M.; Sugiyama, E.; Lotz, M.; et al. Wwp2 maintains cartilage homeostasis through regulation of Adamts5. Nat. Commun. 2019, 10, 2429. [Google Scholar] [CrossRef]
- Mendez, M.E.; Murugesh, D.K.; Sebastian, A.; Hum, N.R.; McCloy, S.A.; Kuhn, E.A.; Christiansen, B.A.; Loots, G.G. Antibiotic Treatment Prior to Injury Improves Post-Traumatic Osteoarthritis Outcomes in Mice. Int. J. Mol. Sci. 2020, 21, 6424. [Google Scholar] [CrossRef]
- Mendez, M.E.; Sebastian, A.; Murugesh, D.K.; Hum, N.R.; McCool, J.L.; Hsia, A.W.; Christiansen, B.A.; Loots, G.G. LPS-Induced Inflammation Prior to Injury Exacerbates the Development of Post-Traumatic Osteoarthritis in Mice. J. Bone Miner Res. 2020. [Google Scholar] [CrossRef]
- Sebastian, A.; Murugesh, D.K.; Mendez, M.E.; Hum, N.R.; Rios-Arce, N.D.; McCool, J.L.; Christiansen, B.A.; Loots, G.G. Global Gene Expression Analysis Identifies Age-Related Differences in Knee Joint Transcriptome during the Development of Post-Traumatic Osteoarthritis in Mice. Int. J. Mol. Sci. 2020, 21, 364. [Google Scholar] [CrossRef] [Green Version]
- Lefebvre, V.; Behringer, R.R.; de Crombrugghe, B. L-Sox5, Sox6 and Sox9 control essential steps of the chondrocyte differentiation pathway. Osteoarthr. Cartil. 2001, 9 (Suppl. SA), S69–S75. [Google Scholar] [CrossRef] [Green Version]
- Greenblatt, M.B.; Ritter, S.Y.; Wright, J.; Tsang, K.; Hu, D.; Glimcher, L.H.; Aliprantis, A.O. NFATc1 and NFATc2 repress spontaneous osteoarthritis. Proc. Natl. Acad. Sci. USA 2013, 110, 19914–19919. [Google Scholar] [CrossRef] [Green Version]
- Yoshida, C.A.; Yamamoto, H.; Fujita, T.; Furuichi, T.; Ito, K.; Inoue, K.; Yamana, K.; Zanma, A.; Takada, K.; Ito, Y.; et al. Runx2 and Runx3 are essential for chondrocyte maturation, and Runx2 regulates limb growth through induction of Indian hedgehog. Genes Dev. 2004, 18, 952–963. [Google Scholar] [CrossRef] [Green Version]
- Spater, D.; Hill, T.P.; O’sullivan, R.J.; Gruber, M.; Conner, D.A.; Hartmann, C. Wnt9a signaling is required for joint integrity and regulation of Ihh during chondrogenesis. Development 2006, 133, 3039–3049. [Google Scholar] [CrossRef] [Green Version]
- Elayyan, J.; Lee, E.J.; Gabay, O.; Smith, C.A.; Qiq, O.; Reich, E.; Mobasheri, A.; Henrotin, Y.; Kimber, S.J.; Dvir-Ginzberg, M. LEF1-mediated MMP13 gene expression is repressed by SIRT1 in human chondrocytes. FASEB J. 2017, 31, 3116–3125. [Google Scholar] [CrossRef] [Green Version]
- Seuffert, F.; Weidner, D.; Baum, W.; Schett, G.; Stock, M. Upper zone of growth plate and cartilage matrix associated protein protects cartilage during inflammatory arthritis. Arthritis Res. Ther. 2018, 20, 88. [Google Scholar] [CrossRef] [Green Version]
- Wu, C.L.; Dicks, A.; Steward, N.; Tang, R.; Katz, D.B.; Choi, Y.R.; Guilak, F. Single cell transcriptomic analysis of human pluripotent stem cell chondrogenesis. Nat. Commun. 2021, 12, 362. [Google Scholar] [CrossRef]
- Davidson, E.N.B.; Vitters, E.L.; van Lent, P.L.; van de Loo, F.A.; van den Berg, W.B.; van der Kraan, P.M. Elevated extracellular matrix production and degradation upon bone morphogenetic protein-2 (BMP-2) stimulation point toward a role for BMP-2 in cartilage repair and remodeling. Arthritis Res. Ther. 2007, 9, R102. [Google Scholar] [CrossRef] [Green Version]
- Shu, B.; Zhang, M.; Xie, R.; Wang, M.; Jin, H.; Hou, W.; Tang, D.; Harris, S.E.; Mishina, Y.; O’Keefe, R.J.; et al. BMP2, but not BMP4, is crucial for chondrocyte proliferation and maturation during endochondral bone development. J. Cell Sci. 2011, 124, 3428–3440. [Google Scholar] [CrossRef] [PubMed] [Green Version]
- Pengas, I.; Eldridge, S.; Assiotis, A.; McNicholas, M.; Mendes, J.E.; Laver, L. MMP-3 in the peripheral serum as a biomarker of knee osteoarthritis, 40 years after open total knee meniscectomy. J. Exp. Orthop. 2018, 5, 21. [Google Scholar] [CrossRef] [PubMed]
- Wang, M.; Sampson, E.R.; Jin, H.; Li, J.; Ke, Q.H.; Im, H.J.; Chen, D. MMP13 is a critical target gene during the progression of osteoarthritis. Arthritis Res. Ther. 2013, 15, R5. [Google Scholar] [CrossRef] [Green Version]
- Chou, C.H.; Lee, M.T.; Song, I.W.; Lu, L.S.; Shen, H.C.; Lee, C.H.; Wu, J.Y.; Chen, Y.T.; Kraus, V.B.; Wu, C.C. Insights into osteoarthritis progression revealed by analyses of both knee tibiofemoral compartments. Osteoarthr. Cartil. 2015, 23, 571–580. [Google Scholar] [CrossRef] [Green Version]
- Tong, Z.; Liu, Y.; Chen, B.; Yan, L.; Hao, D. Association between MMP3 and TIMP3 polymorphisms and risk of osteoarthritis. Oncotarget 2017, 8, 83563–83569. [Google Scholar] [CrossRef] [Green Version]
- Valdes, A.M.; Loughlin, J.; Timms, K.M.; van Meurs, J.J.; Southam, L.; Wilson, S.G.; Doherty, S.; Lories, R.J.; Luyten, F.P.; Gutin, A.; et al. Genome-wide association scan identifies a prostaglandin-endoperoxide synthase 2 variant involved in risk of knee osteoarthritis. Am. J. Hum. Genet. 2008, 82, 1231–1240. [Google Scholar] [CrossRef] [PubMed] [Green Version]
- Styrkarsdottir, U.; Lund, S.H.; Thorleifsson, G.; Zink, F.; Stefansson, O.A.; Sigurdsson, J.K.; Juliusson, K.; Bjarnadottir, K.; Sigurbjornsdottir, S.; Jonsson, S.; et al. Meta-analysis of Icelandic and UK data sets identifies missense variants in SMO, IL11, COL11A1 and 13 more new loci associated with osteoarthritis. Nat. Genet. 2018, 50, 1681–1687. [Google Scholar] [CrossRef] [PubMed]
- Mastbergen, S.C.; Jansen, N.W.; Bijlsma, J.W.; Lafeber, F.P. Differential direct effects of cyclo-oxygenase-1/2 inhibition on proteoglycan turnover of human osteoarthritic cartilage: An in vitro study. Arthritis Res. Ther. 2006, 8, R2. [Google Scholar] [CrossRef] [Green Version]
- De Boer, T.N.; Huisman, A.M.; Polak, A.A.; Niehoff, A.G.; van Rinsum, A.C.; Saris, D.; Bijlsma, J.W.; Lafeber, F.J.; Mastbergen, S.C. The chondroprotective effect of selective COX-2 inhibition in osteoarthritis: Ex vivo evaluation of human cartilage tissue after in vivo treatment. Osteoarthr. Cartil. 2009, 17, 482–488. [Google Scholar] [CrossRef] [Green Version]
- Davidson, R.K.; Jupp, O.; de Ferrars, R.; Kay, C.D.; Culley, K.L.; Norton, R.; Driscoll, C.; Vincent, T.L.; Donell, S.T.; Bao, Y.; et al. Sulforaphane represses matrix-degrading proteases and protects cartilage from destruction in vitro and in vivo. Arthritis Rheum. 2013, 65, 3130–3140. [Google Scholar] [CrossRef] [Green Version]
- Bie, Q.; Jin, C.; Zhang, B.; Dong, H. IL-17B: A new area of study in the IL-17 family. Mol. Immunol. 2017, 90, 50–56. [Google Scholar] [CrossRef]
- Kurowska-Stolarska, M.; Alivernini, S. Synovial tissue macrophages: Friend or foe? RMD Open 2017, 3, e000527. [Google Scholar] [CrossRef]
- Brandt, K.D.; Radin, E.L.; Dieppe, P.A.; van de Putte, L. Yet more evidence that osteoarthritis is not a cartilage disease. Ann. Rheum. Dis. 2006, 65, 1261–1264. [Google Scholar] [CrossRef]
- Loeser, R.F.; Goldring, S.R.; Scanzello, C.R.; Goldring, M.B. Osteoarthritis: A disease of the joint as an organ. Arthritis Rheum. 2012, 64, 1697–1707. [Google Scholar] [CrossRef] [Green Version]


Publisher’s Note: MDPI stays neutral with regard to jurisdictional claims in published maps and institutional affiliations. |
© 2021 by the authors. Licensee MDPI, Basel, Switzerland. This article is an open access article distributed under the terms and conditions of the Creative Commons Attribution (CC BY) license (https://creativecommons.org/licenses/by/4.0/).
Share and Cite
Sebastian, A.; McCool, J.L.; Hum, N.R.; Murugesh, D.K.; Wilson, S.P.; Christiansen, B.A.; Loots, G.G. Single-Cell RNA-Seq Reveals Transcriptomic Heterogeneity and Post-Traumatic Osteoarthritis-Associated Early Molecular Changes in Mouse Articular Chondrocytes. Cells 2021, 10, 1462. https://doi.org/10.3390/cells10061462
Sebastian A, McCool JL, Hum NR, Murugesh DK, Wilson SP, Christiansen BA, Loots GG. Single-Cell RNA-Seq Reveals Transcriptomic Heterogeneity and Post-Traumatic Osteoarthritis-Associated Early Molecular Changes in Mouse Articular Chondrocytes. Cells. 2021; 10(6):1462. https://doi.org/10.3390/cells10061462
Chicago/Turabian StyleSebastian, Aimy, Jillian L. McCool, Nicholas R. Hum, Deepa K. Murugesh, Stephen P. Wilson, Blaine A. Christiansen, and Gabriela G. Loots. 2021. "Single-Cell RNA-Seq Reveals Transcriptomic Heterogeneity and Post-Traumatic Osteoarthritis-Associated Early Molecular Changes in Mouse Articular Chondrocytes" Cells 10, no. 6: 1462. https://doi.org/10.3390/cells10061462