Article

Radiative and Non-Radiative Recombination Pathways in Mixed-Phase TiO2 Nanotubes for PEC Water-Splitting

1
Regional Centre of Advanced Technologies and Materials, Faculty of Science, Palacký University Olomouc, 17. listopadu 1192/12, 771 46 Olomouc, Czech Republic
2
Department of Materials Science and Engineering, University of Erlangen-Nuremberg, Martensstrasse 7, D-91058 Erlangen, Germany
*
Authors to whom correspondence should be addressed.
Catalysts 2019, 9(2), 204; https://doi.org/10.3390/catal9020204
Submission received: 22 January 2019 / Revised: 18 February 2019 / Accepted: 19 February 2019 / Published: 23 February 2019
(This article belongs to the Special Issue Nanostructured Materials for Photocatalysis)

Abstract

:
Anatase and rutile mixed-phase TiO2 with an ideal ratio has been proven to significantly enhance photoelectrochemical (PEC) activity in water-splitting applications due to suppressing the electron–hole recombination. However, the mechanism of this improvement has not been satisfactory described yet. The PEC water oxidation (oxygen evolution) at the interface of TiO2 photoanode and electrolyte solution is determined by the fraction of the photogenerated holes that reach the solution and it is defined as the hole transfer efficiency. The surface and bulk recombination processes in semiconductor photoanodes majorly influence the hole transfer efficiency. In this work, we study the hole transfer process involved in mixed-phase TiO2 nanotube arrays/solution junction using intensity-modulated photocurrent and photovoltage spectroscopy (IMPS and IMVS); then, we correlate the obtained hole transfer rate constants to (photo)electrochemical impedance spectroscopy (PEIS) measurements. The results suggest that the enhanced performance of the TiO2 mixed-phase is due to the improved hole transfer rate across the TiO2/liquid interface as well as to the decrease in the surface trap recombination of the holes.

Graphical Abstract

1. Introduction

Since the discovery of water photo-oxidation at semiconducting photoanodes, tremendous research has been undertaken to improve the practical efficiency of photoelectrochemical (PEC) water-splitting devices [1,2]. Upon proper light illumination, a semiconductor generates electron–hole pairs that must be adequately separated to simultaneously complete water oxidation and reduction processes [3,4,5]. However, in practice, the recombination of the photoinduced electron–hole pairs in the bulk of the materials, as well as at the electrode/electrolyte interface, limits the overall efficiency associated with photoelectrodes for PEC water-splitting [4,5,6,7,8]. Several strategies have been reported to minimize the recombination processes in semiconductor photoelectrodes, such as: increasing conductivity with doping [9,10,11,12], heterojunction formation [7,13,14], modification of photoanode surface with co-catalysts [15,16,17], and coatings of thin conformal layers using atomic layer deposition (ALD) [18,19,20]. Among these, the heterojunction formation has been widely reported for different combinations of materials and is proved to be particularly effective for the charge separation in photoelectrodes [7,13,14]. This strategy has already been successfully employed for titanium dioxide (TiO2), which is one of the most investigated materials in PEC water-splitting [12,21,22,23] thanks to its abundance, low toxicity, and chemical stability in harsh environments under light illumination [7,8]. The heterojunctions have been mostly realized by coupling TiO2 with other semiconductor materials [13,14,24,25] but also using only TiO2 and exploiting the slight bandgap offset (0.2 eV) of the anatase and rutile phases: this has been widely reported for photocatalytic water-splitting, in which the commercially available P25 TiO2 powder is often employed [26,27]. The charge separation effect between the two phases, leading to increased photocatalytic efficiency, has been initially explained by an electron transfer from anatase to rutile due to the 0.2 eV higher conduction band minimum (CBM) of anatase with respect to rutile [21,28,29]. However, in 2003 Hurum et al. examined this phenomenon by means of EPR (Electron Paramagnetic Resonance Spectroscopy) experiments, suggesting that electrons could move from rutile to anatase trap states, allowing holes to reach the surface for photocatalytic reactions [30]. More recent calculations and experiments, furthermore, have suggested that the CBM of rutile is higher in energy than that of anatase, enabling the electron transfer from the former to the latter and a hole transfer in the opposite direction [31,32,33,34]. From the above discussion, it can be understood that the charge transfer/separation effect in mixed-phase TiO2 nanomaterials has not been fully clarified, especially considering PEC photoelectrodes, which have been investigated in much fewer studies compared to the nanoparticulate forms. For example, it has been shown that TiO2 photoelectrodes with a controlled anatase/rutile configuration could be obtained by rapid thermal treatments [34,35,36] thus, avoiding complex or costly synthetic processes to make a composite of different polymorphs. To probe the charge transport and charge transfer properties of such photoelectrodes, occurring respectively in the bulk and at the semiconductor/electrolyte junction, perturbation PEC techniques may be employed, such as light intensity-modulated photocurrent spectroscopy (IMPS), light intensity-modulated photovoltage spectroscopy (IMVS) and electrochemical impedance spectroscopy (EIS) [37,38,39,40]. Here, we report on the study of the bulk and surface state recombination processes in single and mixed-phase TiO2 nanotube photoanodes by employing IMPS and IMVS to gain information on non-radiative recombination (i.e., electron/hole recombination mediated by emission of phonons). Nanotubes are chosen as a suitable morphology for TiO2 photoanodes due to their high surface to volume ratio, preferential electron transport towards the Ti back-contact, and a scalable synthetic process by electrochemical anodization [7,24,41,42,43,44]. Further, we correlate the obtained results to electrical characteristics of our photoelectrodes retrieved from EIS and to the information on radiative recombination (i.e., electron/hole recombination mediated by emission of photons) gained by photoluminescence spectroscopy. In this way, we provide a complete picture regarding the charge transfer/transport properties associated with TiO2 nanotubes samples. The obtained results provide more insights on the working principles of mixed-phase TiO2 photoelectrodes: the photocurrent enhancement is underlied by lower radiative recombination and, at the same time, by a more efficient hole transfer and the decrease in the surface state recombination across the TiO2/electrolyte interface.

2. Results and Discussion

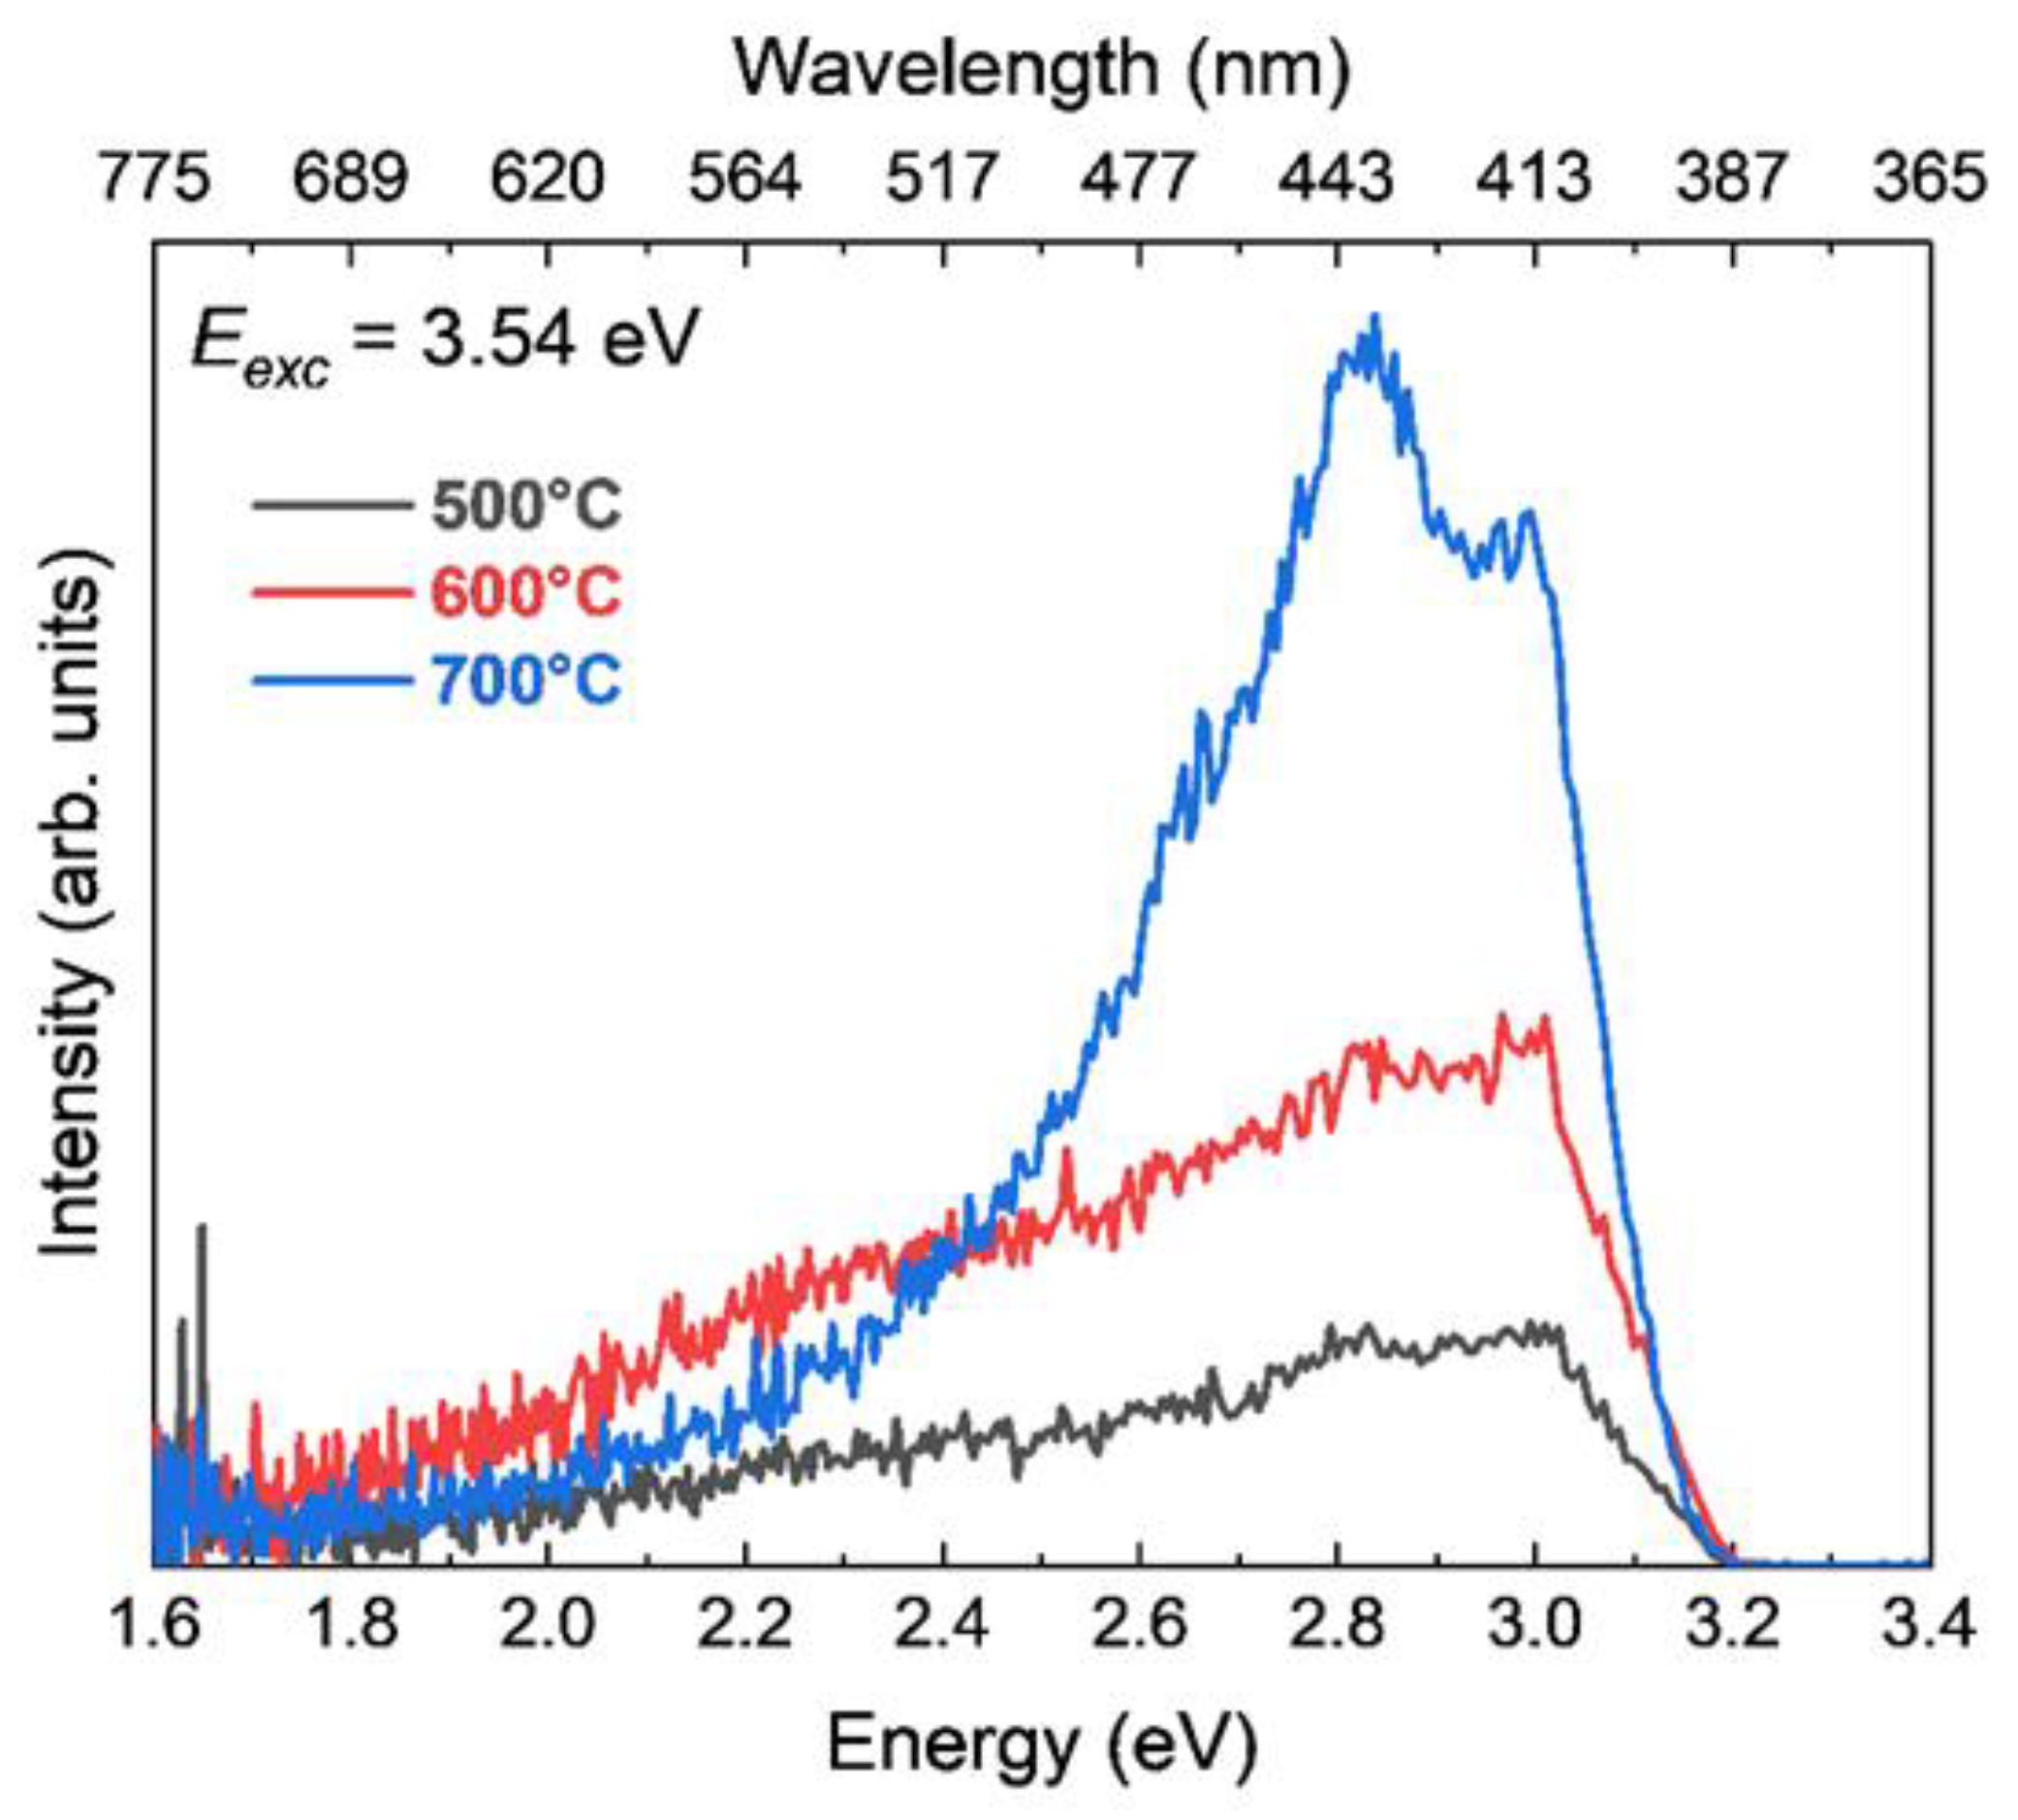
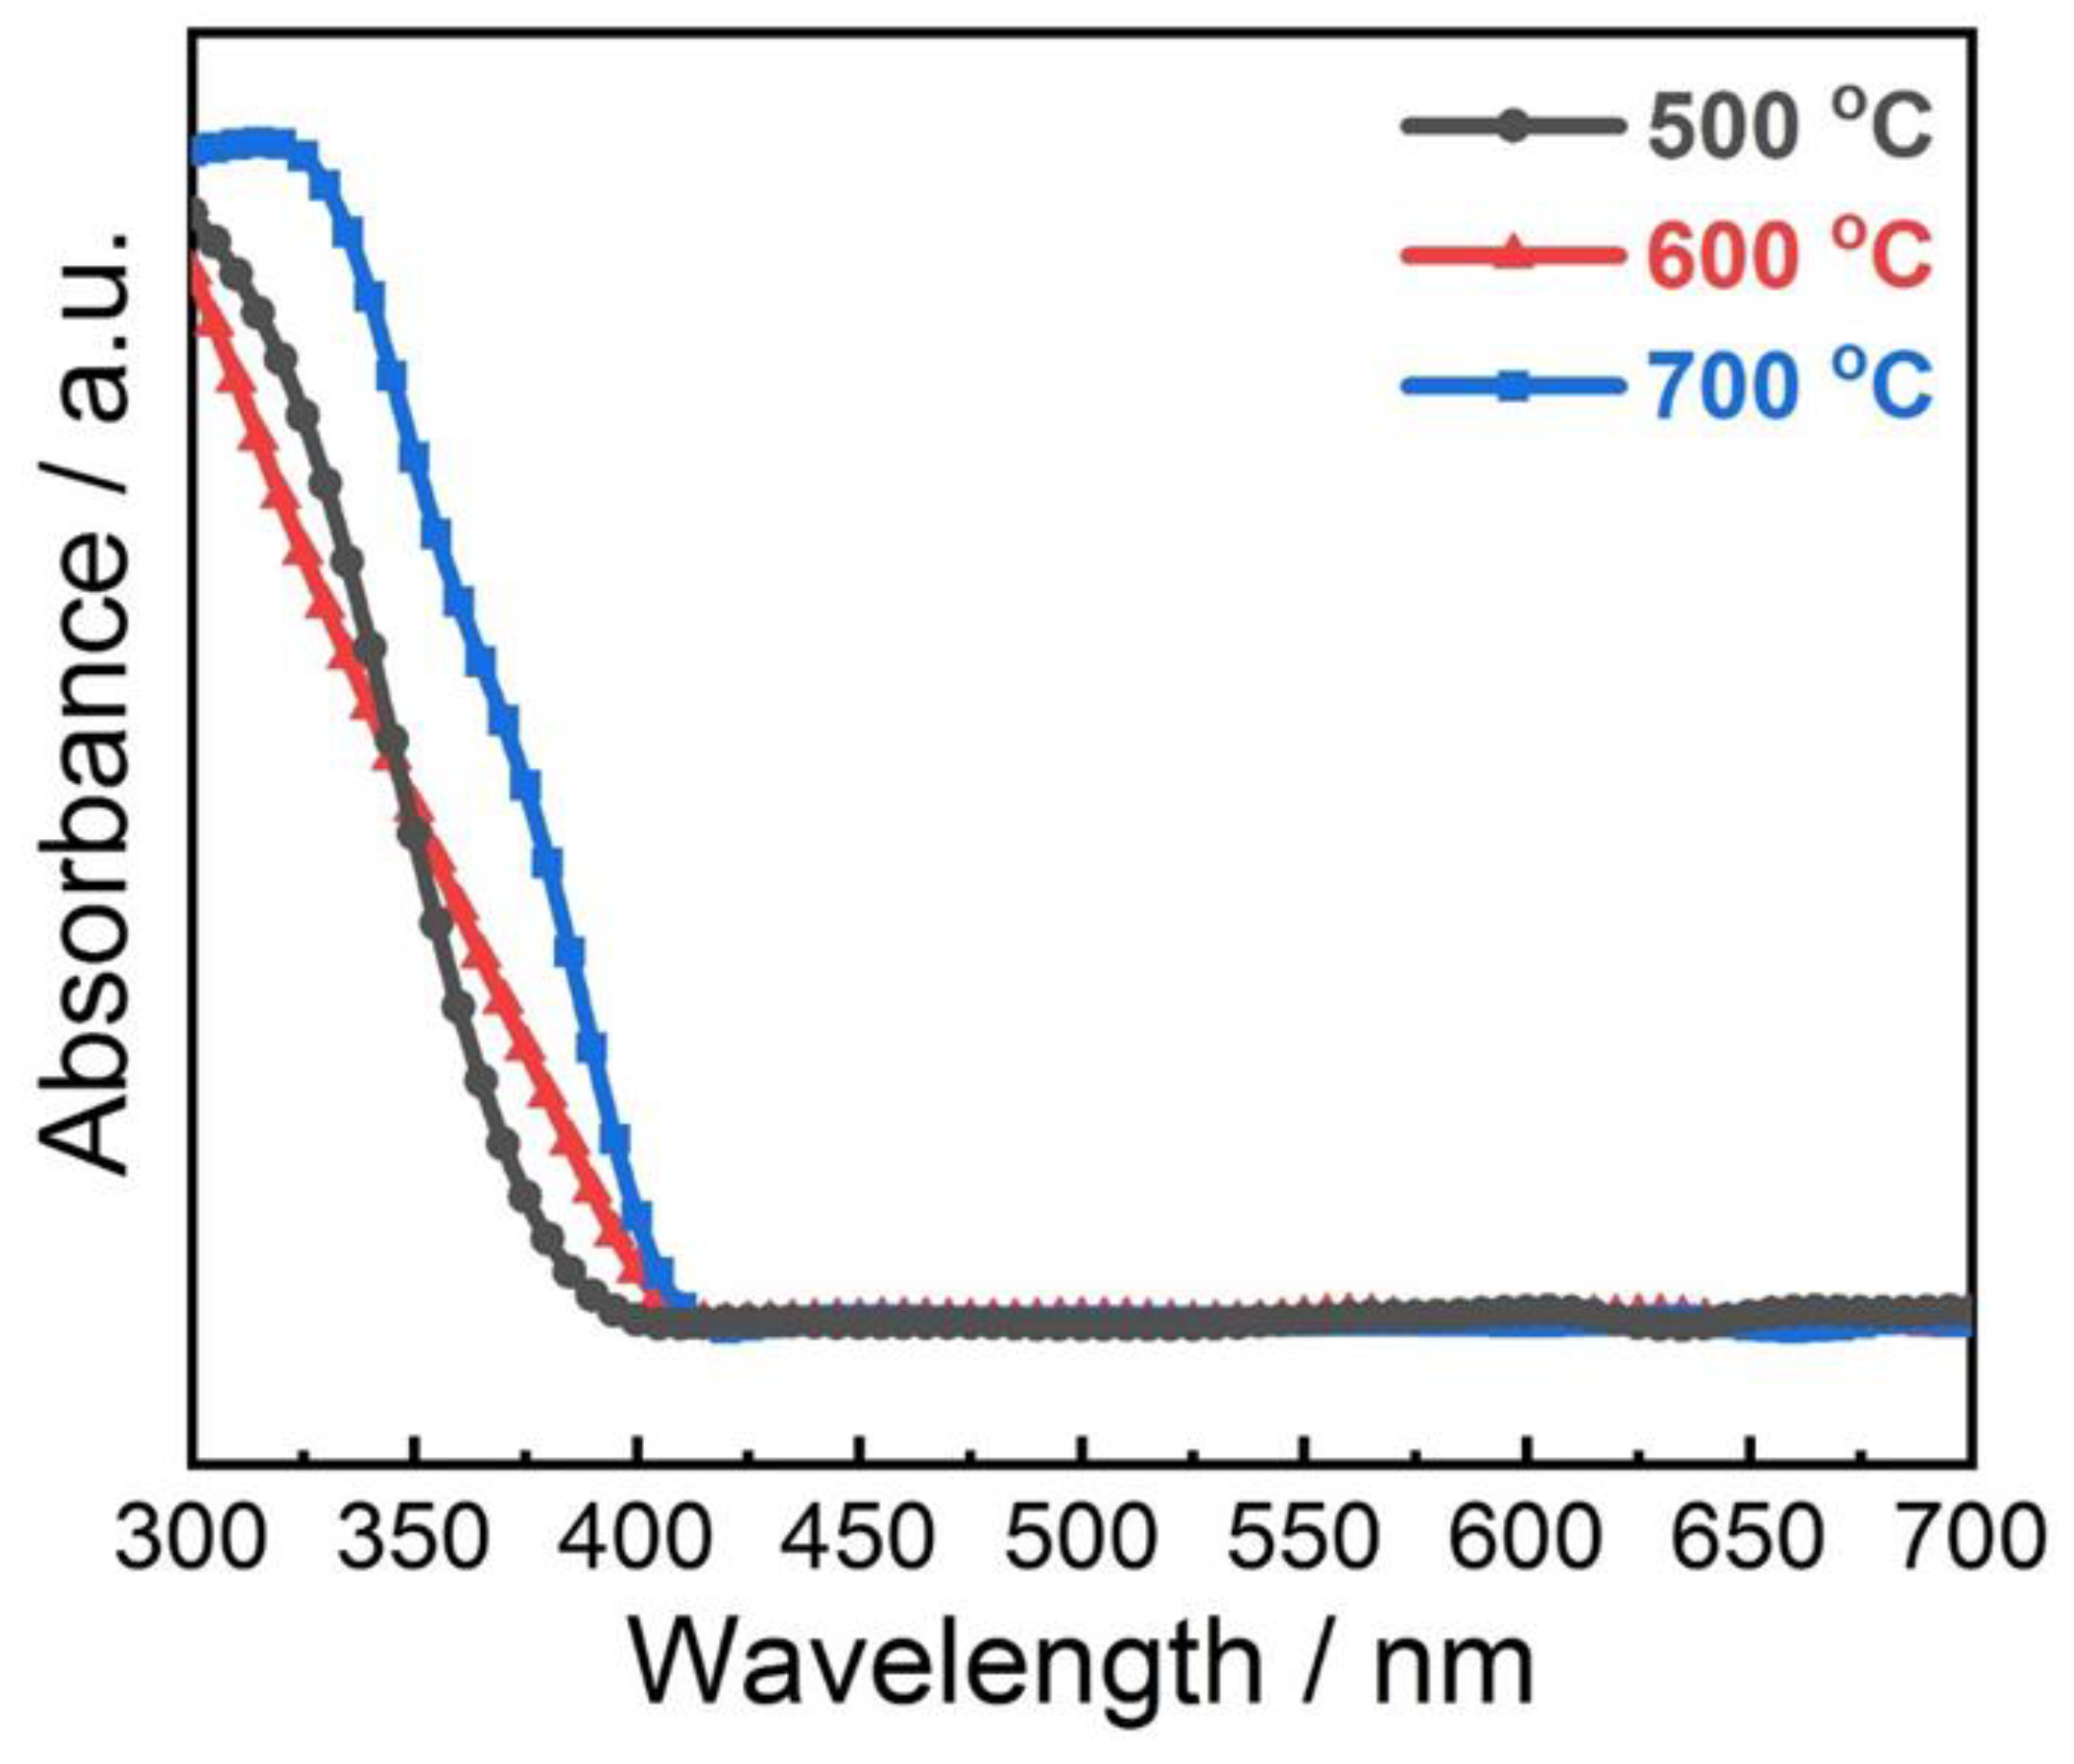
2.1. Structural and Optical Properties

The TiO2 nanotubes obtained from the electrochemical anodization were annealed at different temperatures; the corresponding FESEM images are shown in Figure 1. The average length of the nanotubes is ~2 µm, the internal diameter is about 90 nm, and the wall thickness is ~20 nm. The as-prepared nanotubes are amorphous in nature and are transformed to the crystalline state upon annealing in air.
To analyze the variation of the phase composition upon annealing, XRD patterns were recorded (Figure 2a). The TiO2 nanotubes annealed at 500 °C (TNT500) show reflections belonging to the sole presence of the anatase phase. However, upon increasing the annealing temperature, a rise of rutile phase fraction was observed. It is known that Ti metal beneath the TiO2 nanotubes readily oxidizes and forms the rutile layer at the Ti/TiO2 interface during the annealing [45,46,47]. This rutile layer acts as an initiation layer for further conversion of anatase to rutile in the TiO2 nanotubes [48,49,50] (See Figure S1). In contrast, in the absence of the Ti metal, the formation of rutile layer and subsequent transition from anatase to rutile was not observed [46,49]. Further, the rutile layer formed due to thermal oxidation observed to be thicker with the shorter nanotubes because of the increase in the proximity of the metal to the top surface of the nanotubes [47,49]. Moreover, recent studies suggest that during the phase transition from anatase to rutile, the as-formed rutile layer plays a crucial role in further distortion of the TiO6 octahedral across the interface of the Ti metal/nanotube and the reformation of the Ti-O bonds into the rutile phase. This process gradually continues along the tube length upon the temperature increase [48,50]. In our samples, the rutile phase appeared at 600 °C (TNT600) and it was confirmed in XRD patterns by the peak at 27.72° corresponding to (110) plane (JCPDS file no. 87-0920). Conversely, for the sample annealed at 700 °C (TNT700), the dominant phase is rutile; this indicates the transformation of a maximum number of anatase grains to rutile starting from the interface of the Ti metal and the nanotubes [48,50]. This transformation creates a layered structure of the TiO2 nanotubes with rutile content at the bottom, anatase layer at the top, and an intermediate gradual transformation layer between the two phases of the nanotubes [50], resulting in the heterojunction between the two phases of TiO2. The phase fraction of TiO2 nanotubes annealed at different temperatures retrieved through Rietveld refinement of XRD measurements.
The phase composition of TNT500 was 100% in anatase, while the weight ratio of rutile to anatase was determined 18:82 and 77:23 for TNT600 and TNT700, respectively. It indicates an increase in the rutile layer thickness upon the increase in the calcination temperature [49,50,51].
The crystallite size (grain growth) was calculated using the Debye–Sherrer formula shown below
d = 0.9λ/(β cosθ),
where d is crystallite size, λ is wavelength (0.154 nm) of X-rays, β is full-width half maximum in radians, and θ is the angle of diffraction.
As the annealing temperature changes, the decrease in anatase crystallite size and the transformation of anatase to rutile were observed. The crystallite size for TNT500 was 58 ± 2 nm corresponding to (101) planes, whereas it was decreased to 42 ± 3 for sample TNT600. At the same time, the rutile crystallization was observed and the size corresponding to (110) for TNT600 is 34 ± 1 nm. A further change in annealing temperature showed an increase of rutile crystallite size up to 74 ± 2 nm for the sample TNT700. During the process of annealing the distortion of TiO6 octahedra takes places, which leads to the shrinking in size of anatase crystallite and transformation to rutile. [52,53,54].
The Raman spectra of the TiO2 nanotube samples are shown in Figure 2b. The intense peak at 144 cm−1 and the other peaks at 391 cm−1, 513 cm−1, 638 cm−1 correspond to Eg(1), B1g, A1g+B1g, and Eg(3) modes, which belong to anatase TiO2 [34,55]. Further, the appearance of the peaks at 451 cm−1, 610 cm−1, and the second order peak at 240 cm−1, besides the peak at 144 cm−1, indicates the presence of rutile in TNT700 [55]. The observation of a small peak at 199 cm−1 suggests that the annealed samples are highly crystalline. Asymmetric broadening and shift in Eg(1) the Raman peak position (inset of Figure 2b) indicates the existence of intrinsic defects and a crystallite size variation in the TiO2 nanotubes annealed at different temperatures [54,56].
Phase content and microcrystalline structure were further analyzed using HR-TEM (Figure 3). The tube morphology is smooth for TNT500 in comparison to TNT600 (Figure 3a,c). Further, the lattice fringe spacing was 0.35 nm, corresponding to the (101) plane of anatase for the sample TNT500. The phase junction of anatase and rutile is observed for the sample TNT600, and the lattice fringe spacing 0.32 nm was assigned to the (110) rutile plane. The boundary line shown in Figure 3d represents phase junction and corresponding FFT images is also presented. The observation of anatase and rutile phases is well in agreement with the XRD and Raman measurements.
Further, in order to investigate the intrinsic recombination processes and the presence of defects, we carried out photoluminescence (PL) measurements on the TiO2 nanotube samples annealed at different temperatures (with 350 nm or 3.54 eV excitation), as illustrated in Figure 4. It can be noted that: first, the higher the annealing temperature, the higher the PL signal; second, the low signal/noise ratio for all the samples, due to the weak emission of TiO2 in air [57]; and third, the broad shape of all the PL curves, which suggests the presence of several recombination pathways. The spectra presented in Figure 4 were fitted with four Gaussian components (see Figure S5) with the following peak energies: 2.21–2.29 eV, 2.58–2.68 eV, 2.84–2.85 eV, and 3.00–3.02 eV. The same peaks were found independently on the phase composition of the nanotubes. The PL of rutile is characterized by an intense and narrow peak in the NIR region (1.48 eV or 835 nm) [57,58,59,60]; thus, the spectra in Figure 4, which show emissions occurring in the visible region, may be related only to the anatase PL. For this phase, emissions with sub-bandgap energies have been widely attributed to radiative recombination mediated by defect states. However, the PL of TiO2 nanomaterials is strongly dependent on the material morphology, crystallinity, and defectivity, which leads to conflicting results in the literature [61]. The curves in Figure 4, in particular, are similar to the PL spectra reported by Lei et al. [62], who investigated highly ordered anatase nanowires. Based on their report and on other studies, the following spectral assignments may be proposed. The highest energy peak (3.00 eV) may be attributed to self-trapped exciton recombination in TiO6 octahedra [57]. The peaks at 2.85 eV and at 2.58–2.68 eV may be related to oxygen vacancies [59,60,63], which exhibit a different energy level in the bandgap according to their charge state [64,65,66]. Finally, the lowest energy peak (2.21–2.29 eV) may be attributed to surface states, i.e., radiative recombination involving unsaturated Ti atoms on the surface (e.g., Ti3+) [57,63,67]. It should be noted that precise and univocal identification of the defect states in TiO2 nanotubes was not the main scope of this work; rather, the PL measurements overall suggest that with the increasing fraction of rutile, radiative recombination in the remaining anatase crystals increase, thus, affecting the charge transport properties of the films. This effect may be explained by the fact that the rutile crystallites nucleate with a lower amount of defects. Alternatively, the increase of rutile fraction may induce the formation of trapping sites in anatase crystals at their interfaces with rutile ones [33]. In any case, the TNT600 sample could represent a good compromise between better charge separation (enabled by the presence of both anatase and rutile phases) and radiative recombination (mainly occurring via the defect states in anatase crystals).
The UV-Vis absorbance spectra for all the TiO2 nanotube samples are shown in Figure 5. The onset of the optical absorption for TNT500 is observed at 390 nm corresponding to a band gap of ~3.18 eV, while for TNT600 and TNT700 red-shifted at 410 nm (~3 eV) due to the presence of rutile content in the samples. The UV-Vis absorbance spectra for all the TiO2 nanotube samples are shown in Figure 5. The onset of the optical absorption for TNT500 is observed at 390 nm corresponding to a band gap of ~3.18 eV, while for TNT600 and TNT700 red-shifted at 410 nm (~3 eV) due to the presence of rutile content in the samples.

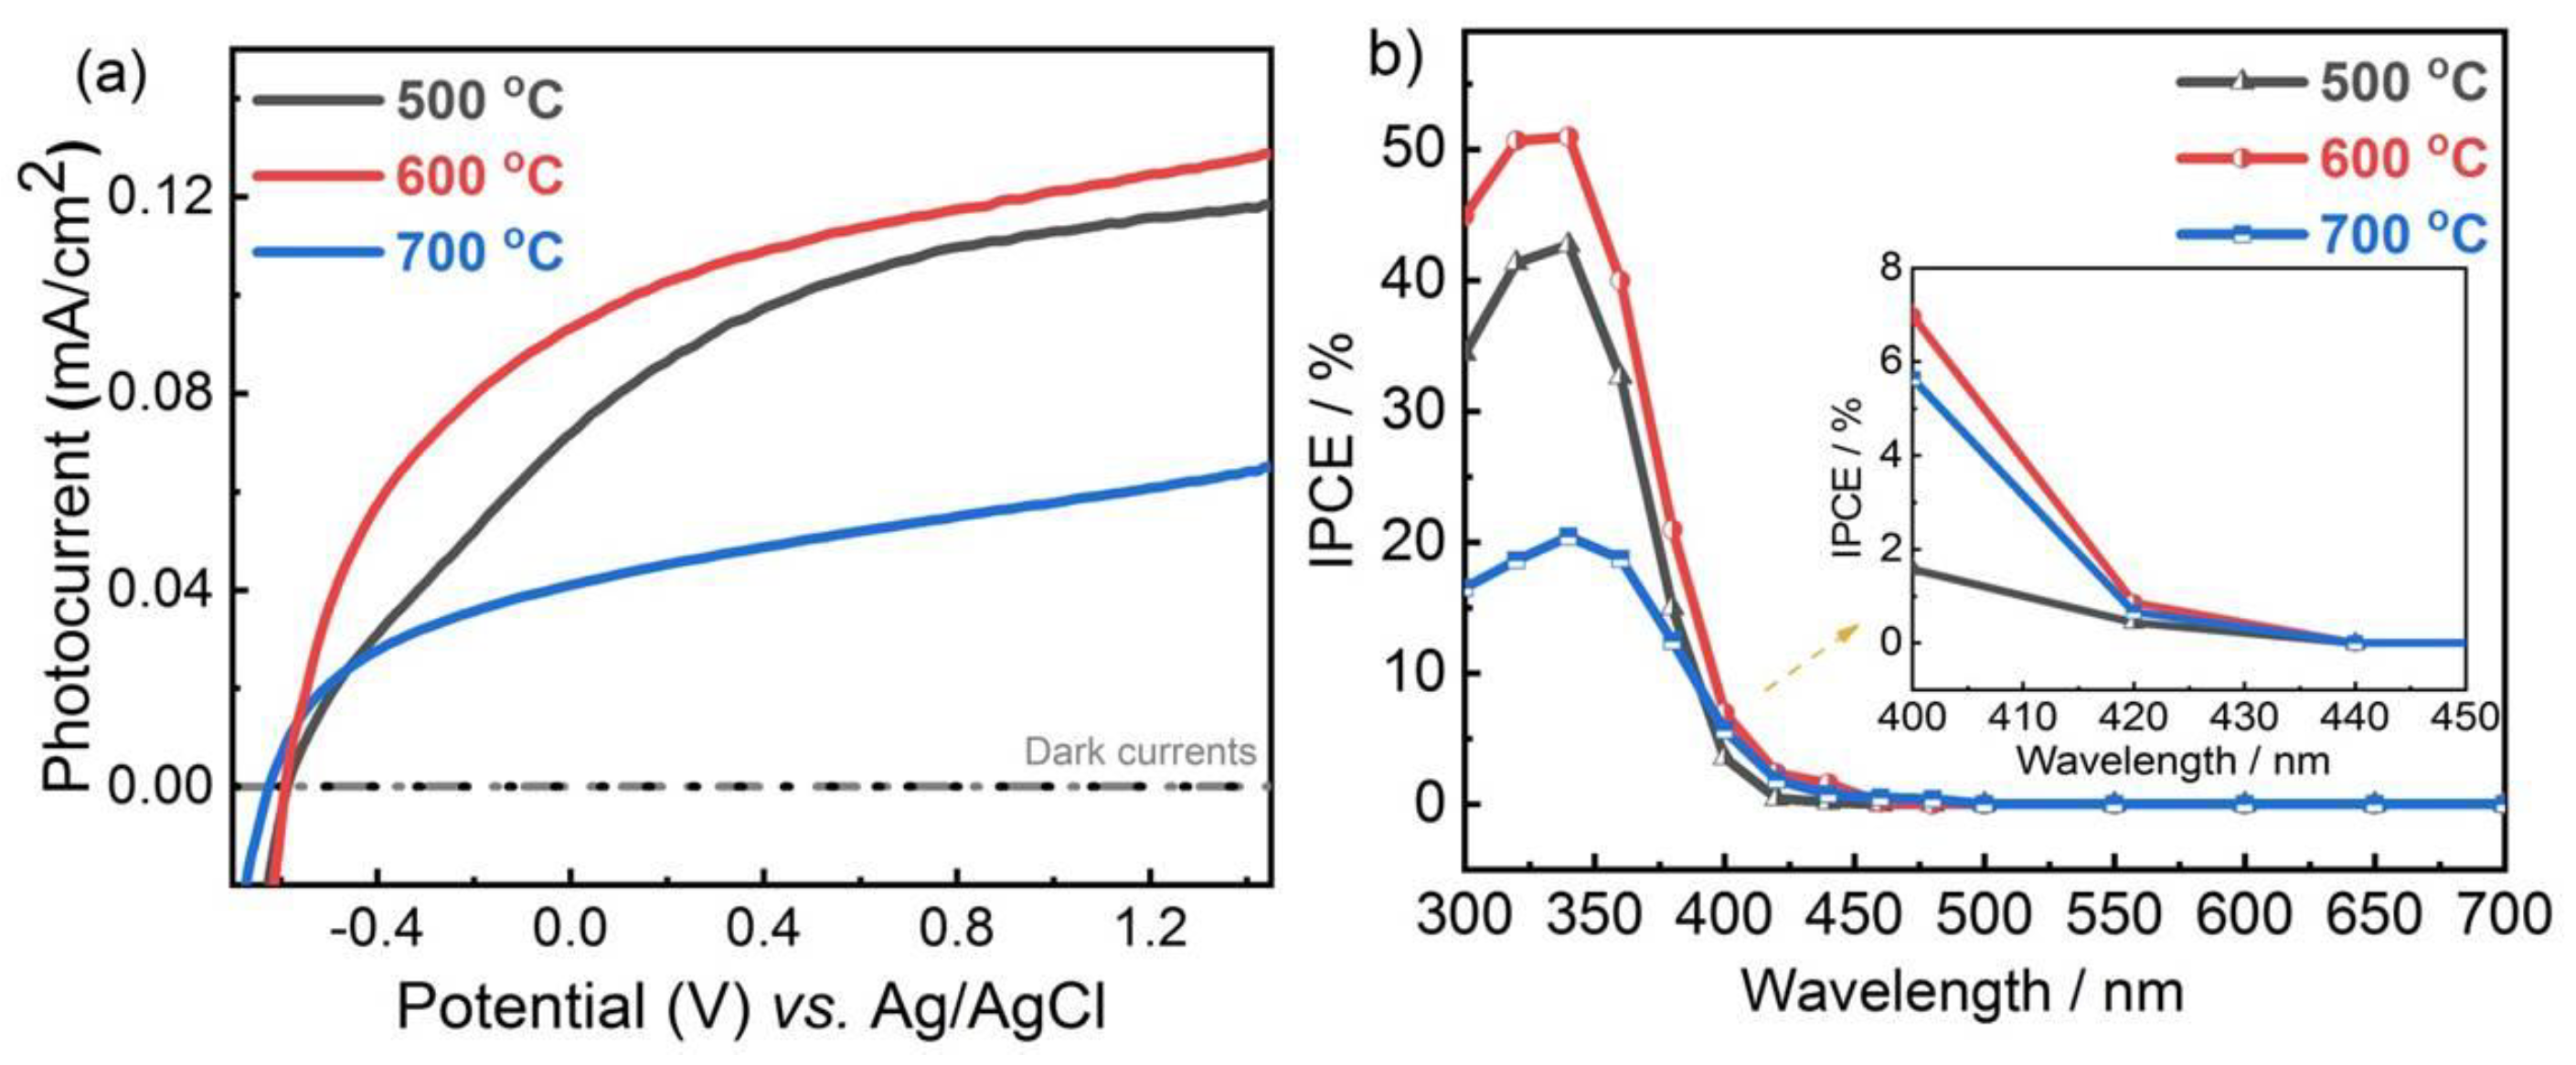
2.2. Photoelectrochemical Measurements

Linear sweep voltammetry (LSV) scans were recorded for the prepared samples under dark and illumination conditions using a three-electrode setup in 1 M NaOH solution against Ag/AgCl reference electrode. Figure 6a shows photocurrent measurements for TNT500, 600, and 700 under AM1.5G illumination. All samples show approximately the same photocurrent onset potential of −0.59 V vs. Ag/AgCl while showing a different steady-state photocurrent. Sample TNT600 showed the highest photocurrent density (0.11 mA cm−2 at 0.5 V vs. Ag/AgCl) followed by TNT500 (0.10 mA cm−2 at 0.5 V vs. Ag/AgCl) and TNT700 (0.05 mA cm−2 at 0.5 V vs. Ag/AgCl). In addition, the photocurrent plots reveal that TNT600 had also a higher fill factor if compared to TNT500. To gain further information on the effect of the anatase/rutile heterojunction on the PEC performance of our samples, we carried out IPCE measurements at 0.5 V vs. Ag/AgCl (Figure 6b). The IPCE is defined as the ratio between the measured photocurrent and the power of the incident photons from the following relationship [23]
IPCE (%) = (1240/λ) × (Jph/Ilight) × 100,
where λ is the incident wavelength in nm, Jph is the photocurrent density in mA cm−2 and Ilight is the intensity of the incident light in mW cm−2. The spectra showed high IPCE % below 400 nm because of significant absorption of UV light for above bandgap excitation. The measured IPCE for TNT600 is 52% at 370 nm, whereas for TNT500 it was 42% and decreased to 21% in the case of TNT700 sample. The same trend was reflected in the photocurrent measurements. However, for samples TNT600 and TNT700, there was a little higher (0.05) IPCE % observed in the wavelength region 400–420 nm, well in agreement with the absorption spectra and the increased light absorption related to rutile phase content.
From these measurements, it is clear that the sample which contains a proper ratio of the anatase and rutile phases (TNT600) shows the highest photocurrent density compared to the single anatase phase (TNT500) and the highest rutile content phase sample (TNT700). This effect is in agreement with previous studies [40], but cannot simply be explained by the results of PL (Figure 4) or absorption (Figure 5) spectroscopy. Indeed, the effect of non-radiative recombination must also be taken into account, which is significant in TiO2 [57]. Thus, to analyze the photocurrent enhancement and the recombination pathways in these samples in more detail, we employed intensity-modulated photocurrent and photovoltage (IMPS, IMVS) and electrochemical impedance spectroscopy (EIS) techniques. Figure 7 shows representative plots of IMPS, IMVS and EIS spectra (Figure 7a–c, respectively), measured at −0.5 V vs. Ag/AgCl, and a schematic of an equivalent circuit used for the EIS data fitting (Figure 7d).

2.3. Intensity-Modulated Photocurrent Spectroscopy (IMPS)

IMPS is a perturbation method used to extract charge transfer kinetics across the semiconductor/electrolyte interface by a sinusoidal variation of the illumination light intensity (see Figure S3). The rate constants corresponding to both charge transfer and surface recombination were derived from the normalized IMPS spectra [68,69,70]. The complex Nyquist photocurrent response plots were recorded using a small sinusoidal perturbation light signal. The representative normalized IMPS plots obtained for TiO2 nanotubes at −0.5 V vs. Ag/AgCl are shown in Figure 7a. Further, the rate constants were extracted using Equation (3) below. The ratio of low-frequency intercept to high-frequency intercept (LFI to HFI) in Figure 7a corresponds to the charge transfer efficiency as shown in the equation below [69,70].
ηct = Jss/Jinst = ktrans/(ktrans + krec) = LFI/HFI,
In Equation (4), the HFI in recombination semicircle (Figure 7a) represents instantaneous photocurrent and LFI corresponds to steady state photocurrent.
The time constant of the process is ωmax = ktrans + krec and it can be determined from the maximum of recombination semicircle perturbation frequency in a complex plane. Since the real part of semicircle at ω = 0 tends towards I0(ktrans/(ktrans + krec)), the radial maximum is assumed to occur at ktrans + krec [68]. The diameter of the positive semicircle corresponding to normalized IMPS spectra in Figure 7a is smaller for TNT600 followed by samples TNT500 and TNT700, thus, suggesting the higher hole transfer ability of TNT600 compared to TNT500 and TNT700 samples. The calculated rate constants for both the hole transfer (Ktr) and the surface recombination of the holes (Ksr) are shown in Figure 8a,b. The maximum hole transfer rate is observed at the onset potential for all the samples and it decreased with increasing potentials, to finally become constant at higher potentials. TNT600 showed the highest hole transfer rate indicating the highest concentration of hole flux towards the solution. Further, the surface recombination rate constant is lower at potentials greater than 0 V leading to a decrease in surface state recombination. Further, it is to be noted that the overall photocurrent enhancement depends on the charge transfer efficiency (ηct) as shown in Figure 8c, and it is higher for TNT600 followed by samples TNT500 and TNT700. These results shed more light on the increased performance of the TNT600: compared to the pure anatase photoanode (TNT500), the sample with low rutile content exhibits a higher charge transfer efficiency across the electrode/electrolyte interface, which greatly affects the magnitude of the photocurrent. This may be related to the presence of several anatase/rutile interfaces close to the electrolyte, leading to an efficient charge separation between the two phases.

2.4. Intensity-Modulated Photovoltage Spectroscopy (IMVS)

To examine the bulk electron transport properties of the TiO2 nanotubes, we carried out the IMVS measurements with varying light intensity at open circuit conditions. The representative plots are shown in Figure 7b. The electron lifetime was calculated using the formula below:
τn = 1/(2πfmin (IMVS)),
where fmin is the minimum frequency of IMVS plot, τn is electron lifetime.
The electron lifetime is higher for TNT500 and TNT600 compared to TNT700 indicating that higher rutile content significantly increases the electron–hole recombination, in agreement with PL results. In order to confirm these results, we carried out additional PEC-EIS measurements as discussed below.

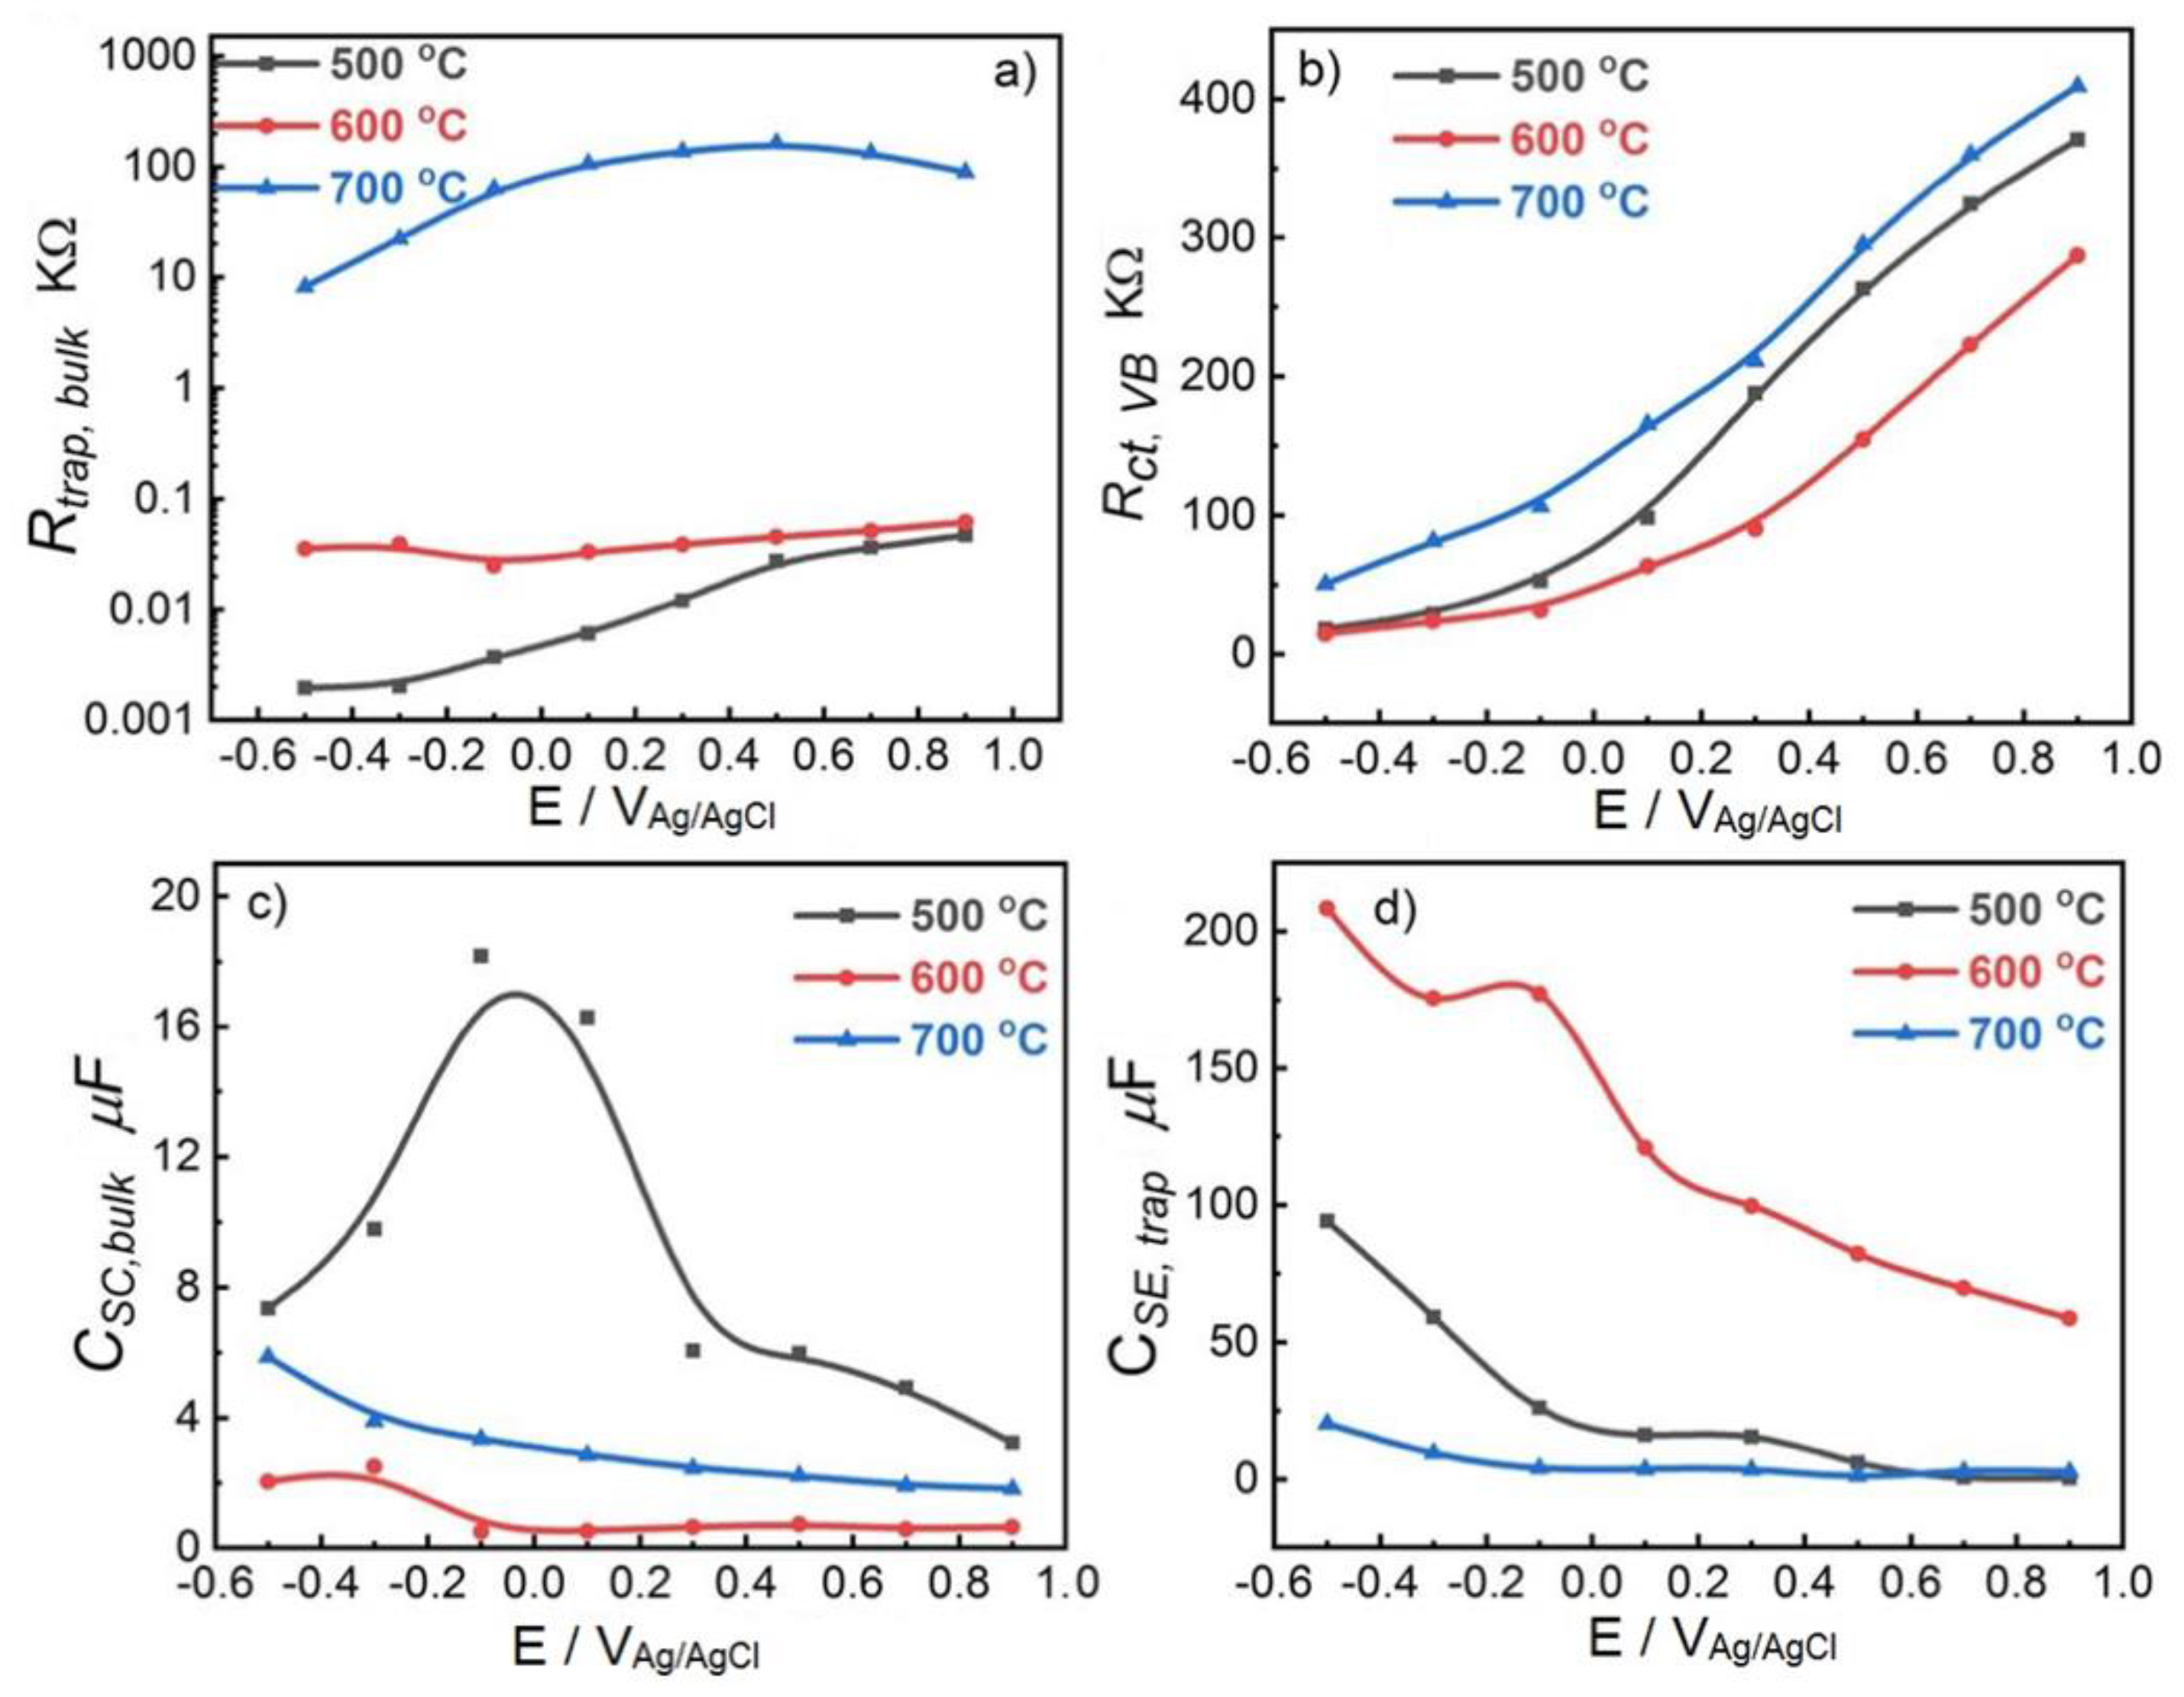
2.5. Electrochemical Impedance Spectroscopy (EIS)

To correlate the charge transport, charge transfer, and recombination rate constants achieved from IMPS and IMVS measurements, we additionally carried out EIS measurements under 1 sun illumination in a frequency range of 0.1–105 Hz (see Figure S4). The representative spectra are shown in Figure 7c. The measured impedance data at each potential were fitted using the equivalent circuit reported in Figure 7d. The selection of the right equivalent circuit is crucial to extract the proper parameters [68]. This circuit has been previously employed for hematite (α-Fe2O3) as well as for TiO2 nanotubes, neglecting charge transfer via surface states [38,71,72,73]. In wide bandgap semiconductors like TiO2, the surface trap states act as spectators and then the hole transfer mainly occurs via the valence band as shown in the schematic reported in Figure 7d. (typical water oxidation process across photoanode/electrolyte illustrated in Figure S2). In the equivalent circuit, Rs is the solution resistance, CSC,bulk is the bulk capacitance or space charge layer capacitance corresponding to hole diffusion into the space charge layer, Rtrap,bulk is the bulk transport resistance related to electron–hole recombination from the valence band to the conduction band of TiO2; Rct,VB is the hole transfer resistance from the valence band of TiO2 to the solution; CSE,trap represents the Helmholtz capacitance or capacitance of double layer (CPE2 in equivalent circuit), which is also called the TiO2/solution interfacial capacitance and it suggests the hole transfer ability of the TiO2 nanotubes to the electrolyte [68,70].
The constant phase element (CPE) can be expressed as
ZCPE = (1/C) jωn−1,
where C is ideal capacitance, j is an imaginary number, ω is angular frequency, and n indicates microscopic roughness or slow adsorption of chemical species on TiO2 electrode (for ideal capacitance behavior n = 1).
A smaller semicircular arch of the Nyquist plot is observed for the TNT600 sample compared to TNT500 and TNT700 (Figure 7c), indicating a lower charge transfer resistance and in turn an increased charge transfer rate to the electrolyte. Figure 9 shows the bulk charge transport resistance (Rtrap,bulk) at different potentials for TNT500, 600, and 700. The charge transport resistance is lower for TNT500, followed by TNT600 (very similar) and TNT700. These results generally agree with PL results, where TNT700 showed the highest radiative recombination. In PL case though, TNT600 shows a slightly higher recombination than TNT500. This small discrepancy reflects the different conditions utilized in PL and EIS experiments: the former, indeed, were carried out in air (i.e., dried sample exposed to molecular O2) and in open circuit, while the latter in basic pH under an applied bias, which can change the occupation of trap levels in the bandgap [74]. The increase in rutile content produces an increased Rtrap,bulk (sample annealed at 700 °C); this is consistent with the recombination time constant or electron lifetime (τn) extracted from IMVS measurements (Figure 8d) and with solid state conductivity measurements [75]. The charge transfer resistance (Rct,trap) across TiO2 nanotube/electrolyte interface is shown in Figure 9b. A monotonic increase in Rct,trap was observed for all the samples with an increase in potential. This results from the increase in the hole flux upon increasing the bias potential as well as the recombination of the excess holes across the TNT/electrolyte interface [38]. The trend correlates to the photocurrent saturation observed at higher potentials. As obtained Rct,trap is lower for TNT600 compared to the single phase (TNT500) and the excess rutile phase content (TNT700), behaving accordingly with the charge transfer rate and collection efficiency shown in Figure 8a,c. This result emphasizes the increase in hole transfer rate towards the solution interface in the case of TNT600, i.e., when a proper anatase/rutile content is present in the material. Figure 9c shows the space charge layer capacitance (CSC,bulk) obtained from impedance data fitting. These values are one order of magnitude smaller compared to the double layer capacitance (CSE,trap), analogues to the negligible separation of charges in the space charge layer formed in TNT600 and TNT700, which results from the increase in bulk recombination, and it is consistent with Rtrap,bulk. However, a different trend in CSC,bulk of TNT500 was observed compared to TNT600 and TNT700. The increase in CSC,bulk until 0 V vs. Ag/AgCl and later its monotonic decay indicates the slow diffusion and the separation of charges into the space charge layer because of the absence of the heterojunction, whereas in case of TNT600 and TNT700, the junction between the two phases avoids charge accumulation. Figure 9d shows the variation of double layer capacitance (CSE,trap) for TNT600, TNT500, and TNT700. The most efficient sample (i.e., TNT600) shows significantly higher values of CSE,trap at all potentials, proving the accumulation of a higher concentration of the holes at the interface of TNT600/electrolyte compared to the other samples [71,73]. The monotonic decay in CSE,trap indicates that at a higher potential, the holes accumulate less in the photoanode/solution thus, contributing to generate higher current.
The charge transfer via the surface states in the TiO2 nanotubes has been reported to be negligible [38] thus, the overall performance of the photoanodes can be assessed by the sum of the recombination resistance (Rbulk,trap) and the charge transfer resistance (Rct,trap) across the TiO2 nanotube/solution interface (considering solution resistance Rs to be the same for all photoanodes) [73]. The sum Rbulk,trap + Rct,trap is smaller for TNT600 followed by TNT500 and TNT700, which corresponds to hole transfer rate constant Ktr (k1 in Figure S2a) and confirms once again the higher hole transfer ability of the mixed-phase TiO2 nanotubes annealed at 600 °C (TNT600), which results in higsher performance associated with TNT600 than that of TNT500 and 700. Figure S6, shows the Mott–Schottky plots of the photoanodes.

3. Materials and Methods

TiO2 nanotubes were grown by electrochemical anodization from titanium foil. Prior to anodization, Ti foil (Goodfellow, 0.125 mm thick) was cleaned in a solution composed of isopropyl alcohol, acetone, and deionized with equal volume ratio followed by rinsing in DI water.
Eventually, the substrates were dried with nitrogen stream before mounting onto the anodization setup. A typical anodization setup consists of a PTFE (Teflon) beaker and two electrodes, in which Ti foil was the working electrode and Pt foil the counter electrode. The electrolyte comprises 98 mL ethylene glycol (Sigma Aldrich, St.Louis, MO, USA), 2 mL DI water, and 0.25 wt% NH4F.HF. A DC voltage of 60 V was applied between the two electrodes keeping the distance 2 cm. After anodization the samples were cleaned in DI water and annealed in air at different temperatures for 30 min, keeping constant heating and cooling rates of 1 °C min−1.

3.1. Characterization

The morphology of the TiO2 nanotubes was characterized using a field emission scanning electron microscope (FESEM) Hitachi SU 6600 (Hitachi, Tokyo, Japan). The X-ray diffraction patterns were measured with an Empyrean (PANalytical, Almelo, The Netherlands) diffractometer equipped with Co radiation source. The absorbance and PL was measured using an FLS980 fluorescence spectrometer (Edinburg Instruments, Livingston, UK). The Raman spectra were collected using a DXR Raman spectroscope (Thermo Scientific, Waltham, MA, USA) and using a laser operating at a wavelength of 633 nm with laser power of 5 mW. The Raman spectra were evaluated using instrument control software (OMNIC, version 8, Thermo Scientific, Waltham, MA, USA). For TEM measurements, a High-Resolution Transmission Electron Microscope (HRTEM) Titan G2 (FEI, Waltham, MA, USA); accelerating voltage 80 kV was used. Images were taken with BM UltraScan CCD camera (Gatan, CA, USA).

3.2. Photoelectrochemical Measurements

The photocurrent measurements were carried out with a standard three-electrode electrochemical cell using Gamry series G 300 potentiostat (Gamry Instruments, Warminster, PA, USA) in 1 M NaOH solution (pH 13.5). The TiO2 nanotubes on Ti foil were used as working electrode with an active area of 0.28 cm2, Pt wire was the counter electrode, and Ag/AgCl (3 M KCl) was the reference electrode. A xenon lamp (150 W) equipped with AM1.5G filter was used as a light source. The illumination light intensity was 100 mW cm−2 (1 sun), calibrated using a silicon reference solar cell (Newport Corporation, Irvine, CA, USA). The electrochemical impedance measurements (EIS) were carried out using Gamry series G 300 potentiostat (Gamry Instruments, Warminster, PA, USA) in a frequency range 0.1 Hz to 105 Hz under 1 sun illumination. The incident photon-to-current conversion (IPCE) efficiency measurement was carried out using a xenon arc light source coupled to a Newport Oriel 1/8 Cornerstone monochromator. Electrolyte solutions were purged with nitrogen.
Intensity-modulated photocurrent spectroscopy (IMPS) and intensity-modulated photovoltage spectroscopy (IMVS) measurements were carried out using a Zahner PP 211 CIMPS (Zahner-Elektrik Gmbh & Co.KG, Kronach, Germany) setup with a LED of wavelength 369 nm in a frequency range 0.1 to 105 Hz. The TiO2 nanotube electrode was illuminated through the electrolyte side (1 M NaOH) with the fixed intensity of 80 mW cm−2. A sinusoidal perturbation of ~10% of the steady state illumination was superimposed on the constant base light intensity. The IMVS measurements were carried out at open circuit potential with varying power intensity of LED (369 nm). All measurements were performed against an Ag/AgCl reference electrode (3 M KCl), using Pt wire as a counter electrode.

4. Conclusions

In conclusion, mixed-phase TiO2 nanotubes have been fabricated using anodization of Ti foils and annealed at different temperatures to tune the phase composition of the nanotubes. The nanotubes annealed at 600 °C (TNT600) have the optimum anatase-to-rutile ratio (82:18) showing improved photocurrent compared to the single anatase phase (TNT500) and to the mixed-phase having a higher rutile content (77%, TNT700). To gain a better understanding of the mechanisms underlying the increase of performance, an analysis of both radiative (with PL spectroscopy) and non-radiative (with perturbative PEC techniques) recombination processes have been carried out. An increase of PL related to the increase of rutile fraction was found, revealing higher radiative recombination of electron–hole pairs mediated by the defects in anatase crystals or at their interface with rutile ones. On the other hand, the role of charge transport and of non-radiative recombination has been investigated with IMPS, IMVS, and EIS techniques. The rate constants related to the hole transfer and the recombination across the semiconductor/electrolyte interface have been retrieved and correlated to the electrical analogs obtained from fitting the EIS data to an equivalent circuit. The obtained results suggest that the increased hole transfer rate across the TiO2 nanotube/solution interface in mixed-phase samples is crucial in regulating the improved photocurrent observed in the mixed-phase nanotubes. Follow-up studies on nanostructured mixed-phase TiO2 electrodes are expected, aiming at further elucidating the enhancement mechanisms, studying the effect of different junctions (i.e., anatase/brookite), or optimizing the nanostructure to control the location of the different phases, which could allow a more efficient charge transport and, thus, higher performance.

Supplementary Materials

The following are available online at https://www.mdpi.com/2073-4344/9/2/204/s1.

Author Contributions

The authors thank Sergii Kalytchuk for his aid in photoluminescence spectroscopy measurements. R.Y. designed and performed the experiments; O.T. performed HR-TEM measurements; L.M. contributed to PL analysis; H.K. helped in IPCE measurements; R.Y., Š.K., A.N. analyzed the data and wrote the paper; P.S. and R.Z. supervised the project.

Funding

This research received no external funding.

Acknowledgments

The authors gratefully acknowledge the support by the Operational Programme Research, Development, and Education—European Regional Development Fund, project no. CZ.02.1.01/0.0/0.0/15_003/0000416. The authors thank Sergii Kalytchuk for his aid in photoluminescence spectroscopy measurements.

Conflicts of Interest

The authors declare no conflict of interest.

References

  1. Boddy, P.J. Oxygen evolution on semiconducting TiO2. J. Electrochem. Soc. 1968, 115, 199–203. [Google Scholar] [CrossRef]
  2. Fujishima, A.; Honda, K. Electrochemical photolysis of water at a semiconductor electrode. Nature 1972, 238, 37–38. [Google Scholar] [CrossRef] [PubMed]
  3. Krol, R.V.; Liang, Y.; Schoonman, J. Solar hydrogen production with nanostructured metal oxides. J. Mater. Chem. 2008, 18, 2311–2320. [Google Scholar] [CrossRef]
  4. Chen, Z.; Jaramillo, T.F.; Deutsch, T.G.; Shwarsctein, A.K.; Forman, A.J.; Gaillard, N.; Garland, R.; Takanabe, K.; Heske, C.; Sunkara, M.; et al. Accelerating materials development for photo-electrochemical hydrogen production: Standards for methods, definitions, and reporting protocols. J. Mater. Res. 2010, 25, 3–16. [Google Scholar] [CrossRef]
  5. Sivula, K.; Krol, R.V. Semiconducting materials for photo-electrochemical energy conversion. Nat. Rev. Mater. 2016, 1, 15010. [Google Scholar] [CrossRef]
  6. Kment, S.; Schmuki, P.; Hubicka, Z.; Machala, L.; Kirchgeorg, R.; Liu, N.; Wang, L.; Lee, K.; Olejnicek, J.; Cada, M.; et al. Photoanodes with fully controllable texture: The enhanced water-splitting efficiency of thin hematite films exhibiting solely (110) crystal orientation. ACS Nano 2015, 9, 7113–7123. [Google Scholar] [CrossRef] [PubMed]
  7. Lee, K.; Mazare, A.; Schmuki, P. One-Dimensional titanium dioxide nanomaterials: Nanotubes. Chem. Rev. 2014, 114, 9385–9454. [Google Scholar] [CrossRef] [PubMed]
  8. Chen, X.; Mao, S.S. Titanium dioxide nanomaterials: Synthesis, properties, modifications and applications. Chem. Rev. 2007, 107, 2891–2959. [Google Scholar] [CrossRef] [PubMed]
  9. Park, H.S.; Kweon, K.E.; Ye, H.; Paek, E.; Hwang, G.S.; Bard, A.J. Factors in the metal doping of BiVO4 for improved photoelectrocatalytic activity as studied by scanning electrochemical microscopy and first-principles density-functional calculation. J. Phys. Chem. C 2011, 115, 17870–17879. [Google Scholar] [CrossRef]
  10. Wang, J.; Tafen, D.N.; Lewis, J.P.; Hong, Z.; Manivannan, A.; Zhi, M.; Li, M.; Wu, N. Origin of photocatalytic activity of nitrogen-doped TiO2 nanobelts. J. Am. Chem. Soc. 2009, 131, 12290–12297. [Google Scholar] [CrossRef] [PubMed]
  11. Braun, A.; Akurati, K.K.; Fortunato, G.; Reifler, F.A.; Ritter, A.; Harvey, A.S.; Vital, A.; Graule, T. Nitrogen doping of TiO2 photocatalyst forms a second eg state in the oxygen 1s NEXAFS pre-edge. J. Phys. Chem. C 2010, 114, 516–519. [Google Scholar] [CrossRef]
  12. Khan, S.U.M.; Al-Shahry, M.; Ingler, W.B., Jr. Efficient photochemical water-splitting by a chemically modified n-TiO2. Science 2002, 297, 2243–2245. [Google Scholar] [CrossRef] [PubMed]
  13. Liu, C.; Tang, J.; Chen, H.M.; Liu, B.; Yang, P. A Fully integrated nanosystem of semiconductor nanowires for direct solar water-splitting. Nano Lett. 2013, 13, 2989–2992. [Google Scholar] [CrossRef] [PubMed]
  14. Liu, Z.; Guo, K.; Han, J.; Li, Y.; Cui, T.; Wang, B.; Ya, J.; Zhou, C. Dendritic TiO2/ln2S3/AgInS2 trilaminar core-shell branched nanoarrays and the enhanced activity for photo-electrochemical water-splitting. Small 2014, 10, 3153–3161. [Google Scholar] [CrossRef] [PubMed]
  15. Nakajima, H.; Mori, T.; Watanabe, M. Influence of platinum loading on photoluminescence of TiO2 powder. J. Appl. Phys. 2004, 96, 925. [Google Scholar] [CrossRef]
  16. Wu, G.P.; Chen, T.; Su, W.G.; Zhou, G.H.; Zong, X.; Lei, Z.B.; Li, C. H2 production with ultra-low CO selectivity via photocatalytic reforming of methanol on Au/TiO2 catalyst. Int. J. Hydrogen Energy 2008, 33, 1243–1251. [Google Scholar] [CrossRef]
  17. Malara, F.; Minguzzi, A.; Marelli, M.; Morandi, S.; Psaro, R.; Dal Santo, V.; Naldoni, A. α-Fe2O3/NiOOH: An Effective heterostructure for photoelectrochemical water oxidation. ACS Catal. 2015, 5, 5292–5300. [Google Scholar] [CrossRef]
  18. Cai, H.; Yang, Q.; Hu, Z.; Zhihua, D.; You, Q.; Sun, J.; Xu, N.; Wu, J. Enhanced photoelectrochemical activity of vertically aligned ZnO-coated TiO2 nanotubes. Appl. Phys. Lett. 2014, 104, 053114. [Google Scholar] [CrossRef]
  19. Gui, Q.; Xu, Z.; Zhang, H.; Cheng, C.; Zhu, X.; Yin, M.; Song, Y.; Lu, L.; Chen, X.; Li, D. Enhanced photoelectrochemical water-splitting performance of anodic TiO2 nanotube arrays by surface passivation. ACS Appl. Mater. Interfaces 2014, 6, 17053–17058. [Google Scholar] [CrossRef] [PubMed]
  20. Sopha, H.; Krbal, M.; Ng, S.; Prikryl, J.; Zazpe, R.; Yam, F.K.; Macak, J.M. One-dimensional anodic TiO2 nanotubes coated by atomic layer deposition: Towards advanced applications. Appl. Mater. Today 2017, 9, 104–110. [Google Scholar] [CrossRef]
  21. Kavan, L.; Gratzel, M.; Gilbert, S.E.; Klemenz, C.; Scheel, H.J. Electrochemical and photoelectrochemical investigation of single-crystal anatase. J. Am. Chem. Soc. 1996, 118, 6716–6723. [Google Scholar] [CrossRef]
  22. Naldoni, A.; Montini, T.; Malara, F.; Mroz, M.M.; Beltram, A.; Virgili, T.; Boldrini, C.L.; Marelli, M.; Romero-Ocaña, I.; Delgado, J.J.; et al. Hot electron collection on brookite nanorods lateral facets for plasmon-enhanced water oxidation. ACS Catal. 2017, 7, 1270–1278. [Google Scholar] [CrossRef]
  23. Cho, I.S.; Chen, Z.; Forman, A.J.; Kim, D.R.; Rao, P.M.; Jaramillo, T.F.; Zheng, X. Branched TiO2 nanorods for photoelectrochemical hydrogen production. Nano Lett. 2011, 11, 4978–4984. [Google Scholar] [CrossRef] [PubMed]
  24. Kment, S.; Riboni, F.; Pausova, S.; Wang, L.; Wang, L.; Han, H.; Hubicka, Z.; Krysa, J.; Schmuki, P.; Zboril, R. Photoanodes based on TiO2 and α-Fe2O3 for solar water-splitting—Superior role of 1D nanoarchitectures and of combined heterostructures. Chem. Soc. Rev. 2017, 46, 3716–3769. [Google Scholar] [CrossRef] [PubMed]
  25. Altomare, M.; Nguyen, N.T.; Hejazi, S.; Schmuki, P. A Cocatalytic electron-transfer cascade site-selectively placed on TiO2 nanotubes yields enhanced photocatalytic H2 Evolution. Adv. Funct. Mater. 2018, 8, 1704259. [Google Scholar] [CrossRef]
  26. Bickley, R.I.; Gonzalez-Carreno, T.; Lees, J.S.; Palmisano, L.; Tilley, R.J. A structural investigation of titanium dioxide photocatalysts. J. Solid State Chem. 1991, 92, 178–190. [Google Scholar] [CrossRef]
  27. Ohtani, B.; Prieto-Mahaney, O.O.; Li, D.; Abe, R. What is Degussa (Evonik) P25? Crystalline composition analysis, reconstruction from isolated pure particles and photocatalytic activity test. J. Photochem. Photobiol. A Chem. 2010, 216, 179–182. [Google Scholar] [CrossRef] [Green Version]
  28. Komaguchi, K.; Nakano, H.; Araki, A.; Harima, Y. Photoinduced electron transfer from anatase to rutile in partially reduced TiO2 (P-25) nanoparticles: An ESR study. Chem. Phys. Lett. 2016, 428, 338–342. [Google Scholar] [CrossRef]
  29. Kang, J.; Wu, F.; Li, S.-S.; Xia, J.B.; Li, J. Calculating band alignment between materials with different structures: The case of anatase and rutile titanium dioxide. J. Phys. Chem. C 2012, 116, 20765–20768. [Google Scholar] [CrossRef]
  30. Hurum, D.C.; Agrios, A.G.; Gray, K.A.; Rajh, T.; Thurnauer, M.C. Explaining the enhanced photocatalytic activity of degussa P25 mixed-phase TiO2 using EPR. J. Phys. Chem. B 2013, 107, 4545–4549. [Google Scholar] [CrossRef]
  31. Scanlon, D.O.; Dunnill, C.W.; Buckeridge, J.; Shevlin, S.A.; Logsdail, A.J.; Woodley, S.M.; Catlow, C.R.A.; Powell, M.J.; Palgrave, R.G.; Parkin, I.P.; et al. Band alignment of rutile and anatase TiO2. Nat. Mater. 2013, 12, 798–801. [Google Scholar] [CrossRef] [PubMed]
  32. Nosaka, Y.; Nosaka, A.Y. Reconsideration of intrinsic band alignments within anatase and rutile TiO2. J. Phys. Chem. Lett. 2016, 7, 431–434. [Google Scholar] [CrossRef] [PubMed]
  33. Kullgren, J.; Aradi, B.; Frauenheim, T.; Kavan, L.; Deak, P. Resolving the controversy about the band alignment between Rutile and Anatase: The role of OH/H+ adsorption. J. Phys. Chem. C 2015, 119, 21952–21958. [Google Scholar] [CrossRef]
  34. Li, A.; Wang, Z.; Yin, H.; Wang, S.; Yan, P.; Huang, B.; Wang, X.; Li, R.; Zong, X.; Han, H.; et al. Understanding the anatase-rutile phase junction in charge separation and transfer in a TiO2 electrode for photoelectrochemical water-splitting. Chem. Sci. 2016, 7, 6076–6082. [Google Scholar] [CrossRef] [PubMed]
  35. Pena, P.A.; Carrera Crespo, J.E.; Gonzalez, F.; Gonzalez, I. Effect of heat treatment on the crystal phase composition, semiconducting properties and photoelectrocatalytic color removal efficiency of TiO2 nanotubes arrays. Electrochimica. Acta 2014, 140, 564–571. [Google Scholar] [CrossRef]
  36. Regonini, D.; Jaroenworaluck, A.; Stevens, R.; Bowen, C.R. Effect of heat treatment on the properties and structure of TiO2 nanotubes: Phase composition and chemical composition. Surf. Interface Anal. 2010, 42, 139–144. [Google Scholar] [CrossRef]
  37. Ponomarev, E.A.; Peter, L.M. A generalized theory of intensity modulated photocurrent spectroscopy (IMPS). J. Electroanal. Chem. 1995, 396, 219–226. [Google Scholar] [CrossRef]
  38. Cachet, H.; Sutter, E.M.M. Kinetics of water oxidation at TiO2 nanotube arrays at different pH domains investigated by electrochemical and light-modulated impedance Spectroscopy. J. Phys. Chem. C 2015, 119, 25548–25558. [Google Scholar] [CrossRef]
  39. Klotz, D.; Ellis, D.S.; Dotan, H.; Rothschild, A. Empirical in operando analysis of the charge carrier dynamics in hematite photoanodes by PEIS, IMPS and IMVS. Phys. Chem. Chem. Phys. 2016, 18, 23438–23457. [Google Scholar] [CrossRef] [PubMed] [Green Version]
  40. Cottineau, T.; Cachet, H.; Keller, V.; Sutter, E.M.M. Influence of the anatase/rutile ratio on the charge transport properties of TiO2-NTs arrays studied by dual wavelength opto-electrochemical impedance spectroscopy. Phys. Chem. Chem. Phys. 2017, 19, 31469–31478. [Google Scholar] [CrossRef] [PubMed]
  41. Riboni, F.; Nguyen, N.T.; So, S.; Schmuki, P. Aligned metal oxide nanotube arrays: Key-aspects of anodic TiO2 nanotube formation and properties. Nanoscale Horiz. 2016, 1, 445–466. [Google Scholar] [CrossRef]
  42. Ampelli, C.; Tavella, F.; Perathoner, S.; Centi, G. Engineering of photoanodes based on ordered TiO2-nanotube arrays in solar photo-electrocatalytic (PECa) cells. Chem. Eng. J. 2017, 320, 352–362. [Google Scholar] [CrossRef]
  43. Ampelli, C.; Tavella, F.; Genovese, C.; Perathoner, S.; Favaro, M.; Centi, G. Analysis of the factors controlling performances of Au-modified TiO2 nanotube array based photoanode in photo-electrocatalytic (PECa) cells. J. Energy Chem. 2017, 26, 284–294. [Google Scholar] [CrossRef]
  44. Saboo, T.; Tavella, F.; Ampelli, C.; Perathoner, S.; Genovese, C.; Marepally, B.C.; Veyre, L.; Elsje, A.Q.; Centi, G. Water-splitting on 3D-type meso/macro porous structured photoanodes based on Ti mesh. Sol. Energy Mater. Sol. Cells 2018, 98, 178. [Google Scholar] [CrossRef]
  45. Albu, S.P.; Tsuchiya, H.; Fujimoto, S.; Schmuki, P. TiO2 Nanotubes-annealing effects on detailed morphology and structure. Eur. J. Inorg. Chem. 2010, 2010, 4351–4356. [Google Scholar] [CrossRef]
  46. Mohammadpour, F.; Altomare, M.; So, S.; Lee, K.; Mokhtar, M.; Alshehri, A.; Al-Thabaiti, S.A.; Schmuki, P. High-temperature annealing of TiO2 nanotube membranes for efficient dye-sensitized solar cells. Semicond. Sci. Technol. 2016, 31, 014010. [Google Scholar] [CrossRef]
  47. Yoo, J.E.; Altomare, M.; Mokhtar, M.; Alshehri, A.; Al-Thabaiti, S.A.; Mazare, A.; Schmuki, P. Photocatalytic H2 generation using dewetted Pt-decorated TiO2 nanotubes: Optimized dewetting and oxide crystallization by a multiple annealing process. J. Phys. Chem. C 2016, 120, 15884–15892. [Google Scholar] [CrossRef]
  48. Jarosz, M.; Syrek, K.; Kapusta-Kołodziej, J.; Mech, J.; Malek, K.; Hnida, K.; Lojewski, T.; Jaskula, M.; Sulka, G.D. Heat treatment effect on crystalline structure and photo-electrochemical properties of anodic TiO2 nanotube arrays formed in ethylene glycol and glycerol based electrolytes. J. Phys. Chem. C 2015, 119, 24182–24191. [Google Scholar] [CrossRef]
  49. Li, J.; Wang, Z.; Wang, J.; Sham, T.K. Unfolding the Anatase-to-Rutile phase transition in TiO2 nanotubes using X-ray spectroscopy and spectromicroscopy. J. Phys. Chem. C 2016, 120, 22079–22087. [Google Scholar] [CrossRef]
  50. Scaramuzzo, F.A.; Dell’Era, A.; Tarquini, G.; Caminiti, R.; Ballirano, P.; Pasquali, M. Phase transition of TiO2 nanotubes: An X-ray study as a function of temperature. J. Phys. Chem. C 2017, 121, 24871–24876. [Google Scholar] [CrossRef]
  51. Li, W.; Ni, C.; Lin, H.; Huang, C.P.; Shah, S.I. Size dependence of thermal stability of TiO2 nanoparticles. J. Appl. Phys. 2004, 96, 6663–6668. [Google Scholar] [CrossRef]
  52. Naldoni, A.; Allieta, M.; Santangelo, S.; Marelli, M.; Fabbri, F.; Cappelli, S.; Bianchi, C.L.; Psaro, R.; Santo, V.D. Effect of nature and location of defects on bandgap narrowing in black TiO2 nanoparticles. J. Am. Chem. Soc. 2012, 134, 7600–7603. [Google Scholar] [CrossRef] [PubMed]
  53. Likodimos, V.; Stergiopoulos, T.; Falaras, P.; Kunze, J.; Schmuki, P. Phase composition, size, orientation, and antenna effects of self-assembled anodized titania nanotube arrays: A polarized micro-raman investigation. J. Phys. Chem. C 2008, 112, 12687–12696. [Google Scholar] [CrossRef]
  54. Rambabu, Y.; Jaiswal, M.; Roy, S.C. Effect of annealing temperature on the phase transition, structural stability and photo-electrochemical performance of TiO2 multi-leg nanotubes. Catal. Today 2016, 278, 255–261. [Google Scholar] [CrossRef]
  55. Ohsaka, T.; Izumi, F.; Fujiki, Y. Raman spectrum of anatase TiO2. J. Raman Spectrosc. 1978, 7, 321–324. [Google Scholar] [CrossRef]
  56. Li Bassi, A.; Cattaneo, D.; Russo, V.; Bottani, C.E. Raman spectroscopy characterization of titania nanoparticles produced by flame pyrolysis: The influence of size and stoichiometry. J. Appl. Phys. 2005, 98, 074305. [Google Scholar] [CrossRef]
  57. Knorr, F.J.; Mercado, C.C.; McHale, J.L. Trap-state distributions and carrier transport in pure and mixed-phase TiO2: Influence of contacting solvent and interphasial electron transfer. J. Phys. Chem. C 2008, 112, 12786–12794. [Google Scholar] [CrossRef]
  58. Shi, J.; Chen, J.; Feng, Z.; Chen, T.; Lian, Y.; Wang, X.; Li, C. Photoluminescence Characteristics of TiO2 and Their Relationship to the photoassisted reaction of Water/Methanol Mixture. J. Phys. Chem. C 2017, 111, 693–699. [Google Scholar] [CrossRef]
  59. Wang, X.; Feng, Z.; Shi, J.; Jia, G.; Shen, S.; Zhou, J.; Li, C. Trap states and carrier dynamics of TiO2 studied by photoluminescence spectroscopy under weak excitation condition. Phys. Chem. Chem. Phys. 2010, 12, 7083–7090. [Google Scholar] [CrossRef] [PubMed]
  60. Pallotti, D.K.; Passoni, L.; Maddalena, P.; Di Fonzo, F.; Lettieri, S. Photoluminescence mechanisms in anatase and rutile TiO2. J. Phys. Chem. C 2017, 121, 9011–9021. [Google Scholar] [CrossRef]
  61. Bergman, L.; McHale, J.L. Handbook of Luminescent Semiconductor Materials; CRC Press: Boca Raton, FL, USA, 2011; Volume 7. [Google Scholar]
  62. Lei, Y.; Zhang, L.D.; Meng, G.W.; Li, G.H.; Zhang, X.Y.; Liang, C.H.; Chen, W.; Wang, S.X. Preparation and photoluminescence of highly ordered TiO2 nanowire arrays. Appl. Phys. Lett. 2011, 78, 8. [Google Scholar] [CrossRef]
  63. Iatsunskyi, I.; Pavlenko, M.; Viter, R.; Jancelewicz, M.; Nowaczyk, G.; Baleviciute, I.; Załęski, K.; Jurga, S.; Ramanavicius, A.; Smyntyna, V. Tailoring the structural, optical, and photoluminescence properties of porous silicon/TiO2 nanostructures. J. Phys. Chem. C 2015, 119, 7164–7171. [Google Scholar] [CrossRef]
  64. Di Valentin, C.; Pacchioni, G. Reduced and n-Type Doped TiO2: Nature of Ti3+ Species. J. Phys. Chem. C 2009, 113, 20543–20552. [Google Scholar] [CrossRef]
  65. Gerosa, M.; Bottani, C.E.; Caramella, L.; Onida, G.; Di Valentin, C.; Pacchioni, G. Defect calculations in semiconductors through a dielectric-dependent hybrid DFT functional: The case of oxygen vacancies in metal oxides. J. Chem. Phys. 2015, 143, 134702. [Google Scholar] [CrossRef] [PubMed] [Green Version]
  66. Deak, P.; Aradi, B.; Frauenheim, T. Quantitative theory of the oxygen vacancy and carrier self-trapping in bulk TiO2. Phys. Rev. B 2012, 86, 195206. [Google Scholar] [CrossRef]
  67. Zhang, W.F.; Zhang, M.S.; Yin, Z.; Chen, Q. Photoluminescence in anatase titanium dioxide nanocrystals. Appl. Phys. B 2000, 70, 261–265. [Google Scholar] [CrossRef]
  68. Klotz, D.; Grave, D.A.; Rothschild, A. Accurate determination of the charge transfer efficiency of photoanodes for solar water-splitting. Phys. Chem. Chem. Phys. 2017, 19, 20383–20392. [Google Scholar] [CrossRef] [PubMed]
  69. Thorne, J.E.; Jang, J.W.; Liu, E.Y.; Wang, D. Understanding the origin of photoelectrode performance enhancement by probing surface kinetics. Chem. Sci. 2016, 7, 3347–3354. [Google Scholar] [CrossRef] [PubMed] [Green Version]
  70. Zachaus, C.; Abdi, F.F.; Peter, L.M.; Krol, R.V. Photocurrent of BiVO4 is limited by surface recombination, not surface catalysis. Chem. Sci. 2017, 8, 3712–3719. [Google Scholar] [CrossRef] [PubMed]
  71. Klahr, B.; Gimenez, S.; Fabregat-Santiago, F.; Hamann, T.; Bisquert, J. Water Oxidation at Hematite Photoelectrodes: The role of surface states. J. Am. Chem. Soc. 2012, 134, 4294–4302. [Google Scholar] [CrossRef] [PubMed]
  72. Lynch, R.P.; Ghicov, A.; Schmuki, P. A photo-electrochemical investigation of self-organized TiO2 nanotubes. J. Electrochem. Soc. 2010, 157, 76–84. [Google Scholar] [CrossRef]
  73. Gurudayal; Chee, P.M.; Boix, P.P.; Ge, H.; Yanan, F.; Barber, J.; Wong, L.H. Core-shell hematite nanorods: A Simple method to improve the charge transfer in the photoanode for photoelectrochemical water-splitting. ACS Appl. Mater. Interfaces 2015, 7, 6852–6859. [Google Scholar] [CrossRef] [PubMed]
  74. Rex, R.E.; Knorr, F.J.; McHale, J.L. Surface Traps of TiO2 nanosheets and nanoparticles as illuminated by spectroelectrochemical photoluminescence. J. Phys. Chem. C 2014, 118, 16831–16841. [Google Scholar] [CrossRef]
  75. Tighineanu, A.; Ruff, T.; Albu, S.; Hahn, R.; Schmuki, P. Conductivity of TiO2 nanotubes: Influence of annealing time and temperature. Chem. Phys. Lett. 2010, 494, 260–263. [Google Scholar] [CrossRef]
Figure 1. Field emission scanning electron microscope (FESEM) images of TiO2 nanotubes (ac) top view and (df) corresponding cross-sectional images.
Catalysts 09 00204 g001
Figure 2. (a) X-ray diffraction patterns and (b) Raman spectra of TiO2 nanotubes annealed at different temperatures. (inset) An enlarged view of the Raman Eg(1) peak.
Catalysts 09 00204 g002
Figure 3. Transmission electron microscopy (TEM) (a) and high resolution (HR)-TEM images of TNT500 (b). (c) TEM image of TNT600. (d) HR-TEM image of TNT600 and corresponding FFT representations.
Catalysts 09 00204 g003
Figure 4. Photoluminescence spectra of TiO2 nanotubes with UV excitation energy (3.54 eV).
Catalysts 09 00204 g004
Figure 5. Normalized absorbance spectra of TiO2 nanotubes annealed at different temperatures.
Catalysts 09 00204 g005
Figure 6. (a) Linear sweep voltammetry scans (LSV) of nanotubes measured in 1 M NaOH solution, under 1 sun illumination (100 mW cm−2, AM1.5G) and (b) IPCE (%) spectra of TiO2 nanotubes measured at 0.5 V vs. Ag/AgCl.
Catalysts 09 00204 g006
Figure 7. Representative perturbative PEC spectroscopy plots of TiO2 nanotubes annealed at different temperatures. (a) Intensity-modulated photocurrent spectroscopy (IMPS, normalized), spectra measured at −0.5 V vs. Ag/AgCl. (b) Intensity-modulated photovoltage spectroscopy (IMVS) measured under open circuit conditions. (c) Photoelectrochemical impedance spectroscopy (PEIS) measured at −0.5 V vs. Ag/AgCl. (d) Schematic of an equivalent circuit used for fitting. Rs is the contact/solution resistance, Rtrap,bulk is the bulk charge transport resistance, Rct,VB is the charge transfer resistance across the semiconductor/electrolyte interface. CSC,bulk is the space charge layer capacitance, CSE,trap represents the capacitance of the semiconductor/electrolyte interface. All measurements were performed in 1 M NaOH electrolyte.
Catalysts 09 00204 g007
Figure 8. Kinetic parameters retrieved from IMPS and IMVS measurements. (a) Hole transfer rate (Ktr), (b) surface recombination rate of holes (Ksr), and (c) hole transfer efficiency (ηct) at different applied potentials. (d) Bulk recombination rate of electron obtained from IMVS measurements performed under open circuit conditions.
Catalysts 09 00204 g008
Figure 9. Electrical circuit parameters retrieved from the EIS measurements performed in 1 M NaOH and equivalent circuit fitting. (a) Bulk transport resistance (Rtrap,bulk) represents the bulk recombination resistance and the trend suggests the increase in the electron–hole recombination with a change in the phase ratio of anatase to rutile, which is in agreement with the IMVS measurements. (b) Charge transfer resistance (Rct,VB) indicates the resistance of the hole transfer from the valence band of the semiconductor to the electrolyte, which is in agreement with the charge transfer efficiency and the photocurrent trend observed for the TiO2 nanotubes. (c) CSC,bulk is the space charge layer capacitance. The trend suggests an improved charge separation in TNT500 and a decrease in charge separation in mixed-phase TiO2. It is in agreement with Rtrap,bulk. (d) CSE,trap suggests the hole transfer ability to the electrolyte. It is in agreement with the trend observed in the photocurrent.
Catalysts 09 00204 g009

