
Sn-Doped Hematite Films as Photoanodes for Photoelectrochemical Alcohol Oxidation
 , , , , , and
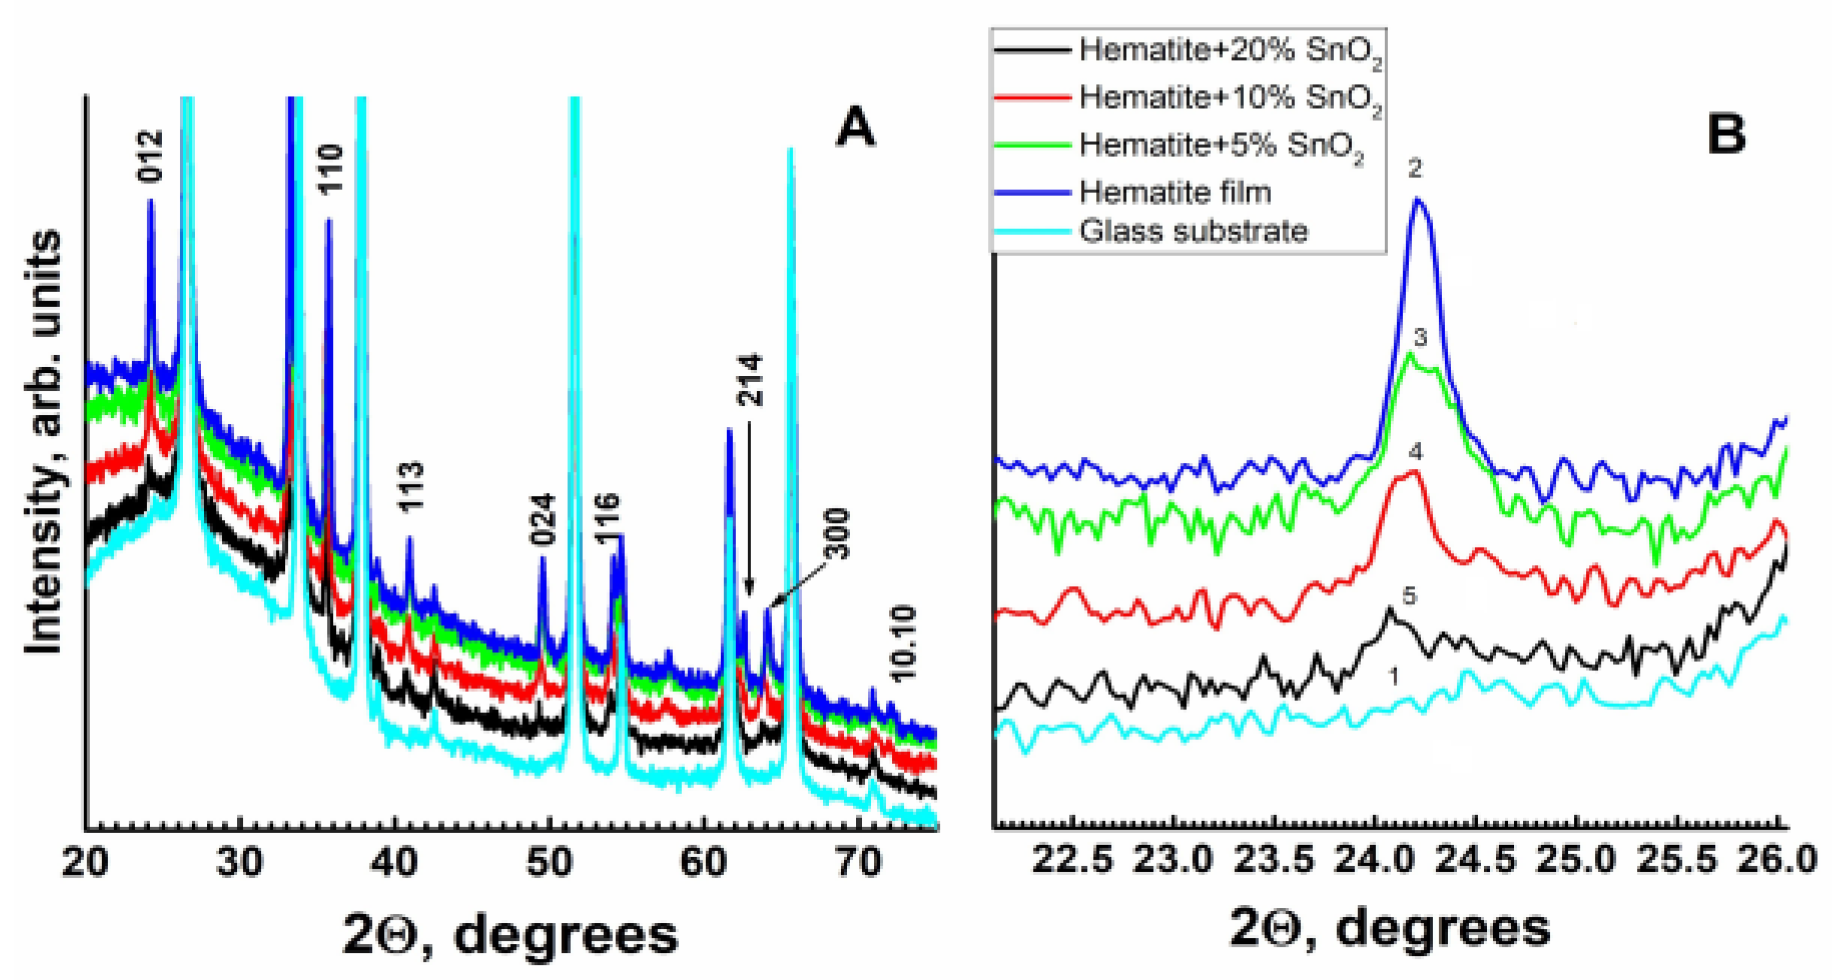
Abstract
:1. Introduction
2. Results and Discussion
2.1. X-ray Diffraction Patterns
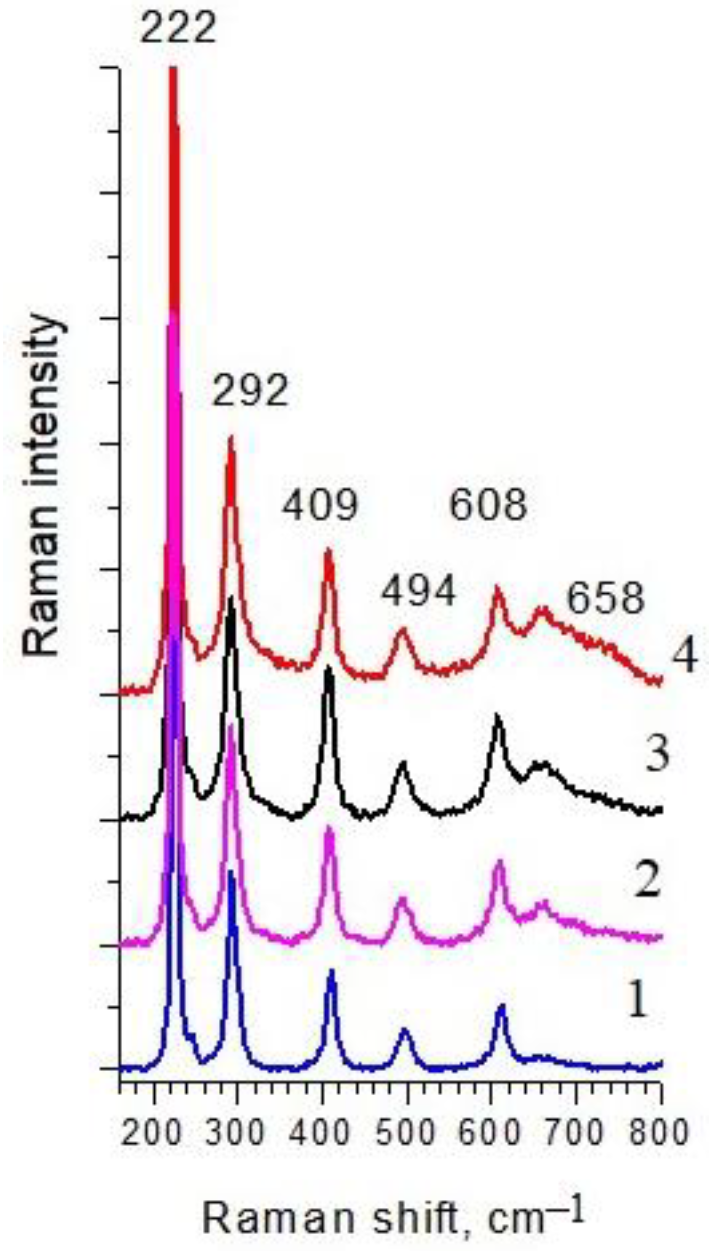
2.2. Raman Spectra
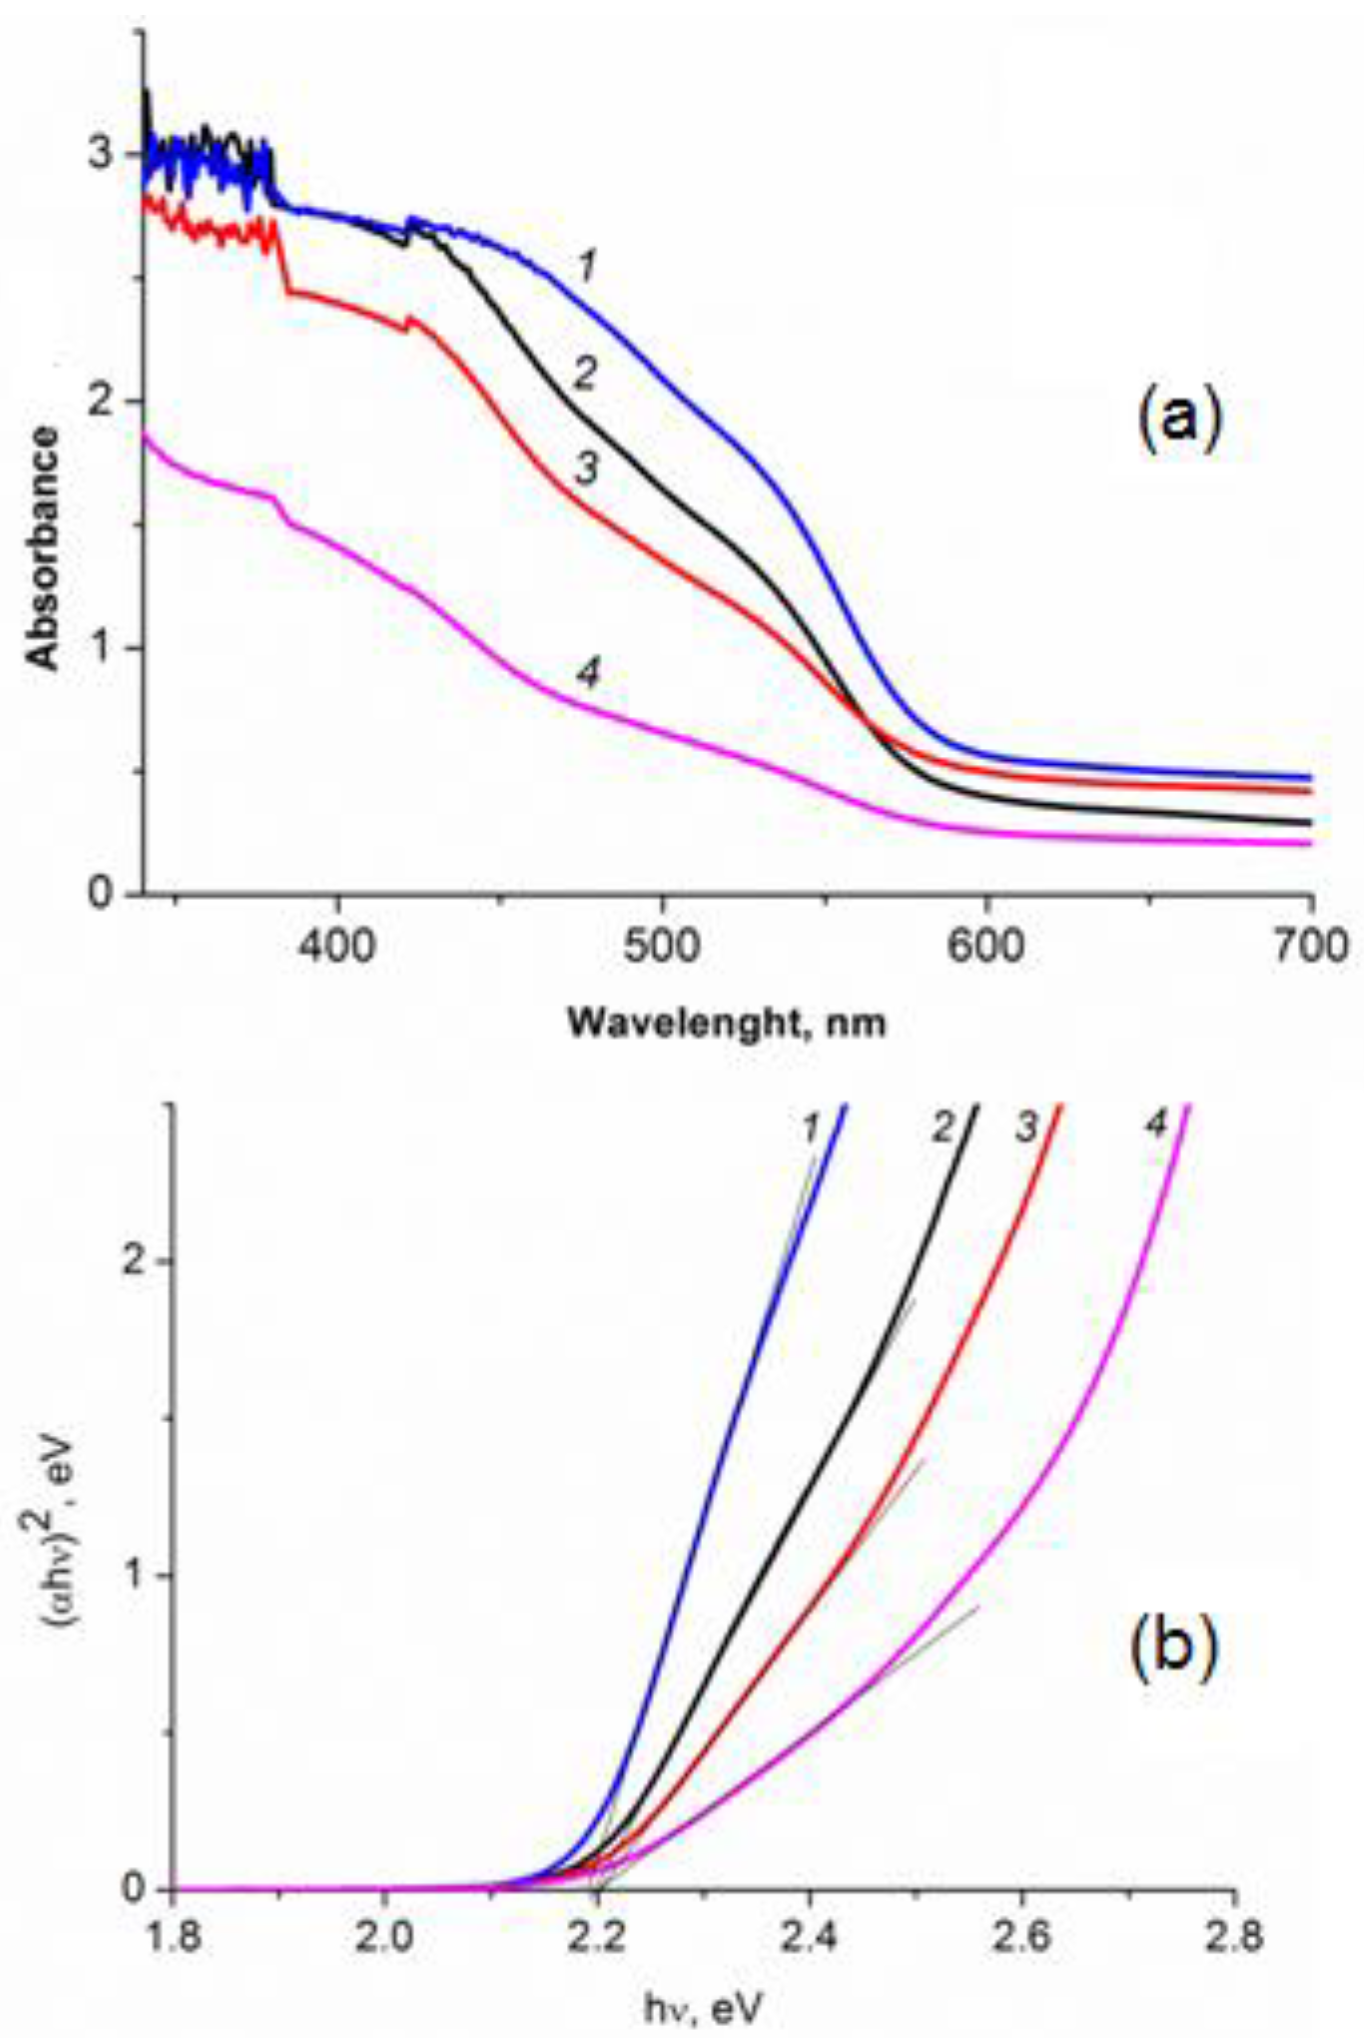
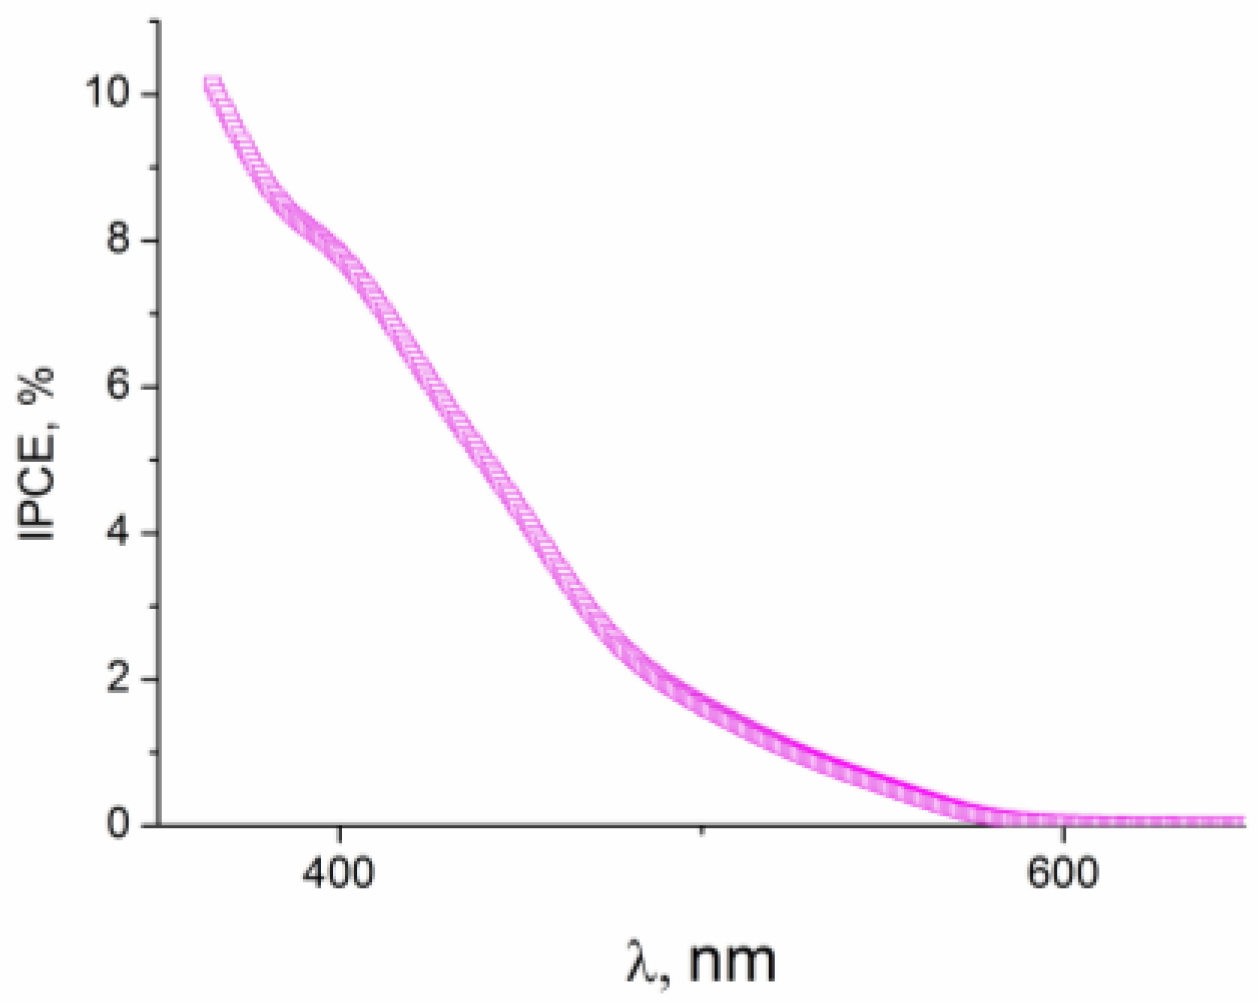
2.3. Absorption Spectra
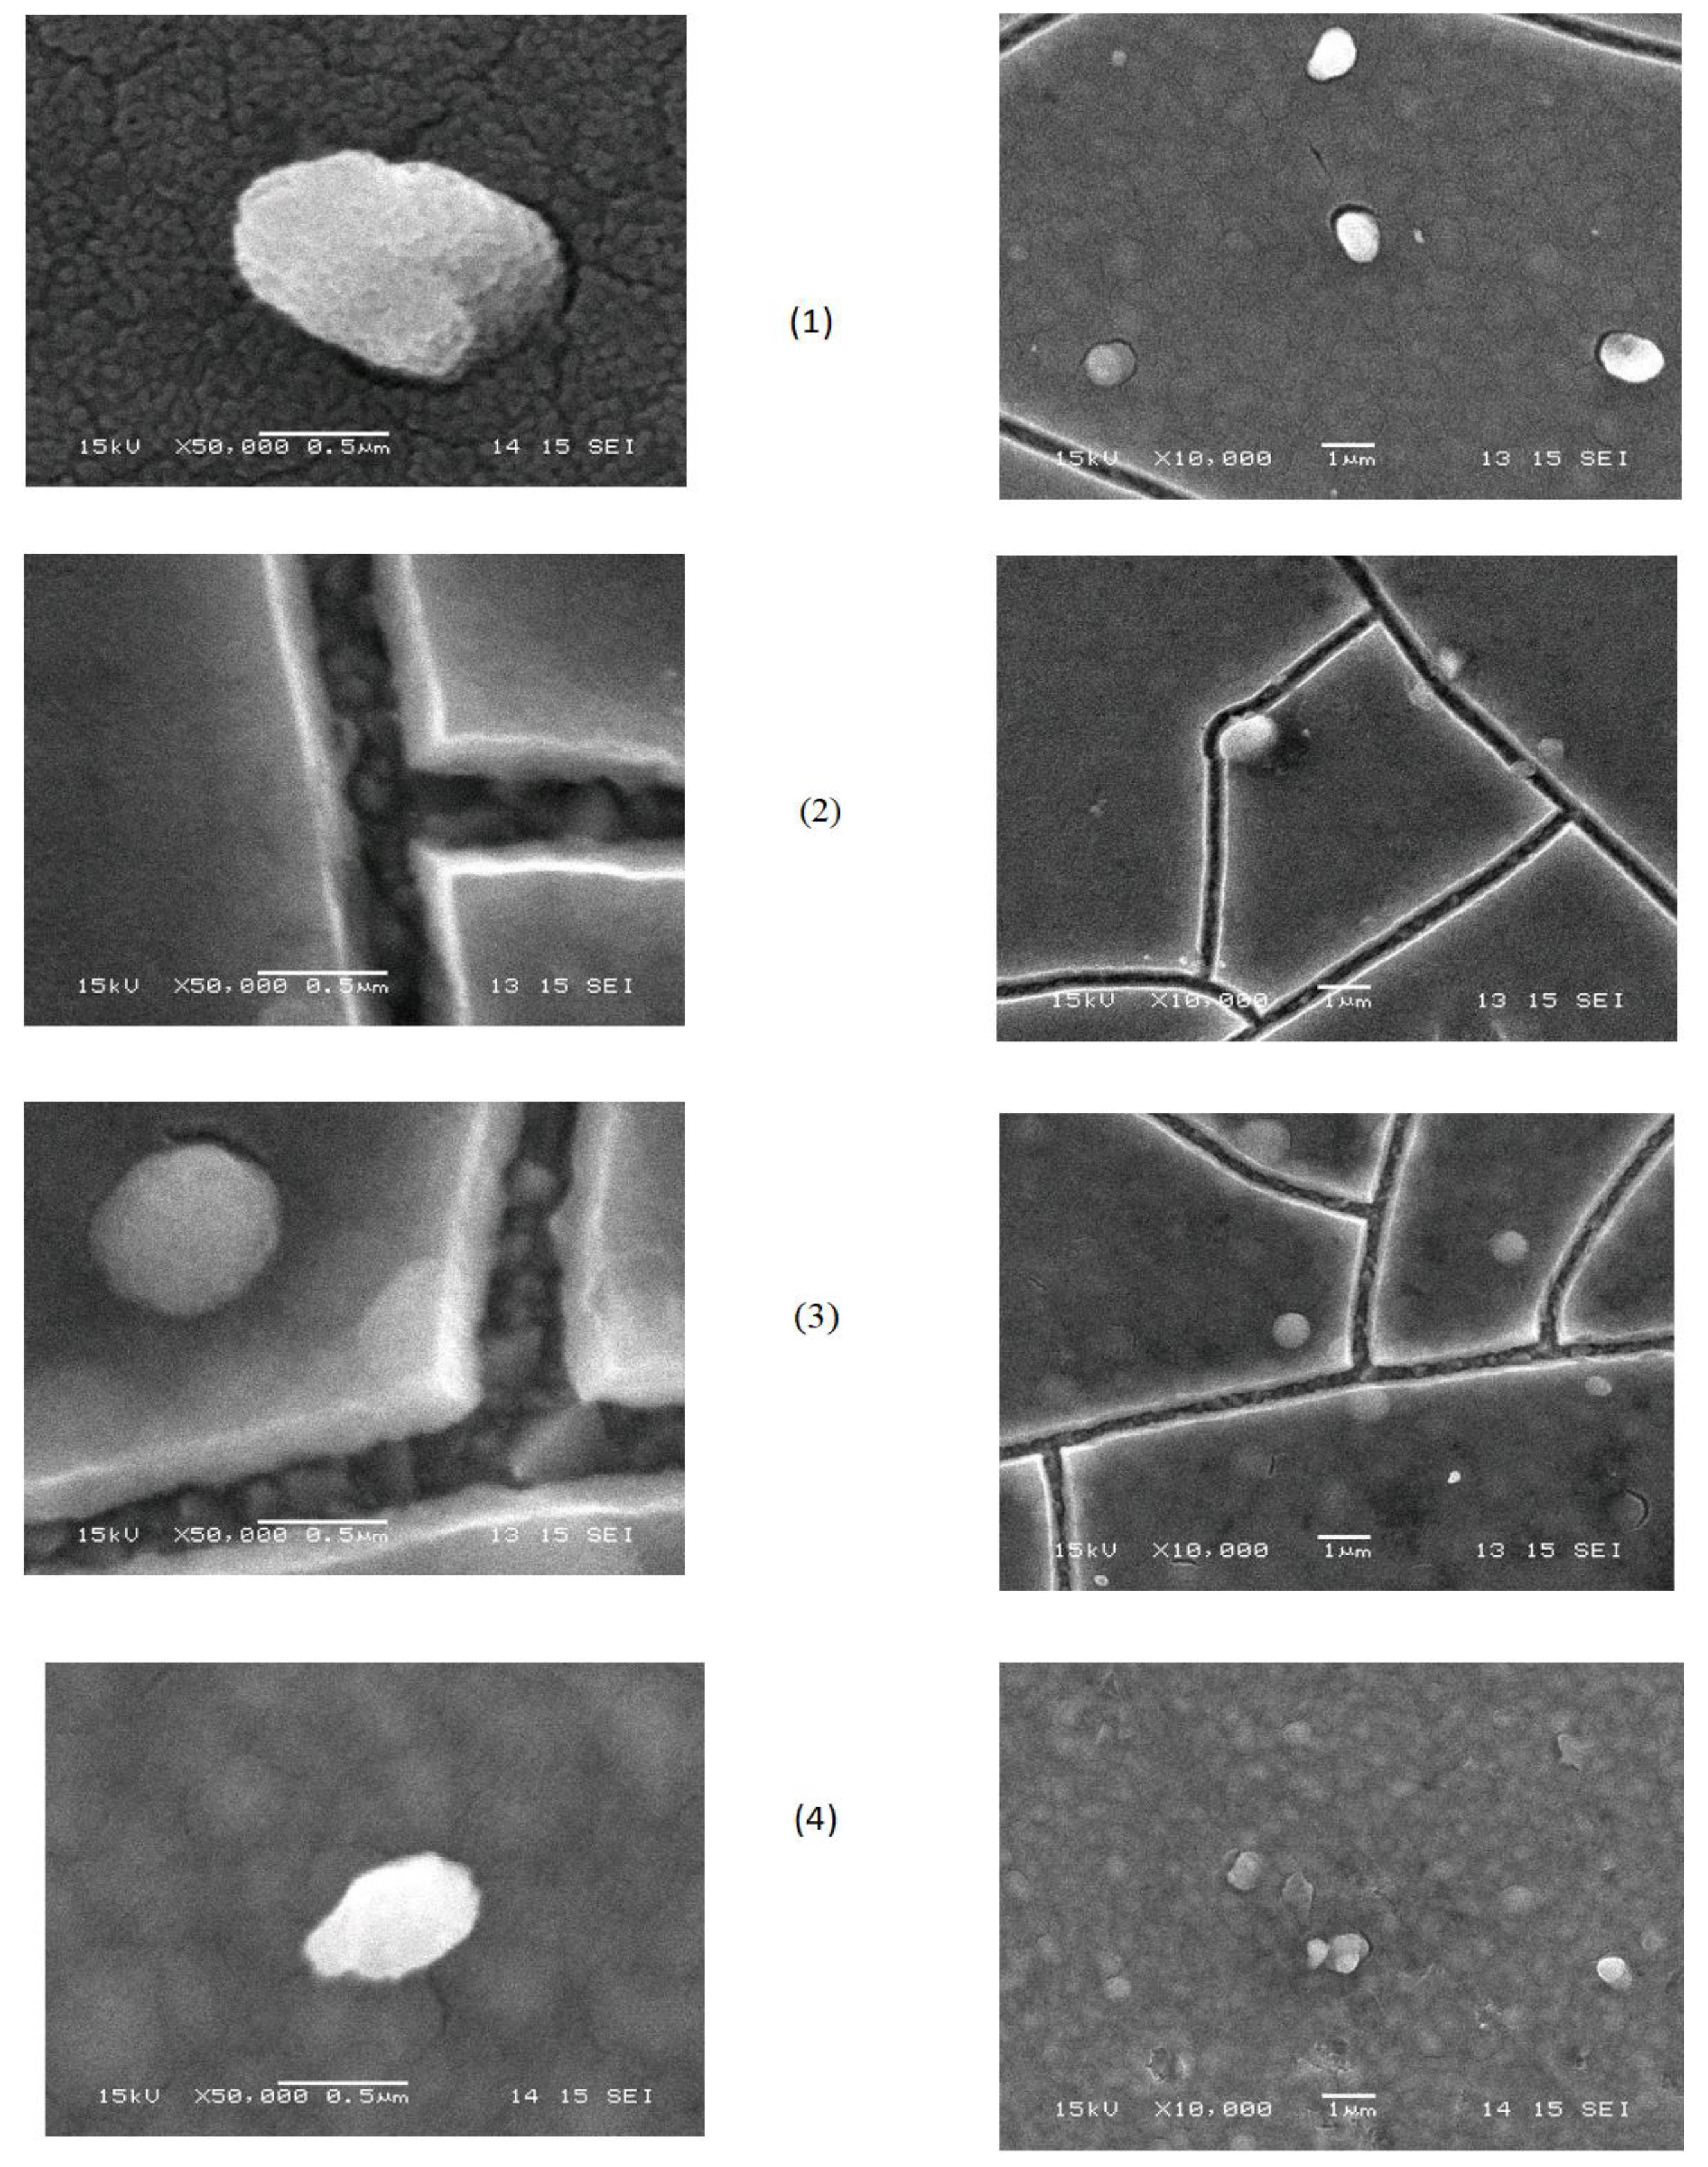
2.4. Morphology and Thickness of the Electrodeposited Films
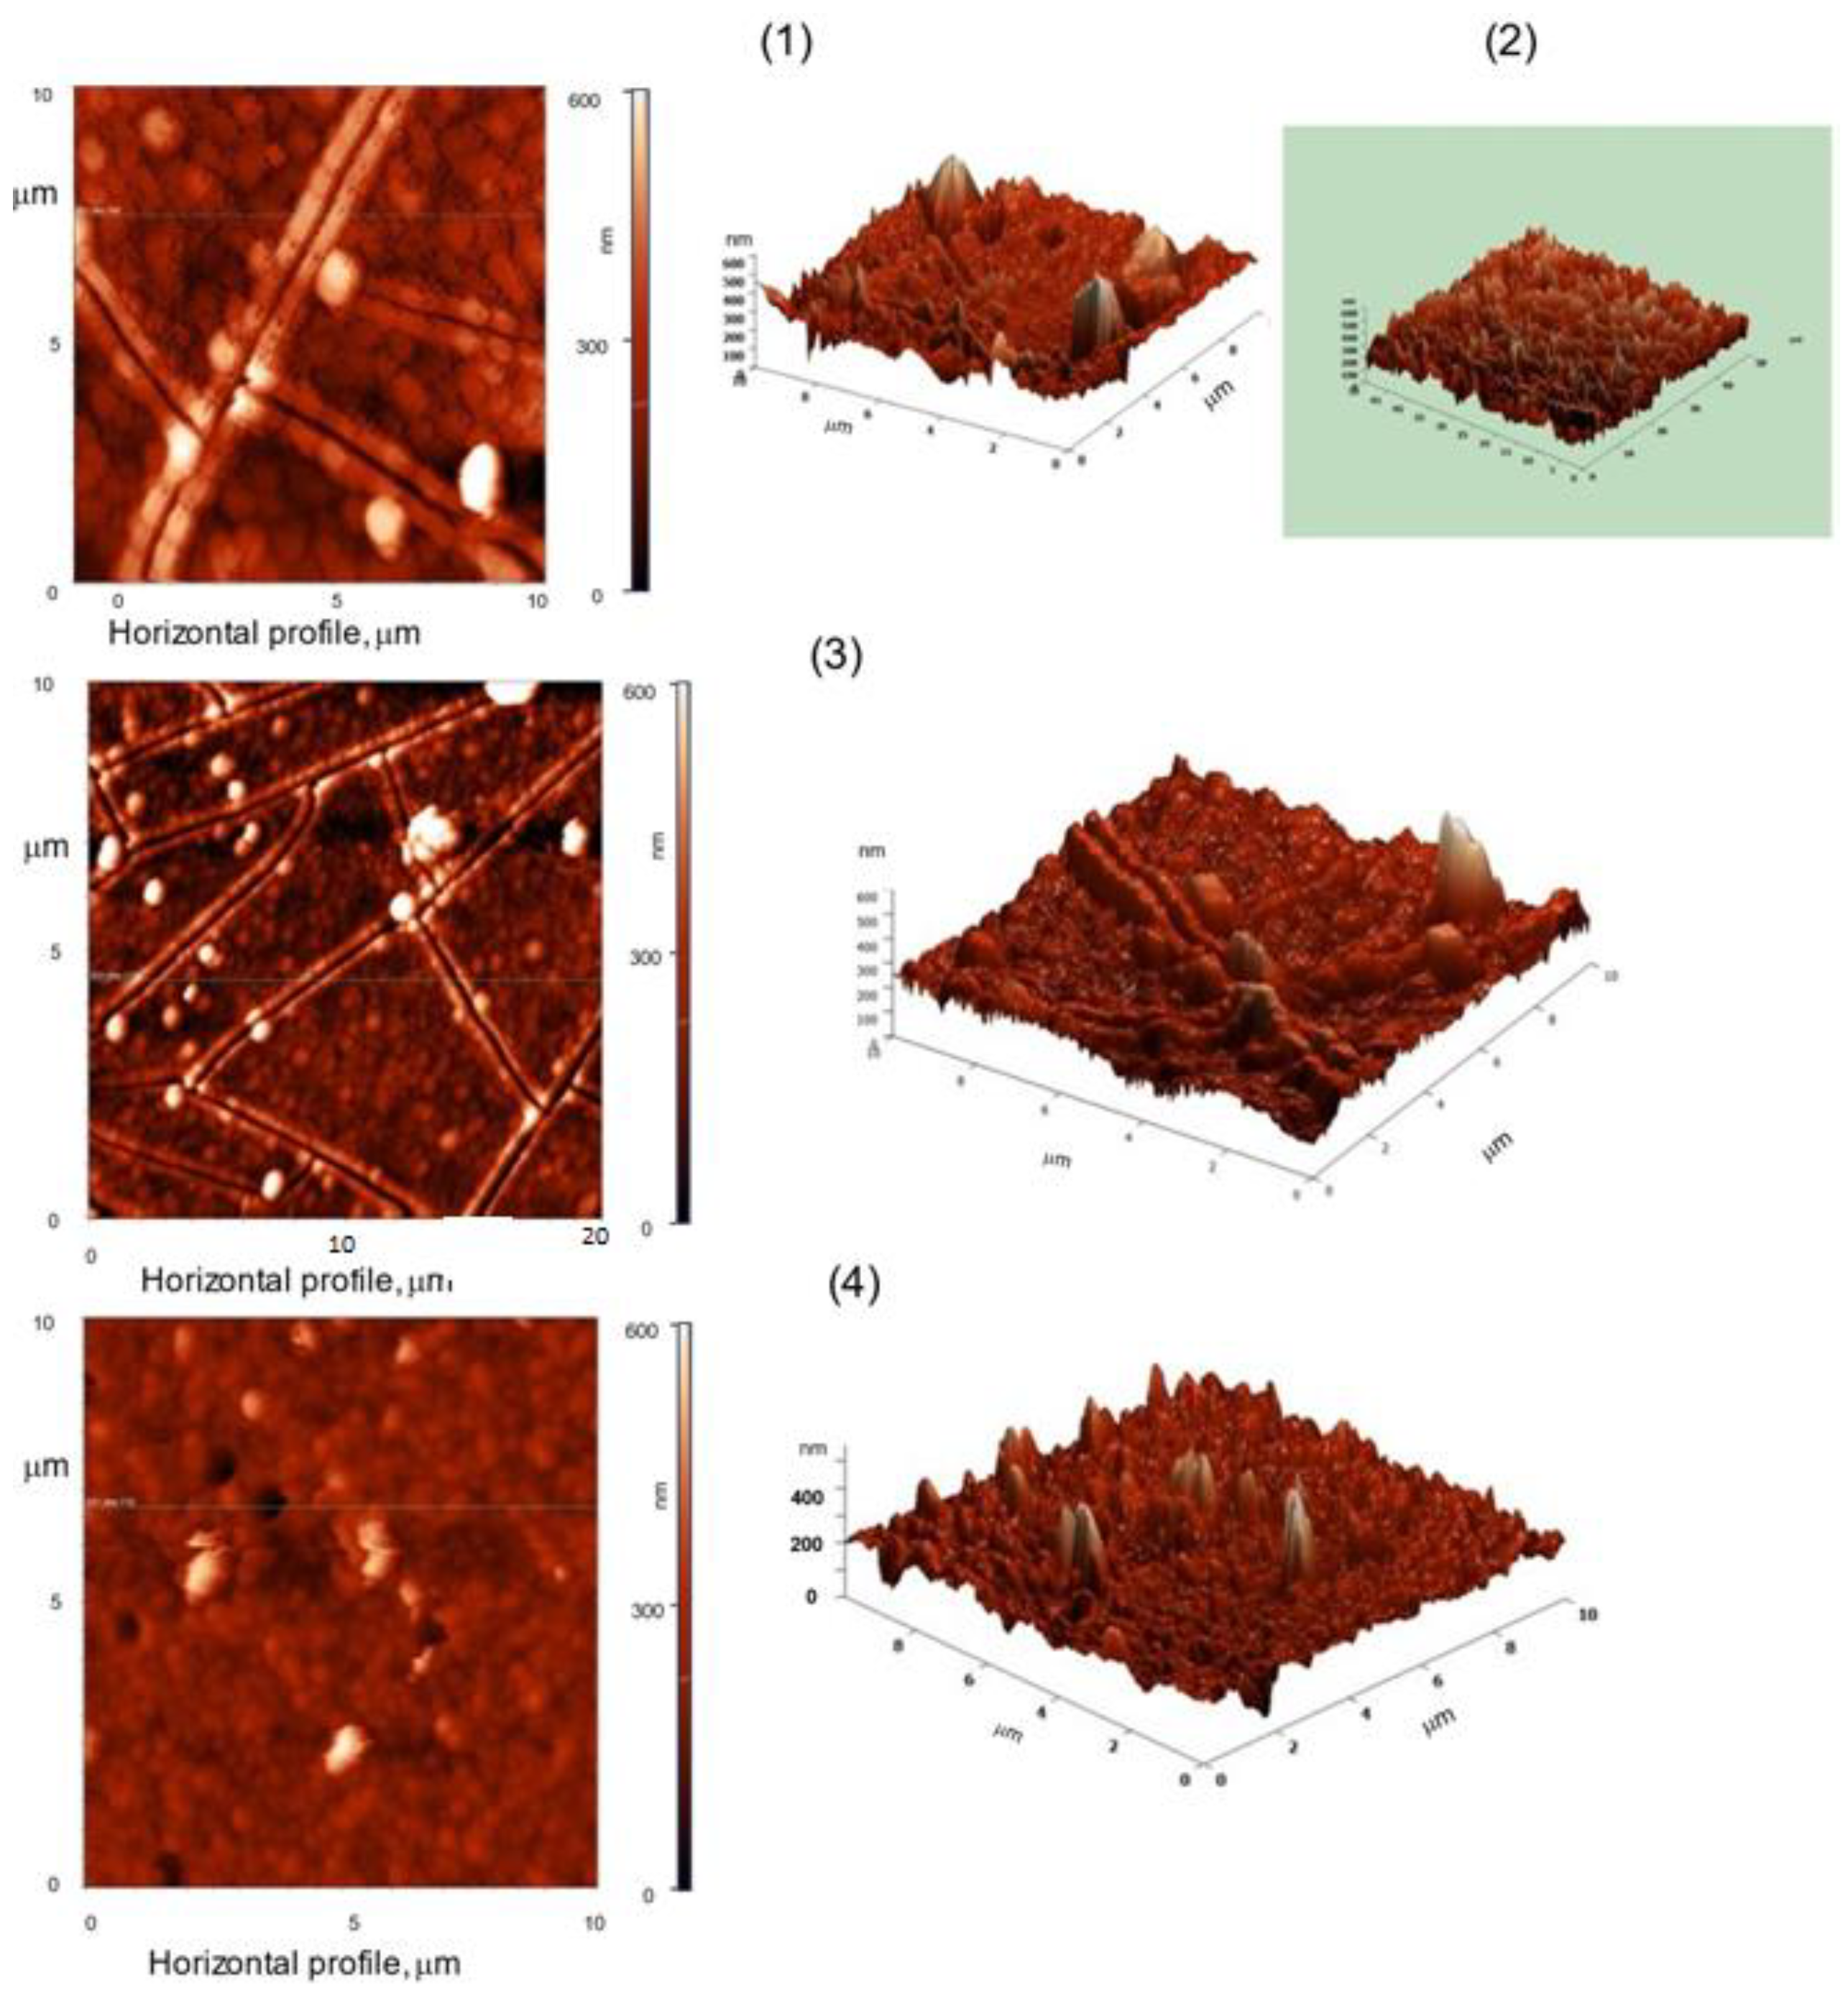
2.5. Atomic Force Microscopy (AFM)
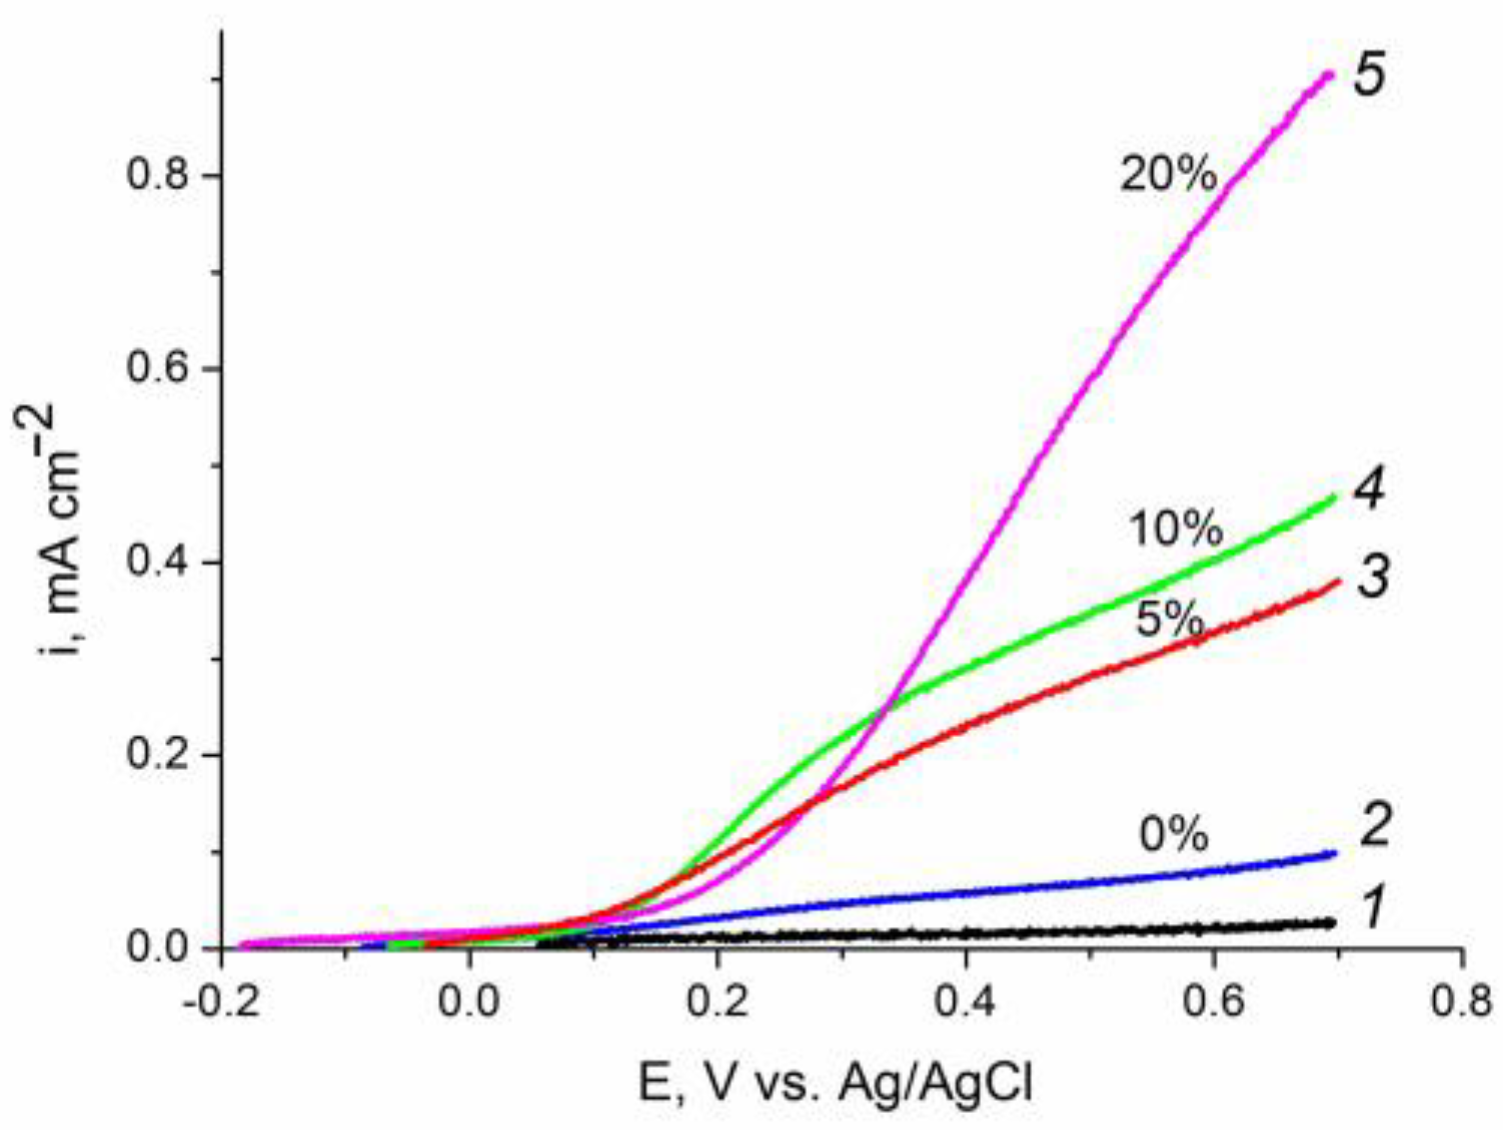
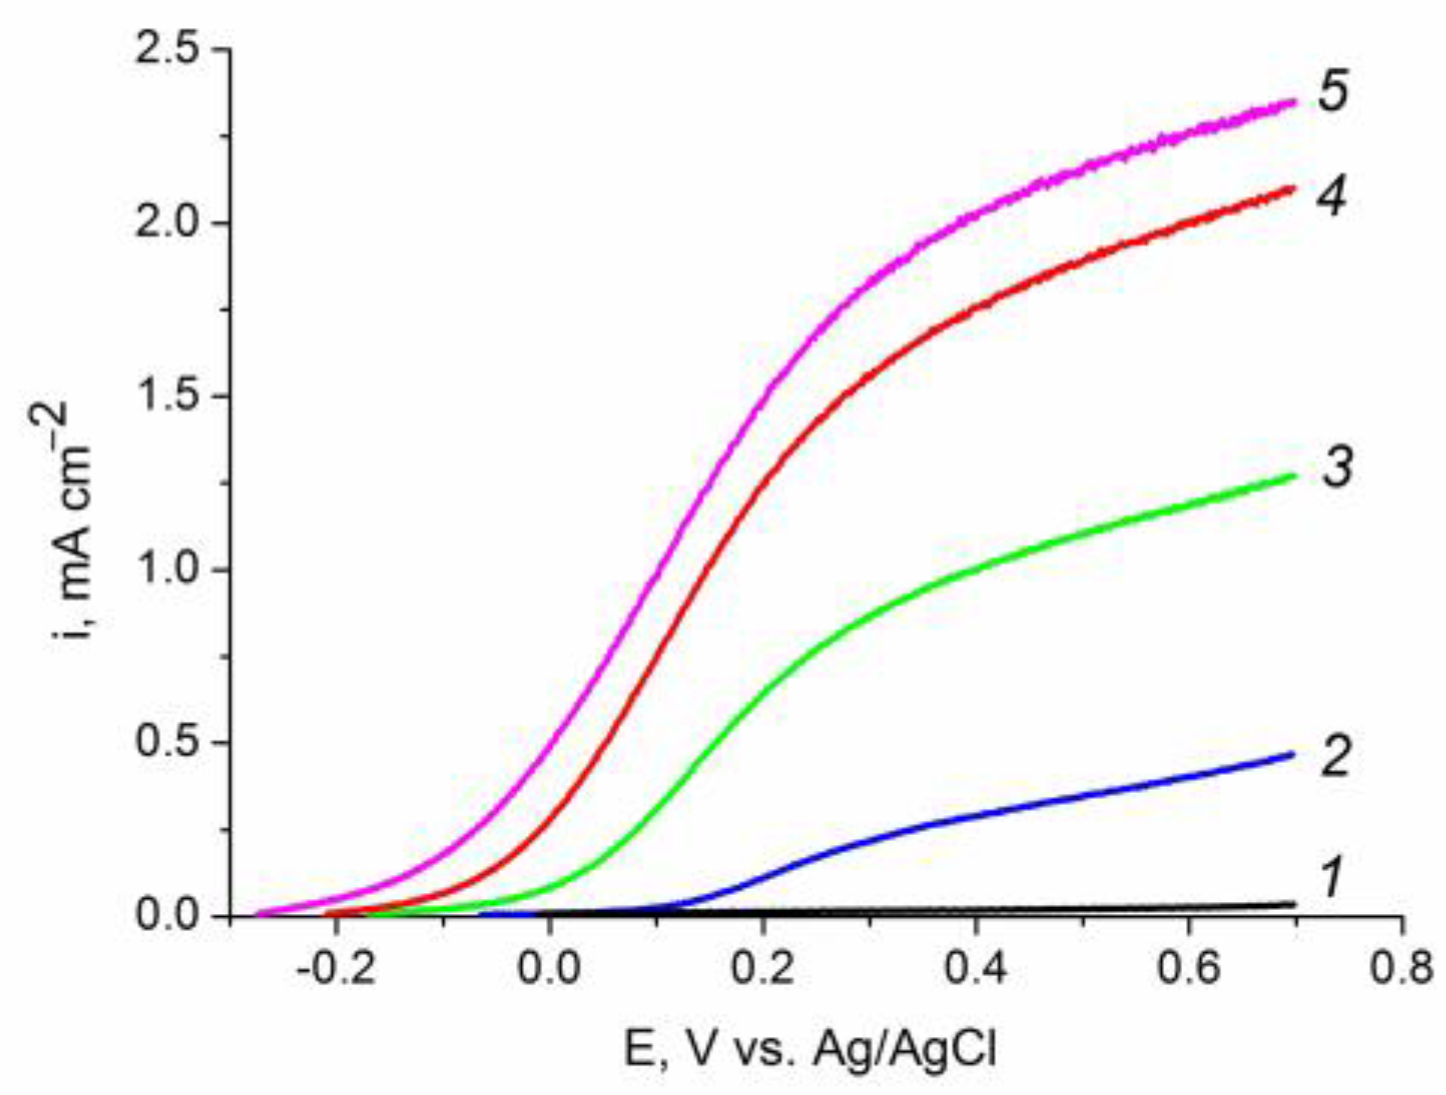
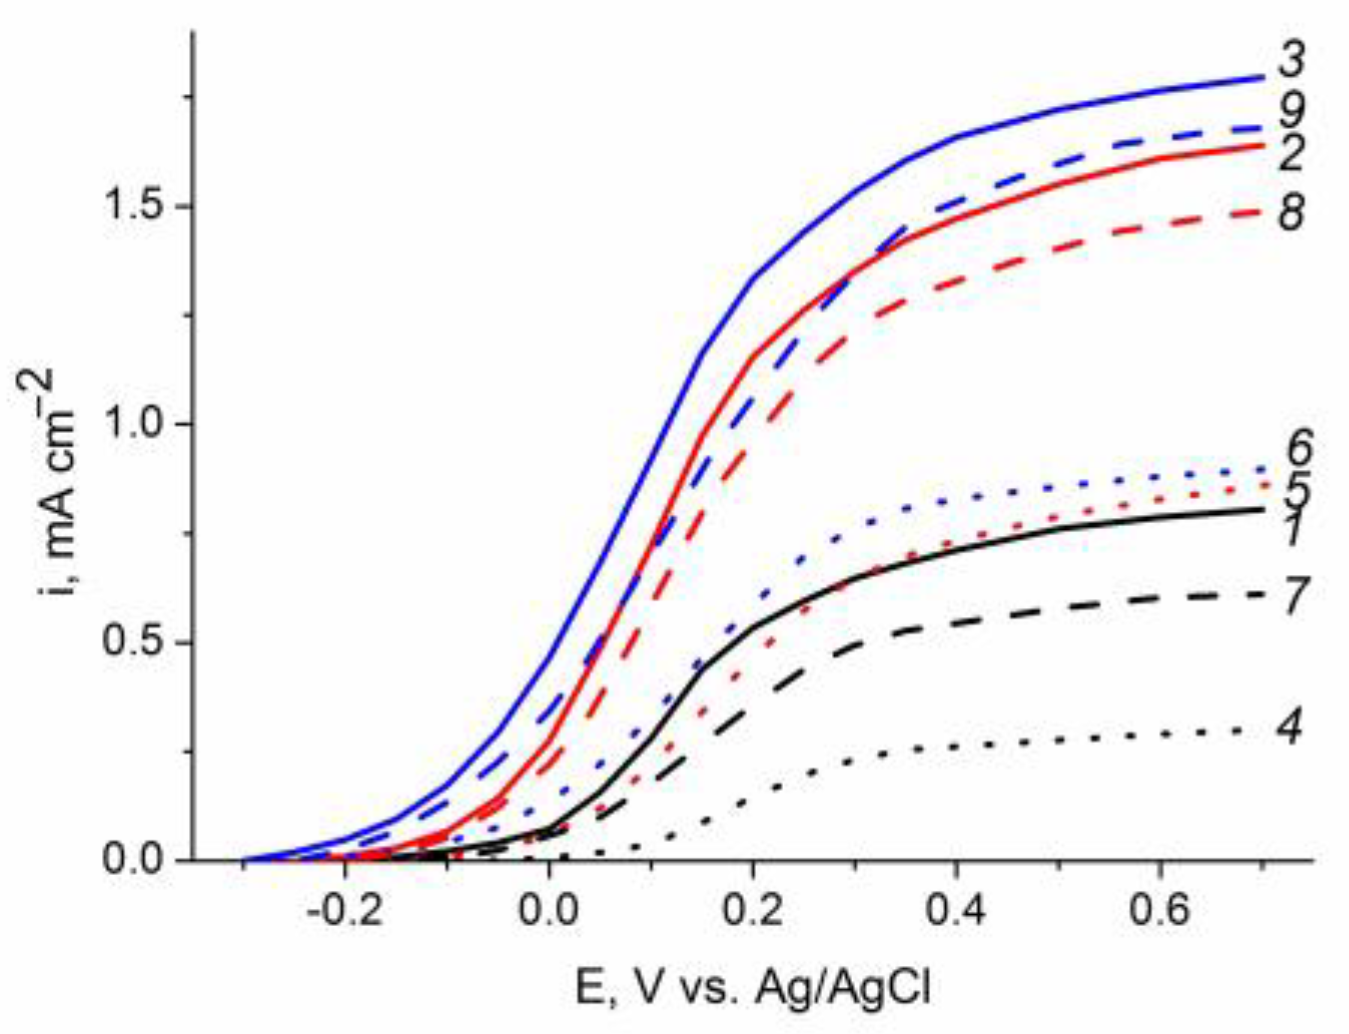
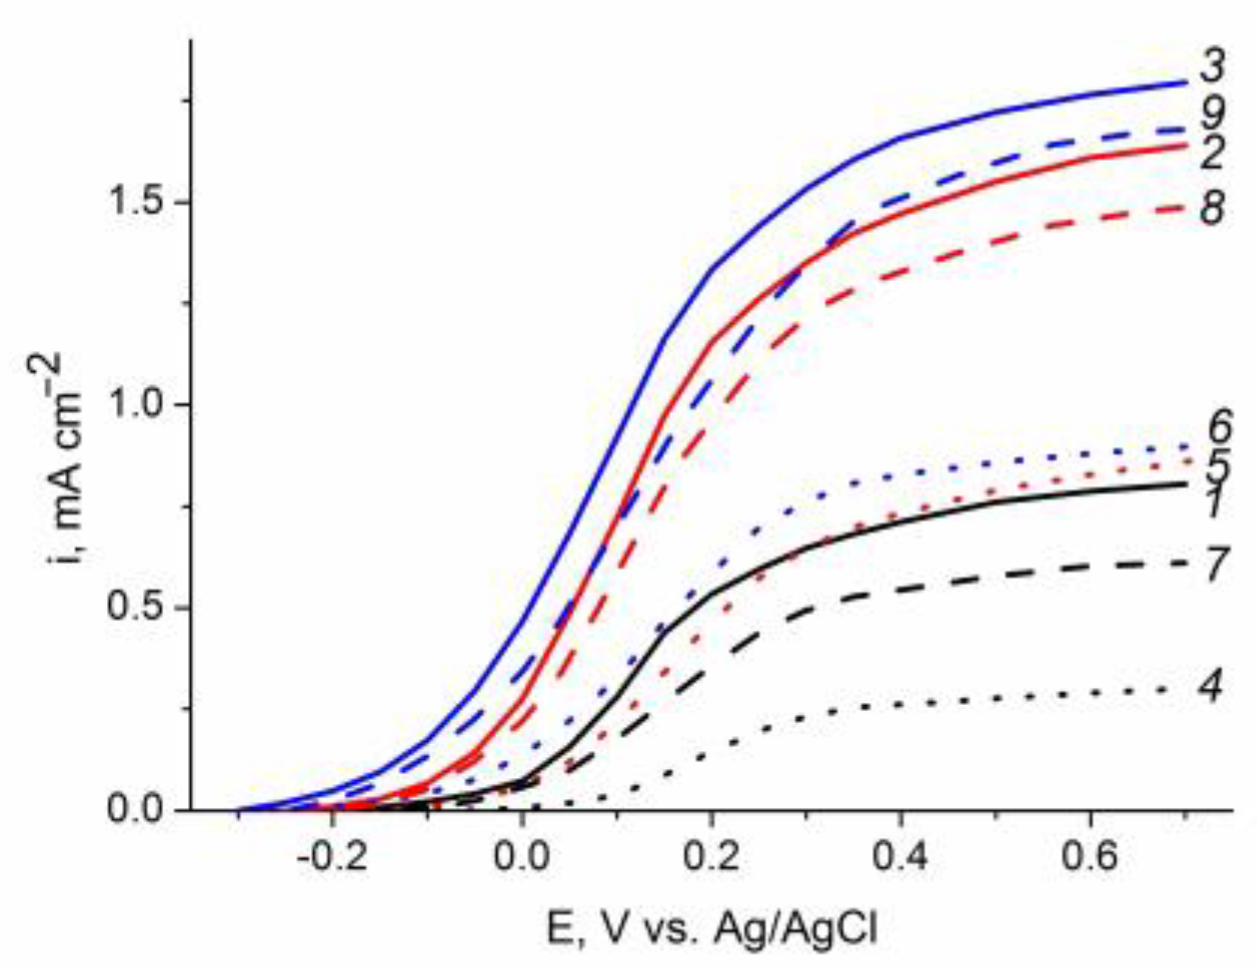
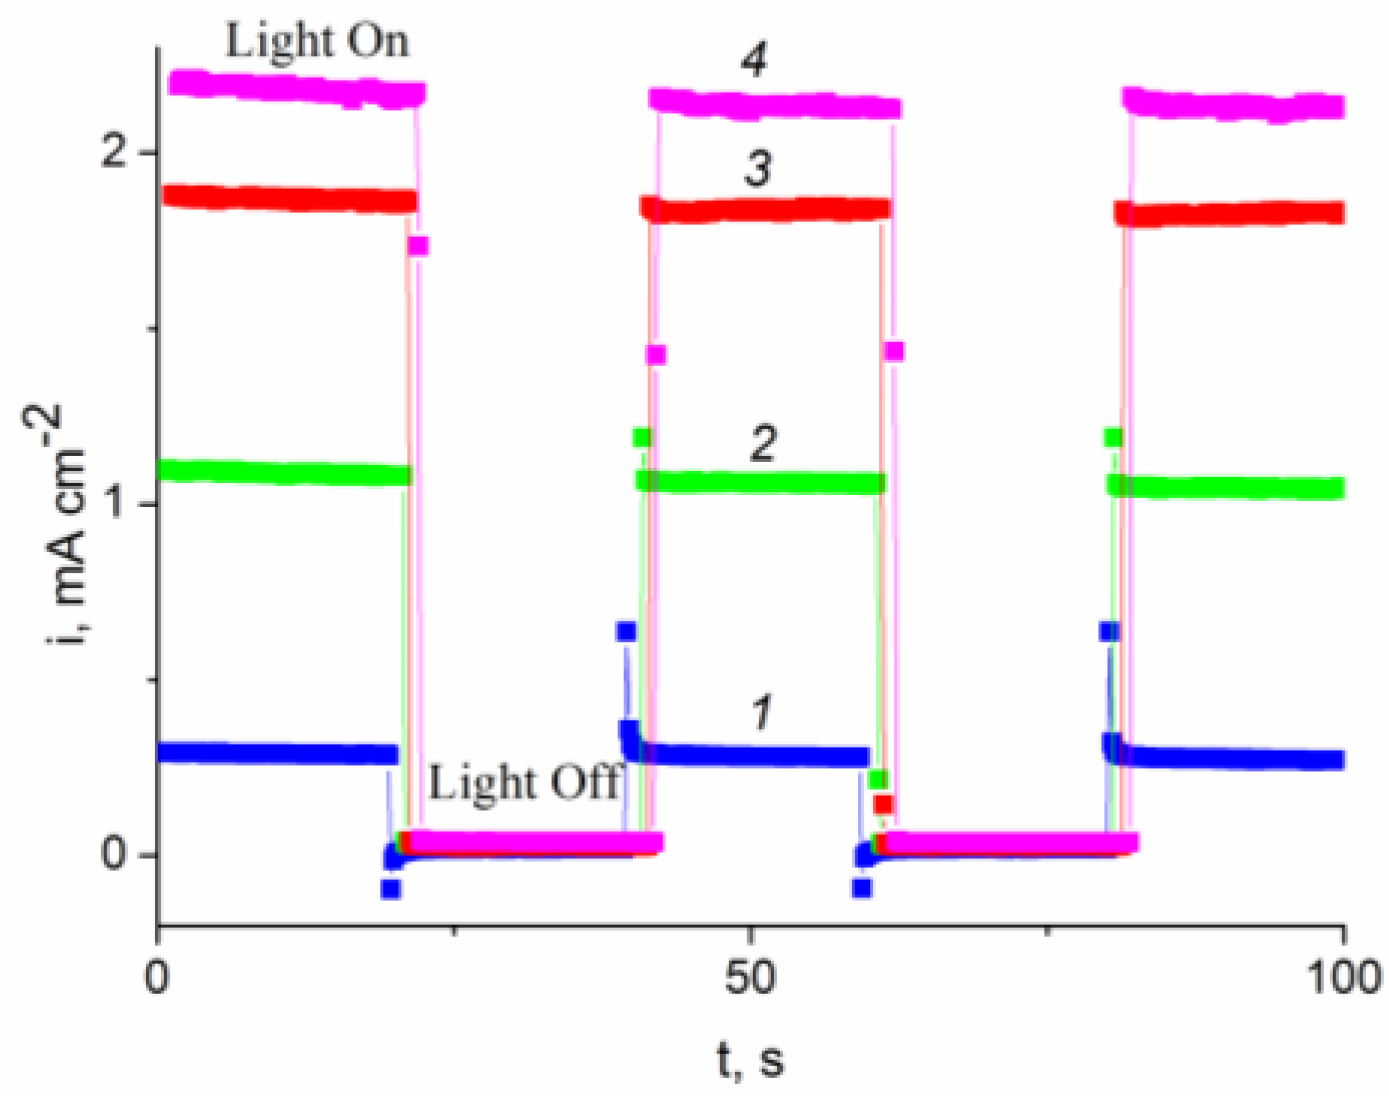
2.6. Photoelectrochemical Oxidation of Water, Methanol, Ethylene Glycol, and Glycerol on Sn Modified Hematite Photoanodes
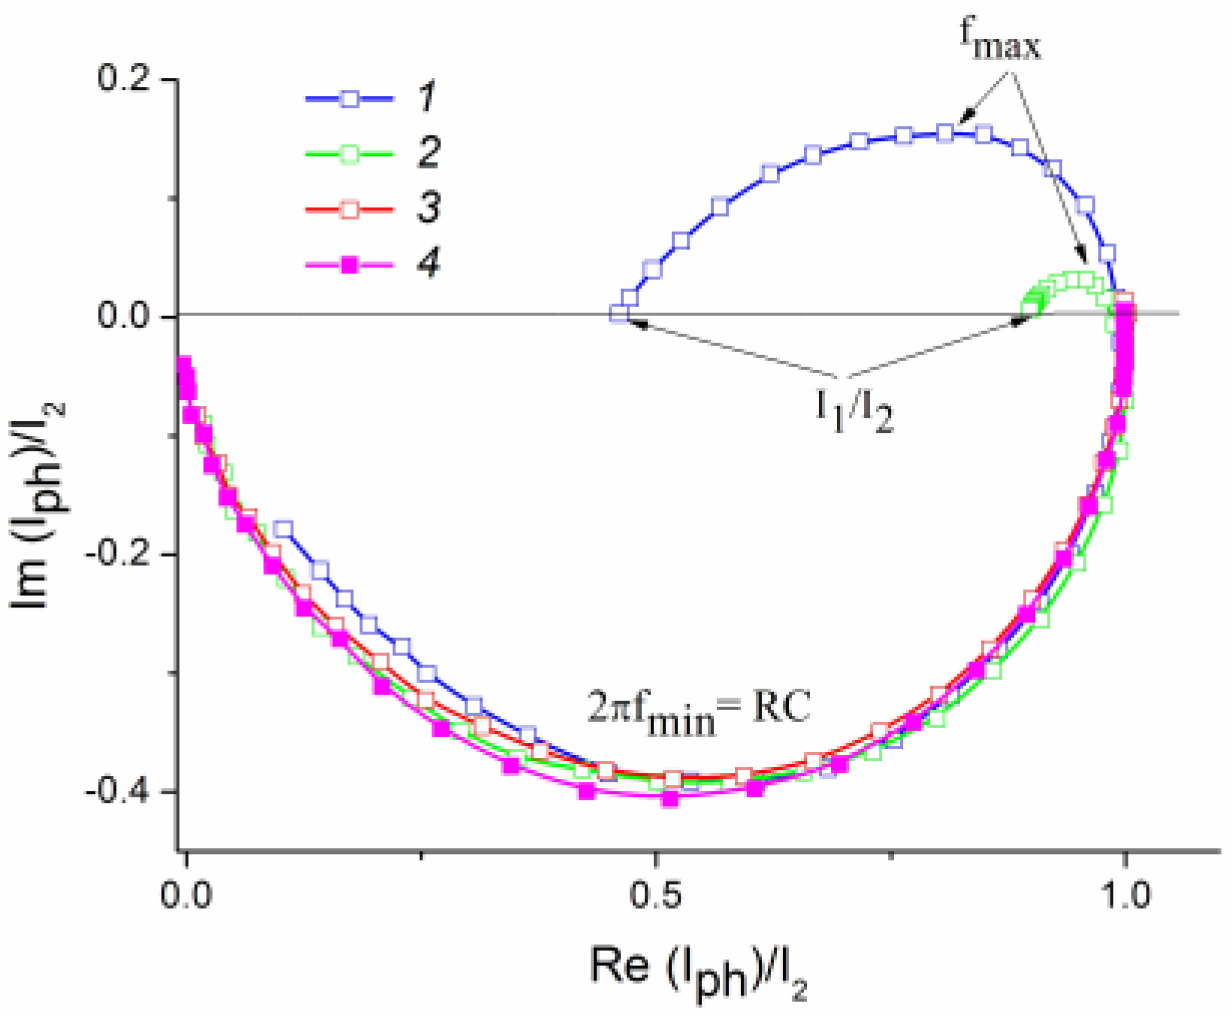
2.7. Evaluation of Recombination Losses in the Photoelectrooxidation of Alcohols
3. Experimental Section
3.1. Materials
3.2. Preparation of Hematite Films
3.3. Modification of Hematite Films
3.4. Characterization of the Samples: Study of the Phase Composition and Structure of Film Coatings
3.4.1. X-ray Diffraction
3.4.2. Absorption Spectra
3.4.3. Raman Spectra
3.4.4. SEM and EDX Measurement
3.4.5. Film Thickness Measurement
3.4.6. AFM Measurement
3.4.7. XPS Measurement
3.4.8. Photoelectrochemical Measurements
4. Conclusions
Supplementary Materials
Author Contributions
Funding
Data Availability Statement
Acknowledgments
Conflicts of Interest
References
- Mishra, M.; Chun, D. α-Fe2O3 as a photocatalytic material: A review. Appl. Catal. A Gen. 2015, 498, 126–141. [Google Scholar] [CrossRef]
- Lu, X.; Xie, S.; Yang, H.; Tong, Y.; Ji, H. Photoelectrochemical hydrogen production from biomass derivatives and water. Chem. Soc. Rev. 2014, 43, 7581–7593. [Google Scholar] [CrossRef]
- Liu, D.; Liu, J.-C.; Cai, W.; Ma, J.; Yang, H.B.; Xiao, H.; Li, J.; Xiong, Y.; Huang, Y.; Liu, B. Selective photoelectrochemical oxidation of glycerol to high value-added dihydroxyacetone. Nat. Commun. 2019, 10, 1779–1787. [Google Scholar] [CrossRef]
- Peleyeju, M.G.; Arotiba, O.A. Recent trend in visible-light photoelectrocatalytic systems for degradation of organic contaminants in water/wastewater. Environ. Sci. Water Res. Technol. 2018, 4, 1389–1411. [Google Scholar] [CrossRef]
- Klahr, B.; Gimenez, S.; Zandi, O.; Fabregat-Santiago, F.; Hamann, T. Competitive Photoelectrochemical Methanol and Water Oxidation with Hematite Electrodes. ACS Appl. Mater. Interfaces 2015, 7, 7653–7660. [Google Scholar] [CrossRef]
- Lee, Y.; Kim, S.; Jeong, S.Y.; Seo, S.; Kim, C.; Yoon, H.; Jang, H.W.; Lee, S. Surface-Modified Co-doped ZnO Photoanode for Photoelectrochemical Oxidation of Glycerol. Catal. Today 2021, 359, 43–49. [Google Scholar] [CrossRef]
- Fujishima, A.; Honda, K. Electrochemical Photolysis of Water at a Semiconductor Electrode. Nature 1972, 238, 37–38. [Google Scholar] [CrossRef] [PubMed]
- Qin, D.D.; Tao, C.L.; Friesen, S.A.; Wang, T.H.; Varghese, O.K.; Bao, N.Z.; Yang, Z.Y.; Mallouk, T.E.; Grimes, C.A. Dense layers of vertically oriented WO3 crystals as anodes for photoelectrochemical water oxidation. Chem. Commun. 2012, 48, 729–731. [Google Scholar] [CrossRef] [PubMed]
- He, H.C.; Berglund, S.P.; Xiao, P.; Chemelewski, W.D.; Zhang, Y.H.; Mullins, C.B. Nanostructured Bi2S3/WO3 heterojunction films exhibiting enhanced photoelectrochemical performance. J. Mater. Chem. A 2013, 1, 12826–12834. [Google Scholar] [CrossRef]
- Sivula, K.; Le Formal, F.; Grätzel, M. Solar Water Splitting: Progress Using Hematite (α-Fe2O3) Photoelectrodes. ChemSusChem 2011, 4, 432–449. [Google Scholar] [CrossRef]
- Lin, Y.; Yuan, G.; Sheehan, S.; Zhou, S.; Wang, D. Hematite-based solar water splitting: Challenges and opportunities. Energy Environ. Sci. 2011, 4, 4862–4869. [Google Scholar] [CrossRef]
- Martinson, A.B.F.; DeVries, M.J.; Libera, J.A.; Christensen, S.T.; Hupp, J.T.; Pellin, M.J.; Elam, J.W. Atomic Layer Deposition of Fe2O3 Using Ferrocene and Ozone. J. Phys. Chem. C 2011, 115, 4333–4339. [Google Scholar] [CrossRef]
- Pu, Y.C.; Wang, G.; Chang, K.D.; Ling, Y.; Lin, Y.K.; Fitzmorris, B.C.; Liu, C.M.; Lu, X.; Tong, Y.; Zhang, J.Z.; et al. Au Nanostructure-Decorated TiO2 Nanowires Exhibiting Photoactivity Across Entire UV-visible Region for Photoelectrochemical Water Splitting. Nano Lett. 2013, 13, 3817–3823. [Google Scholar] [CrossRef] [PubMed]
- Cooper, J.K.; Ling, Y.; Longo, C.; Li, Y.; Zhang, J.Z. Effects of Hydrogen Treatment and Air Annealing on Ultrafast Charge Carrier Dynamics in ZnO Nanowires Under in Situ Photoelectrochemical Conditions. Phys. Chem. C 2012, 116, 17360–17368. [Google Scholar] [CrossRef]
- Park, H.S.; Lee, H.C.; Leonard, K.C.; Liu, G.; Bard, A.J. Unbiased Photoelectrochemical Water Splitting in Z-Scheme Device Using W/Mo-Doped BiVO4and ZnxCd1−xSe. ChemPhysChem 2013, 14, 2277–2287. [Google Scholar] [CrossRef]
- Zhang, X.; Lu, X.; Shen, Y.; Han, J.; Yuan, L.; Gong, L.; Xu, Z.; Bai, X.; Wei, M.; Tong, Y.; et al. Three-dimensional WO3nanostructures on carbon paper: Photoelectrochemical property and visible light driven photocatalysis. Chem. Commun. 2011, 47, 5804–5806. [Google Scholar] [CrossRef]
- Paracchino, A.; Laporte, V.; Sivula, K.; Grätzel, M.; Thimsen, E. Highly active oxide photocathode for photoelectrochemical water reduction. Nat. Mater. 2011, 10, 456–461. [Google Scholar] [CrossRef]
- Gu, J.; Yan, Y.; Krizan, J.W.; Gibson, Q.D.; Detweiler, Z.M.; Cava, R.J.; Bocarsly, A.B. Rhombohedral Polytypes of the Layered Honeycomb Delafossites with Optical Brilliance in the Visible. J. Am. Chem. Soc. 2014, 136, 830–833. [Google Scholar] [CrossRef]
- Schneider, J.; Matsuoka, M.; Takeuchi, M.; Zhang, J.; Horiuchi, Y.; Anpo, M.; Bahnemann, D.W. Understanding TiO2 Photocatalysis: Mechanisms and Materials. Chem. Rev. 2014, 114, 9919–9986. [Google Scholar] [CrossRef]
- Zhang, M.; Pu, W.; Pan, S. Photoelectrocatalytic activity of liquid phase deposited α-Fe2O3 films under visible light illumination. J. Alloy Compd. 2015, 648, 719–725. [Google Scholar] [CrossRef]
- Mesa, C.A.; Kafizas, A.; Francas, L.; Pendlebury, S.R.; Pastor, E.; Ma, Y.; Le Formal, F.; Mayer, M.T.; Grätzel, M.; Durrant, J.R. Kinetics of Photoelectrochemical Oxidation of Methanol on Hematite Photoanodes. J. Am. Chem. Soc. 2017, 139, 11537–11543. [Google Scholar] [CrossRef] [PubMed]
- Iervolino, G.; Tantis, I.; Sygellou, L.; Vaiano, V.; Sannino, D.; Lianos, P. Photocurrent increase by metal modification of Fe2O3 photoanodes and its effect on photoelectrocatalytic hydrogen production by degradation of organic substances. Appl. Surf. Sci. 2017, 400, 176–183. [Google Scholar] [CrossRef]
- Perini, N.; Hessel, C.; Bott-Neto, J.L.; Pires, C.; Fernandez, P.S.; Sitta, E. Photoelectrochemical oxidation of glycerol on hematite: Thermal effects, in situ FTIR and long-term HPLC product analysis. J. Solid. State Electrochem. 2021, 25, 1101–1110. [Google Scholar] [CrossRef]
- Sivula, K.R.; Formal, F.Z.; Robert, R.; Weidenkaff, A.; Tucek, J.; Frydrych, J.; Gratzel, M. Photoelectrochemical water splitting with mesoporous hematite prepared by a solution-based colloidal approach. J. Am. Chem. Soc. 2010, 132, 7436–7444. [Google Scholar] [CrossRef]
- Cardillo, D.; Konstantinov, K.; Devers, T. The effects of cerium doping on the size, morphology, and optical properties of α -hematite nanoparticles for ultraviolet filtration. Mater. Res. Bull. 2013, 48, 4521–4525. [Google Scholar] [CrossRef]
- Grinberg, V.A.; Emets, V.V.; Mayorova, N.A.; Averin, A.A.; Tsodikov, M.V.; Maslov, D.A. Methanol Photoelectrooxidation on Hematite Films Modified with TiO2, Bi, and Co. Russ. J. Electrochem. 2022, 58, 667–675. [Google Scholar] [CrossRef]
- Grinberg, V.A.; Emets, V.V.; Mayorova, N.A.; Averin, A.A.; Shiryaev, A.A. Photoelectrocatalytic Properties of a Ti-Modified Nanocrystalline Hematite Film Photoanode. Catalysts 2022, 12, 1243. [Google Scholar] [CrossRef]
- Grinberg, V.A.; Emets, V.V.; Mayorova, N.A.; Averin, A.A.; Shiryaev, A.A. Photoelectrocatalytic Activity of ZnO-Modified Hematite Films in the Reaction of Alcohol Degradation. Int. J. Mol. Sci. 2023, 24, 14046. [Google Scholar] [CrossRef]
- Ling, Y.C.; Wang, G.M.; Wheeler, D.A.; Zhang, J.Z.; Li, Y. Sn-Doped Hematite Nanostructures for Photoelectrochemical Water Splitting. Nano Lett. 2011, 11, 2119–2125. [Google Scholar] [CrossRef]
- Bak, A.; Choi, W.; Park, H. Enhancing the photoelectrochemical performance of hematite α-Fe2O3) electrodes by cadmium incorporation. Appl. Catal. B 2011, 110, 207–215. [Google Scholar] [CrossRef]
- Fu, Z.; Jiang, T.; Liu, Z.; Wang, D.; Wang, L.; Xie, T. Highly photoactive Ti-doped α -Fe2O3 nanorod arrays photoanode prepared by a hydrothermal method for photoelectrochemical water splitting. Electrochim. Acta 2014, 129, 358–363. [Google Scholar] [CrossRef]
- Wang, L.; Lee, C.Y.; Schmuki, P. Ti and Sn co-doped anodic α-Fe2O3films for efficient water splitting. Electrochem. Commun. 2013, 30, 21–25. [Google Scholar] [CrossRef]
- Wang, L.; Lee, C.Y.; Mazare, A.; Lee, K.Y.; Muller, J.; Spiecker, E.; Schmuki, P. Enhancing the Water Splitting Efficiency of Sn-Doped Hematite Nanoflakes by Flame Annealing. Chem. Eur. J. 2014, 20, 77–82. [Google Scholar] [CrossRef] [PubMed]
- Cesar, I.; Kay, A.; Gonzalez Martinez, J.A.; Gräetzel, M. Translucent thin film Fe2O3 photoanodes for efficient water splitting by sunlight: Nanostructure-directing effect of Si-doping. J. Am. Chem. Soc. 2006, 128, 4582–4583. [Google Scholar] [CrossRef] [PubMed]
- Park, C.-D.; Walker, J.; Tannenbaum, R.; Stiegman, A.E.; Frydrych, J.; Machala, L. Sol-gel-derived iron oxide thin films on silicon: Surface properties and interfacial chemistry. ACS Appl. Mater. Interfaces 2009, 1, 1843–1846. [Google Scholar] [CrossRef]
- Ueda, K.; Minegishi, T.; Clune, J.; Nakabayashi, M.; Hisatomi, T.; Nishiyama, H.; Katayama, M.; Shibata, N.; Kubota, J.; Yamada, T.; et al. Photoelectrochemical Oxidation of Water Using BaTaO2N Photoanodes Prepared by Particle Transfer Method. J. Am. Chem. Soc. 2015, 137, 2227–2230. [Google Scholar] [CrossRef]
- Tian, C.M.; Li, W.-W.; Lin, Y.M.; Yang, Z.Z.; Wang, L.; Du, Y.G.; Xiao, H.Y.; Qiao, L.; Zhang, J.Y.; Chen, L.; et al. Electronic Structure, Optical Properties, and Photoelectrochemical Activity of Sn-Doped Fe2O3 Thin Films. J. Phys. Chem. C 2020, 124, 12548–12558. [Google Scholar] [CrossRef]
- Sun, Y.Q.; Chemelewski, W.D.; Berglund, S.P.; Li, C.; He, H.C.; Shi, G.Q.; Mullins, C.B. Antimony-Doped Tin Oxide Nanorods as a Transparent Conducting Electrode for Enhancing Photoelectrochemical Oxidation of Water by Hematite. ACS Appl. Mater. Interfaces 2014, 6, 5494–5499. [Google Scholar] [CrossRef]
- Schrebler, R.; Llewelyn, C.; Vera, F.; Cury, P.; Munoz, E.; del Rio, R.; Gomez Meier, H.; Cordova, R.; Dalchiele, E.A. An electrochemical deposition route for obtaining α-Fe2O3 thin films. EQCM Study and Semiconductor Properties. Electrochem. Solid. State Lett. 2007, 10, D95–D99. [Google Scholar] [CrossRef]
- Zheng, J.Y.; Son, S.I.; Van, T.K.; Kang, Y.S. Preparation of α-Fe2O3 films by electrodeposition and photodeposition of Co-Pi on them to enhance their photoelectrochemical properties. RSC Adv. 2015, 5, 36307–36314. [Google Scholar] [CrossRef]
- Kumar, P.; Sharma, P.; Shrivastav, R.; Dass, S.; Satsangi, V.R. Electrodeposited zirconium-doped α-Fe2O3 thin film for photoelectrochemical water splitting. Int. J. Hydrog. Energy 2011, 36, 2777–2784. [Google Scholar] [CrossRef]
- Qin, D.-D.; Li, Y.-L.; Wang, T.; Li, Y.; Lu, X.-Q.; Gu, J.; Zhao, Y.-X.; Song, Y.-M.; Tao, C.-L. Sn-doped hematite films as photoanodes for efficient photoelectrochemical water oxidation. J. Mater. Chem. A 2015, 3, 136751–136755. [Google Scholar] [CrossRef]
- Chakrabarti, M.; Dutta, S.; Chattapadhyay, S.; Sarkar, A.; Sanyal, D.; Chakrabarti, A. Grain size dependence of optical properties and positron annihilation parameters in Bi2O3 powder. J. Nanotech. 2004, 15, 017. [Google Scholar] [CrossRef] [PubMed]
- Spray, R.L.; McDonald, K.J.; Choi, K.S. Enhancing Photoresponse of Nanoparticulate α-Fe2O3 Electrodes by Surface Composition Tuning. J. Phys. Chem. C 2011, 115, 3497–3506. [Google Scholar] [CrossRef]
- Guo, X.; Wang, L.; Tan, Y. Hematite Nanorods Co-Doped with Ru Cations with Different Valence States as High Performance Photoanodes for Water Splitting. Nano Energy 2015, 16, 320–328. [Google Scholar] [CrossRef]
- Kennedy, J.H.; Anderman, M.; Shinar, R. Photoactivity of polycrystalline alpha-Fe2O 3 electrodes doped with group IVA elements. J. Electrochem. Soc. 1981, 128, 2371. [Google Scholar] [CrossRef]
- Hahn, N.T.; Mullins, C.B. Photoelectrochemical Performance of Nanostructured Ti- and Sn-Doped α-Fe2O3 Photoanodes. Chem. Mater. 2010, 22, 6474–6482. [Google Scholar] [CrossRef]
- Jang, J.S.; Lee, J.; Ye, H.; Fan, F.R.F.; Bard, A.J. Rapid Screening of Effective Dopants for Fe2O3Photocatalysts with Scanning Electrochemical Microscopy and Investigation of Their Photoelectrochemical Properties. J. Phys. Chem. C 2009, 113, 6719–6724. [Google Scholar] [CrossRef]
- Gaudon, M.; Pailhe, N.; Majimel, J.; Wattiaux, A.; Abel, J.; Demourgues, A. Influence of Sn4+ and Sn4+/Mg2+ doping on structural features and visible absorption properties of α-Fe2O3 hematite. J. Solid. State Chem. 2010, 183, 2101–2109. [Google Scholar] [CrossRef]
- Aroutiounian, V.M.; Arakelyan, V.M.; Shahnazaryan, G.E.; Hovhannisyan, H.R.; Wang, H.; Turner, J.A. Photoelectrochemistry of tin-doped iron oxide electrodes. Sol. Energy 2007, 81, 1369–1376. [Google Scholar] [CrossRef]
- Hansson, R.; Hayes, P.C.; Jak, E. Experimental Study of Phase Equilibria in the Fe-Sn-Zn-O. System in Air. Can. Metall. Q. 2004, 43, 545–554. [Google Scholar] [CrossRef]
- Moh, G.H. Tin Containing Mineral Systems. Part I: The Sn-Fe-S-O System and Mineral Assemblages in Ores. Chem. Erde 1974, 33, 243–275. [Google Scholar]
- Ribut, S.H.; Abdullaha, C.A.C.; Yusoff, M.Z.M. Investigations of structural and optical properties of zinc oxide thin films growth on various substrates. Results Phys. 2019, 13, 102146. [Google Scholar] [CrossRef]
- Hu, Y.S.; Kleiman-Shwarsctein, A.; Forman, A.J.; Hazen, D.; Park, J.N.; McFarland, E.W. Pt-Doped α-Fe2O3 Thin Films Active for Photoelectrochemical Water Splitting. Chem. Mater. 2008, 20, 3803–3805. [Google Scholar] [CrossRef]
- Suresh, J.; Yuvakkumar, R.; Sundrarajan, M.; Hong, S.I. Green synthesis of magnesium oxide nanoparticles. Adv. Mater. Res. 2014, 952, 141–144. [Google Scholar] [CrossRef]
- Dash, P.; Pattanayak, S.; Majhi, M.; Nayak, B. Facile and controllable synthesis of hematite (α-Fe2O3) nanostructures using GRA-APSO and ANN: Reaction performance optimization for haemotoxicity and MRI assessment. J. Alloys Compd. 2023, 957, 170383. [Google Scholar] [CrossRef]
- Tauc, J.; Menth, A. States in the gap. J. Non-Cryst. Solids 1972, 8–10, 569–585. [Google Scholar] [CrossRef]
- Mirbagheri, N.; Wang, D.; Peng, C.; Wang, J.; Huang, Q.; Fan, C.; Ferapontova, E.E. Visible Light Driven Photoelectrochemical Water Oxidation by Zn- and Ti-Doped Hematite Nanostructures. ACS Catalysis 2014, 4, 2006–2015. [Google Scholar] [CrossRef]
- Peter, L.M.; Ponomarev, E.A.; Fermin, D.J. Intensity-modulated photocurrent spectroscopy: Reconciliation of phenomenological analysis with multistep electron transfer mechanisms. J. Electroanal. Chem. 1997, 427, 79–96. [Google Scholar] [CrossRef]
- Peter, L.M.; Wijayantha, K.G.U.; Tahir, A.A. Kinetics of light-driven oxygen evolution at a-Fe2O3 electrodes. J. Faraday Discuss. 2012, 155, 309–322. [Google Scholar] [CrossRef]
- Klotz, D.; Ellis, D.S.; Dotana, H.; Rothschild, A. Empirical in operando Analysis of the Charge Carrier Dynamics in Hematite Photoanodes by PEIS, IMPS and IMVS. J. Phys. Chem. Chem. Phys. 2016, 18, 23438–23457. [Google Scholar] [CrossRef] [PubMed]
- Shirley, D.A. High-resolution X-ray photoemission spectrum of the valence bands of gold. Phys. Rev. B 1972, 5, 4709–4714. [Google Scholar] [CrossRef]
- Grosvenor, A.P.; Kobe, B.A.; Biesinger, M.C.; McIntyre, N.S. Investigation of multiplet splitting of Fe2p XPS spectra and bonding in iron compounds. Surf. Interface Anal. 2004, 36, 1564–1574. [Google Scholar] [CrossRef]


Disclaimer/Publisher’s Note: The statements, opinions and data contained in all publications are solely those of the individual author(s) and contributor(s) and not of MDPI and/or the editor(s). MDPI and/or the editor(s) disclaim responsibility for any injury to people or property resulting from any ideas, methods, instructions or products referred to in the content. |
© 2023 by the authors. Licensee MDPI, Basel, Switzerland. This article is an open access article distributed under the terms and conditions of the Creative Commons Attribution (CC BY) license (https://creativecommons.org/licenses/by/4.0/).
Share and Cite
Grinberg, V.A.; Emets, V.V.; Modestov, A.D.; Averin, A.A.; Shiryaev, A.A.; Botryakova, I.G.; Shapagin, A.V. Sn-Doped Hematite Films as Photoanodes for Photoelectrochemical Alcohol Oxidation. Catalysts 2023, 13, 1397. https://doi.org/10.3390/catal13111397
Grinberg VA, Emets VV, Modestov AD, Averin AA, Shiryaev AA, Botryakova IG, Shapagin AV. Sn-Doped Hematite Films as Photoanodes for Photoelectrochemical Alcohol Oxidation. Catalysts. 2023; 13(11):1397. https://doi.org/10.3390/catal13111397
Chicago/Turabian StyleGrinberg, Vitali A., Victor V. Emets, Alexander D. Modestov, Aleksey A. Averin, Andrei A. Shiryaev, Inna G. Botryakova, and Aleksey V. Shapagin. 2023. "Sn-Doped Hematite Films as Photoanodes for Photoelectrochemical Alcohol Oxidation" Catalysts 13, no. 11: 1397. https://doi.org/10.3390/catal13111397