Article

The Structure Effect on the Activity and Strength of an Industrial Honeycomb Catalyst Derived from Different Ti Sources

1
State Key Laboratory of Multi-phase Complex Systems, Institute of Process Engineering, Chinese Academy of Sciences, Beijing 100190, China
2
School of Chemistry and Chemical Engineering, University of Chinese Academy of Sciences, Beijing 100049, China
*
Authors to whom correspondence should be addressed.
Equal contribution.
Catalysts 2020, 10(1), 42; https://doi.org/10.3390/catal10010042
Submission received: 29 November 2019 / Revised: 19 December 2019 / Accepted: 27 December 2019 / Published: 31 December 2019
(This article belongs to the Special Issue Catalysis for the Removal of Gas-Phase Pollutants)

Abstract

:
A new honeycomb production process was proposed with both filter cake (from hydrothermal treatment of metatitanic acid) and industrial titanium dioxide as Ti sources. The strength of the obtained pilot product was comparable with the current industrial honeycomb product from only filter cake, but its denitration (DeNOx) efficiency was elevated up to 15 percentage points. Multiple characterizations revealed the filter cake and industrial titanium dioxide to be composed of primary particles and secondary particles, respectively, and the introduced secondary particles from industrial titanium dioxide resulted in increased specific surface area and pore size/volume, facilitating the exposure of more active sites with improved activity. Moreover, a positive correlation property was found between the honeycomb strength and crystallinity for the samples from different titanium sources. The filter cake with rich hydroxyl groups and weak crystallinity could be fused more easily among these primary particles to have a higher strength than industrial titanium dioxide, and the primary particle of the filter cake could fill the pile pore of industrial titanium dioxide and act as a solid phase binder to acquire good strength for the honeycomb using both the filter cake and titanium dioxide as Ti sources. The improved honeycomb product with good activity and strength may have more widespread application for the purification of low temperature flue gas in industry.

1. Introduction

Selective catalytic reduction with NH3 (NH3-SCR) is the most popular technology to eliminate the emission of nitrogen oxides (NOx) from industrial flue gas, in which the DeNOx catalysts play the key role due to their high denitration (DeNOx) efficiency [1,2,3,4]. As the most common commercial catalyst, the honeycomb DeNOx catalysts are largely produced though an extrusion process using industrial titanium dioxide or titanium-tungsten as Ti sources [5,6,7]. To reduce the production cost, our previous study invented a simplified technology process to produce honeycomb catalyst using filter cake as the Ti source derived from hydrothermal treatment of the metatitanic acid precursor [8]. The pilot test of the produced honeycomb confirmed the good DeNOx activity for the purification of low temperature flue gas from a coking plant [9], and the corresponding low temperature DeNOx technology also has obtained good application in industry in the past two years [10].
Compared with honeycomb catalyst produced by industrial titanium dioxide, our honeycomb showed significantly increased axial strength (5.3 MPa) with a high volume density (650 kg/m3). On the other hand, its activity was inferior to the catalyst from the titanium dioxide source [9,11]. For the low temperature DeNOx catalyst, the catalytic life was only about one half to one year owing to the easy formation of ammonium sulfate at a low temperature [5,12]. The deactivation of the catalyst needs to be frequently carried out, as well as the off-line regeneration by heat treatment [13,14,15]. Thus, the strength of the honeycomb is also a very important technical index for a low temperature DeNOx catalyst to keep the catalyst intact in high humidity flue gas and during the regeneration process.
To maintain the good strength, as well as to improve its activity, in this work, we tried to use both the filter cake and industrial titanium dioxide as Ti sources for the pilot production experiment. The obtained honeycomb exhibited obviously increased DeNOx efficiency with a rise of fifteen percent points while maintaining the high strength of the honeycomb. Multiple characterizations were performed for both powdery and honeycomb catalysts to reveal that the aggregation state and crystalline state of particles decided the activity and strength of the samples from different Ti sources. These results demonstrated the great feasibility to use both the filter cake and industrial titanium dioxide as Ti sources to improve the activity while retaining the strength of the produced honeycomb.

2. Results and Discussion

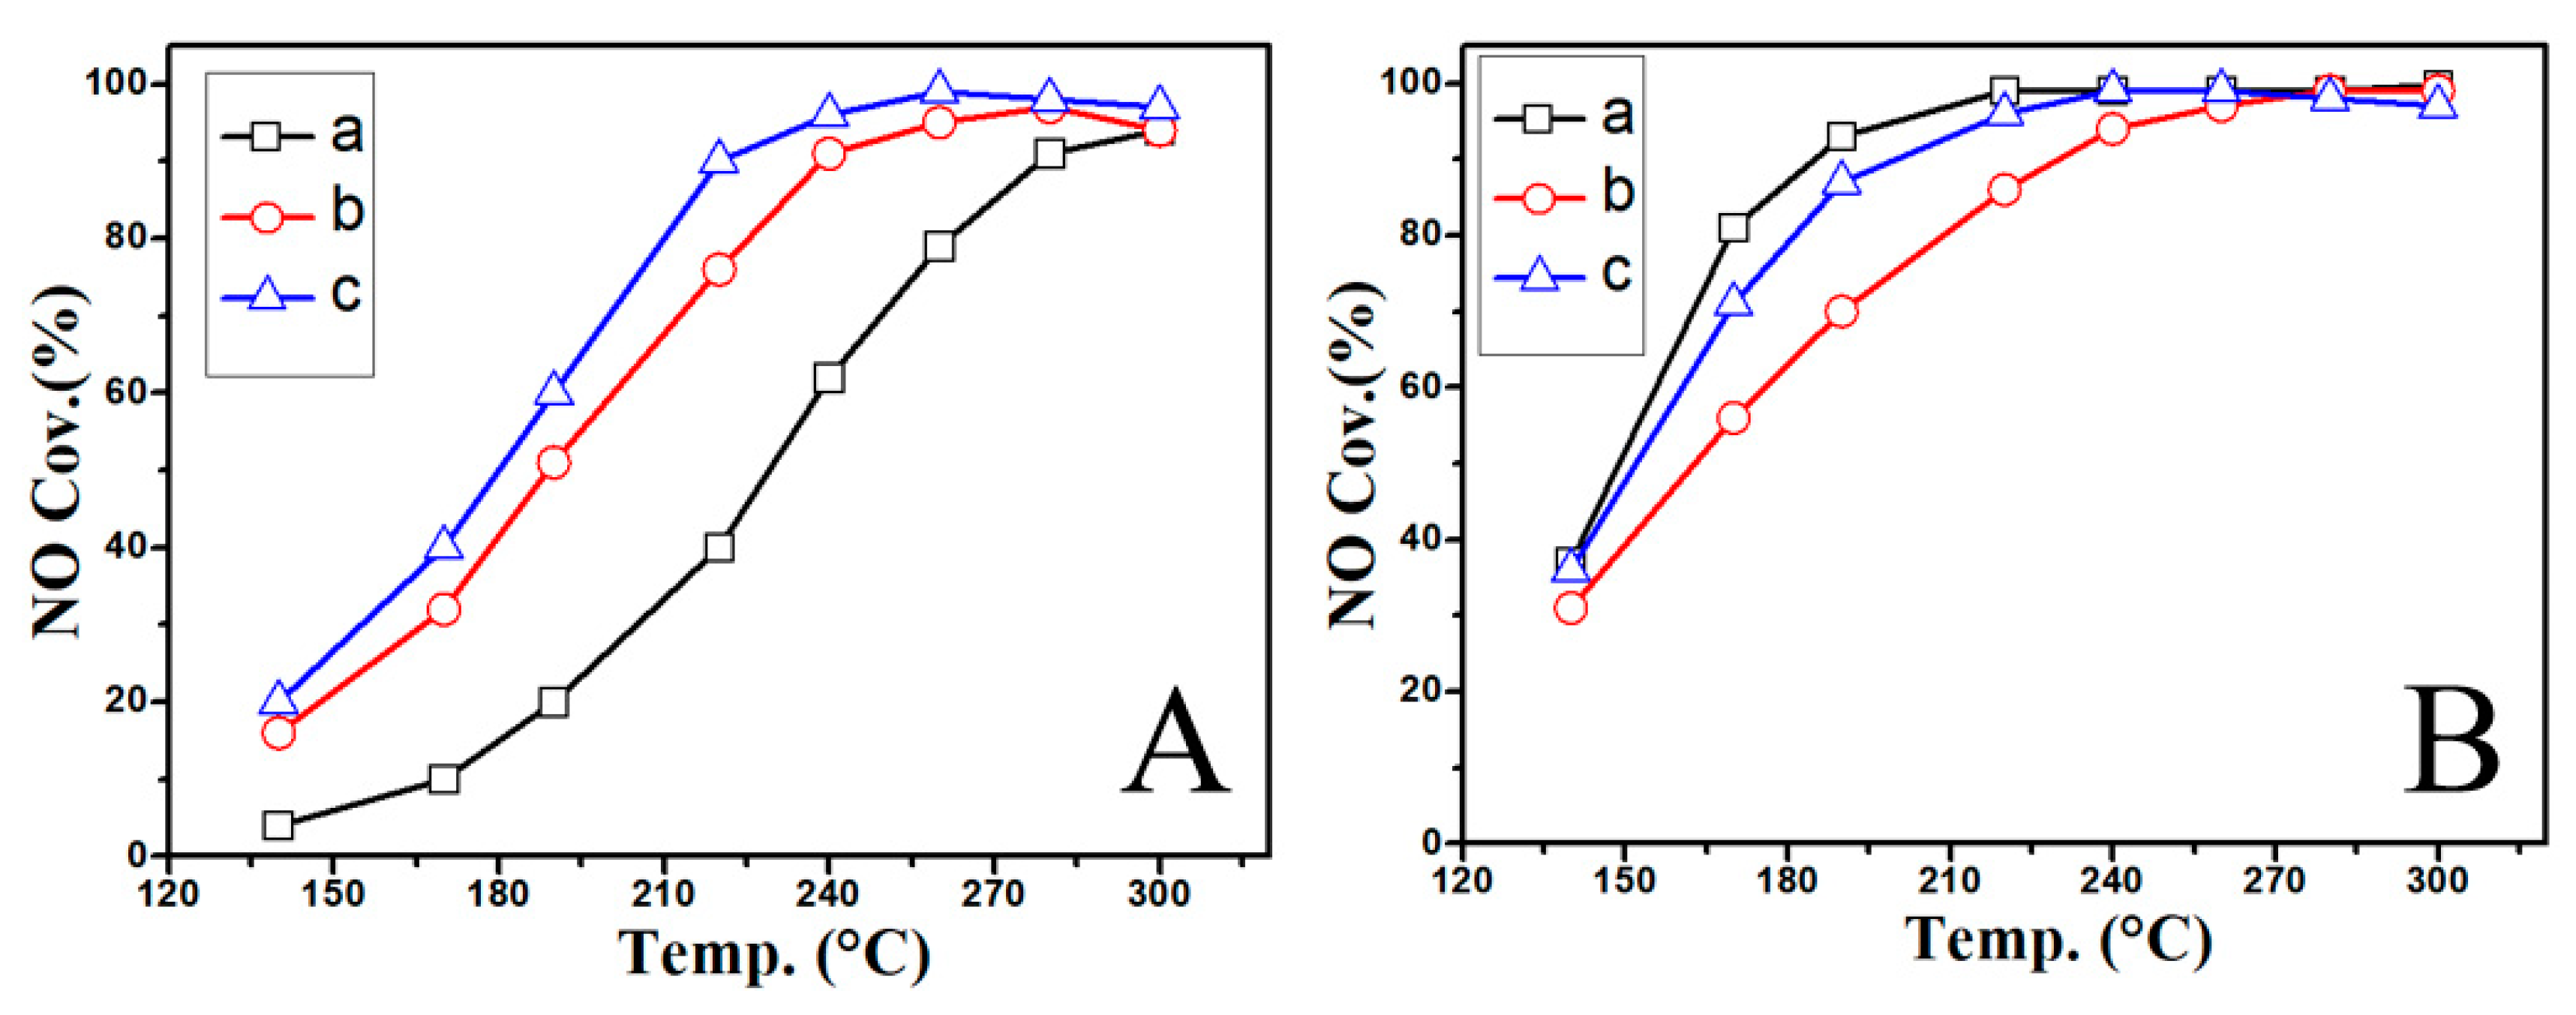
2.1. The Activity of the Powdery/Honeycomb Catalysts with Different Titanium Sources

Figure 1 displays the NH3-SCR performance of powdery and honeycomb catalysts from different titanium sources, respectively. For the powdery catalysts in Figure 1A, the DeNOx efficiency of the sample using the filter cake plus titanium dioxide had significantly increased activity compared with the sample from only filter cake and was close to the activity of the sample from only titanium dioxide. As for the strength, apparently, the powdery catalyst from the filter cake plus titanium dioxide had nearly the same strength as the sample made only from the filter cake, but its strength was superior to the one using only titanium dioxide as the Ti source. Moreover, the two samples with the filter cake were much denser than the one using only titanium dioxide.
Three kinds of honeycombs were then successfully produced at the pilot scale through the filter cake, industrial titanium dioxide, and the filter cake plus titanium dioxide, respectively. The same order of activity was observed for the corresponding powder catalyst in Figure 1B. The honeycomb sample from the filter cake plus titanium dioxide exhibited an obviously increased DeNOx efficiency being fifteen percent higher than the honeycomb from the filter cake in the temperature range of 160–220 °C, and its activity was also close to that of the honeycomb from titanium dioxide. Moreover, the strength of the two honeycombs with the filter cake was markedly higher than the one only with titanium dioxide. These results manifested that the different Ti sources may have a great impact on the catalytic activity and strength, and the relationship of the structure, activity, and strength for the different honeycombs will be discussed in the following text.

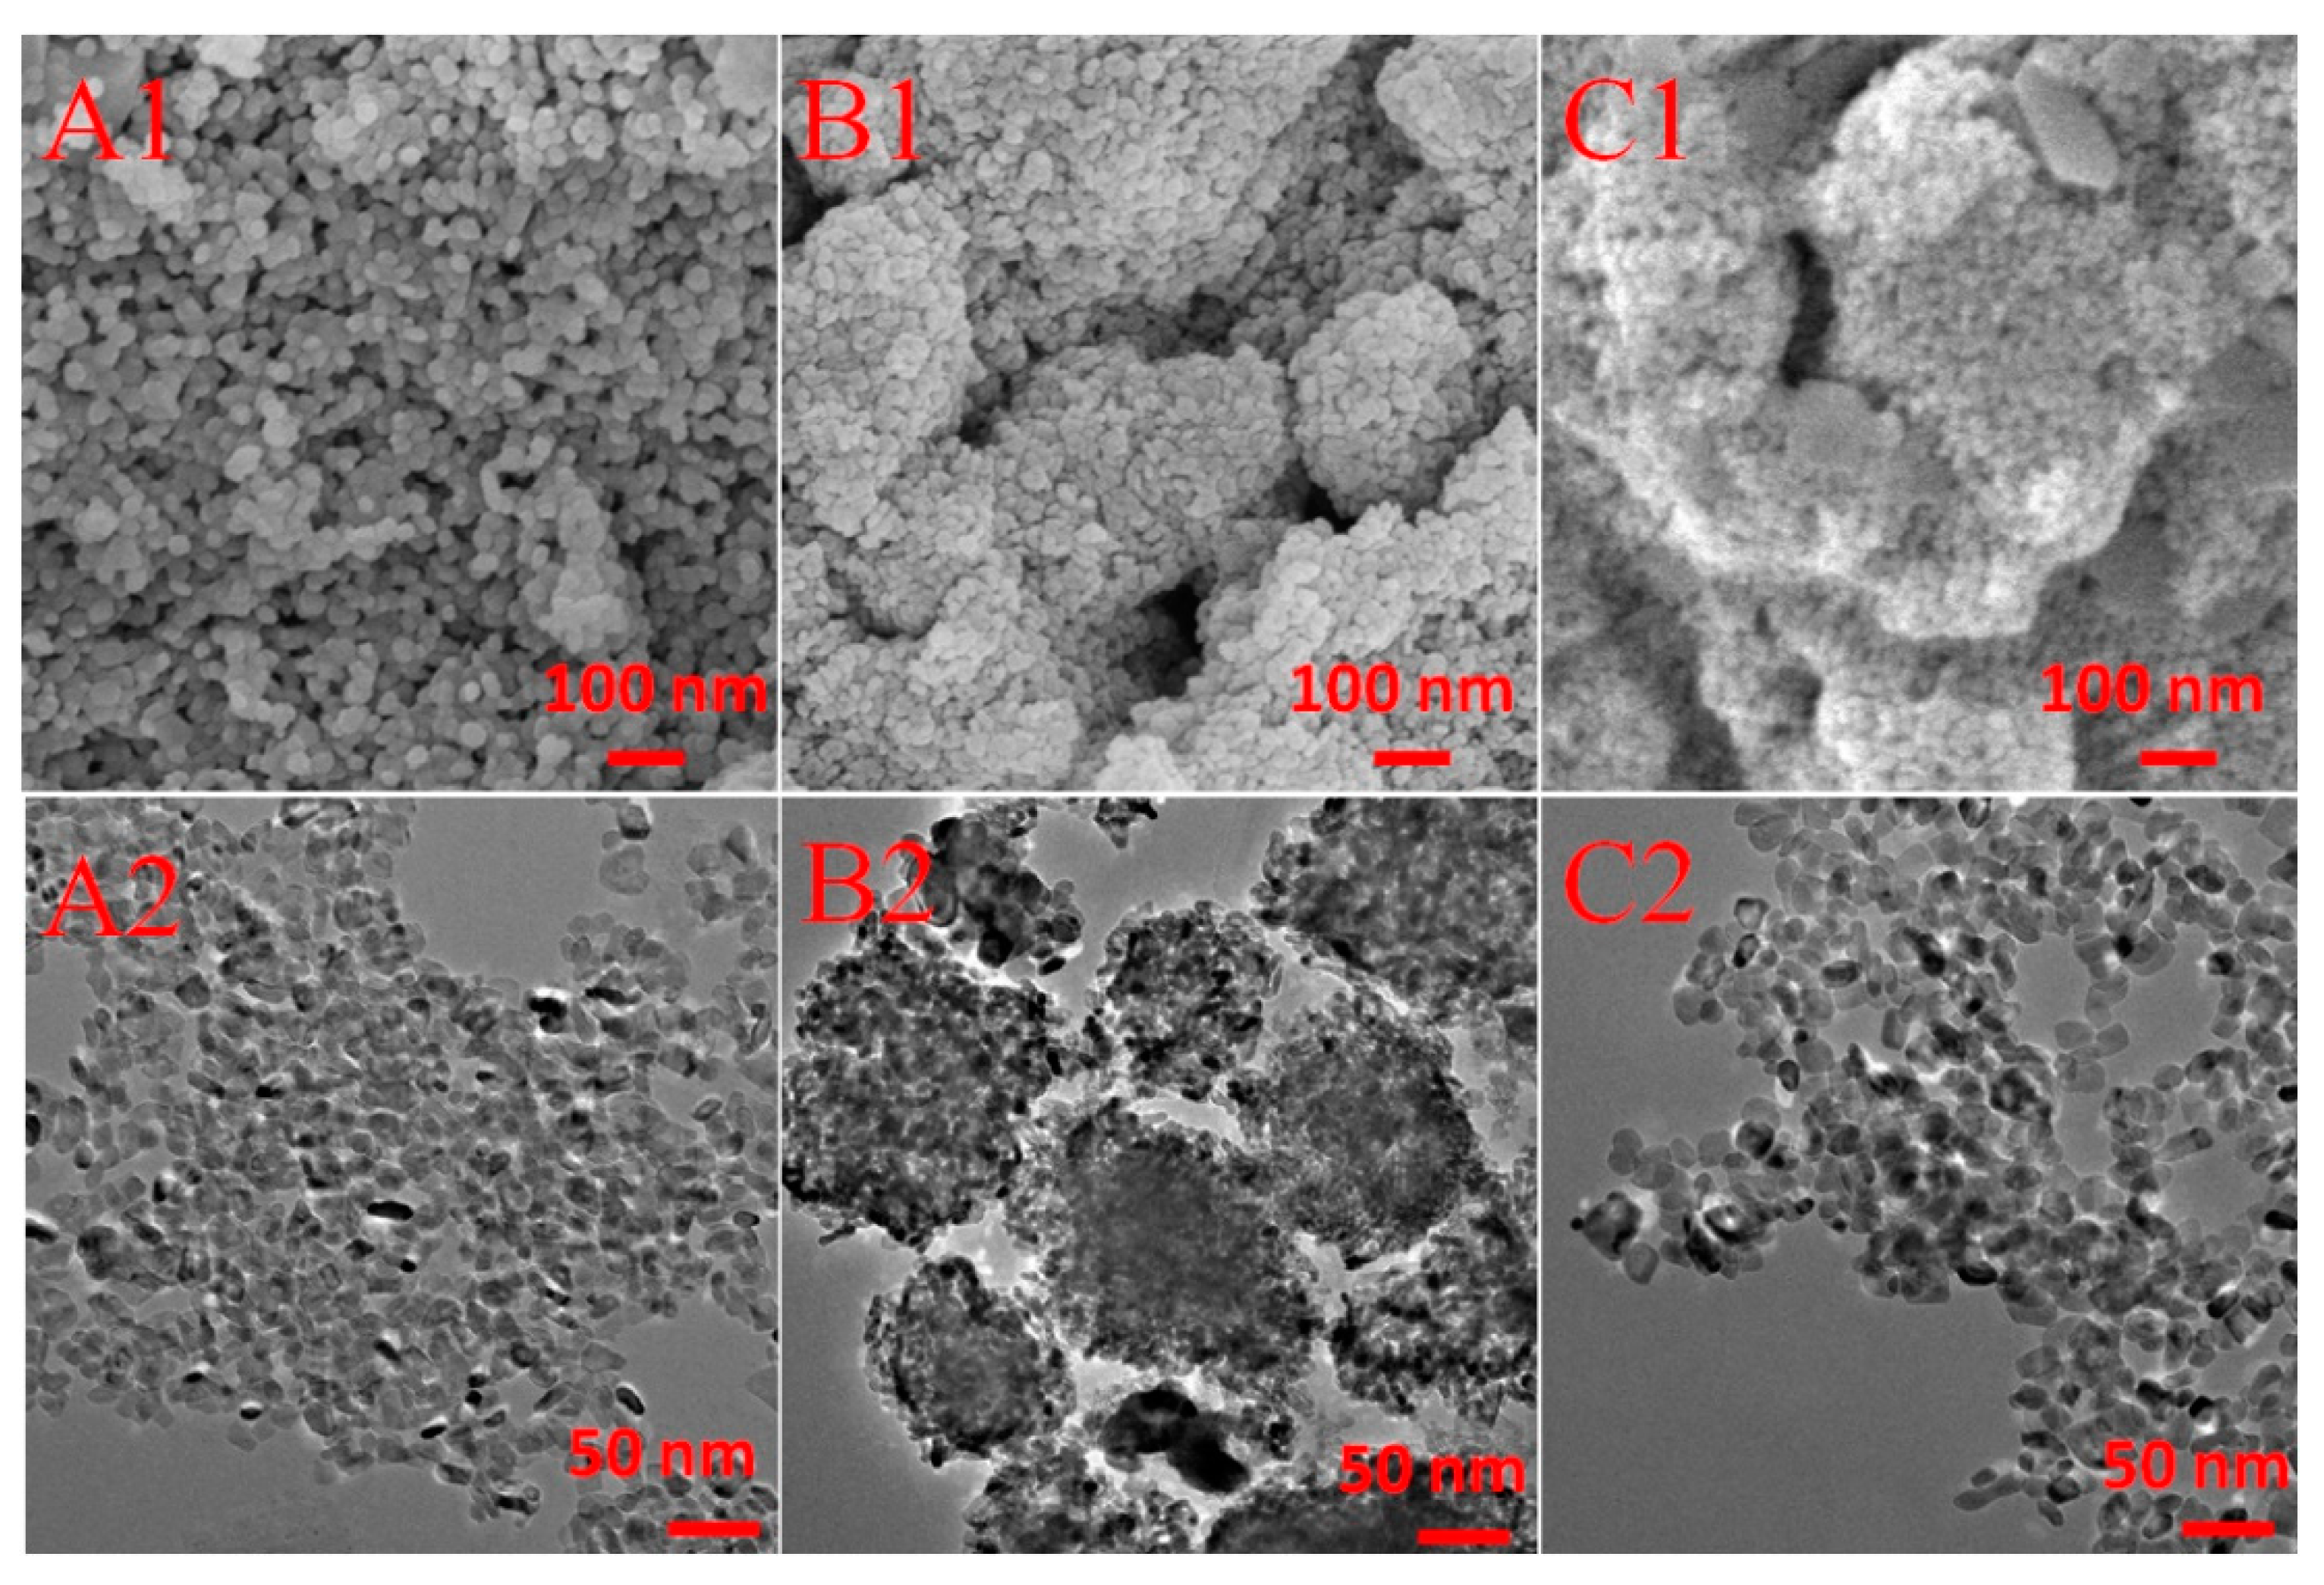
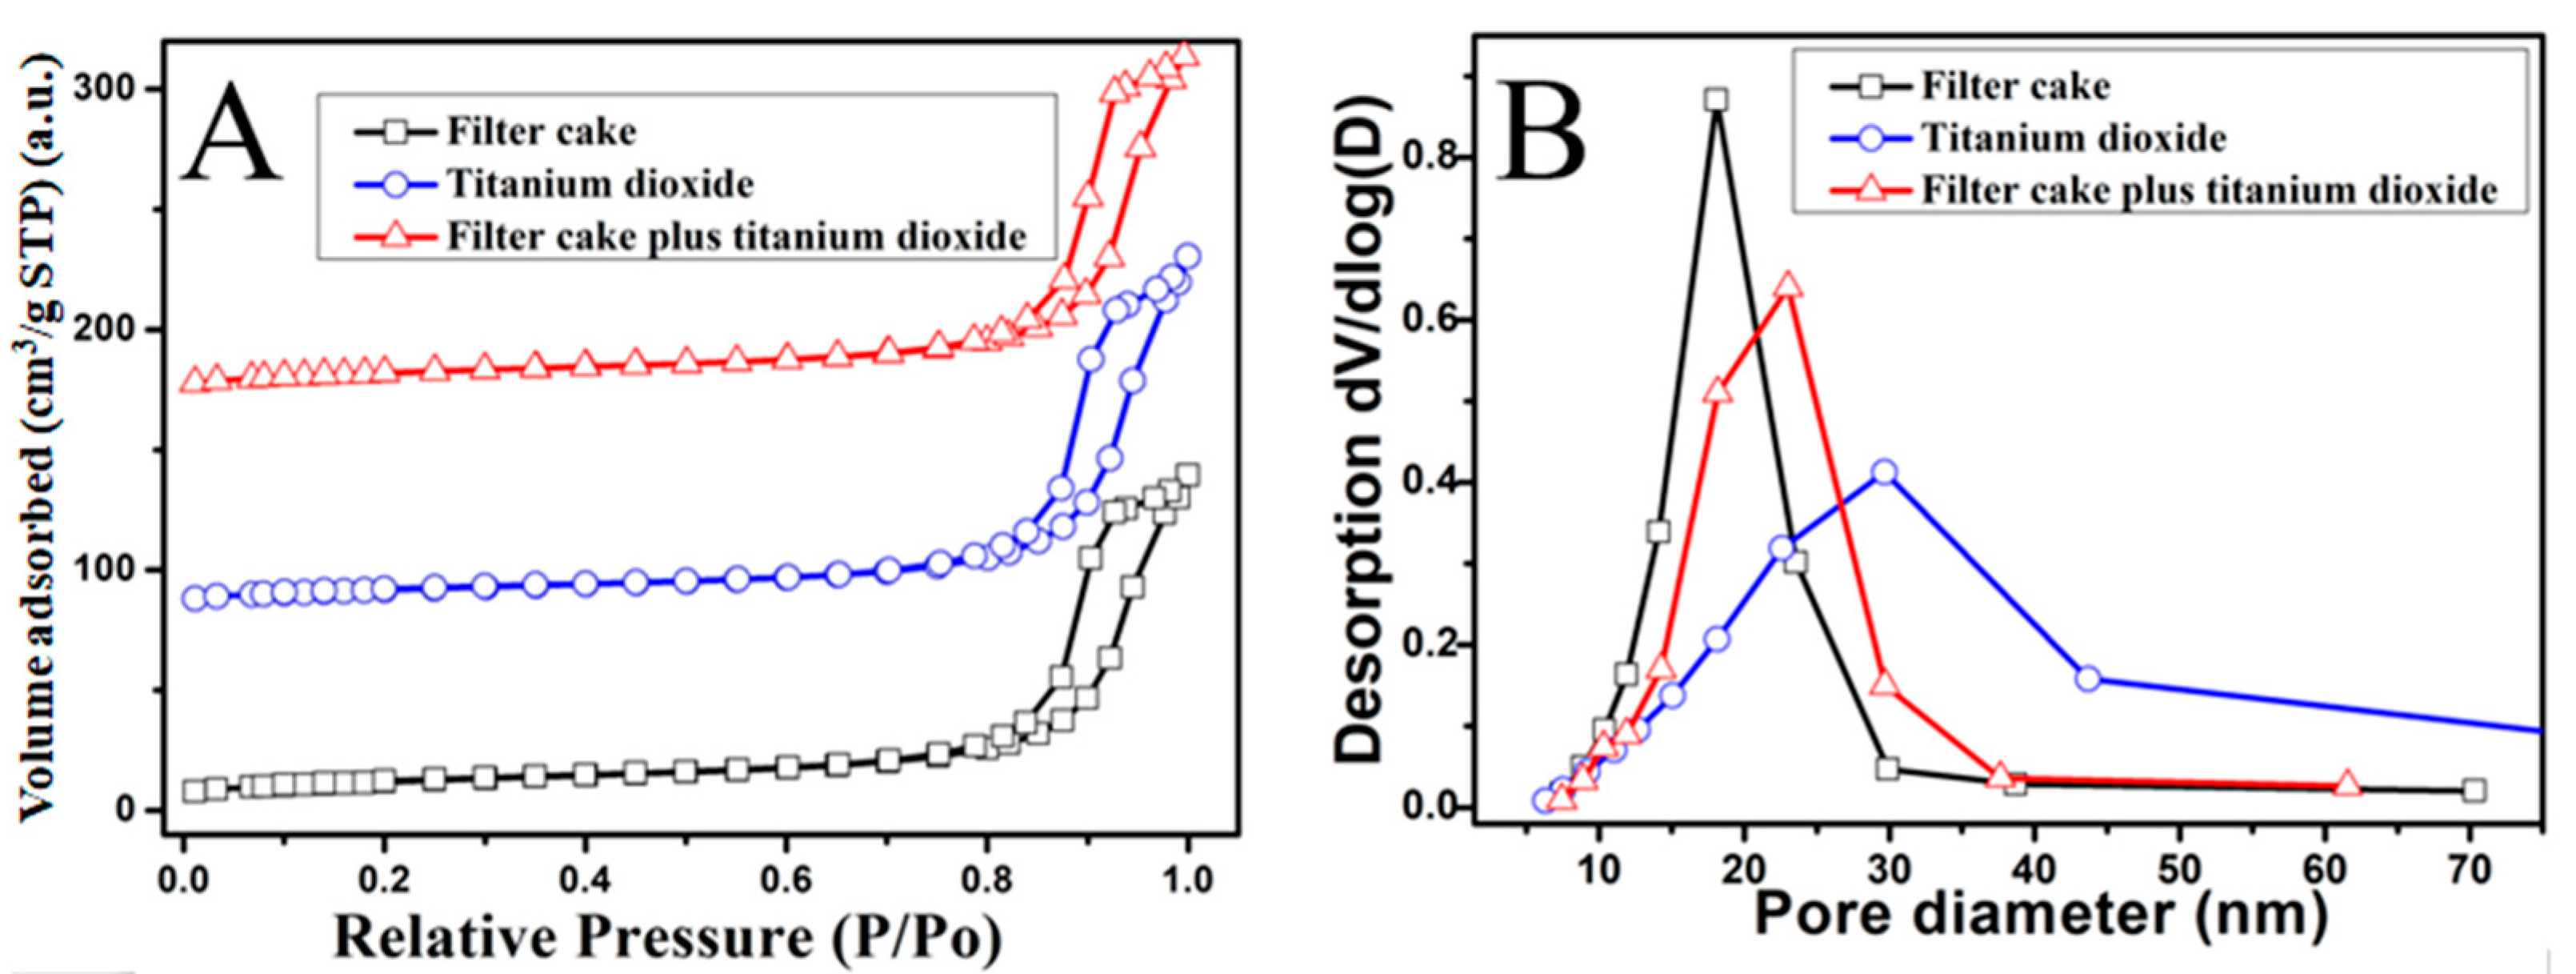
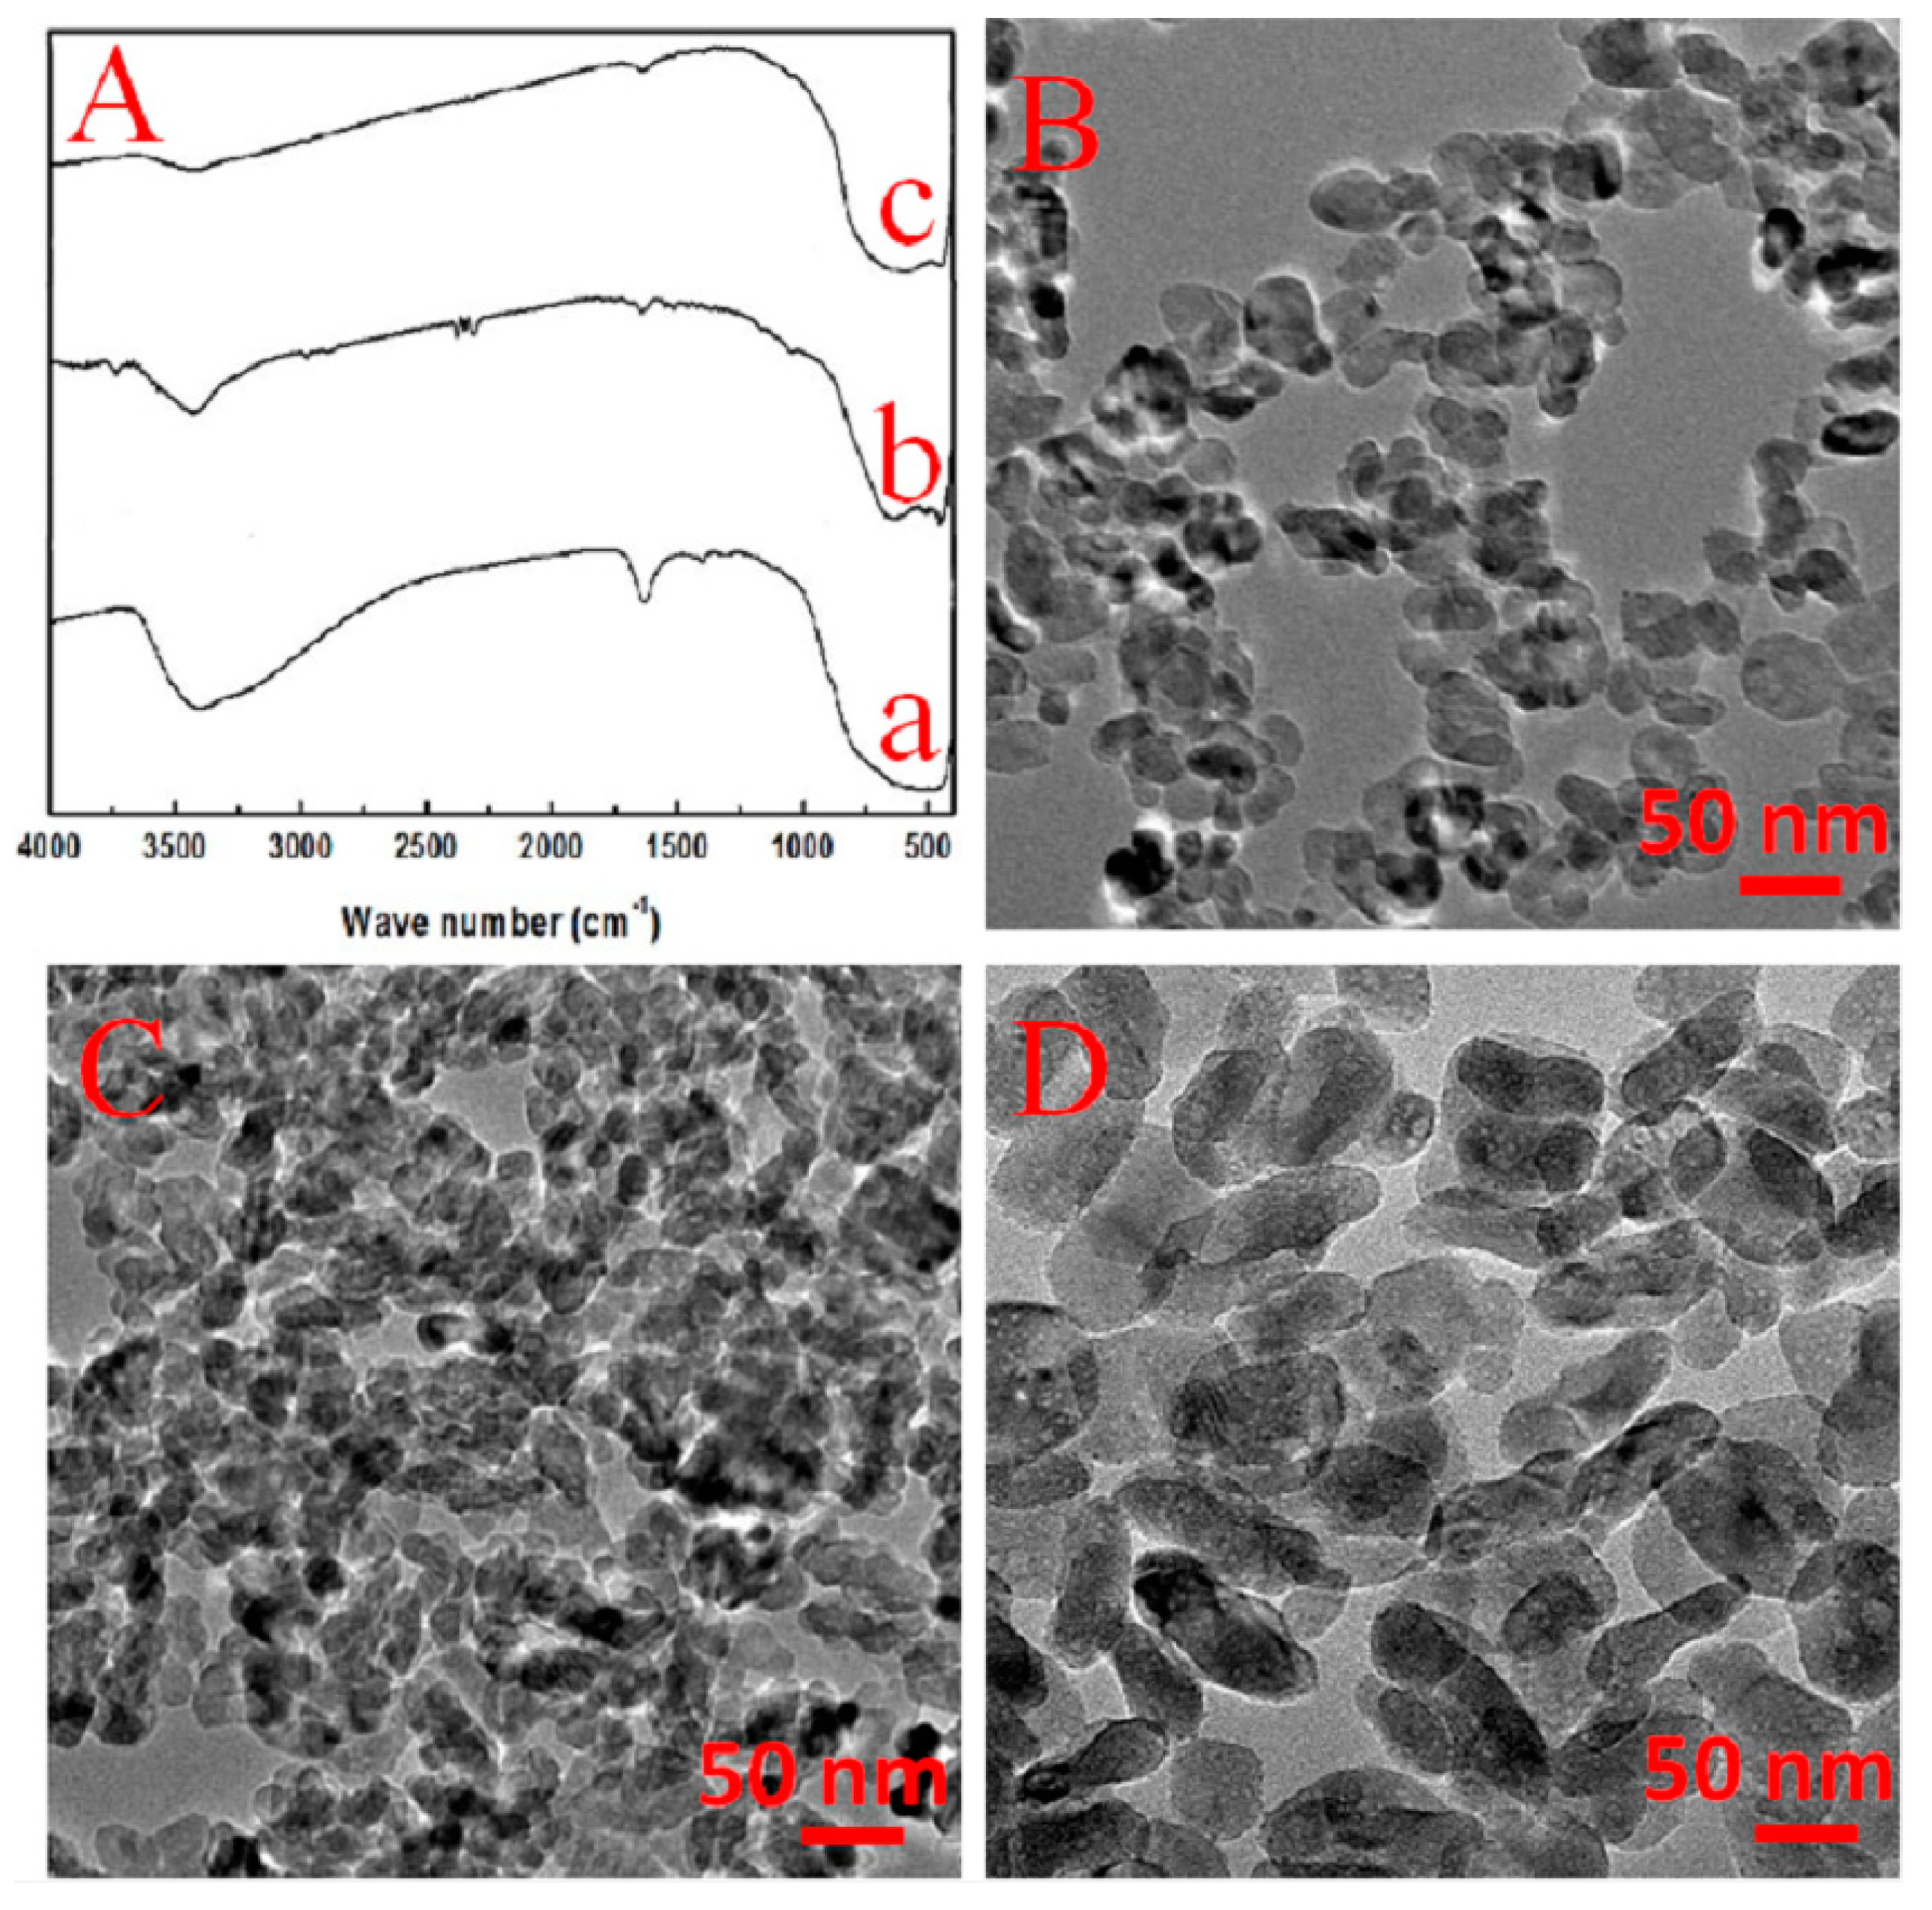
2.2. The Effect of the Structure on the Activity for Different Titanium Sources

The property of the powdery catalysts from three different Ti sources was studied firstly. All the samples in Figure 2 had their main diffraction peaks at the 2 degree (Deg) of 25.2, 37.9, 47.9, 54.1, 54.9, 62.6, 68.5, 70.0, 75.0, and 82.8°, which belong to anatase TiO2 according to JCPDS 21-1272 [16]. For the raw materials of Ti sources, the filter cake showed a very weak intensity of XRD peaks, indicating the weak crystallinity of its TiO2 particles, which may have abundant structure defects. On the other hand, the industrial titanium dioxide showed very good crystallinity with a high intensity of XRD peaks owing to its pretreatment at 600 °C in a titanium white plant. After calcination at 550 °C to obtain the powdery catalysts from different Ti sources, all three catalyst samples showed high intensity XRD peaks. The results indicated that the TiO2 particles from the filter cake were sintering with increased size and good crystallinity after high temperature calcination.
The SEM and TEM images in Figure 3 further show the morphology and aggregation state of the catalyst particles from different Ti sources. For the catalyst from the filter cake, it consisted of uniform primary particles with a particle size of 30–60 nm, and all the particles were bonded together with few pile holes (Figure 3A1,2). All the primary particles of the catalyst from titanium dioxide were much smaller with a size of about 20 nm, and they reunited as secondary particles with a size of 200–300 nm. These secondary particles gathered to form a catalyst with rich pile holes. As for the catalyst from the filter cake plus titanium dioxide, the secondary particles from industrial titanium dioxide were bonded by these primary particles from the filter cake, and many pile holes were also observed (Figure 3C1,2).
As a summary of the features of the powdery catalysts in Table 1, the sample from the filter cake had the lowest specific surface (40 m2/g)/volume (0.23 cm3/g)/pore size (18.6 nm), but the highest bulk density (1.51 g/cm3). The values of these parameters were much larger for the sample from titanium dioxide. For the sample using both the filter cake and titanium dioxide as Ti sources, the values of specific surface/volume/pore size were between the two ones using only the filter cake or titanium dioxide as the Ti source, which was the same as the SEM/TEM observation in Figure 3. Combining with the activity curves in Figure 1A, the increased specific surface, as well as rich pore structure may increase the exposure of more active sites, which was responsible for the improvement of the activity for the powdery catalysts.
The morphology of the honeycombs from different Ti sources is shown in Figure 4. Similar to the powdery catalysts, it could be seen that the surface from the filter cake was compact and consisted of primary particles, and very few pile holes were observed (Figure 4A). By contrast, the honeycomb from titanium dioxide consisted of secondary particles (Figure 4B) with a size from 300–500 nm, and many pile pores formed between these secondary particles. After using both the filter cake and titanium dioxide, it can be seen from Figure 4C that the secondary particles of titanium dioxide were cohesive through the primary particle of the filter cake, and the surface of the honeycomb became rough with much richer pores than the honeycomb from filter cake in Figure 4A.
To have a deep insight into the surface area and pore size distribution of the honeycombs from different Ti sources, Figure 5 displays the N2 adsorption–desorption isotherm and the corresponding pore size distribution curves. All the samples exhibited the typical IV isotherm with a H3-type hysteresis loop (P/P0 > 0.4), indicating the mesoporous characteristics of these honeycomb catalysts [17]. In combination with the quantitative data summarized in Table 2, it can be found that the use of the both filter cake and titanium dioxide could increase the BET areas, volume, as well as pore size. The results were well in accord with the SEM observations in Figure 4 and Figure 5, implying that the increased activity resulted from the rising specific surface area and rich pore structure with more active sites exposed after using both the filter cake and titanium dioxide as Ti sources.

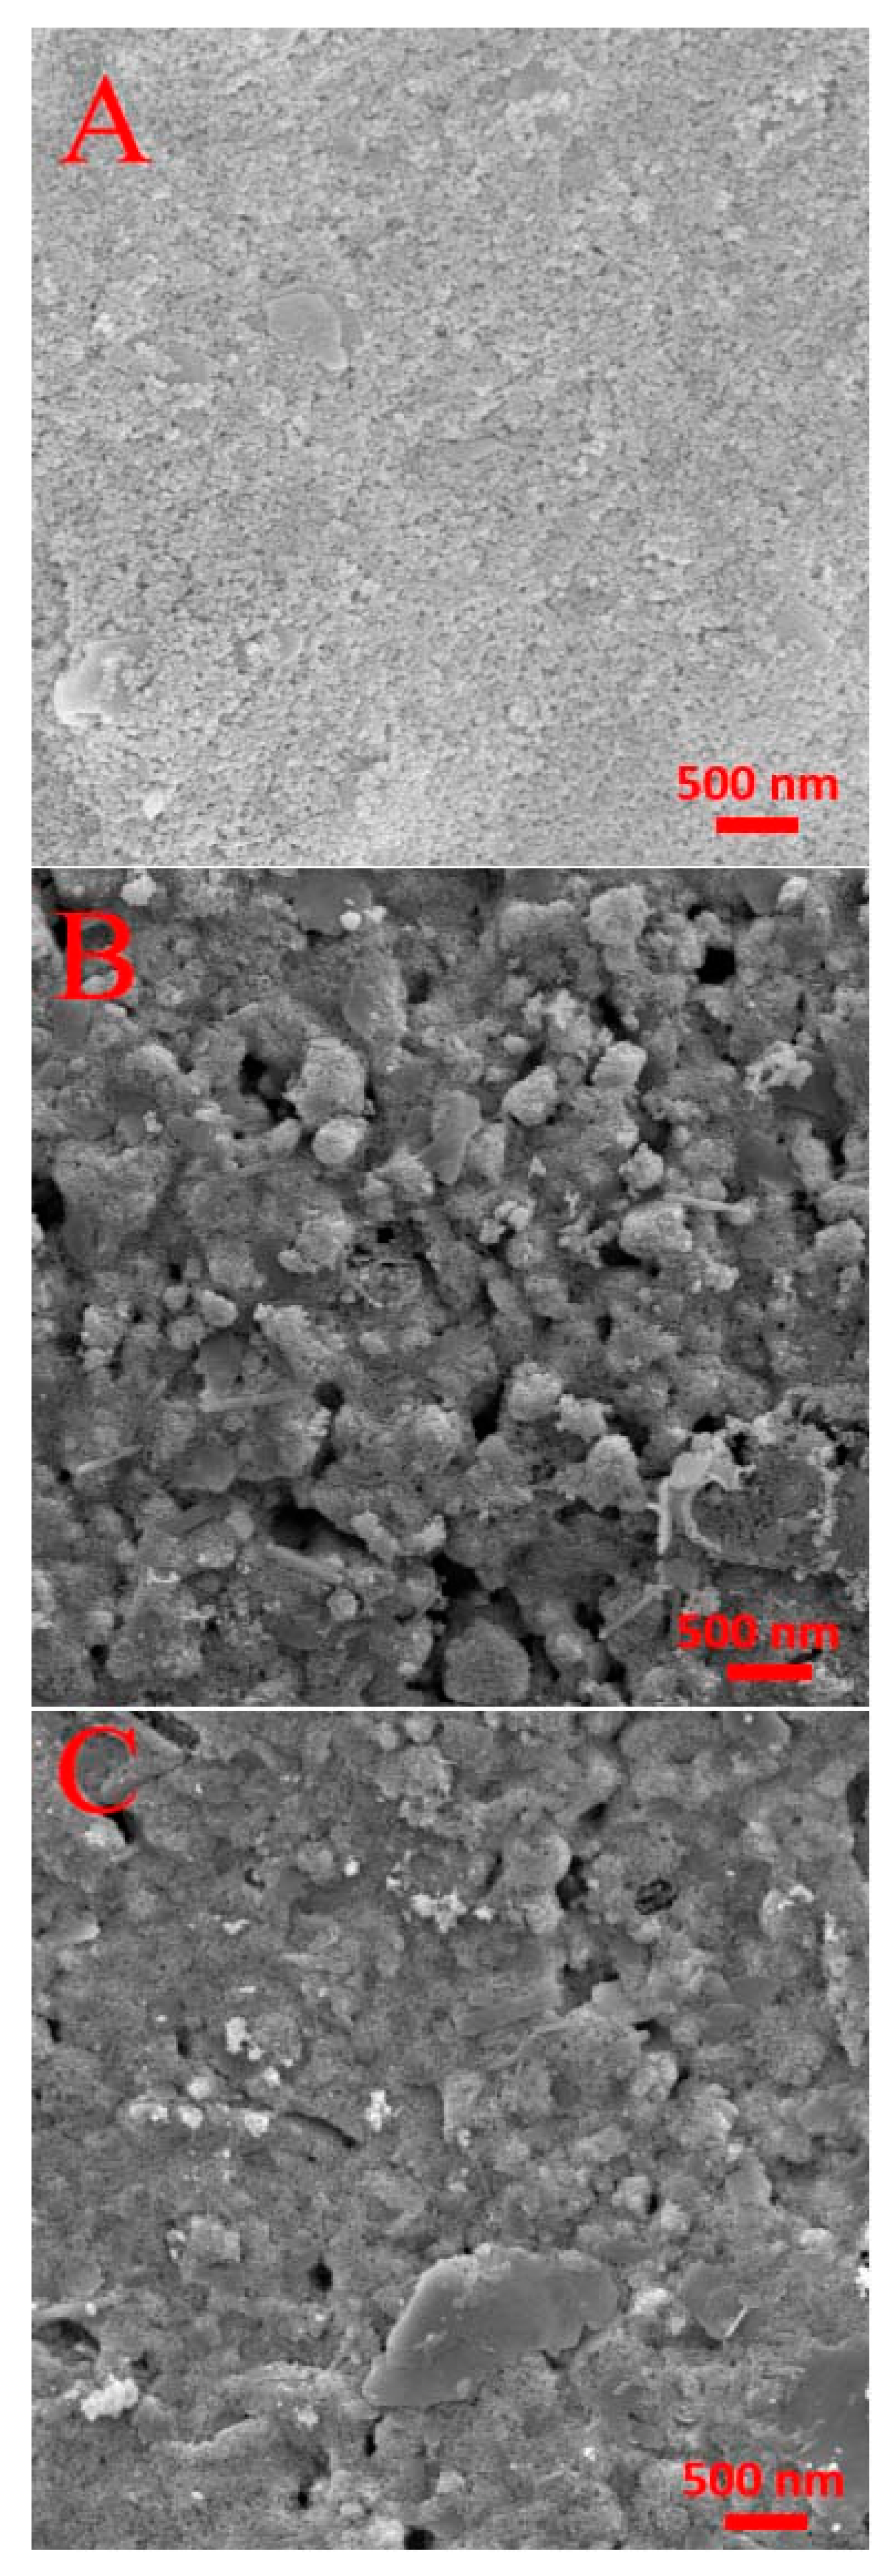
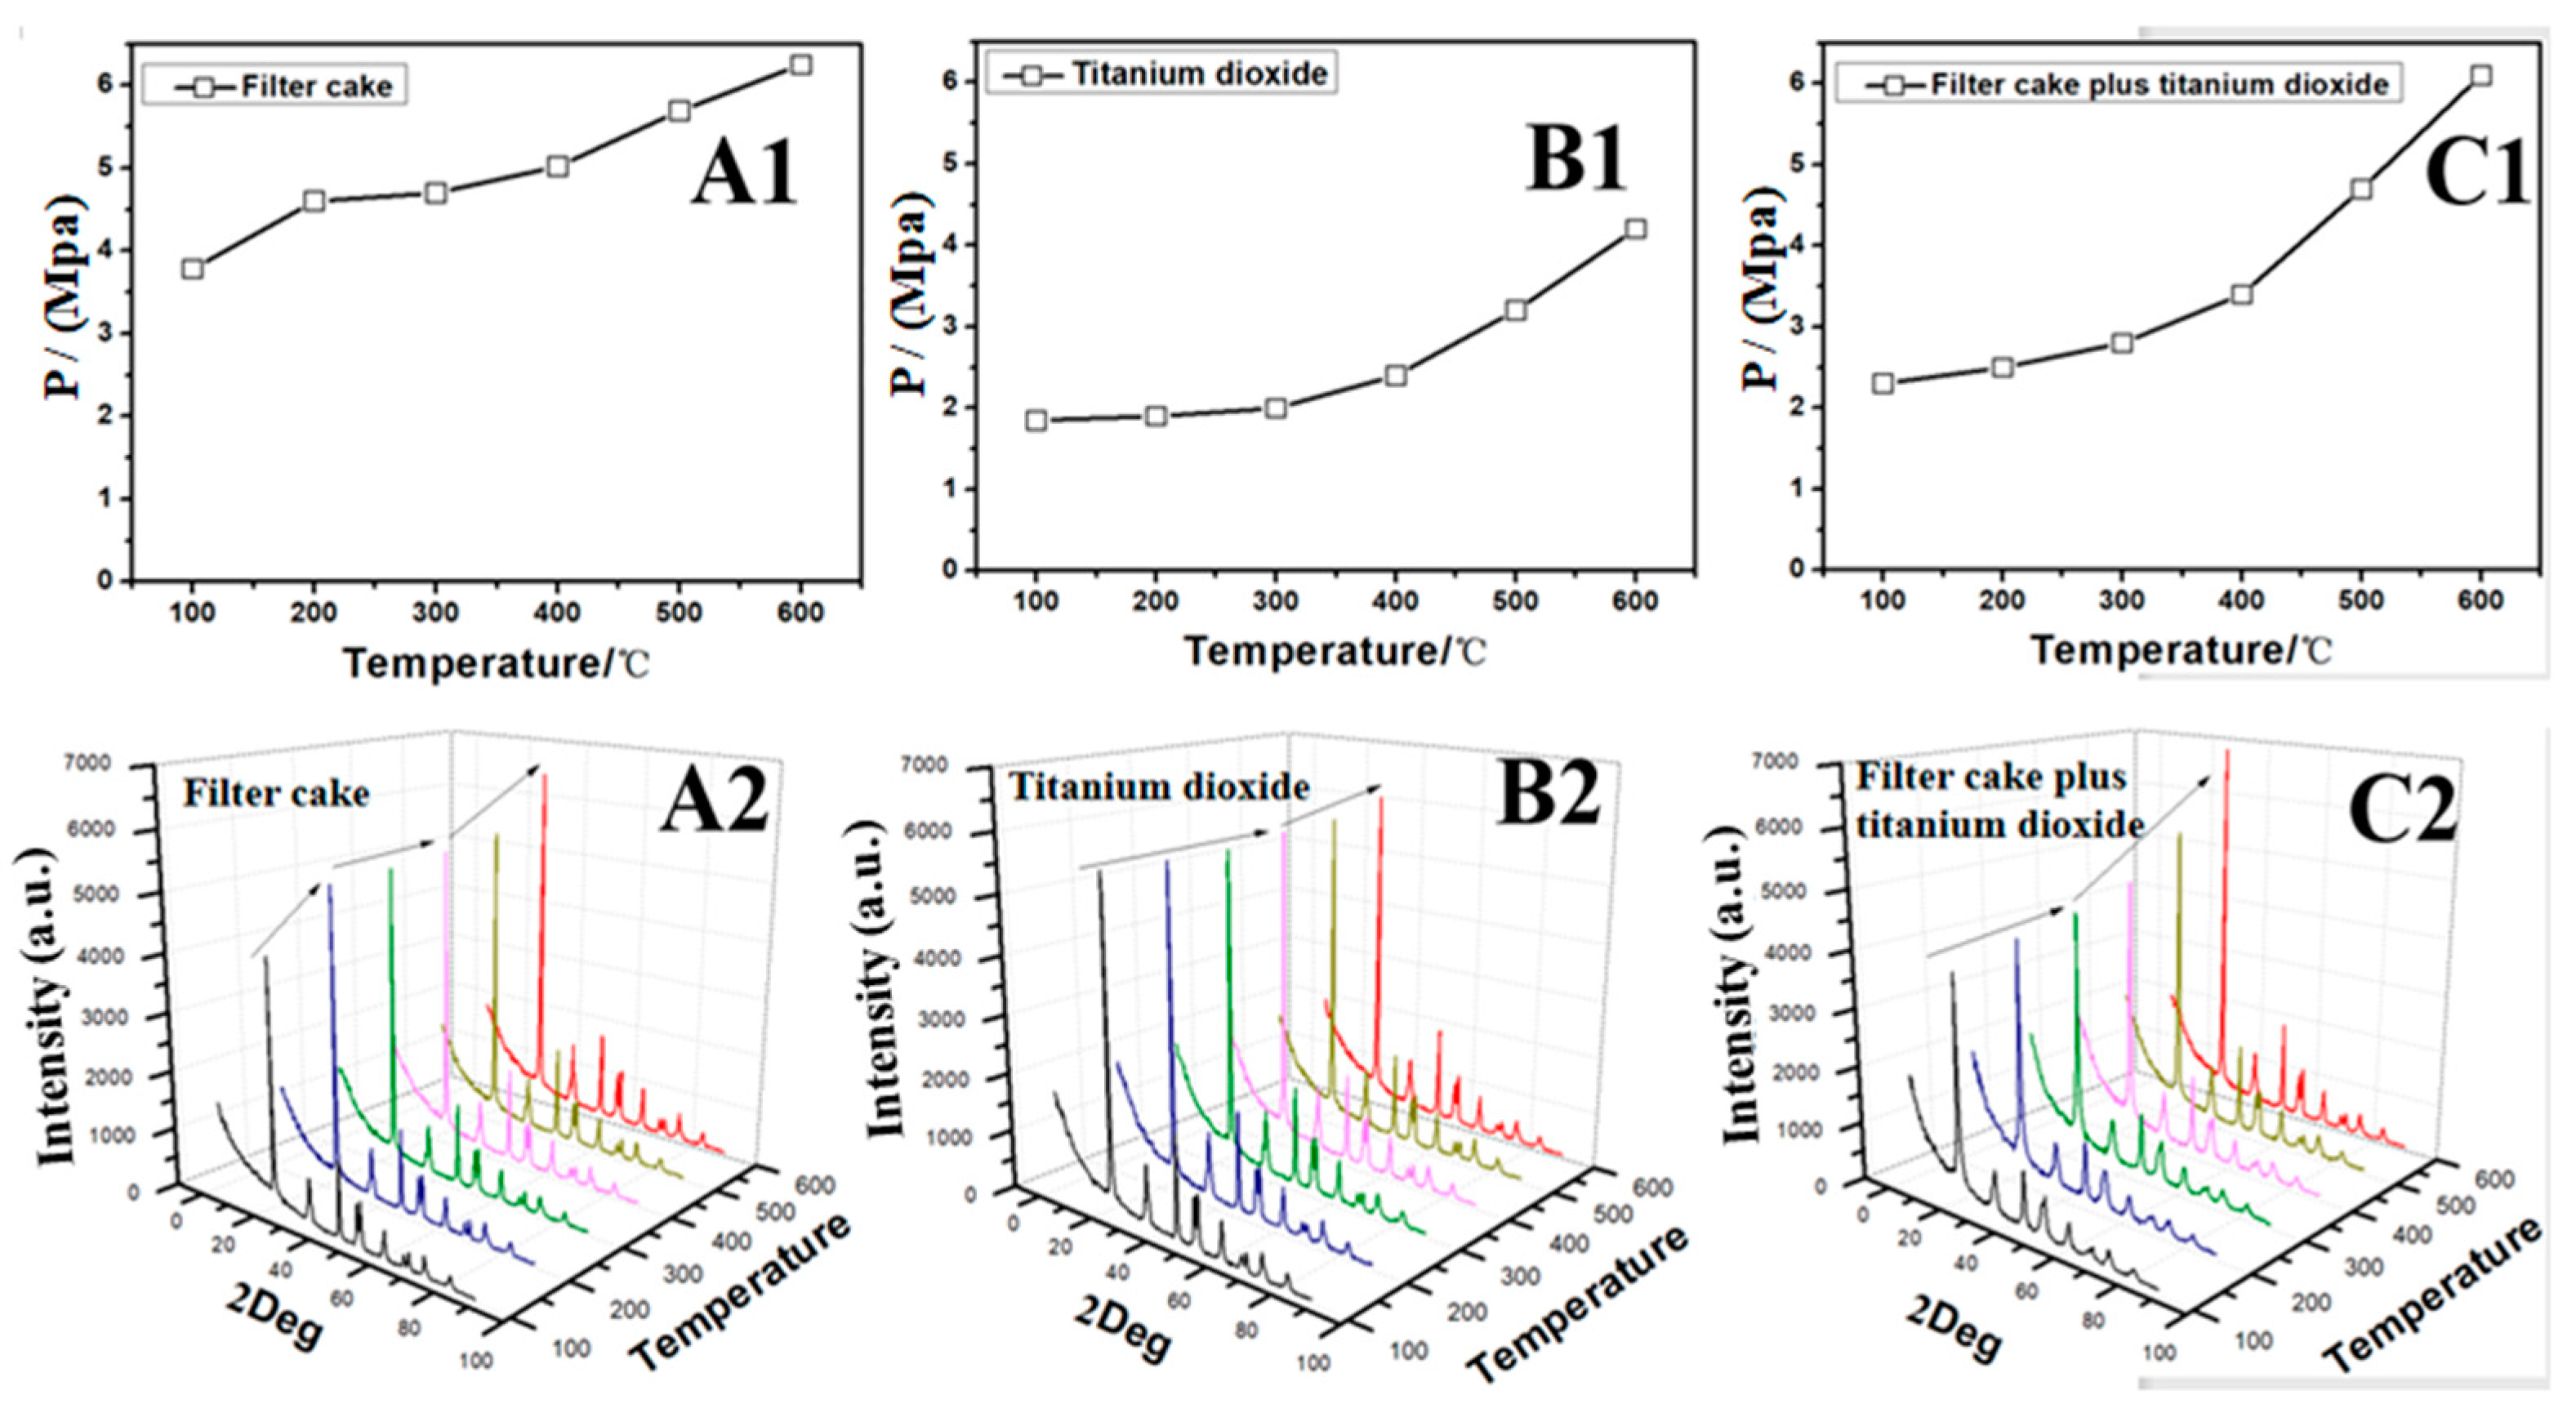
2.3. The Effect of the Structure on the Strength of Honeycombs from Different Titanium Sources

In the above research, the difference of the activity for the samples from different Ti sources was explained in terms of the state of particle aggregation, specific surface area, and pore structure. As for strength, the sintering state was the key factor for the honeycombs from different Ti sources. Figure 6 displays the changed strength (Figure 6A1–C1)/crystallinity (Figure 6A2–C2) vs. temperature for the different honeycombs. For the honeycomb from the filter cake, the dried honeycomb at 100 °C had a strength as high as 3.7 MPa, and an elevated temperature of 200 °C observably increased the strength to 4.6 MPa. The strength nearly kept unchanged between 200 and 400 °C, but continuously increased above 400 °C to 6.2 MPa at 600 °C. Correspondingly, the peak intensity of XRD showed a similar tendency as the strength. The obviously increased intensity from 100–200 °C may be re-crystallization of the TiO2 particles, and the increased intensity above 400 °C may be owed to the sintering effect at a high temperature.
For the honeycomb from industrial titanium dioxide, the strength was not good and only began to increase obviously at 400 °C and slowly reached 4.1 MPa at 600 °C. Similarly, the intensity of its XRD patterns also increased slowly from 300 to 600 °C. In contrast, the strength for the honeycomb from the filter cake and titanium dioxide began to increase from 2.4 MPa at 100 °C and then increased fast from 300 to 600 °C with the best strength of 6.1 MPa at 600 °C. The intensity of the XRD patterns also increased fast above 300 °C. These results demonstrated that the structural change of TiO2 particles from the filter cake may occur at the low temperature stage of 100–200 °C and the high temperature stage above 400 °C, respectively. The strength of honeycomb accordingly increased at the two temperature stages, especially above 300 °C.
To have much deeper insight into the unique property of strength for the filter cake, the FT-IR test and TEM observation for the filter cake treated at different temperatures were performed, and the results are shown in Figure 7. For the FT-IR curves in Figure 7A, the peak at the range of 3000–3800 cm-1 can be assigned to the hydroxy groups, which is very strong for the filter cake dried at 100 °C. After drying at 200 °C and calcination at 600 °C, the hydroxy groups gradually decreased and were even eliminated. Correspondingly, the primary particles were bonded compactly after drying at 200 °C, and these particles further fused and grow after calcination at 600 °C. Combining the XRD results in Figure 6, the rich hydroxy and easy decarbonylation of the filter cake may facilitate the bonding and fusion of the primary particle in the filter cake with the increase of temperature, resulting in the good crystallinity and high strength of the honeycomb from the filter cake.
According to the above results, a possible relationship between the structure and strength was demonstrated as shown in Figure 8. The primary particles were formed with rich hydroxyl groups after hydrothermal treatment of metatitanic acid. The decarbonylation of these primary particles combined them together through chemical bonding after drying with an increase of strength, and the strength further increased with the growth and fusion of these primary particles at a high calcination temperature.
In brief, the positive correlation property was found between the honeycomb strength and crystallinity for the samples from different titanium sources. The better the crystallinity of TiO2 particles was, the higher the strength of the honeycombs. In terms of structure, as shown in Figure 2 and Figure 7, the filter cake consisted of primary particles, and its crystallinity was not good with a large number of hydroxy groups. The small space among the primary particles (Figure 3), as well as the rich hydroxy groups made sintering of the primary particles to form high strength honeycomb from the filter cake very easy. By contrast, the industrial titanium dioxide was pretreated at a temperature above 500 °C in the TiO2 plant, and its aggregation state was in the form of secondary particles. Its structure was very stable, and the large pile pores among these secondary particles made the fusion of these secondary particles much to result in a satisfactory strength more difficult. In the case of honeycomb from both the filter cake and titanium dioxide source, the primary particles from the filter cake filled in the pile holes of the secondary particles and acted as the solid phase binder, accounting for its improved strength.

3. Materials and Methods

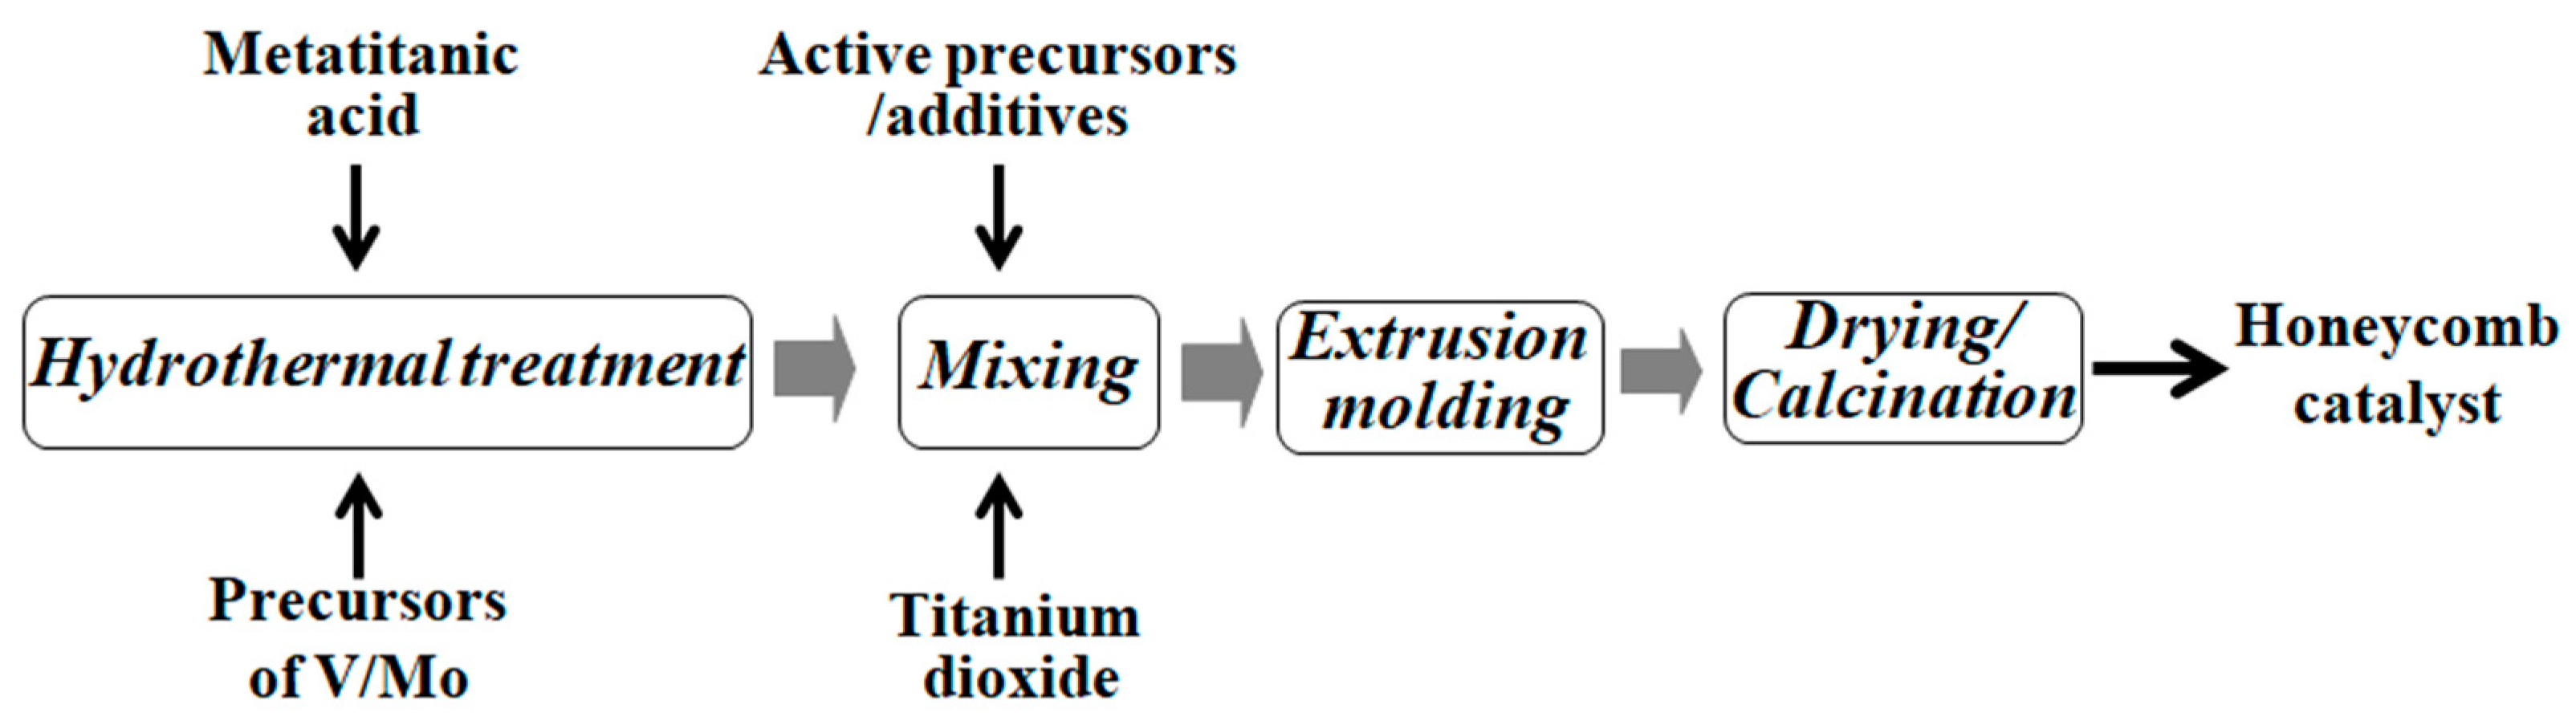
3.1. Preparation of Powdery Catalyst and Pilot Production of Honeycomb Catalyst

The powdery catalysts were prepared through mixing different titanium sources (filter cake from hydrothermal treatment of metatitanic acid, industrial titanium dioxide, or both of them) with active V and Mo salt precursors and other additives. All the Ti sources had a similar elemental composition with the content of TiO2 above 98.5%. Then, some water was added to make a uniform catalytic mud. After drying at 105 °C and calcination at 550 °C, the catalysts were obtained and further crushed for use.
The pilot production of the honeycomb catalyst with different titanium sources was executed by a honeycomb manufacturer, Hebei Weida Lanhai Environmental Protection Technology Co. LTD. In each batch, 1 ton of catalytic pug was prepared, and about 1 m3 of honeycomb product could be obtained. The improved process for the honeycomb product using both the filter cake and industrial titanium dioxide as Ti sources is shown in Figure 9. After the hydrothermal treatment of metatitanic acid, the obtained filter cake was mixed with industrial titanium dioxide and other additives to form a uniform mud, which was extruded and molded into honeycomb. Moreover, two kinds of other honeycomb were also produced with a similar extrusion process by only the filter cake or titanium dioxide as Ti sources, respectively. Finally, all the honeycomb catalysts were obtained after vapor seasoning at 60–80 °C and calcination in a mesh-belt kiln at 550 °C.

3.2. Activity Test and Characterization

The activity test of powdery catalysts derived from different titanium sources was conducted in a fixed-bed quartz reactor with 650 ppm NO, 650 ppm NH3, 3% O2, with balance being made up of N2. The experiment was carried out in a space velocity (SV) of 60,000 h−1. The activity measurement of the corresponding honeycomb catalyst was carried out in a DeNOx square shaped steel reactor. The simulated flue gas was the same for the powdery catalyst at a ratio of NH3/NO = 1. Twenty centimeter honeycomb pieces with four channels were used with a linear velocity of 2.4 m/s. The flue gas was continually monitored by an ABB on-line gas analyzer (ABB AO2020, Frankfurt am Main, German).
The NO conversion, N2O yield, and NH3 conversion were calculated according to the following equations:
N O   C o n v e r s i o n   =   [ N O ] i n [ N O ] o u t [ N O ] i n 100 %
N 2 O   y i e l d   =   [ N O ] i n [ N O ] o u t
where [NO]in and [NO]out represent the concentration of gaseous NO in the inlet and outlet, respectively.
X-ray diffraction (XRD) patterns were recorded on an X-ray diffractometer (Empyrean, PANalytical B.V, Almelo, The Netherlands) in the 2 Deg range of 5–90° with a step size of 0.4372 s−1 operating at 40 KV and 40 mA using Cu Kα radiation. A nitrogen adsorption–desorption apparatus (ASAP 2020, Micromeritics Instrument Corp, Norcross, GA, USA) was used to determine the surface area and pore size distribution of samples at 77 K (BET). The mass of samples was 0.1 g, and each of them was degassed at 200 °C for 10 h before they were measured. The morphology and microstructure of samples were recorded on an SU8020 scanning electron microscope (SEM, HITACHI, Tokyo, Japan). The internal microstructures of samples were observed by a JEM-2010 transmission electron microscopy (TEM, JEOL, Tokyo, Japan) at an accelerating voltage of 200 kV. The Fourier infrared (FT-IR) tests for the filter cake with different treat temperatures was performed on the spectrometer of Bruker (Tensor 27). The strength of the honeycomb pieces with the same size was tested on the plunger tester (KC-3) from Beijing Hengaode Technology co., LTD. The honeycomb was cut into cubes with the size of 4 cm × 4 cm × 4 cm, and then, the small cube was placed on the platform of the KC-3. The mechanical arm of KC-3 was gradually pressed on the cube, and the maximum pressure recorded before the cube broke provided the strength data.

4. Conclusions

In summary, an improved process for honeycomb production was proposed by using both the filter cake and industrial titanium dioxide as Ti sources, and the DeNOx activity of the obtained honeycomb could be elevated up to fifteen percent together with the comparable strength of the honeycomb produced by only the filter cake. The structure study for the powdery catalyst showed that the filter cake consisted of primary particles with few pores and a small specific surface are, but industrial titanium dioxide consisted of secondary particles with abundant pile holes. The same architectural features were also observed for the pilot produced honeycomb catalysts from different Ti sources. Using both the filter cake and titanium dioxide introduced the secondary particles with increased specific surface area and pore size/volume, facilitating the exposure of more active sites with improved activity. On the other hand, the crystallinity of the filter cake was not good with abundant hydroxy groups compared to industrial titanium dioxide. The architectural features of the filter cake made the sintering of primary particles to form the high strength honeycomb easy, accounting for the observed positive correlation property between the honeycomb strength and crystallinity. The primary particles of the filter cake could fill the pile pores of industrial titanium dioxide and acted as a solid phase binder to acquire the high strength for the honeycomb using both the filter cake and titanium dioxide as Ti sources. The demonstrated new honeycomb process with the great advantages of activity and strength possesses promising application prospects for high dust flue conditions in industry.

Author Contributions

Conceptualization and Design, J.Y. and S.G.; Experiments and analysis, L.H. and J.L.; writing—original draft, Y.L. and A.A.; writing—review and editing, C.L. All authors have read and agreed to the published version of the manuscript.

Funding

This research was funded by the National Key Research and Development Program of China (No. 2017YFB0310403), the Natural Science Foundation of China (No. 21601192 and No. 21878310), and the open subject from State Key Laboratory of Multi-phase Complex Systems (No. MPCS-2019-0-03).

Conflicts of Interest

The authors declare no conflict of interest.

References

  1. Busca, G.; Lietti, L.; Ramis, G.; Berti, F. Chemical and mechanistic aspects of the selective catalytic reduction of NOx by ammonia over oxide catalysts: A review. Appl. Catal. B Environ. 1998, 18, 1–36. [Google Scholar] [CrossRef]
  2. Liu, F.; Yu, Y.; He, H. Environmentally-benign catalysts for the selective catalytic reduction of NOx from diesel engines: Structure-activity relationship and reaction mechanism aspects. Chem. Commun. 2014, 50, 8445–8463. [Google Scholar] [CrossRef] [PubMed]
  3. Tang, C.; Zhang, H.; Dong, L. Ceria-based catalysts for low-temperature selective catalytic reduction of NO with NH3. Catal. Sci. Technol. 2016, 6, 1248–1264. [Google Scholar] [CrossRef]
  4. Liu, Z.; Yu, F.; Ma, C.; Dan, J.; Luo, J.; Dai, B. A Critical Review of Recent Progress and Perspective in Practical Denitration Application. Catalysts 2019, 9, 771. [Google Scholar] [CrossRef] [Green Version]
  5. Cimino, S.; Ferone, C.; Cioffi, R.; Perillo, G.; Lisi, L. A Case Study for the Deactivation and Regeneration of a V2O5-WO3/TiO2 Catalyst in a Tail-End SCR Unit of a Municipal Waste Incineration Plant. Catalysts 2019, 9, 464. [Google Scholar] [CrossRef] [Green Version]
  6. Zhang, W.; Qi, S.; Pantaleo, G.; Liotta, L.F. WO3-V2O5 Active Oxides for NOx SCR by NH3: Preparation Methods, Catalysts’ Composition, and Deactivation Mechanism—A Review. Catalysts 2019, 9, 527. [Google Scholar] [CrossRef] [Green Version]
  7. Han, L.; Cai, S.; Gao, M.; Hasegawa, J.Y.; Wang, P.; Zhang, J.; Shi, L.; Zhang, D. Selective Catalytic Reduction of NOx with NH3 by Using Novel Catalysts: State of the Art and Future Prospects. Chem. Rev. 2019, 119, 10916–10976. [Google Scholar] [CrossRef] [PubMed]
  8. Yu, J.; Guo, F.; Yang, J.; Wang, Y.; Dong, L.; Gao, S.; Xu, G. Surface Deposition-Type Honeycomb Flue Gas Denitrification Catalyst, and Preparation Method Thereof. U.S. Patent 9,446,385, 20 September 2016. [Google Scholar]
  9. Yu, J.; Li, C.; Guo, F.; Gao, S.; Zhang, Z.G.; Matsuoka, K.; Xu, G. The pilot demonstration of a honeycomb catalyst for the DeNOx of low-temperature flue gas from an industrial coking plant. Fuel 2018, 219, 37–49. [Google Scholar] [CrossRef]
  10. Li, C.; Yu, J.; He, Y.; Yu, C.; Li, P.; Wang, C.; Huang, F.; Gao, S. The industrial feasibility of low temperature DeNOx in the presence of SOx: A project case in a medium coking plant. RSC Adv. 2018, 8, 18260–18265. [Google Scholar] [CrossRef] [Green Version]
  11. Zheng, C.; Xiao, L.; Qu, R.; Liu, S.; Xin, Q.; Ji, P.; Song, H.; Wu, W.; Gao, X. Numerical simulation of selective catalytic reduction of NO and SO2 oxidation in monolith catalyst. Chem. Eng. J. 2019, 361, 874–884. [Google Scholar] [CrossRef]
  12. García-Bordejé, E.; Pinilla, J.L.; Lázaro, M.J.; Moliner, R. NH3-SCR of NO at low temperatures over sulphated vanadia on carbon-coated monoliths: Effect of H2O and SO2 traces in the gas feed. Appl. Catal. B Environ. 2006, 66, 281–287. [Google Scholar] [CrossRef]
  13. Shi, Y.J.; Shu, H.; Zhang, Y.H.; Fan, H.-M.; Zhang, Y.P.; Yang, L.J. Formation and decomposition of NH4HSO4 during selective catalytic reduction of NO with NH3 over V2O5-WO3/TiO2 catalysts. Fuel Process. Technol. 2016, 150, 141–147. [Google Scholar] [CrossRef]
  14. Li, C.; Shen, M.; Yu, T.; Wang, J.; Wang, J.; Zhai, Y. The mechanism of ammonium bisulfate formation and decomposition over V/WTi catalysts for NH3-selective catalytic reduction at various temperatures. Phys. Chem. Chem. Phys. 2017, 19, 15194–15206. [Google Scholar] [CrossRef] [PubMed]
  15. Ye, D.; Qu, R.; Song, H.; Gao, X.; Luo, Z.; Ni, M.; Cen, K. New insights into the various decomposition and reactivity behaviors of NH4HSO4 with NO on V2O5/TiO2 catalyst surfaces. Chem. Eng. J. 2016, 283, 846–854. [Google Scholar] [CrossRef]
  16. Yang, J.; Lei, S.; Yu, J.; Xu, G. Low-cost V−W−Ti SCR catalyst from titanium-bearing blast furnace slag. J. Environ. Chem. Eng. 2014, 2, 1007–1010. [Google Scholar] [CrossRef]
  17. Song, I.; Youn, S.; Lee, H.; Lee, S.G.; Cho, S.J.; Kim, D.H. Effects of microporous TiO2 support on the catalytic and structural properties of V2O5/microporous TiO2 for the selective catalytic reduction of NO by NH3. Appl. Catal. B Environ. 2017, 210, 421–431. [Google Scholar] [CrossRef]
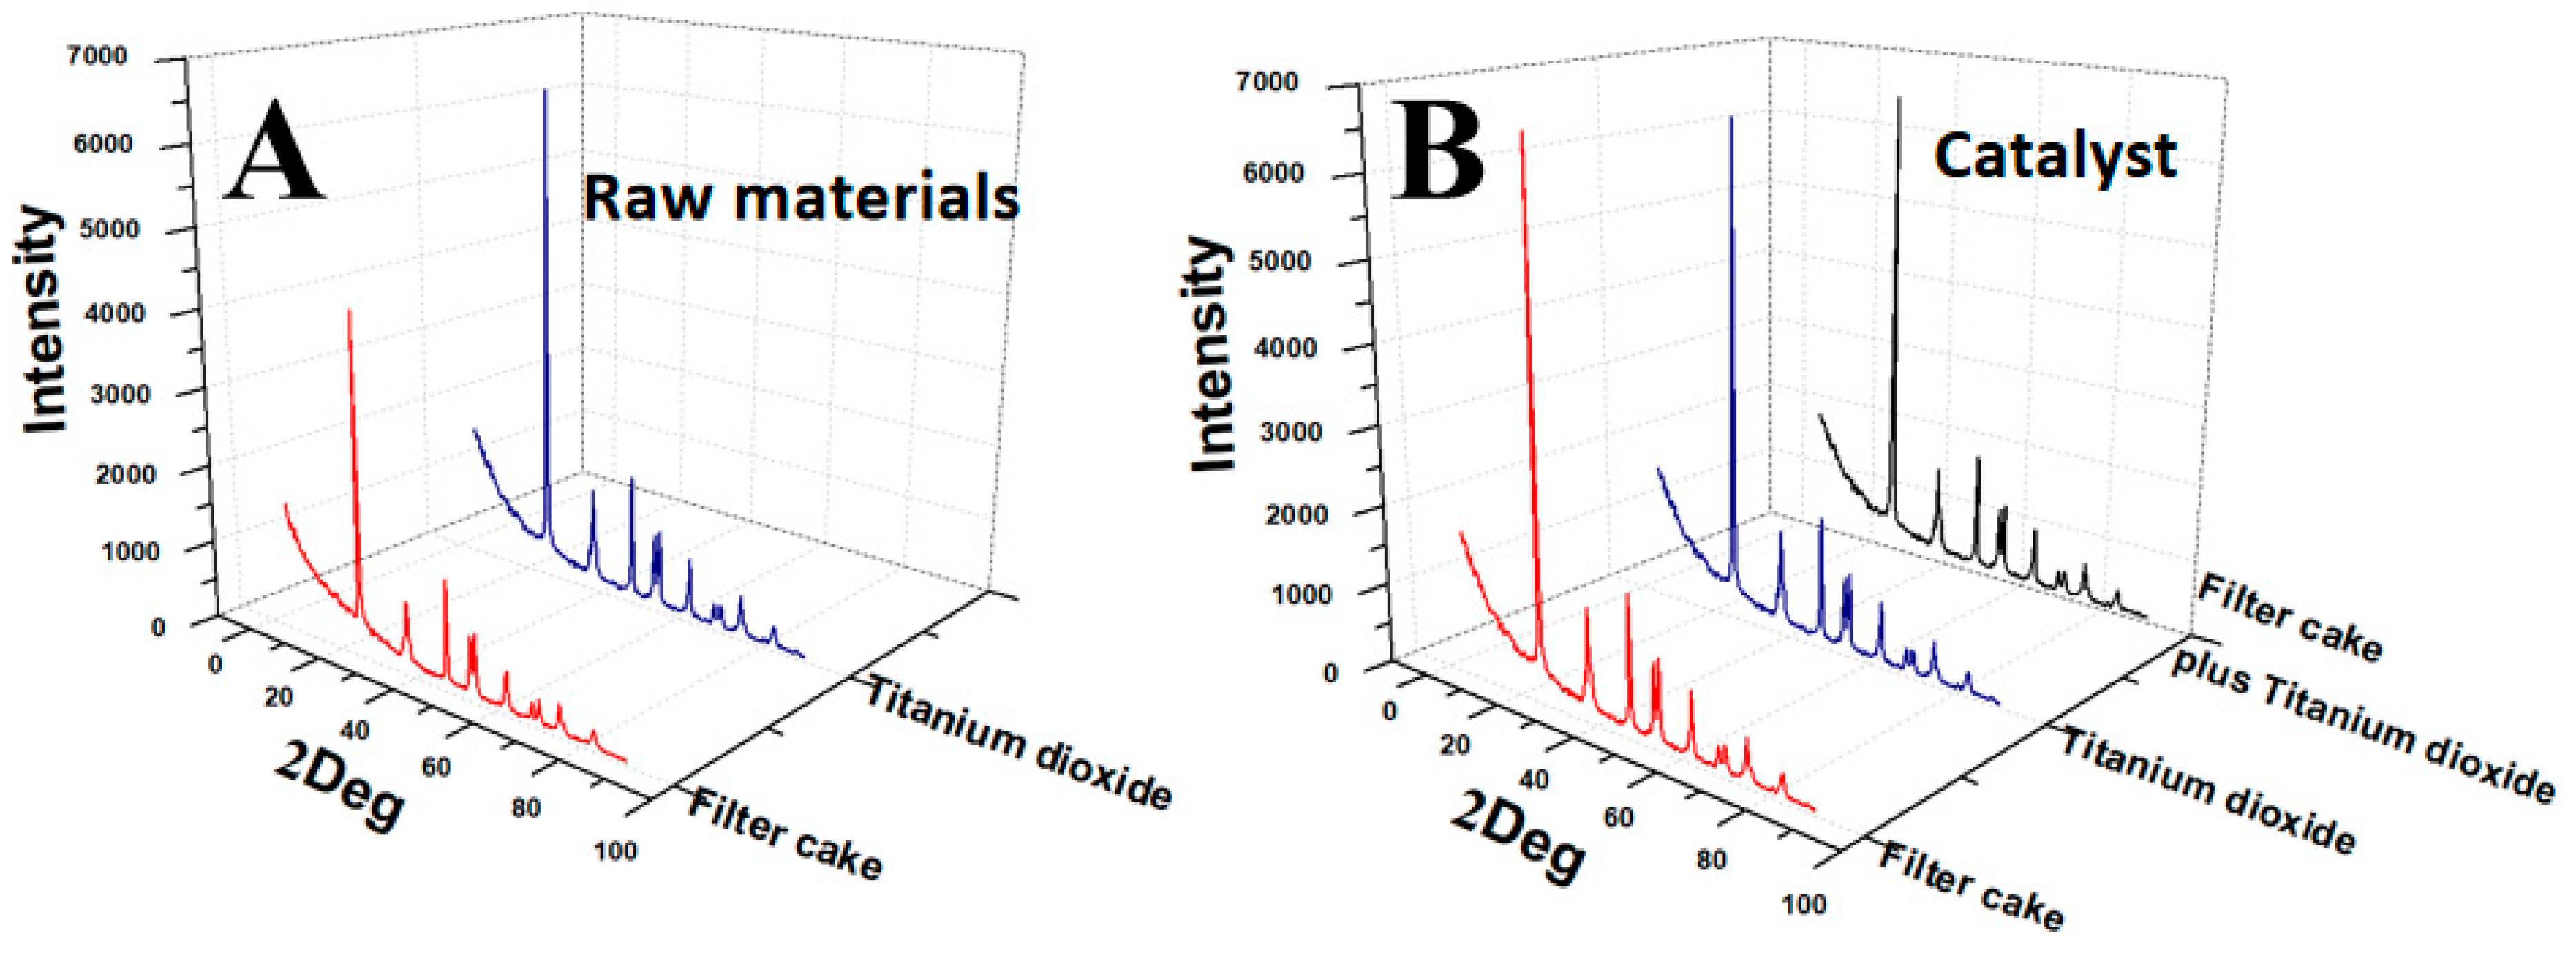
Figure 1. The activity of the powdery (A) and honeycomb (B) catalysts with different titanium sources: (a) filter cake, (b) industrial titanium dioxide, and (c) filter cake plus titanium dioxide.
Catalysts 10 00042 g001
Figure 2. The XRD patterns of the two raw Ti sources (A) and the corresponding powdery catalysts produced by different Ti sources (B).
Catalysts 10 00042 g002
Figure 3. The SEM (A1C1) and TEM (A2C2) images for the powdery catalysts produced by different titanium precursors: (A) filter cake, (B) titanium dioxide, and (C) filter cake plus titanium dioxide.
Catalysts 10 00042 g003
Figure 4. The SEM images for honeycomb catalysts produced by different titanium sources: (A) filter cake, (B) titanium dioxide, and (C) filter cake plus titanium dioxide.
Catalysts 10 00042 g004
Figure 5. The N2 adsorption–desorption isotherms curves (A) and the corresponding pore size distributions calculated from the desorption branch (B) for honeycomb catalysts produced by different titanium sources.
Catalysts 10 00042 g005
Figure 6. The axial direction strength (A1C1) and corresponding XRD patterns (A2C2) for honeycomb catalysts produced by different titanium sources treated at different temperature.
Catalysts 10 00042 g006
Figure 7. The infrared radiation curves (A) for the (a) obtained wet filter cake, (b) dried filter cake, and (c) calcinated filter cake, as well as the TEM images for the (B) obtained wet filter cake, (C) dried filter cake, and (D) calcinated filter cake.
Catalysts 10 00042 g007
Figure 8. The proposed structure and strength evolution of the filter cake with the increase of temperature.
Catalysts 10 00042 g008
Figure 9. The improved process for the honeycomb product using both the filter cake and industrial titanium dioxide as Ti sources.
Catalysts 10 00042 g009
Table 1. Summary of the BET data for the powdery catalysts produced by different titanium sources.
SamplesFilter CakeTitanium DioxideFilter Cake Plus Titanium Dioxide
BET areas40 m2/g58 m2/g46 m2/g
Volume0.23 cm3/g0.35 cm3/g0.31 cm3/g
Pore size18.6 nm34.2 nm27.8 nm
Bulk density1.51 g/cm30.95 g/cm31.41 g/cm3
Table 2. Summary of the BET data for the honeycomb catalysts produced by different titanium sources.
SamplesFilter CakeTitanium DioxideFilter Cake Plus Titanium Dioxide
BET areas42 m2/g51 m2/g47 m2/g
Volume0.21 cm3/g0.32 cm3/g0.28 cm3/g
Pore size19 nm32 nm28 nm

