
In Vivo Microbeam Radiation Therapy at a Conventional Small Animal Irradiator

 , , and
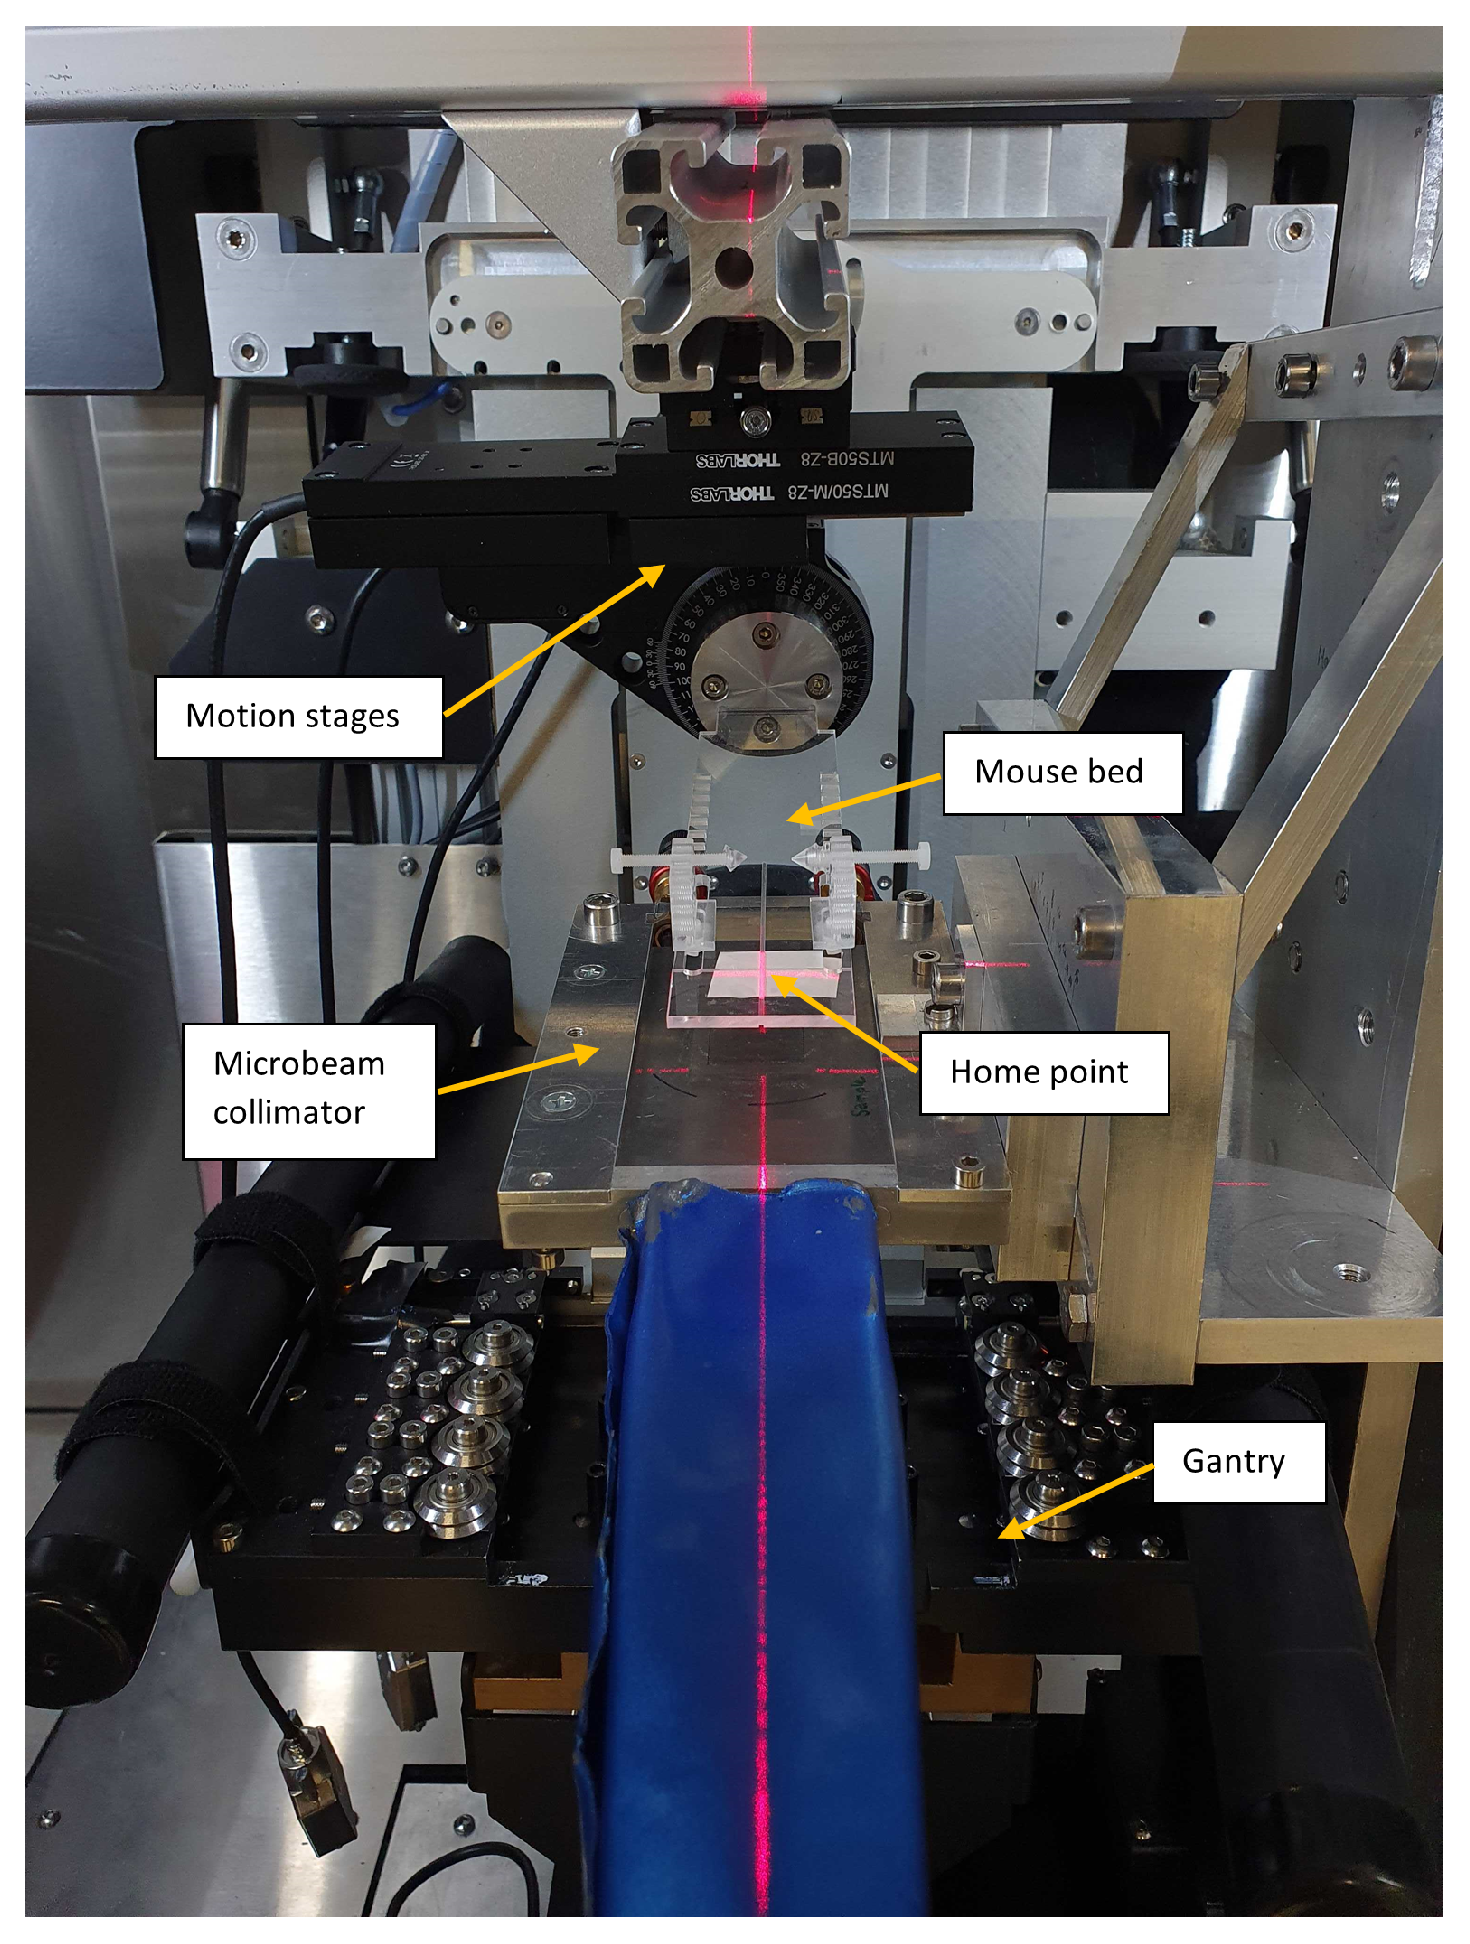
Abstract
:Simple Summary
Abstract
1. Introduction
2. Materials and Methods
2.1. Microbeam Irradiation Setup
2.2. Development of the TPS
2.2.1. Dose Calculation Utilizing a Hybrid Algorithm
2.2.2. TPS Module in 3D-Slicer
2.2.3. Calibration of the Dose Calculation Algorithm
2.2.4. Validation of the TPS
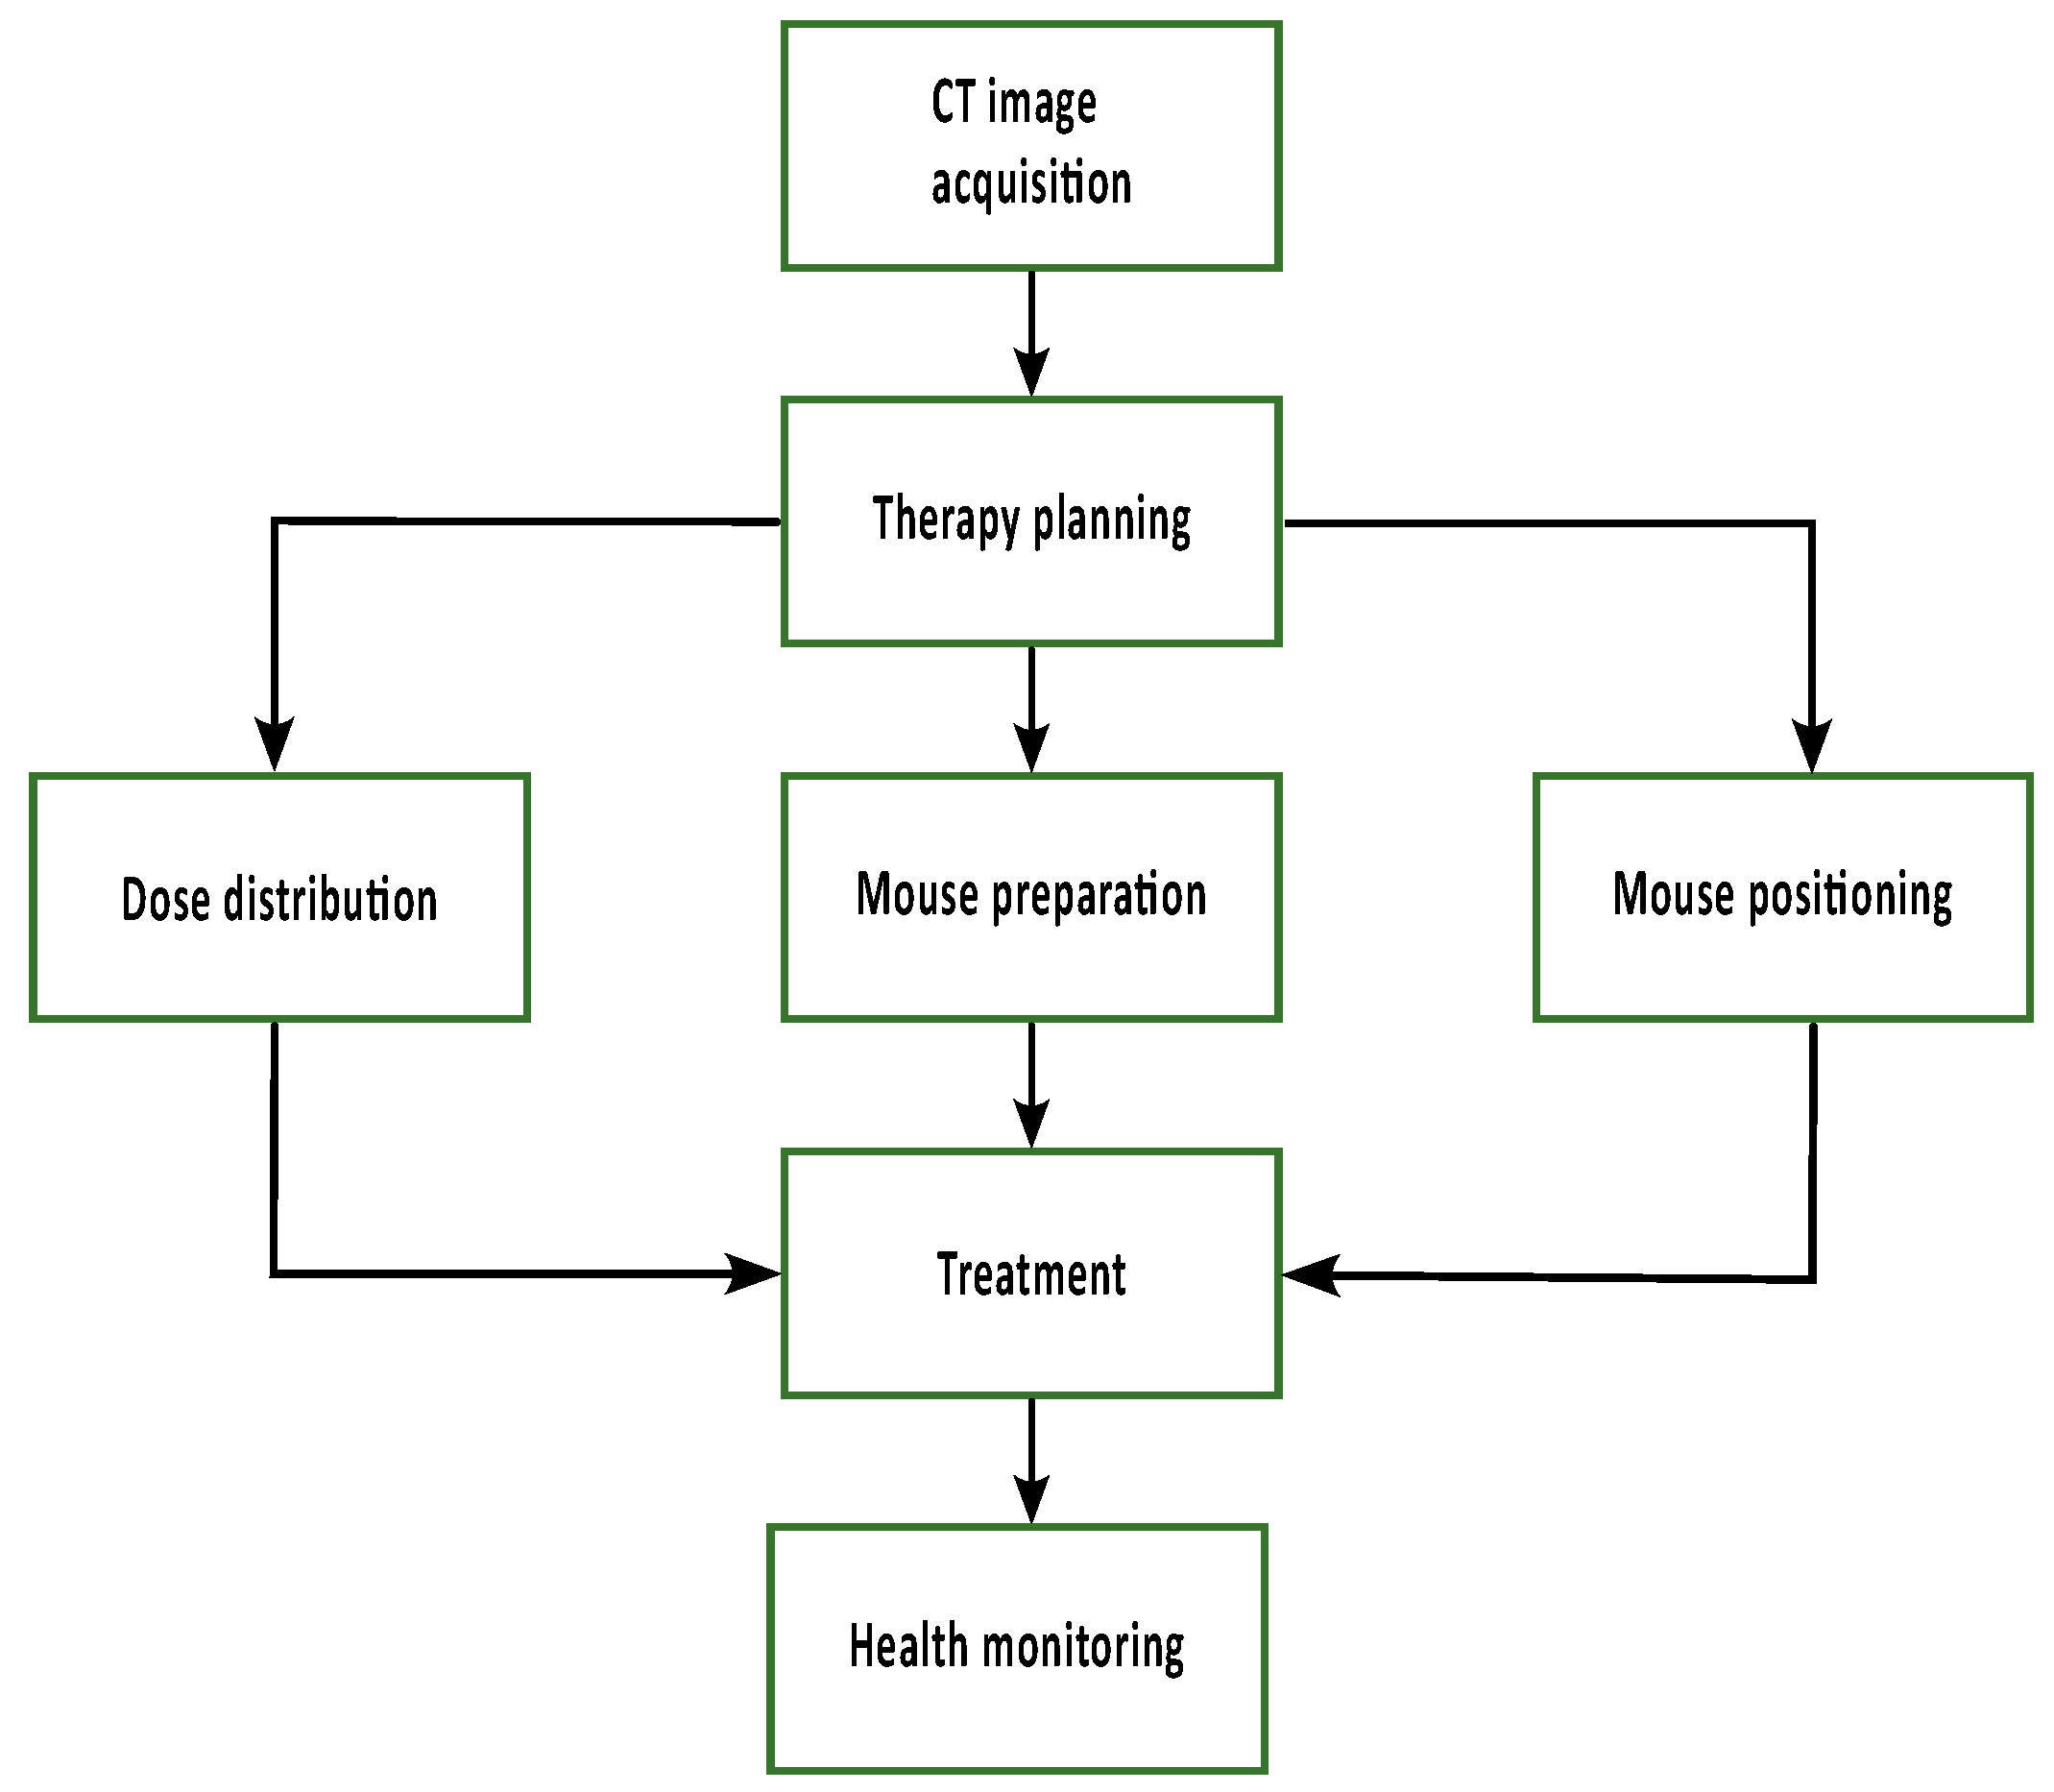
2.3. Workflow for Animal Treatment
2.3.1. CT Image Acquisition
2.3.2. Therapy Planning
2.3.3. Mouse Irradiation
2.3.4. Brain Excision
2.3.5. Tissue Sectioning, Antibody Staining, and Signal quantification
3. Results
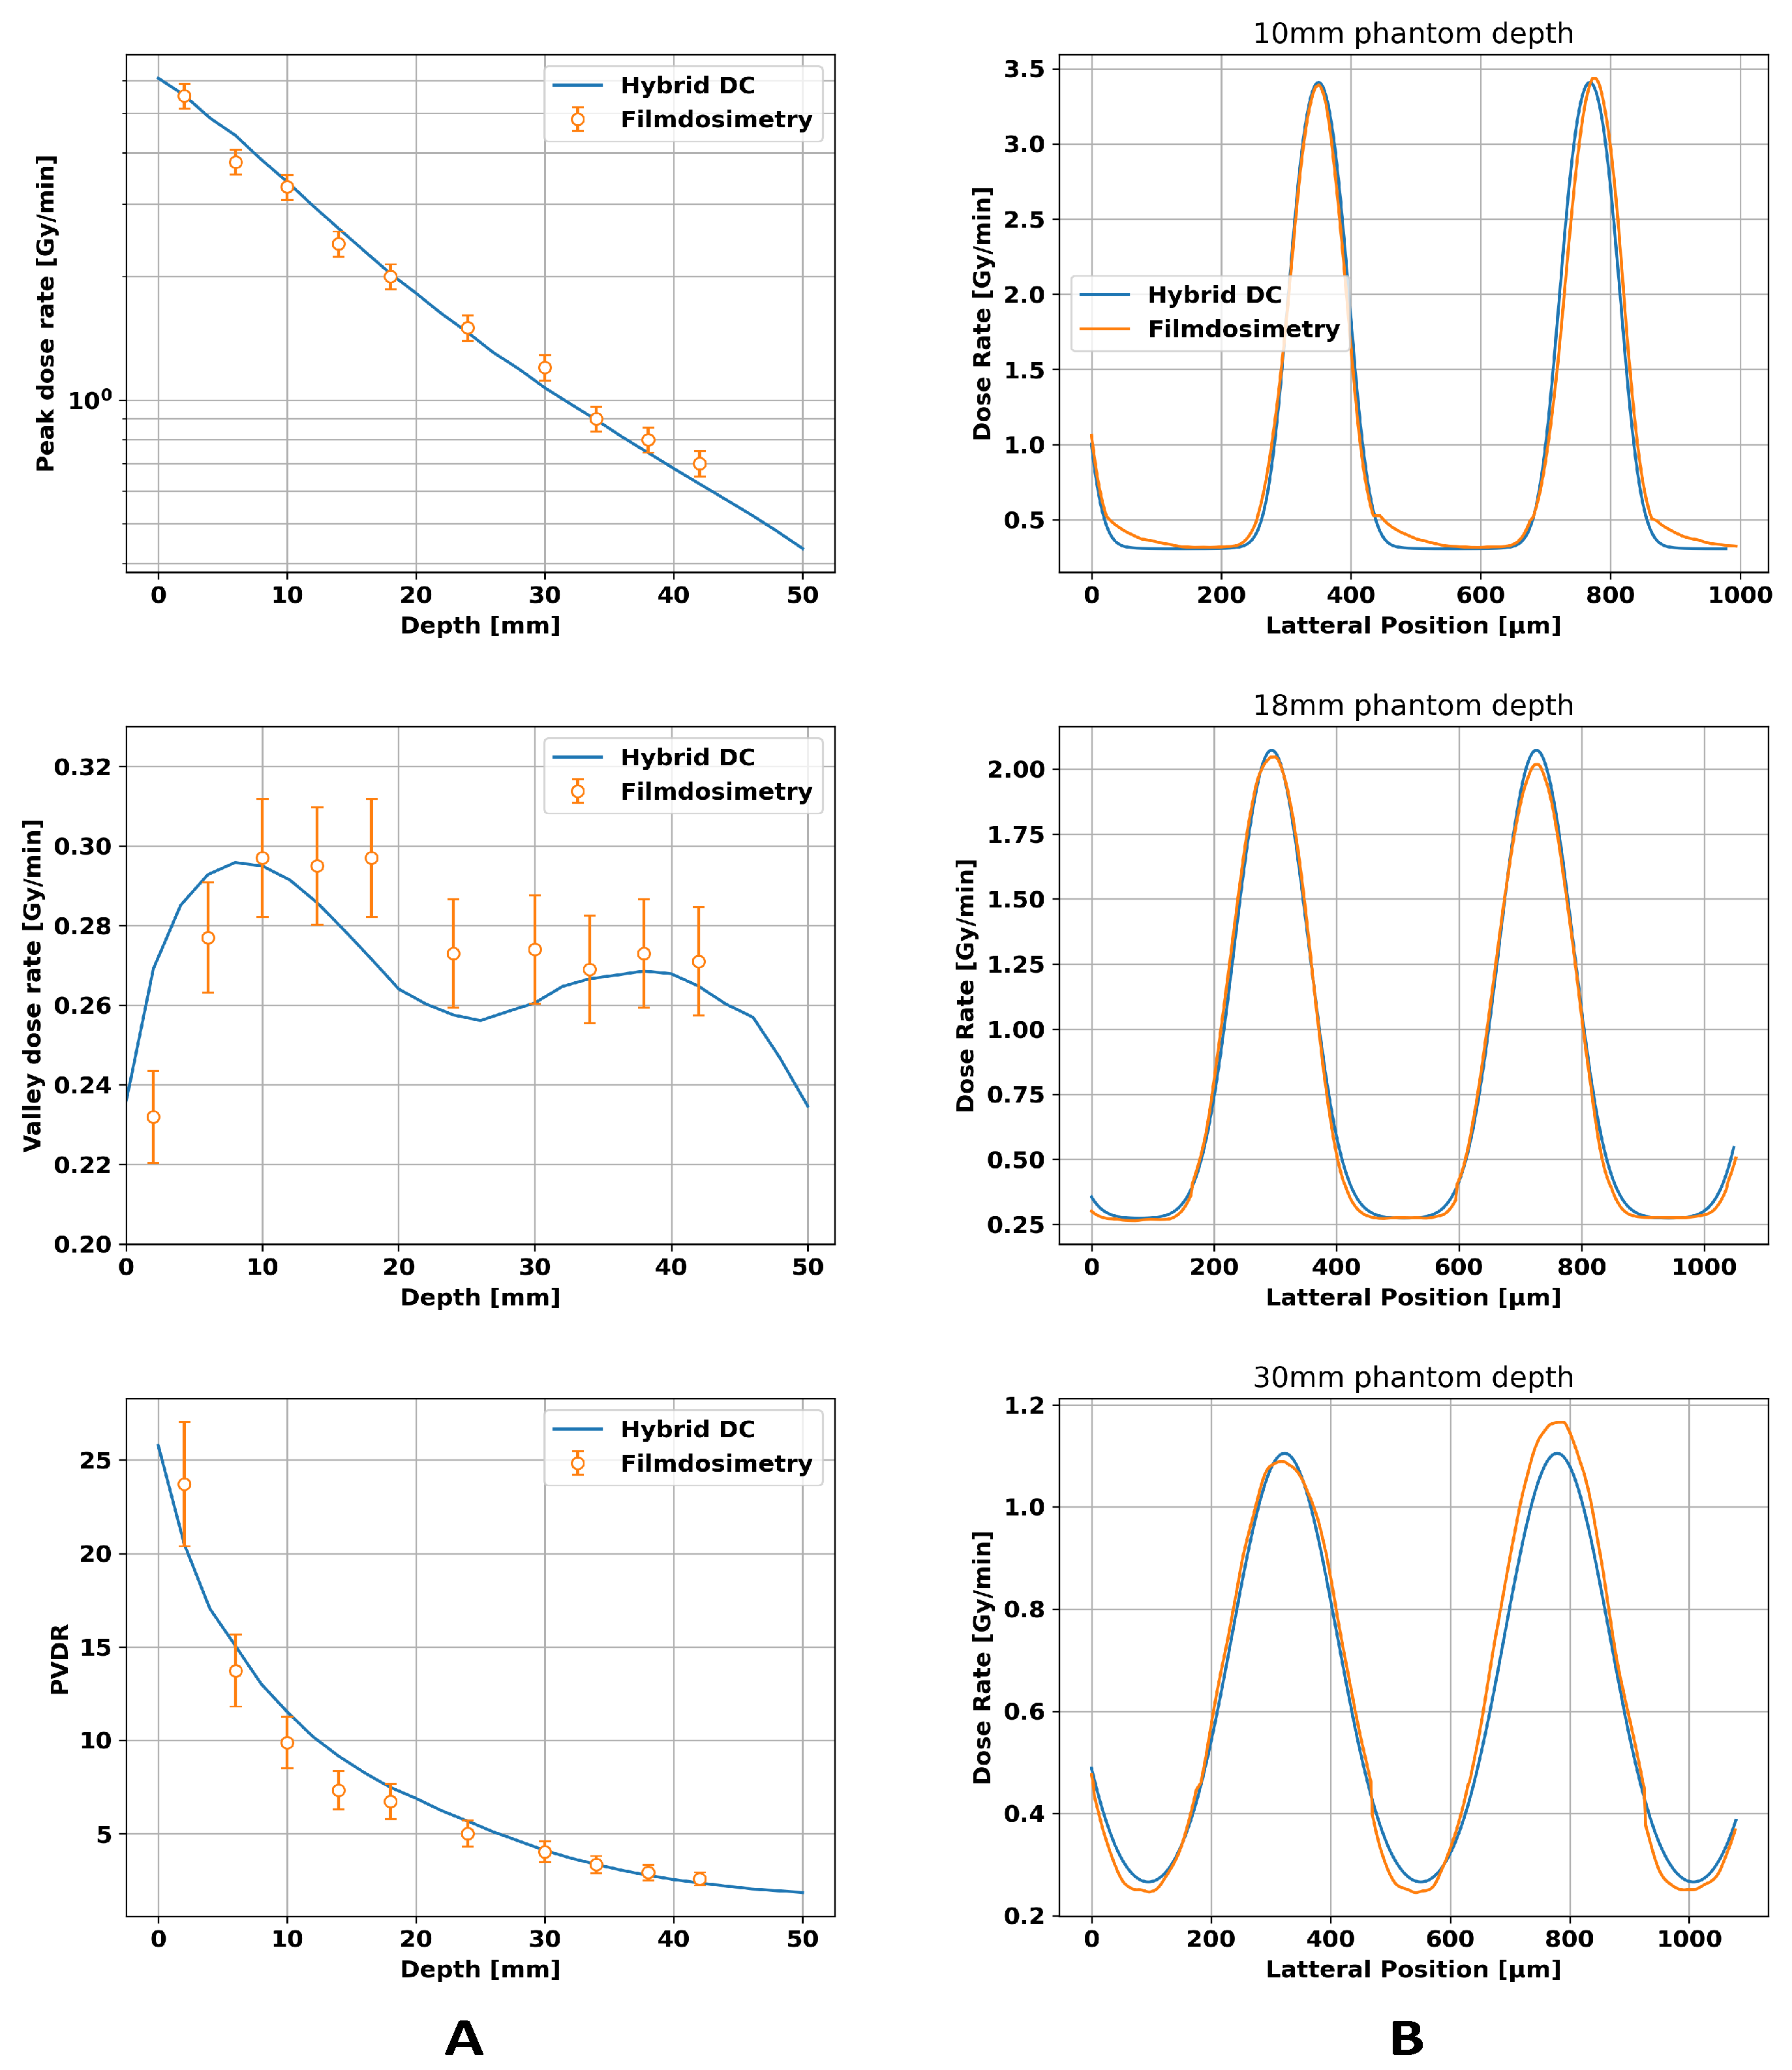
3.1. Calibration of the Dose Calculation Algorithm
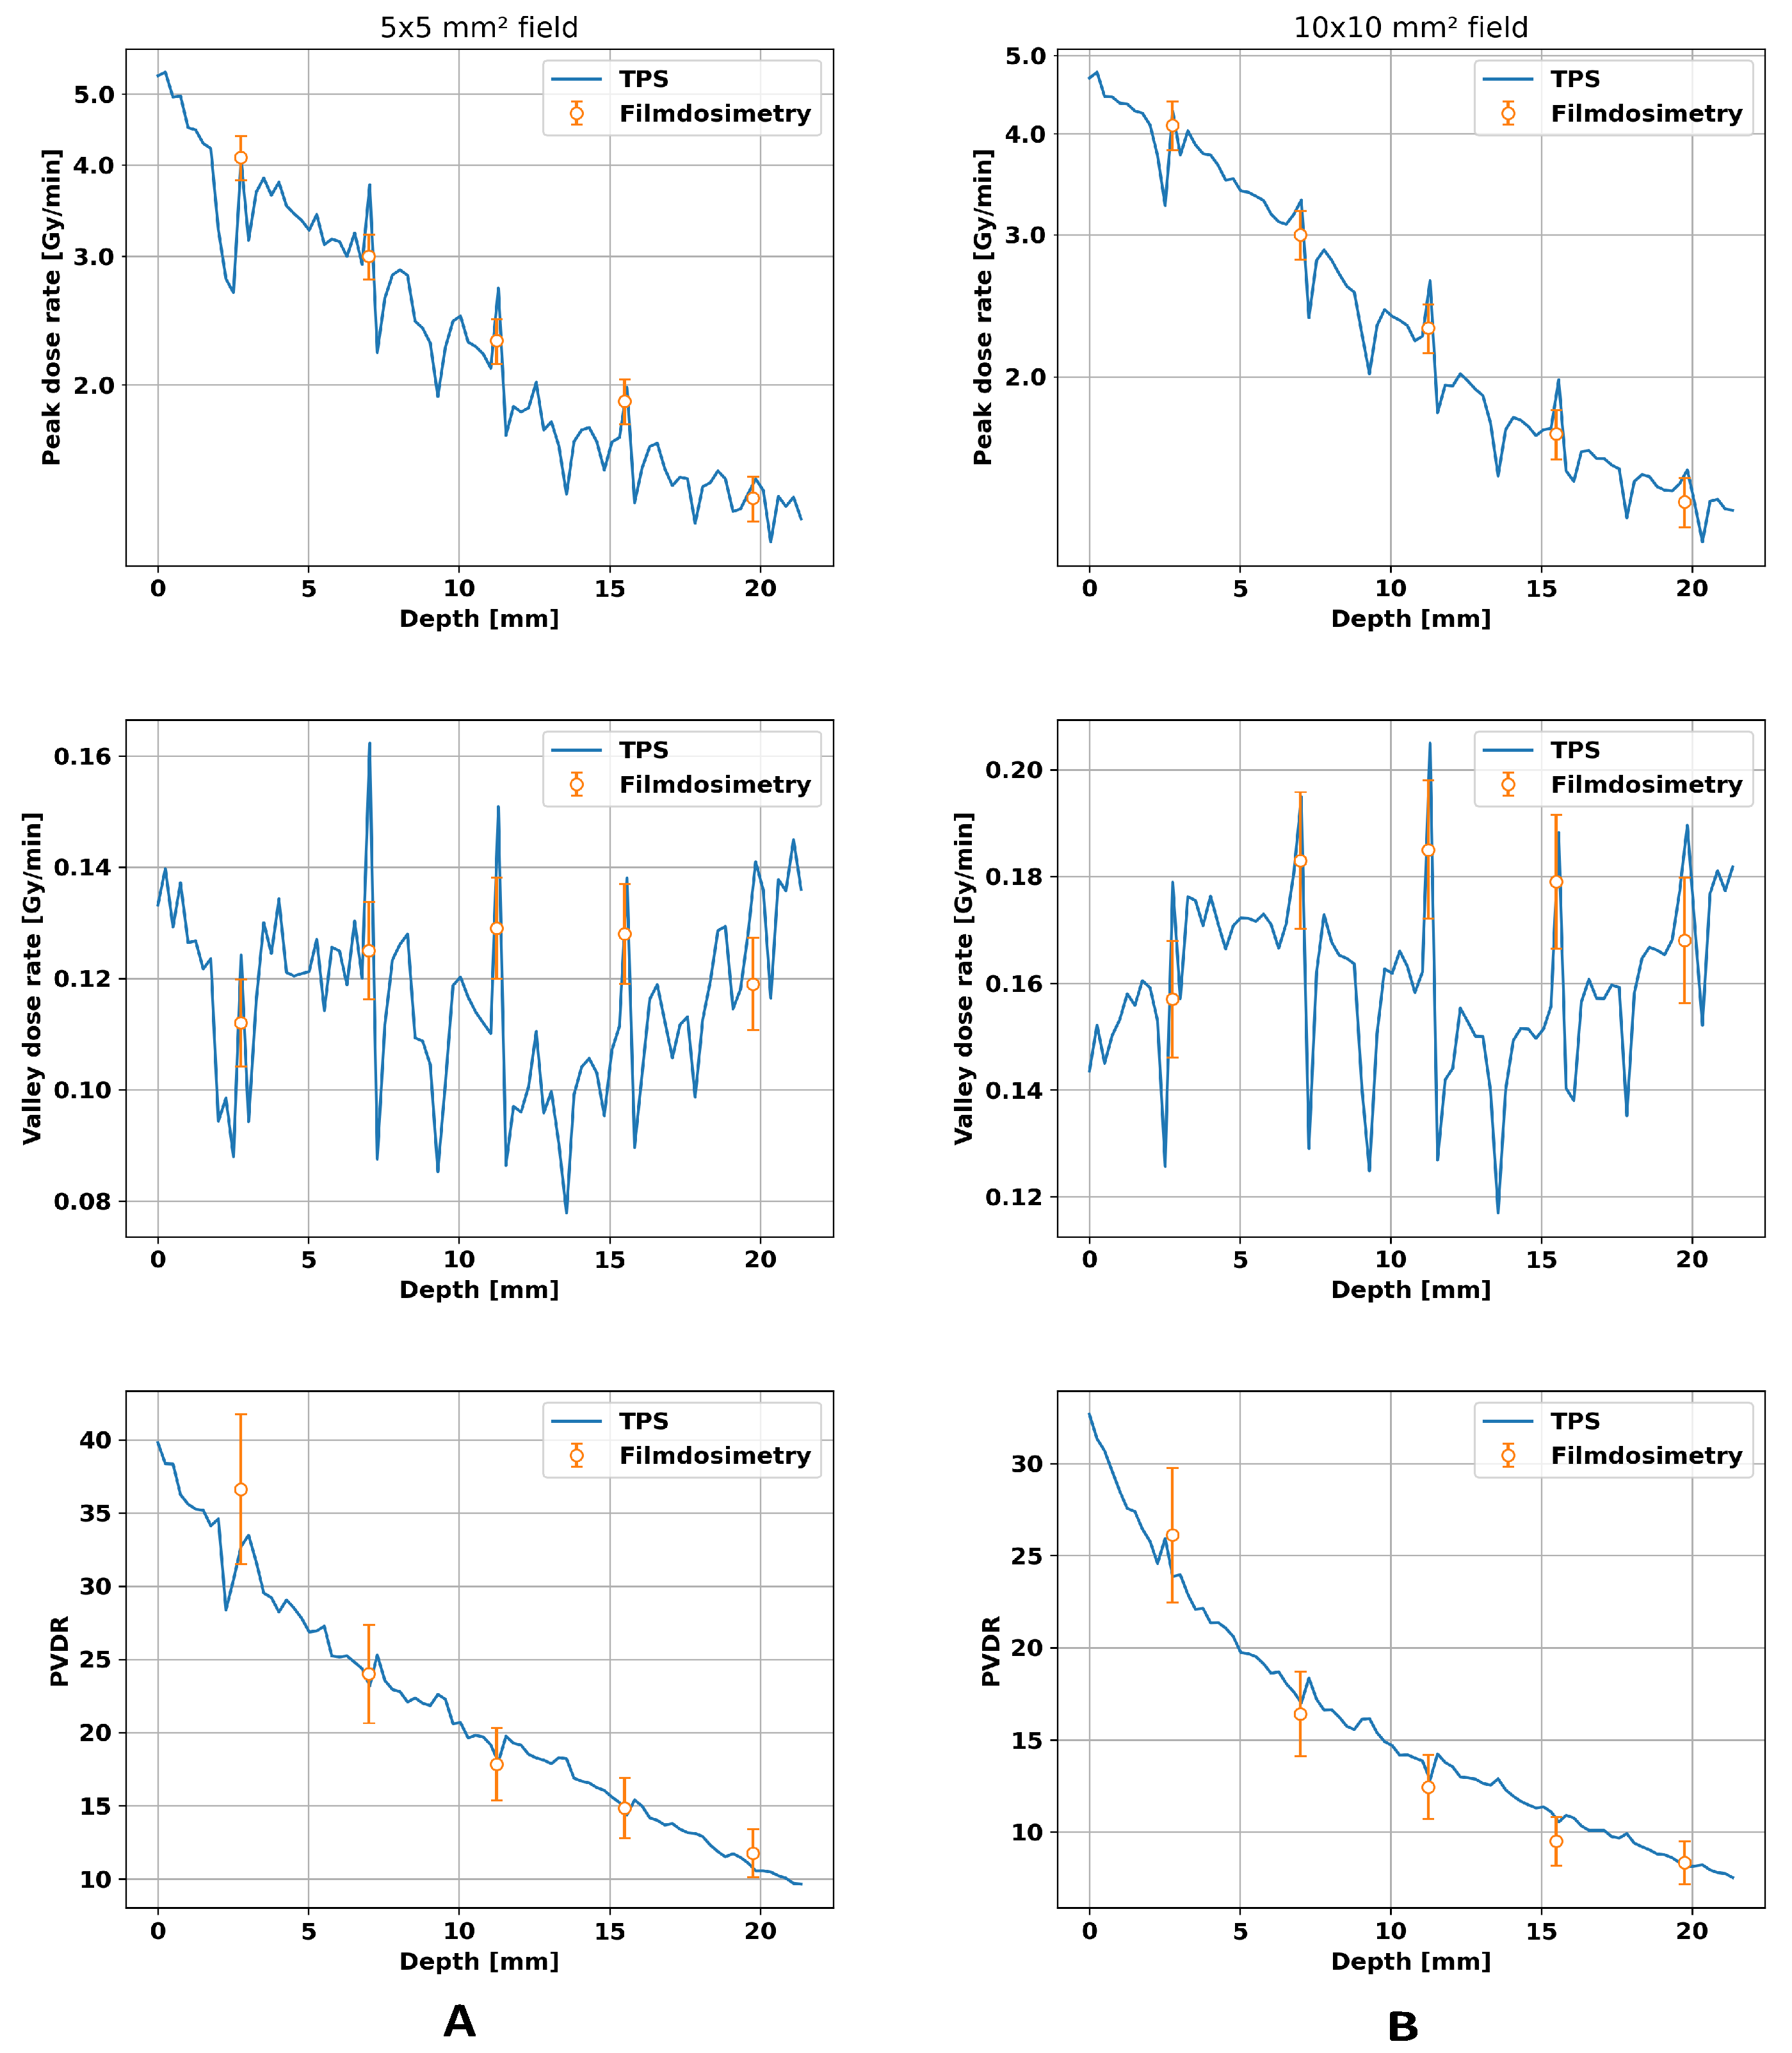
3.2. Validation of TPS
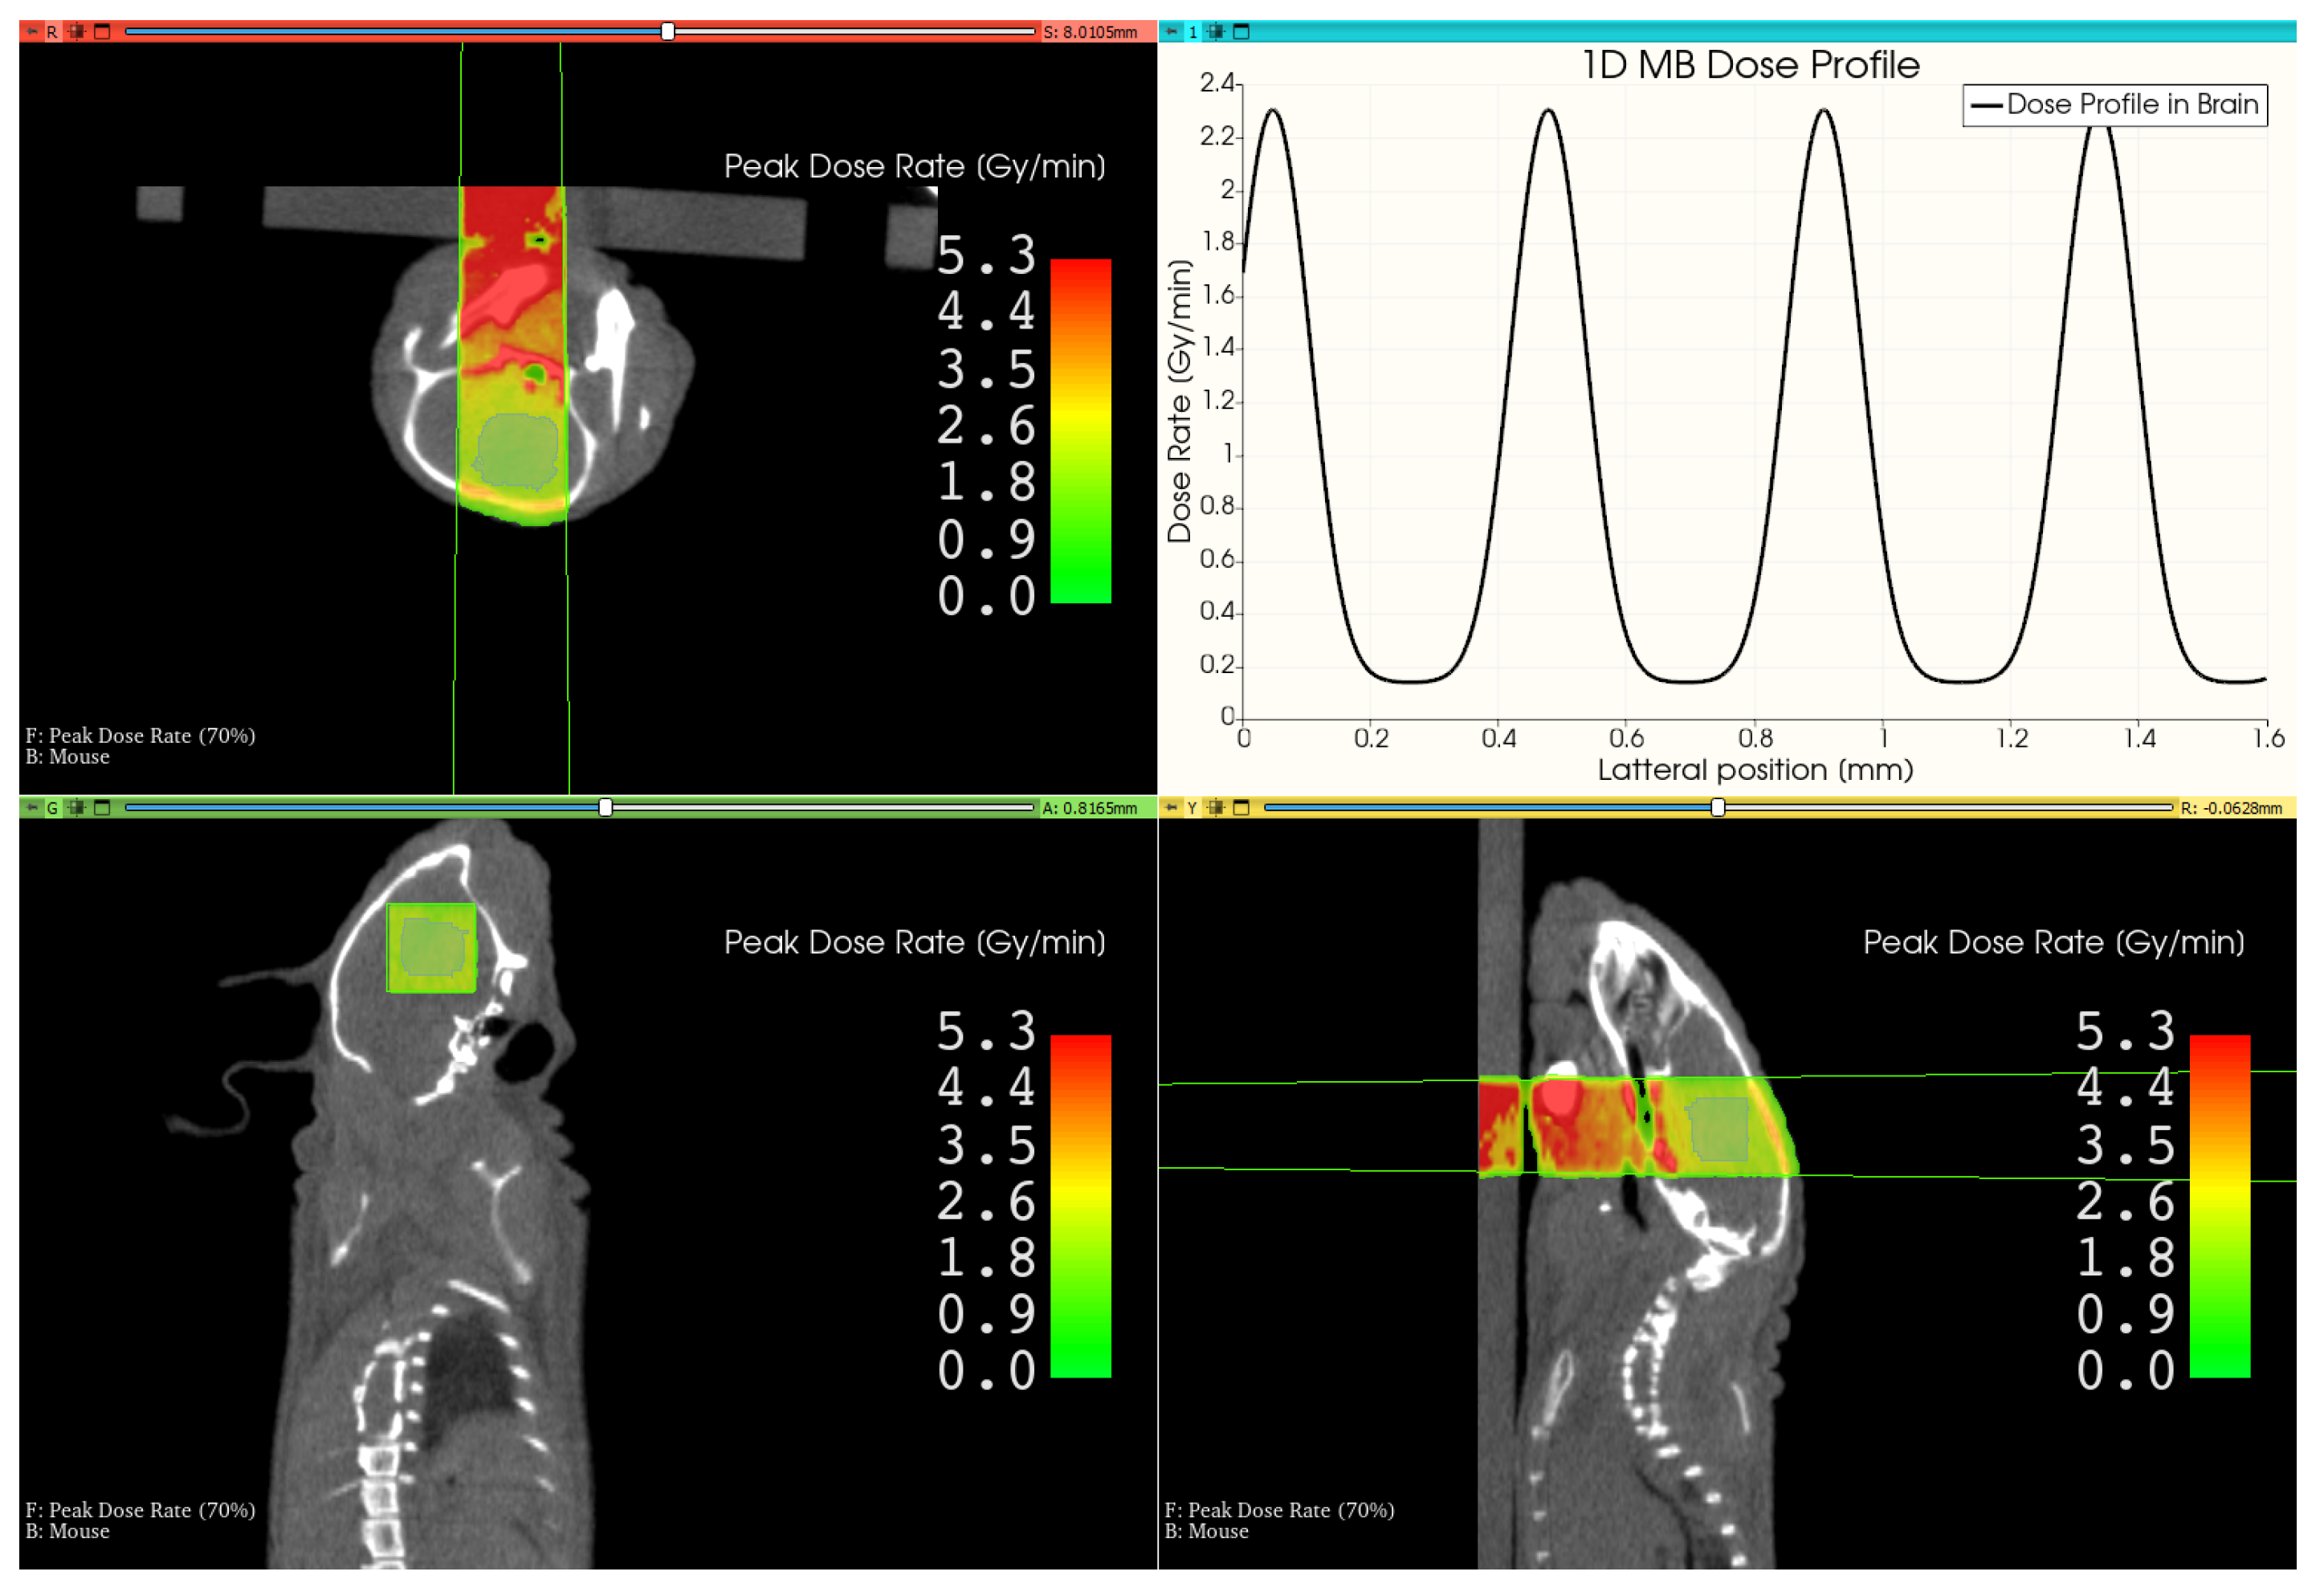
3.3. Therapy Plan for a Mouse Treatment
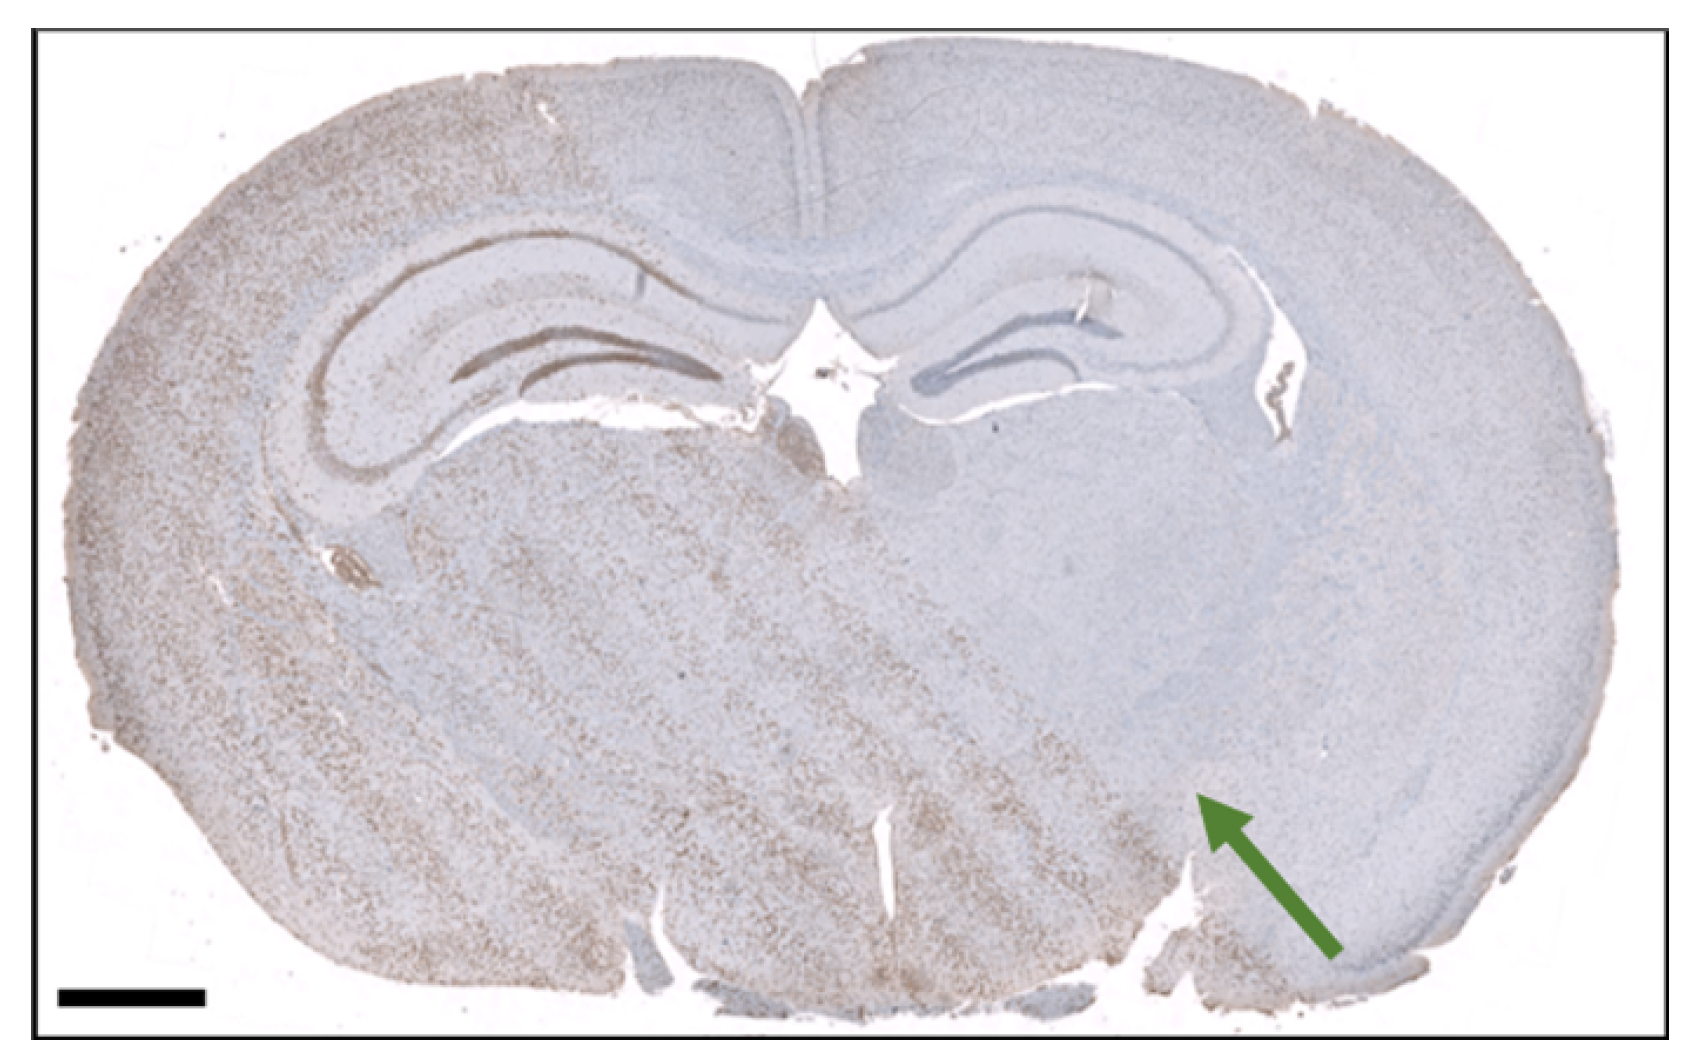
3.4. Histological Section of an Irradiated brain
4. Discussion
5. Conclusions
Author Contributions
Funding
Institutional Review Board Statement
Informed Consent Statement
Data Availability Statement
Acknowledgments
Conflicts of Interest
Abbreviations
| MRT | Microbeam radiation therapy |
| DNA | Deoxyribonucleic acid |
| CTC | Center-to-center distance |
| PVDR | Peak-to-valley dose ratio |
| TPS | Therapy planning system |
| MC | Monte Carlo |
| CT | Computed tomography |
| SPECT | Single photon emission computed tomography |
| w/v | Weight by volume |
| FWHM | Full width at half maximum |
References
- World Health Organization. New WHO/IAEA Publication Provides Guidance on Radiotherapy Equipment to Fight Cancer. 2021. Available online: https://www.who.int/news/item/05-03-2021-new-who-iaea-publication-provides-guidance-on-radiotherapy-equipment-to-fight-cancer (accessed on 11 December 2023).
- Baskar, R.; Dai, J.; Wenlong, N.; Yeo, R.; Yeoh, K.W. Biological response of cancer cells to radiation treatment. Front. Mol. Biosci. 2014, 1, 24. [Google Scholar] [CrossRef]
- Laissue, J.A.; Lyubimova, N.; Wagner, H.P.; Archer, D.W.; Slatkin, D.N.; Di Michiel, M.; Nemoz, C.; Renier, M.; Brauer, E.; Spanne, P.O.; et al. Microbeam radiation therapy. In Proceedings of the Medical Applications of Penetrating Radiation, SPIE, Denver, CO, USA, 22–23 July 1999; Volume 3770, pp. 38–45. [Google Scholar]
- Laissue, J.A.; Blattmann, H.; Di Michiel, M.; Slatkin, D.N.; Lyubimova, N.; Guzman, R.; Zimmermann, W.; Birrer, S.; Bley, T.; Kircher, P.; et al. Weanling piglet cerebellum: A surrogate for tolerance to MRT (microbeam radiation therapy) in pediatric neuro-oncology. In Proceedings of the Penetrating Radiation Systems and Applications III, SPIE, San Diego, CA, USA, 1–2 August 2001; Volume 4508, pp. 65–73. [Google Scholar]
- Serduc, R.; Vérant, P.; Vial, J.C.; Farion, R.; Rocas, L.; Rémy, C.; Fadlallah, T.; Brauer, E.; Bravin, A.; Laissue, J.; et al. In vivo two-photon microscopy study of short-term effects of microbeam irradiation on normal mouse brain microvasculature. Int. J. Radiat. Oncol. Biol. Phys. 2006, 64, 1519–1527. [Google Scholar] [CrossRef] [PubMed]
- Dilmanian, F.; Qu, Y.; Liu, S.; Cool, C.; Gilbert, J.; Hainfeld, J.; Kruse, C.; Laterra, J.; Lenihan, D.; Nawrocky, M.; et al. X-ray microbeams: Tumor therapy and central nervous system research. Nucl. Instrum. Methods Phys. Res. Sect. A Accel. Spectrom. Detect. Assoc. Equip. 2005, 548, 30–37. [Google Scholar] [CrossRef] [PubMed]
- Serduc, R.; Van De Looij, Y.; Francony, G.; Verdonck, O.; Van Der Sanden, B.; Laissue, J.; Farion, R.; Bräuer-Krisch, E.; Siegbahn, E.A.; Bravin, A.; et al. Characterization and quantification of cerebral edema induced by synchrotron X-ray microbeam radiation therapy. Phys. Med. Biol. 2008, 53, 1153. [Google Scholar] [CrossRef] [PubMed]
- van Der Sanden, B.; Bräuer-Krisch, E.; Siegbahn, E.A.; Ricard, C.; Vial, J.C.; Laissue, J. Tolerance of arteries to microplanar X-ray beams. Int. J. Radiat. Oncol. Biol. Phys. 2010, 77, 1545–1552. [Google Scholar] [CrossRef] [PubMed]
- Zhong, N.; Morris, G.M.; Bacarian, T.; Rosen, E.M.; Avraham Dilmanian, F. Response of rat skin to high-dose unidirectional X-ray microbeams: A histological study. Radiat. Res. 2003, 160, 133–142. [Google Scholar] [CrossRef]
- Fukunaga, H.; Kaminaga, K.; Sato, T.; Butterworth, K.T.; Watanabe, R.; Usami, N.; Ogawa, T.; Yokoya, A.; Prise, K.M. High-precision microbeam radiotherapy reveals testicular tissue-sparing effects for male fertility preservation. Sci. Rep. 2019, 9, 12618. [Google Scholar] [CrossRef]
- Laissue, J.A.; Geiser, G.; Spanne, P.O.; Dilmanian, F.A.; Gebbers, J.O.; Geiser, M.; Wu, X.Y.; Makar, M.S.; Micca, P.L.; Nawrocky, M.M.; et al. Neuropathology of ablation of rat gliosarcomas and contiguous brain tissues using a microplanar beam of synchrotron-wiggler-generated X rays. Int. J. Cancer 1998, 78, 654–660. [Google Scholar] [CrossRef]
- Bouchet, A.; Lemasson, B.; Le Duc, G.; Maisin, C.; Bräuer-Krisch, E.; Siegbahn, E.A.; Renaud, L.; Khalil, E.; Rémy, C.; Poillot, C.; et al. Preferential effect of synchrotron microbeam radiation therapy on intracerebral 9L gliosarcoma vascular networks. Int. J. Radiat. Oncol. Biol. Phys. 2010, 78, 1503–1512. [Google Scholar] [CrossRef]
- Bouchet, A.; Potez, M.; Coquery, N.; Rome, C.; Lemasson, B.; Bräuer-Krisch, E.; Rémy, C.; Laissue, J.; Barbier, E.L.; Djonov, V.; et al. Permeability of brain tumor vessels induced by uniform or spatially microfractionated synchrotron radiation therapies. Int. J. Radiat. Oncol. Biol. Phys. 2017, 98, 1174–1182. [Google Scholar] [CrossRef]
- Dilmanian, F.A.; Morris, G.M.; Zhong, N.; Bacarian, T.; Hainfeld, J.F.; Kalef-Ezra, J.; Brewington, L.J.; Tammam, J.; Rosen, E.M. Murine EMT-6 carcinoma: High therapeutic efficacy of microbeam radiation therapy. Radiat. Res. 2003, 159, 632–641. [Google Scholar] [CrossRef] [PubMed]
- Crosbie, J.C.; Anderson, R.L.; Rothkamm, K.; Restall, C.M.; Cann, L.; Ruwanpura, S.; Meachem, S.; Yagi, N.; Svalbe, I.; Lewis, R.A.; et al. Tumor cell response to synchrotron microbeam radiation therapy differs markedly from cells in normal tissues. Int. J. Radiat. Oncol. Biol. Phys. 2010, 77, 886–894. [Google Scholar] [CrossRef] [PubMed]
- Potez, M.; Fernandez-Palomo, C.; Bouchet, A.; Trappetti, V.; Donzelli, M.; Krisch, M.; Laissue, J.; Volarevic, V.; Djonov, V. Synchrotron microbeam radiation therapy as a new approach for the treatment of radioresistant melanoma: Potential underlying mechanisms. Int. J. Radiat. Oncol. Biol. Phys. 2019, 105, 1126–1136. [Google Scholar] [CrossRef] [PubMed]
- Uyama, A.; Kondoh, T.; Nariyama, N.; Umetani, K.; Fukumoto, M.; Shinohara, K.; Kohmura, E. A narrow microbeam is more effective for tumor growth suppression than a wide microbeam: An in vivo study using implanted human glioma cells. J. Synchrotron Radiat. 2011, 18, 671–678. [Google Scholar] [CrossRef]
- Bouchet, A.; Bräuer-Krisch, E.; Prezado, Y.; El Atifi, M.; Rogalev, L.; Le Clec’h, C.; Laissue, J.A.; Pelletier, L.; Le Duc, G. Better efficacy of synchrotron spatially microfractionated radiation therapy than uniform radiation therapy on glioma. Int. J. Radiat. Oncol. Biol. Phys. 2016, 95, 1485–1494. [Google Scholar] [CrossRef] [PubMed]
- Slatkin, D.; Spanne, P.; Dilmanian, F.; Gebbers, J.; Laissue, J. Subacute neuropathological effects of microplanar beams of X-rays from a synchrotron wiggler. Proc. Natl. Acad. Sci. USA 1995, 92, 8783–8787. [Google Scholar] [CrossRef]
- Treibel, F.; Nguyen, M.; Ahmed, M.; Dombrowsky, A.; Wilkens, J.J.; Combs, S.E.; Schmid, T.E.; Bartzsch, S. Establishment of Microbeam Radiation Therapy at a Small-Animal Irradiator. Int. J. Radiat. Oncol. Biol. Phys. 2021, 109, 626–636. [Google Scholar] [CrossRef]
- Fedorov, A.; Beichel, R.; Kalpathy-Cramer, J.; Finet, J.; Fillion-Robin, J.C.; Pujol, S.; Bauer, C.; Jennings, D.; Fennessy, F.; Sonka, M.; et al. 3D Slicer as an image computing platform for the Quantitative Imaging Network. Magn. Reson. Imaging 2012, 30, 1323–1341. [Google Scholar] [CrossRef]
- Donzelli, M.; Bräuer-Krisch, E.; Oelfke, U.; Wilkens, J.J.; Bartzsch, S. Hybrid dose calculation: A dose calculation algorithm for microbeam radiation therapy. Phys. Med. Biol. 2018, 63, 045013. [Google Scholar] [CrossRef]
- Debus, C.; Oelfke, U.; Bartzsch, S. A point kernel algorithm for microbeam radiation therapy. Phys. Med. Biol. 2017, 62, 8341. [Google Scholar] [CrossRef]
- Winter, J.; Galek, M.; Matejcek, C.; Wilkens, J.J.; Aulenbacher, K.; Combs, S.E.; Bartzsch, S. Clinical microbeam radiation therapy with a compact source: Specifications of the line-focus X-ray tube. Phys. Imaging Radiat. Oncol. 2020, 14, 74–81. [Google Scholar] [CrossRef] [PubMed]
- Schneider, W.; Bortfeld, T.; Schlegel, W. Correlation between CT numbers and tissue parameters needed for Monte Carlo simulations of clinical dose distributions. Phys. Med. Biol. 2000, 45, 459. [Google Scholar] [CrossRef] [PubMed]
- Bartzsch, S.; Lott, J.; Welsch, K.; Bräuer-Krisch, E.; Oelfke, U. Micrometer-resolved film dosimetry using a microscope in microbeam radiation therapy. Med Phys. 2015, 42, 4069–4079. [Google Scholar] [CrossRef] [PubMed]
- EN 12543-1:1999; Non-Destructive Testing—Characteristics of Focal Spots in Industrial X-ray Systems for Use in Non-Destructive Testing—Part 1: Scanning Method. CEN: Brussels, Belgium, 1999.
- Sachs, R.K.; Hahnfeld, P.; Brenner, R.D.J. Review the link between low-LET dose-response relations and the underlying kinetics of damage production/repair/misrepair. Int. J. Radiat. Biol. 1997, 72, 351–374. [Google Scholar]
- McMahon, S.J. The linear quadratic model: Usage, interpretation and challenges. Phys. Med. Biol. 2018, 64, 01TR01. [Google Scholar] [CrossRef]
- Dale, R.G. Radiation repair models for clinical application. Br. J. Radiol. 2018, 92, 20180070. [Google Scholar] [CrossRef]
- Fowler, J.F. Repair between dose fractions: A simpler method of analyzing and reporting apparently biexponential repair. Radiat. Res. 2002, 158, 141–151. [Google Scholar] [CrossRef]
- Martínez-Rovira, I.; Sempau, J.; Prezado, Y. Development and commissioning of a Monte Carlo photon beam model for the forthcoming clinical trials in microbeam radiation therapy. Med. Phys. 2012, 39, 119–131. [Google Scholar] [CrossRef] [PubMed]


Disclaimer/Publisher’s Note: The statements, opinions and data contained in all publications are solely those of the individual author(s) and contributor(s) and not of MDPI and/or the editor(s). MDPI and/or the editor(s) disclaim responsibility for any injury to people or property resulting from any ideas, methods, instructions or products referred to in the content. |
© 2024 by the authors. Licensee MDPI, Basel, Switzerland. This article is an open access article distributed under the terms and conditions of the Creative Commons Attribution (CC BY) license (https://creativecommons.org/licenses/by/4.0/).
Share and Cite
Ahmed, M.; Bicher, S.; Combs, S.E.; Lindner, R.; Raulefs, S.; Schmid, T.E.; Spasova, S.; Stolz, J.; Wilkens, J.J.; Winter, J.; et al. In Vivo Microbeam Radiation Therapy at a Conventional Small Animal Irradiator. Cancers 2024, 16, 581. https://doi.org/10.3390/cancers16030581
Ahmed M, Bicher S, Combs SE, Lindner R, Raulefs S, Schmid TE, Spasova S, Stolz J, Wilkens JJ, Winter J, et al. In Vivo Microbeam Radiation Therapy at a Conventional Small Animal Irradiator. Cancers. 2024; 16(3):581. https://doi.org/10.3390/cancers16030581
Chicago/Turabian StyleAhmed, Mabroor, Sandra Bicher, Stephanie Elisabeth Combs, Rainer Lindner, Susanne Raulefs, Thomas E. Schmid, Suzana Spasova, Jessica Stolz, Jan Jakob Wilkens, Johanna Winter, and et al. 2024. "In Vivo Microbeam Radiation Therapy at a Conventional Small Animal Irradiator" Cancers 16, no. 3: 581. https://doi.org/10.3390/cancers16030581