
Determining the Potential of DNA Damage Response (DDR) Inhibitors in Cervical Cancer Therapy
 , and
, and
Abstract
:Simple Summary
Abstract
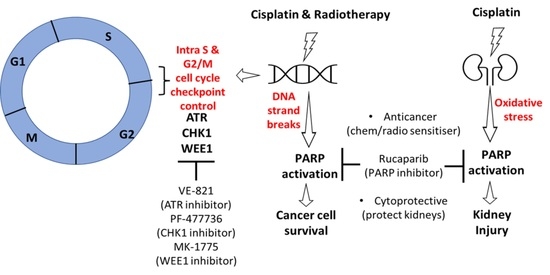
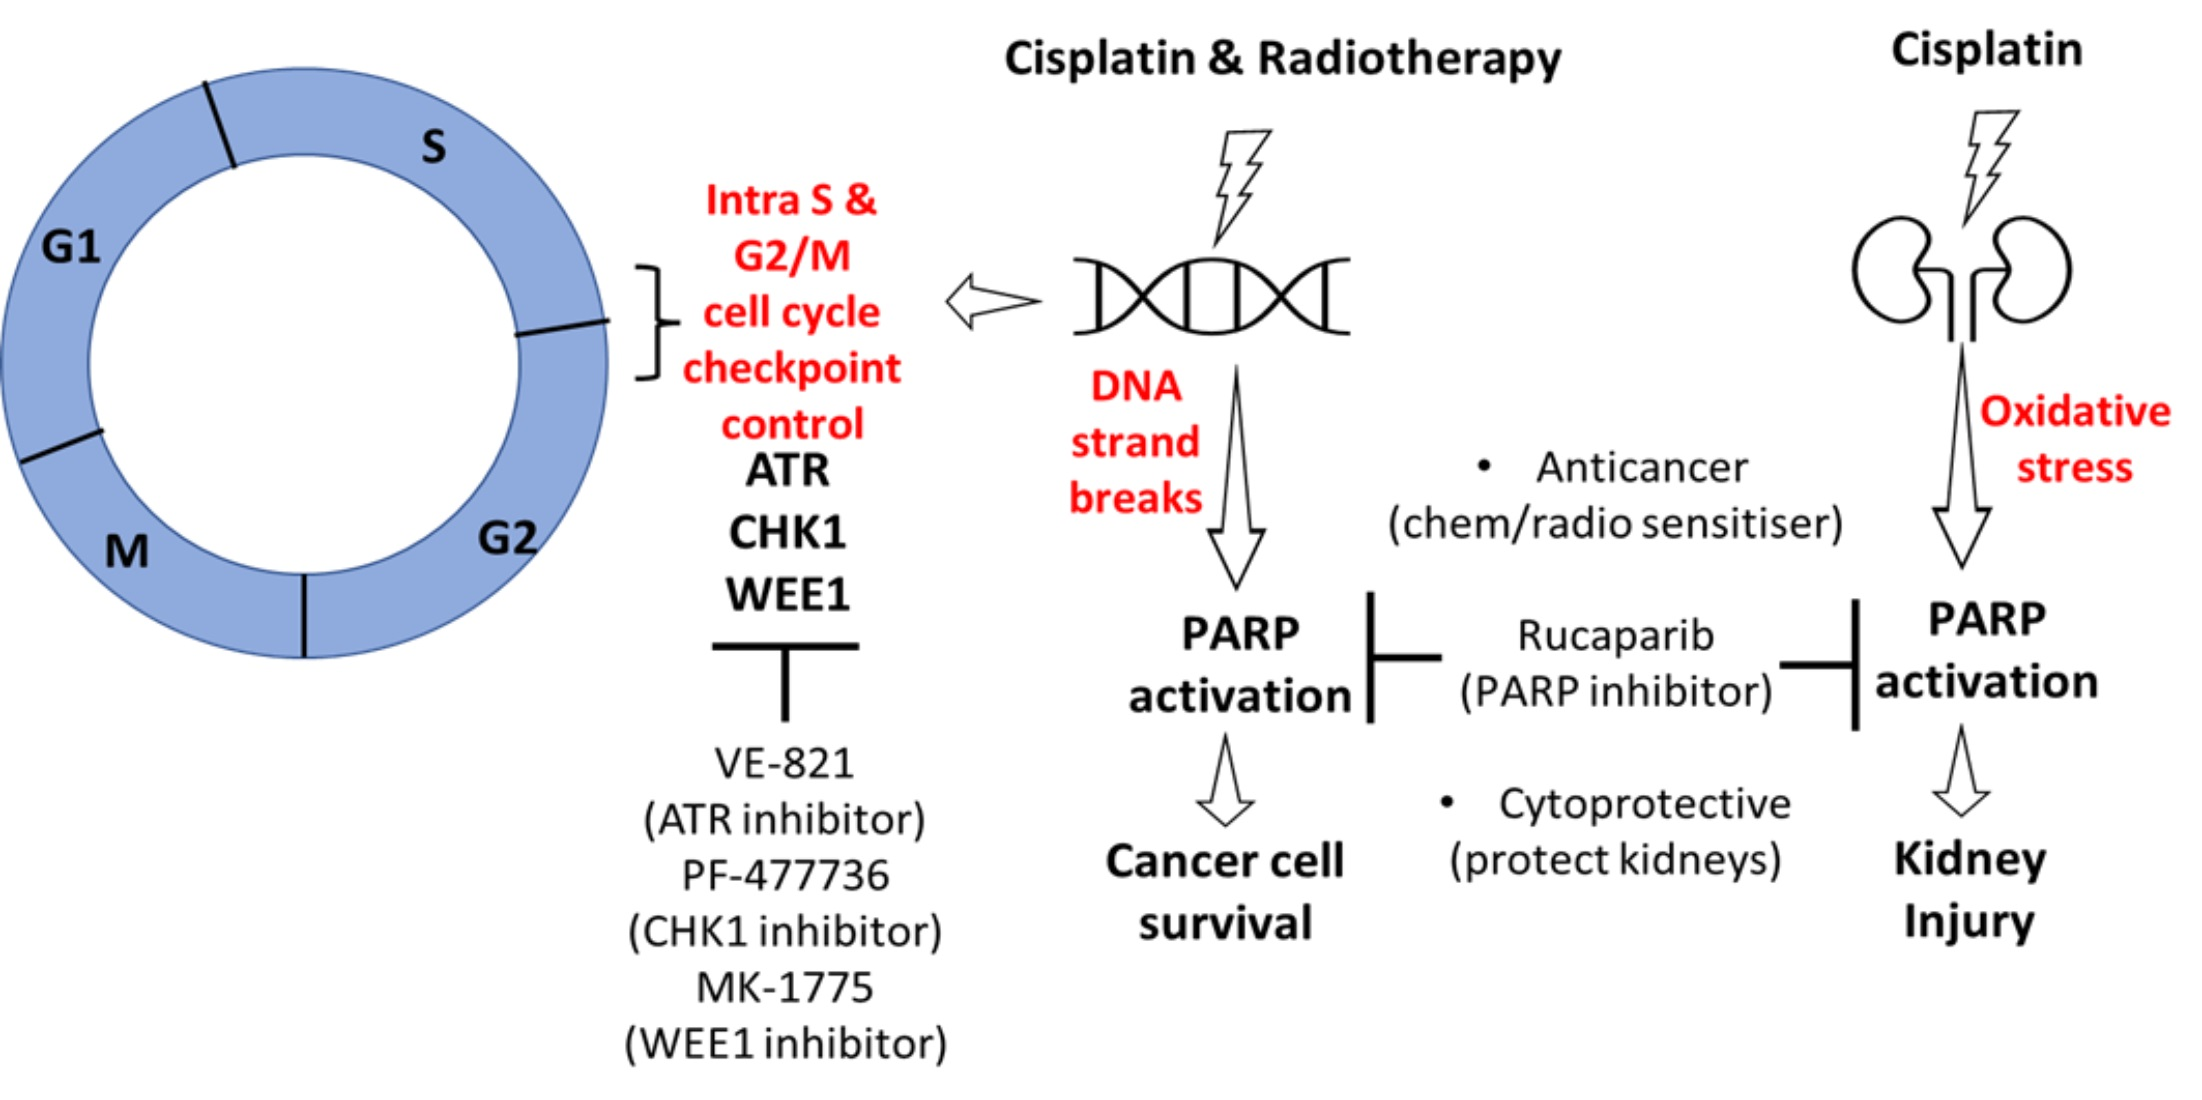
1. Introduction
2. Materials and Methods
2.1. Chemicals and Reagents
2.2. Cell Lines
2.3. Cytotoxicity Assy
2.4. Measurement of Cellular Proteins and Their Phosphorylation by Western Blot
2.5. Immunofluorescence (IF) Microscopy
2.6. Cell Cycle Analysis
2.7. Determination of Acute Kidney Injury in Mice Treated with Cisplatin and Rucaparib
2.8. Immunohistochemistry (IHC)
2.9. Statistical Analysis
3. Results
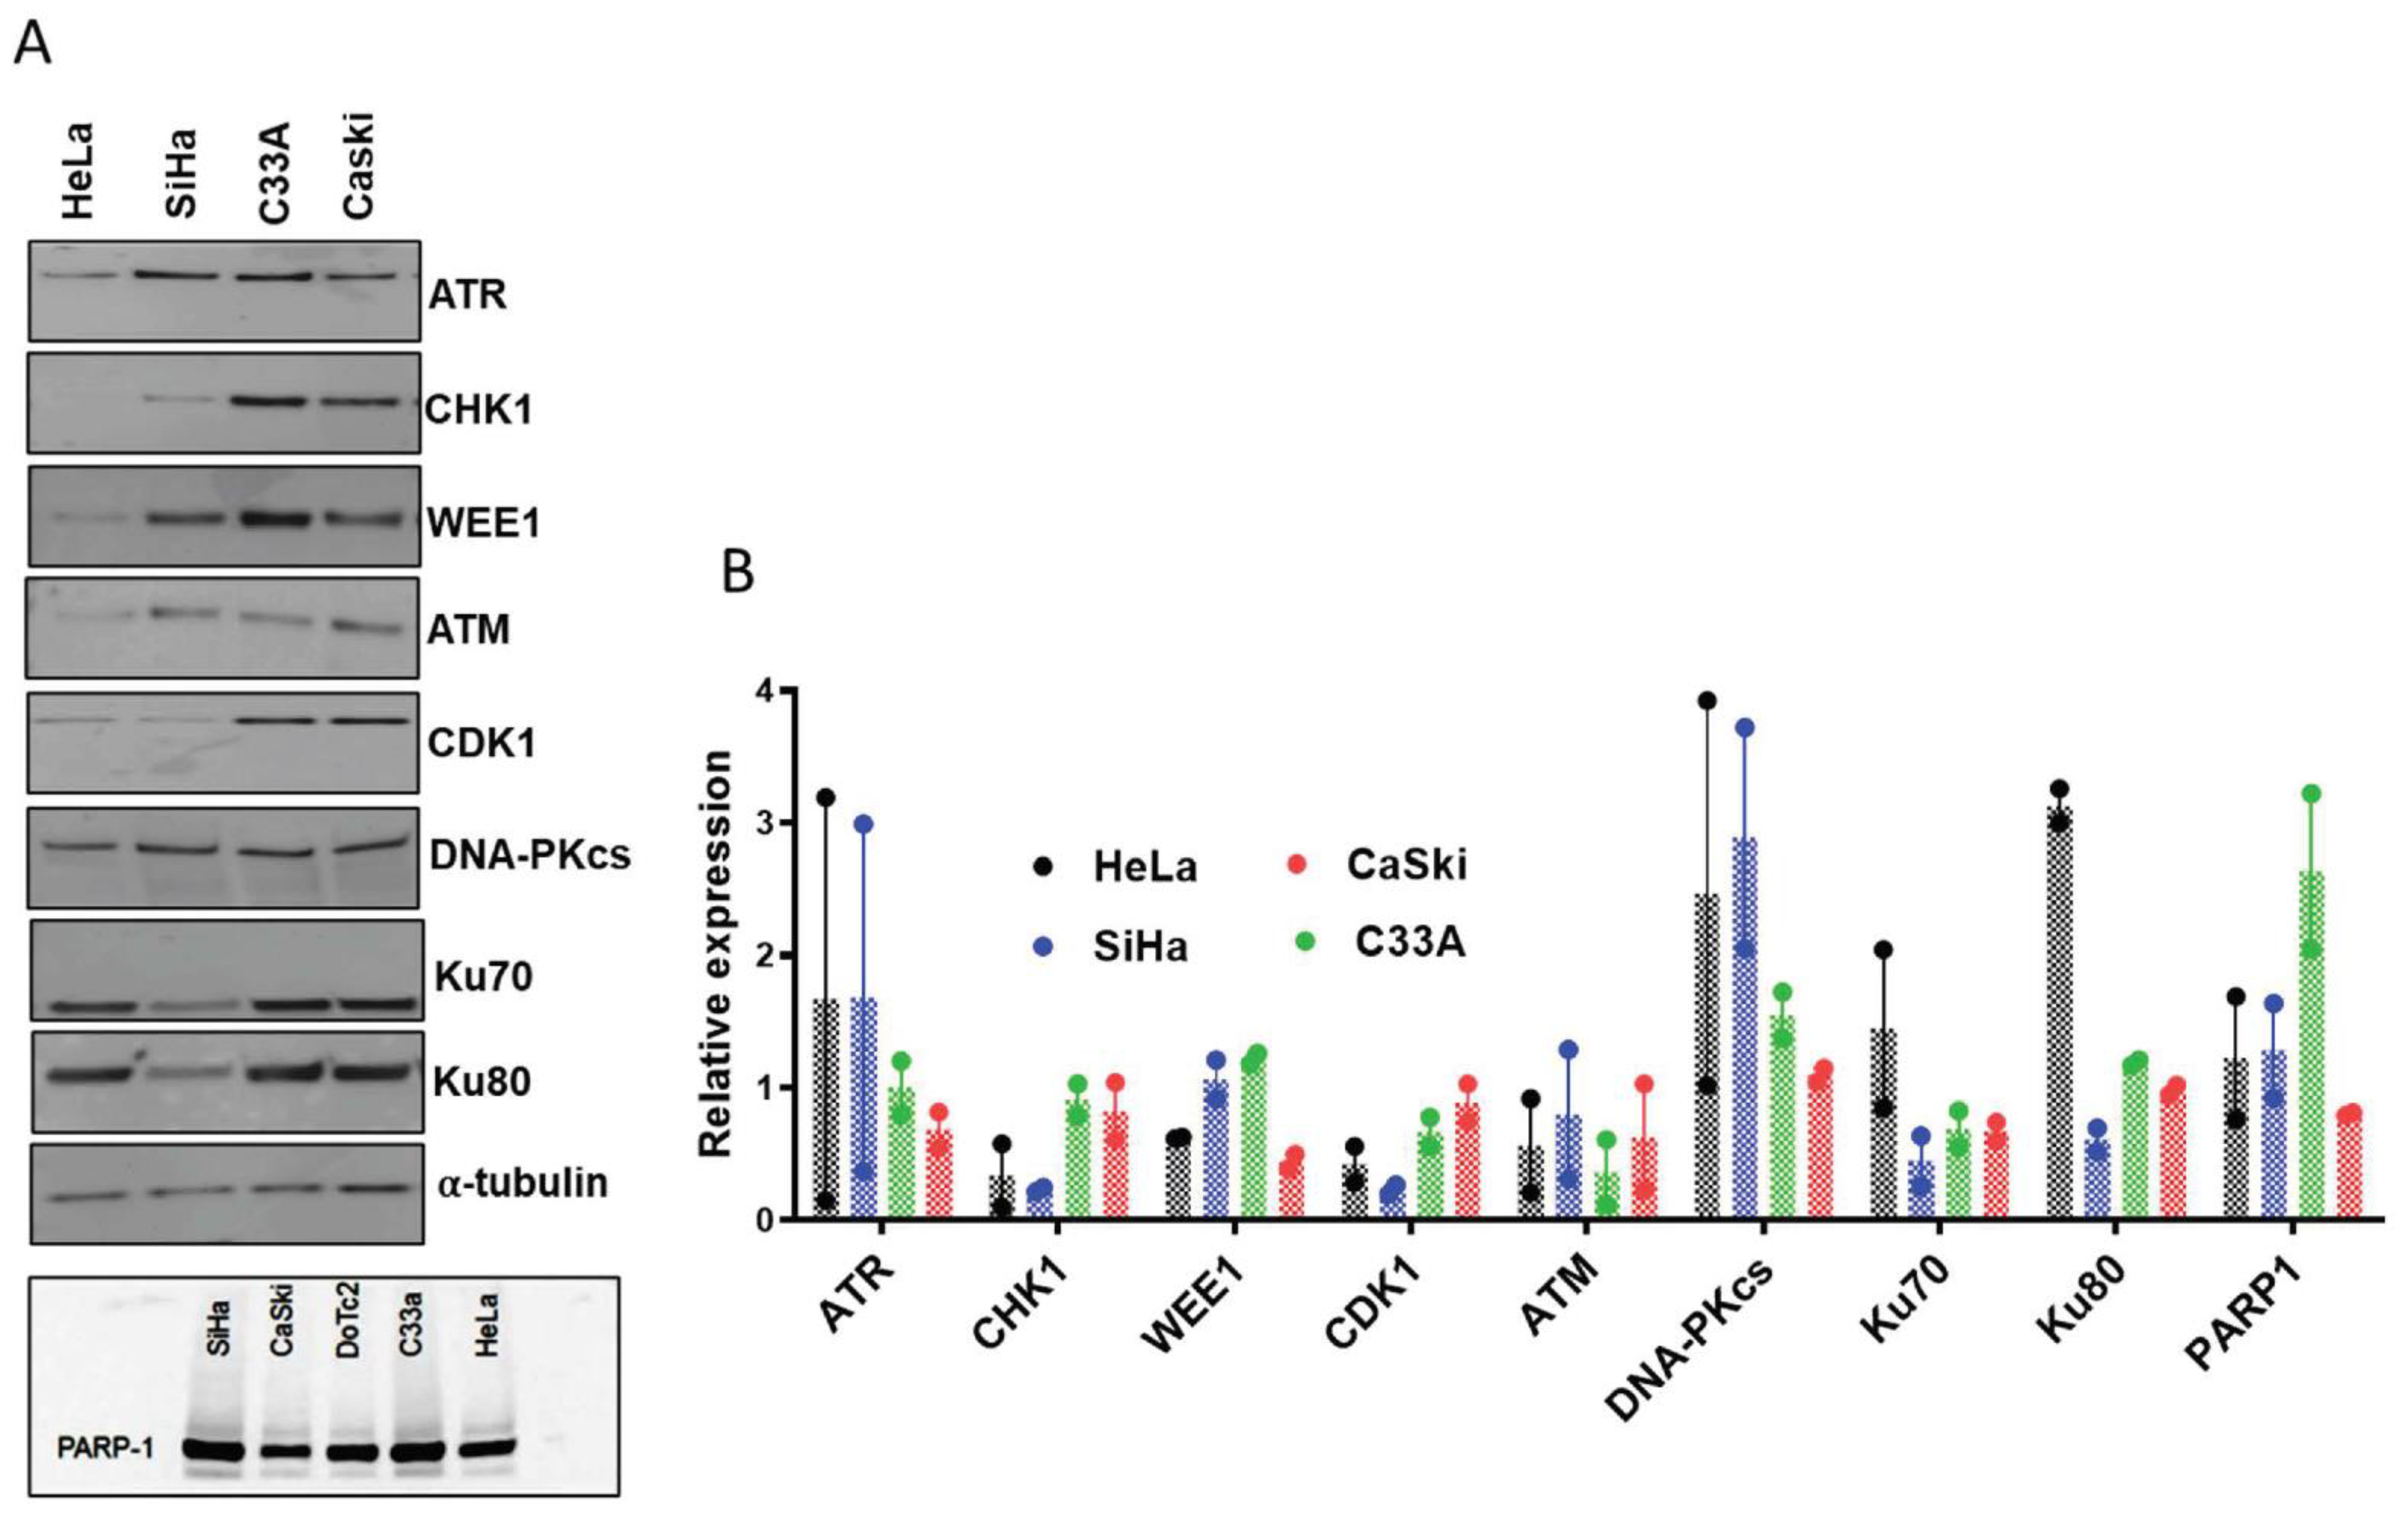
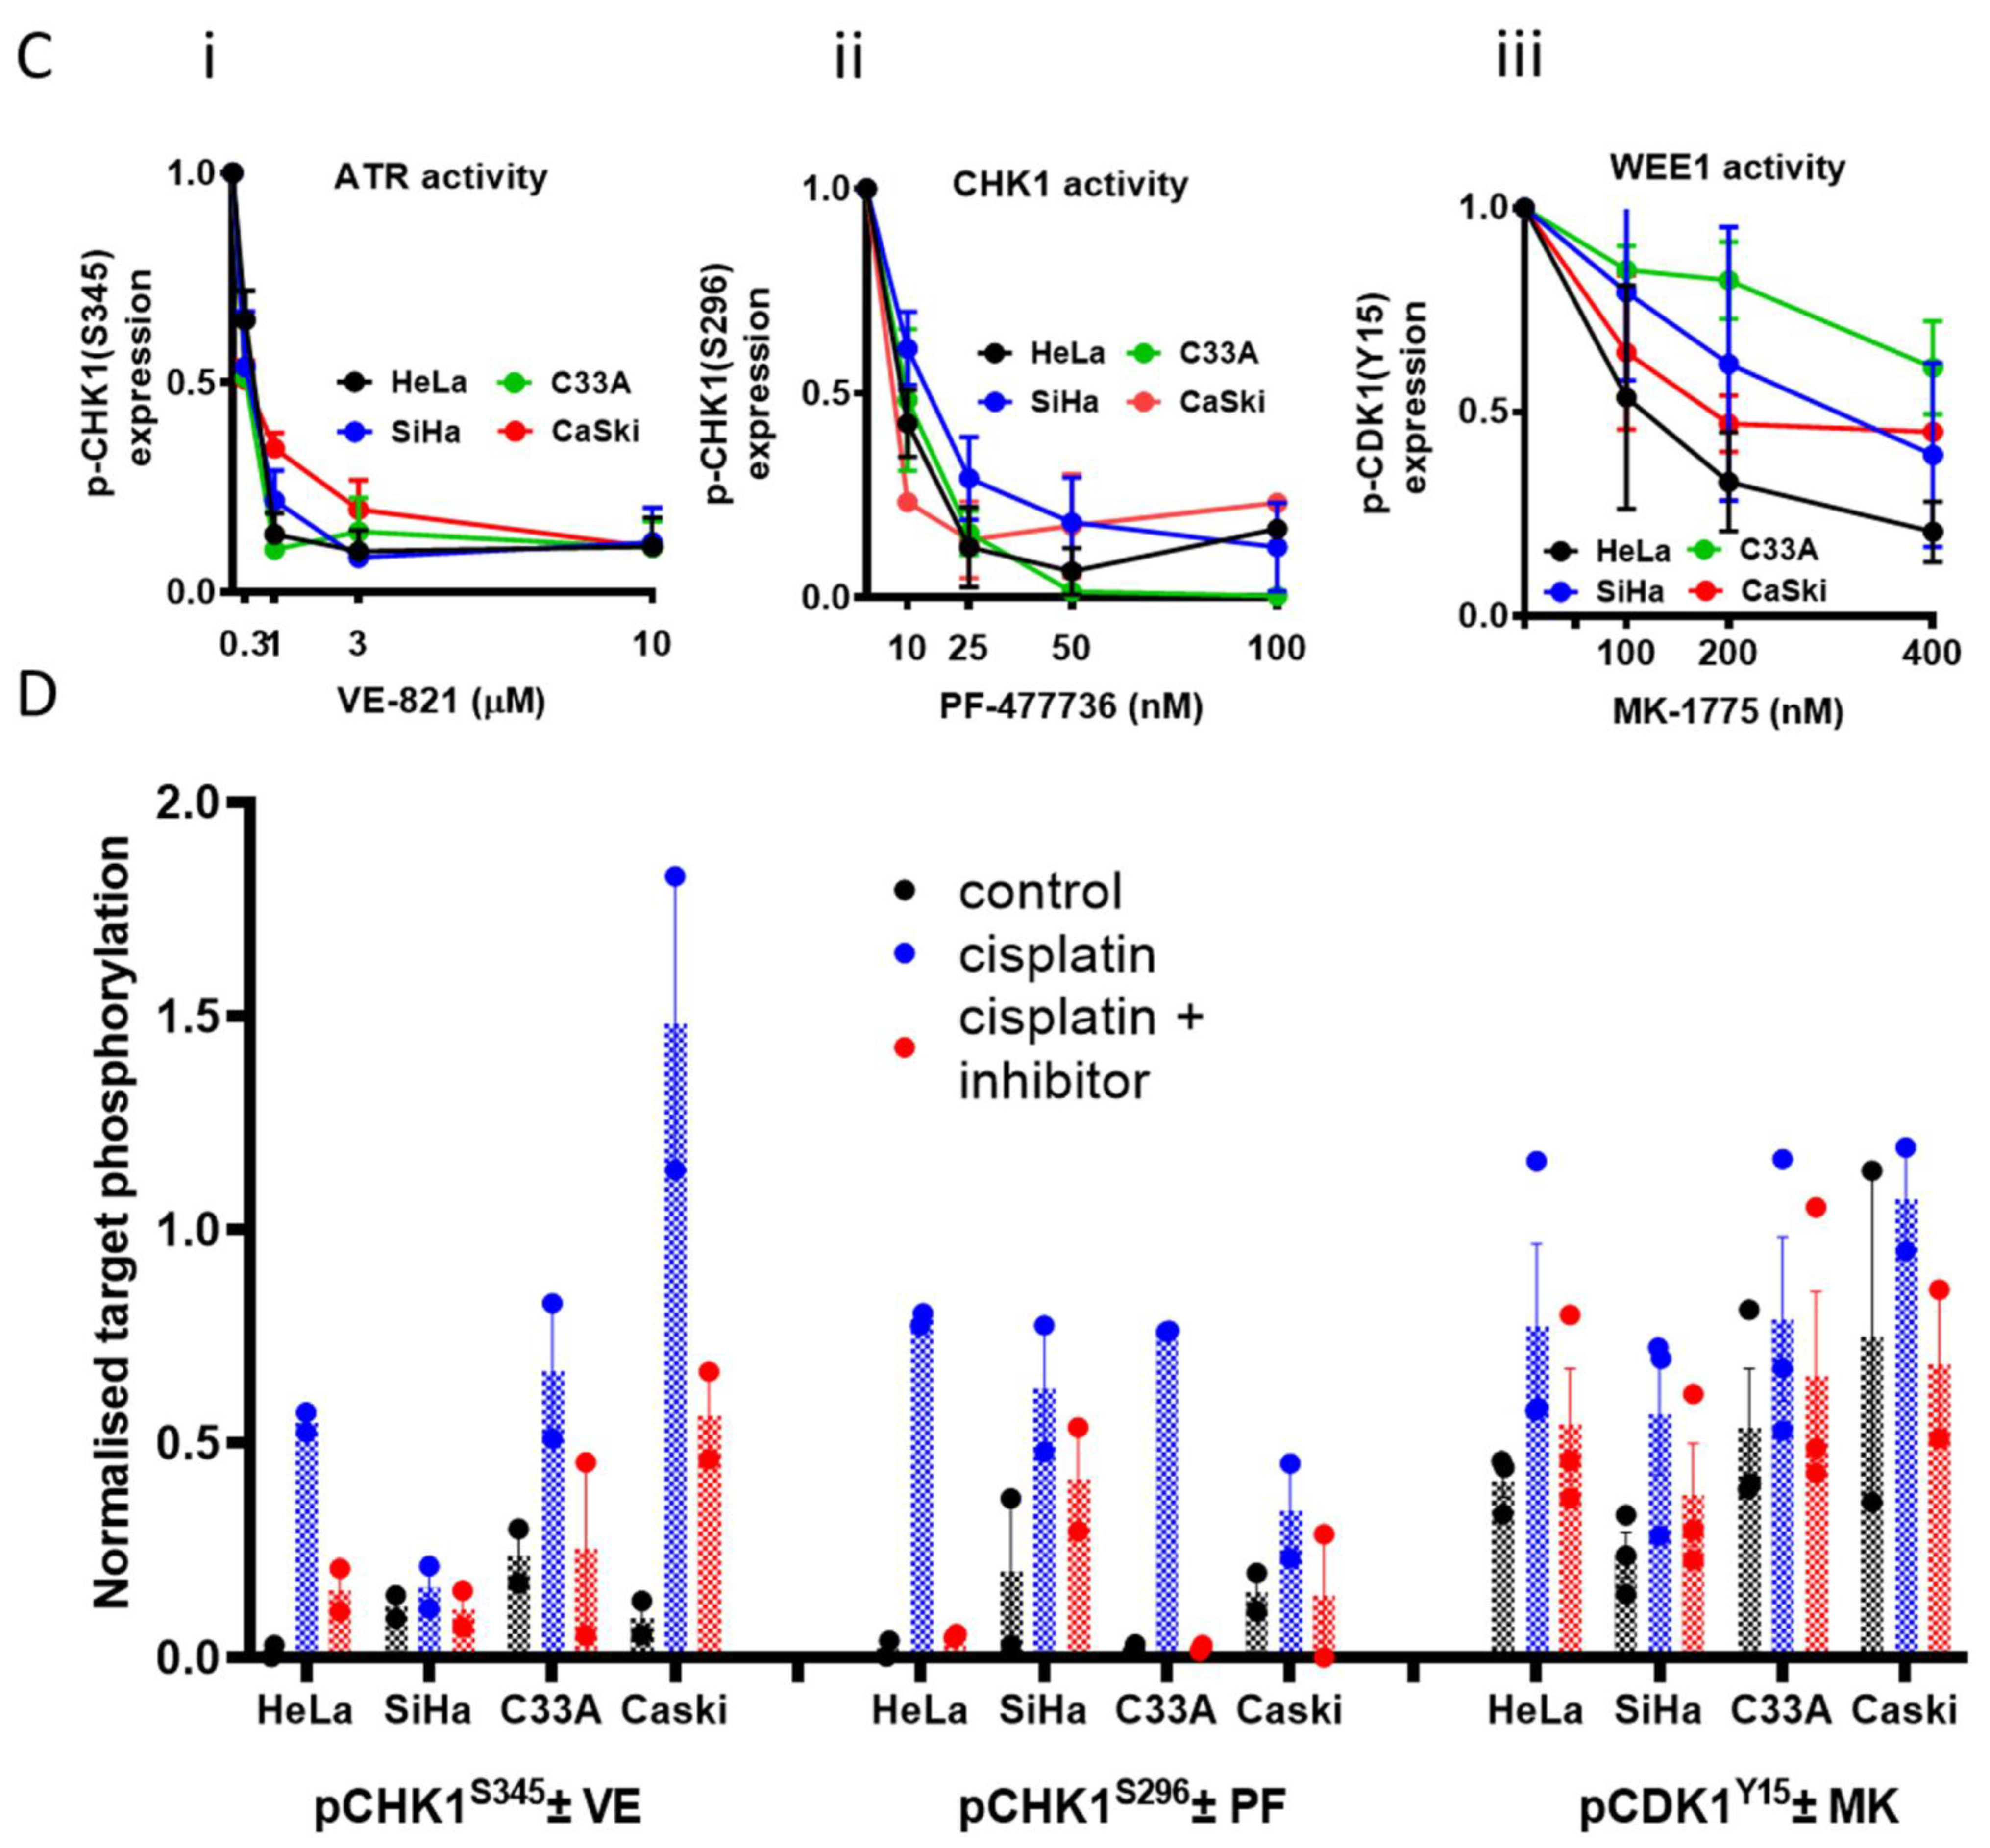
3.1. Cell Line Characteristics, Target Expression and Inhibition
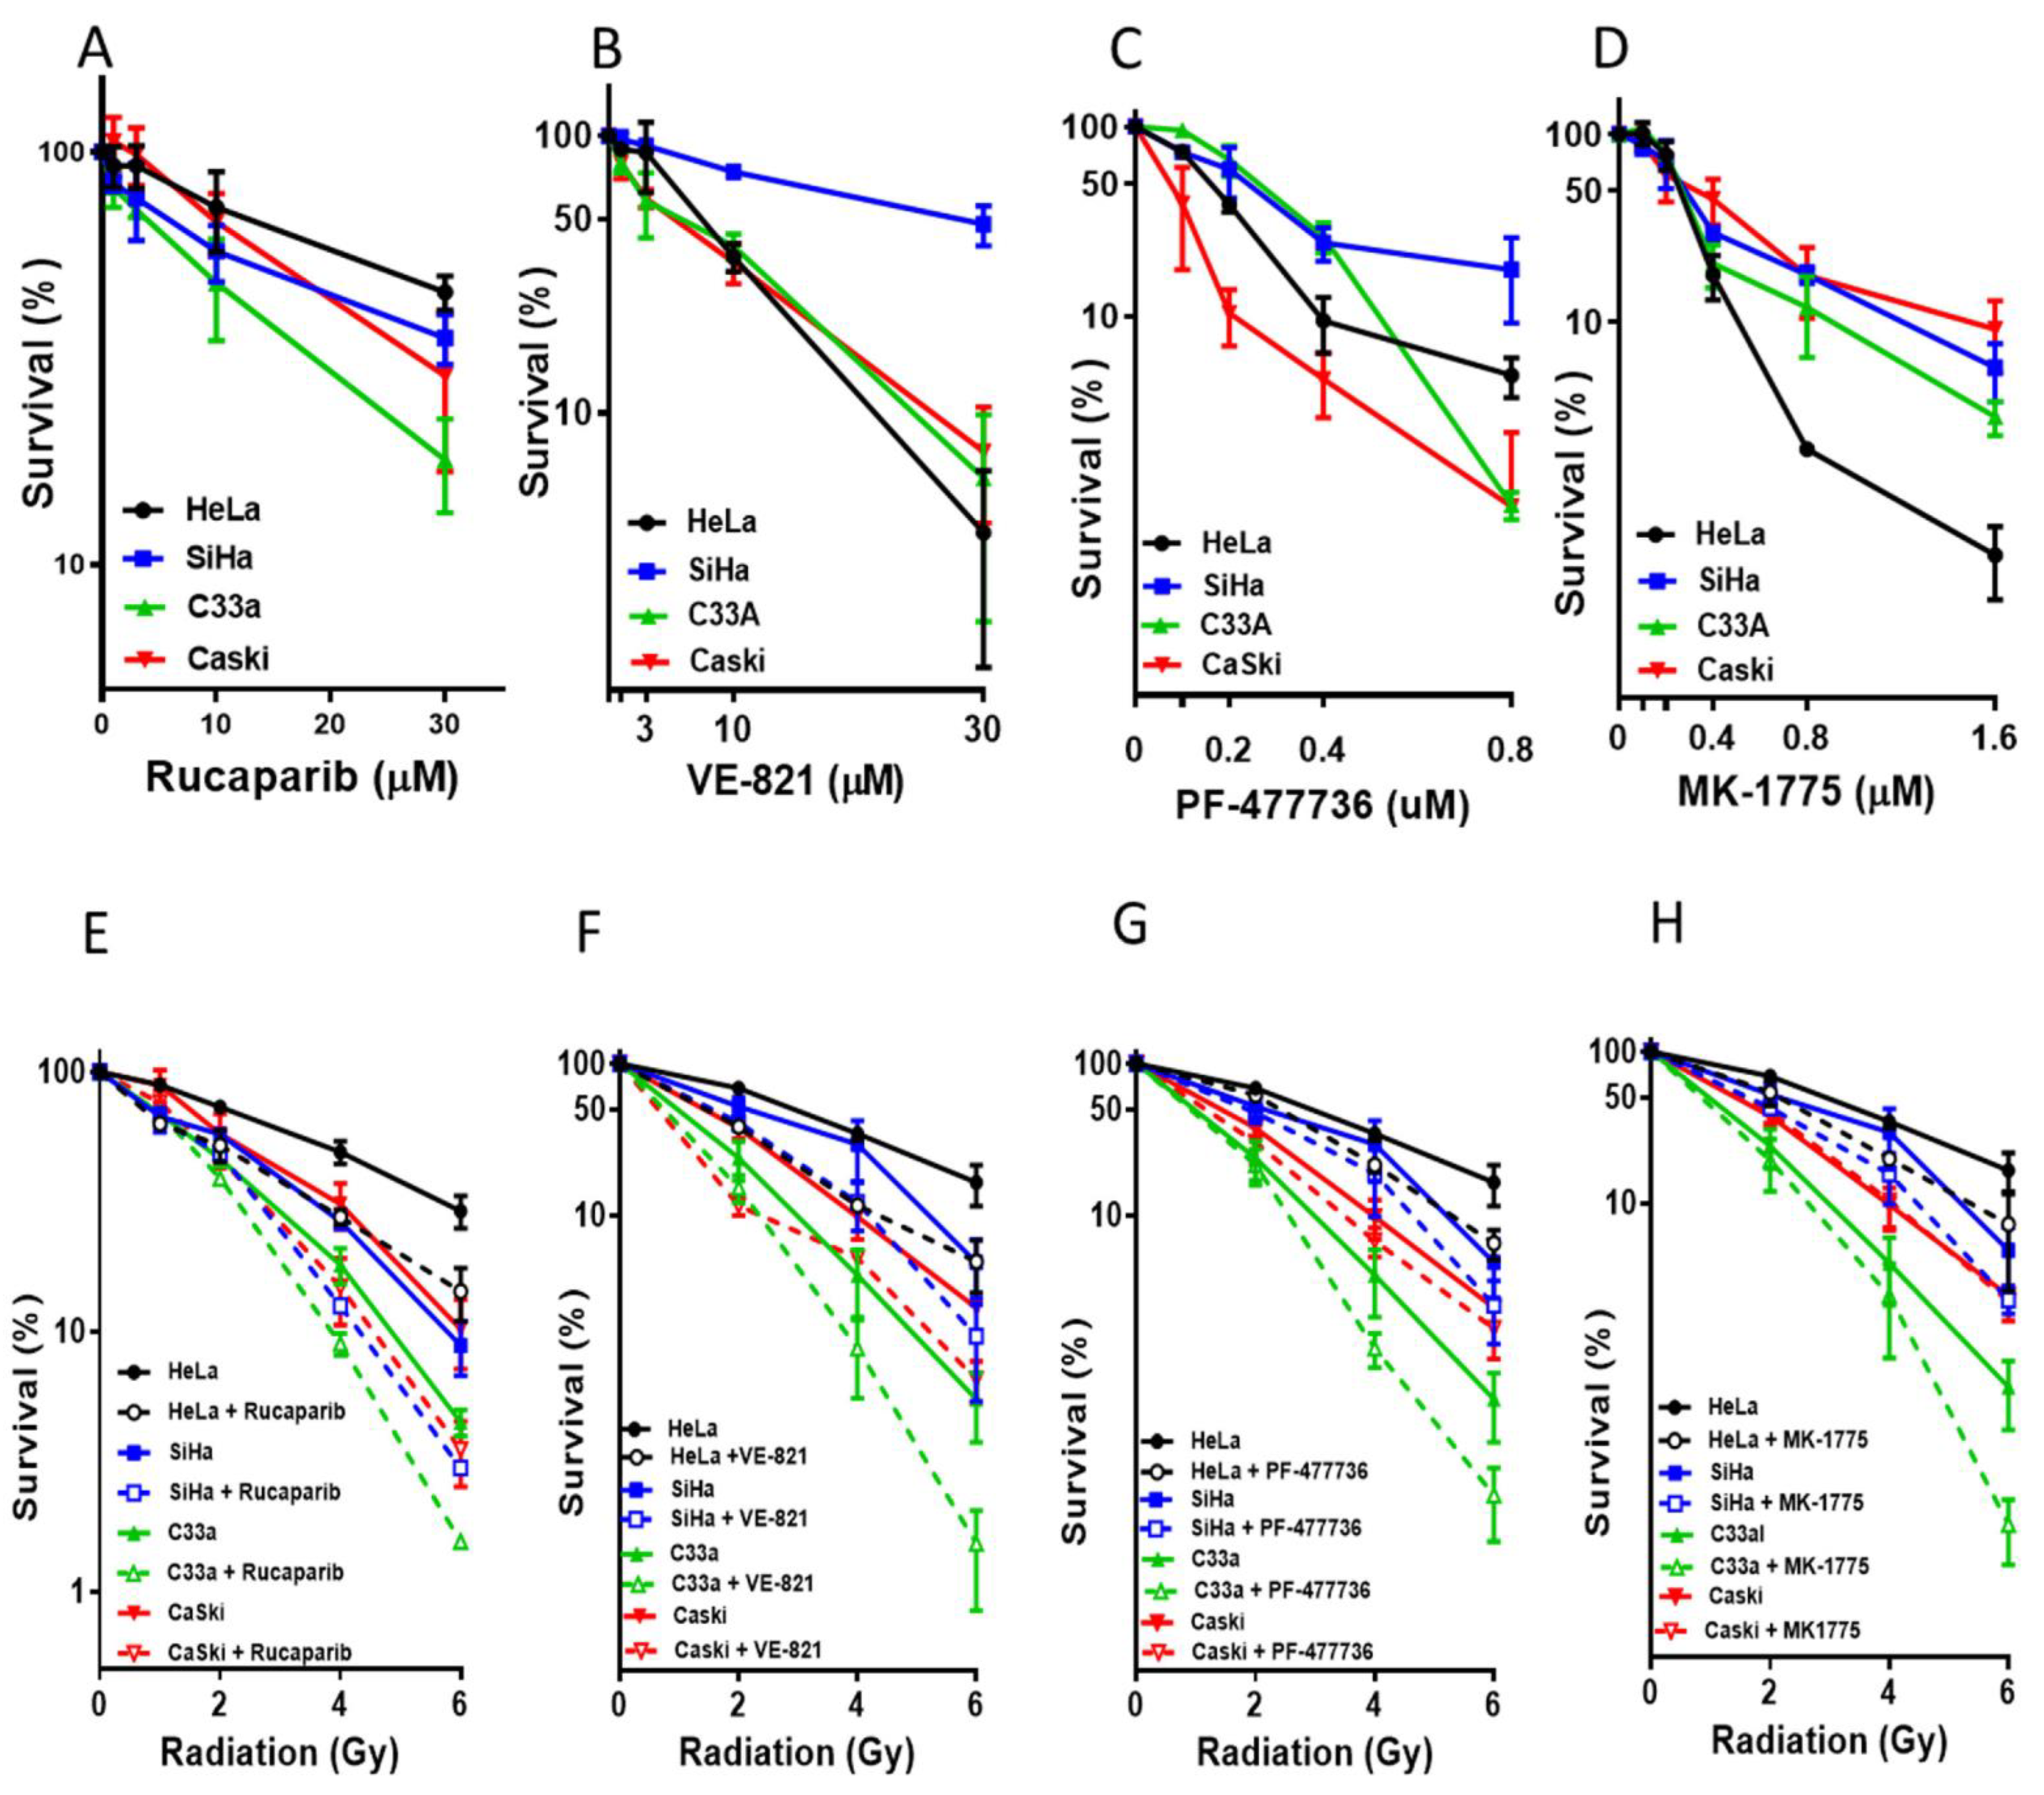
3.2. Single Agent Cytotoxicity, Chemo and Radiosensitisation
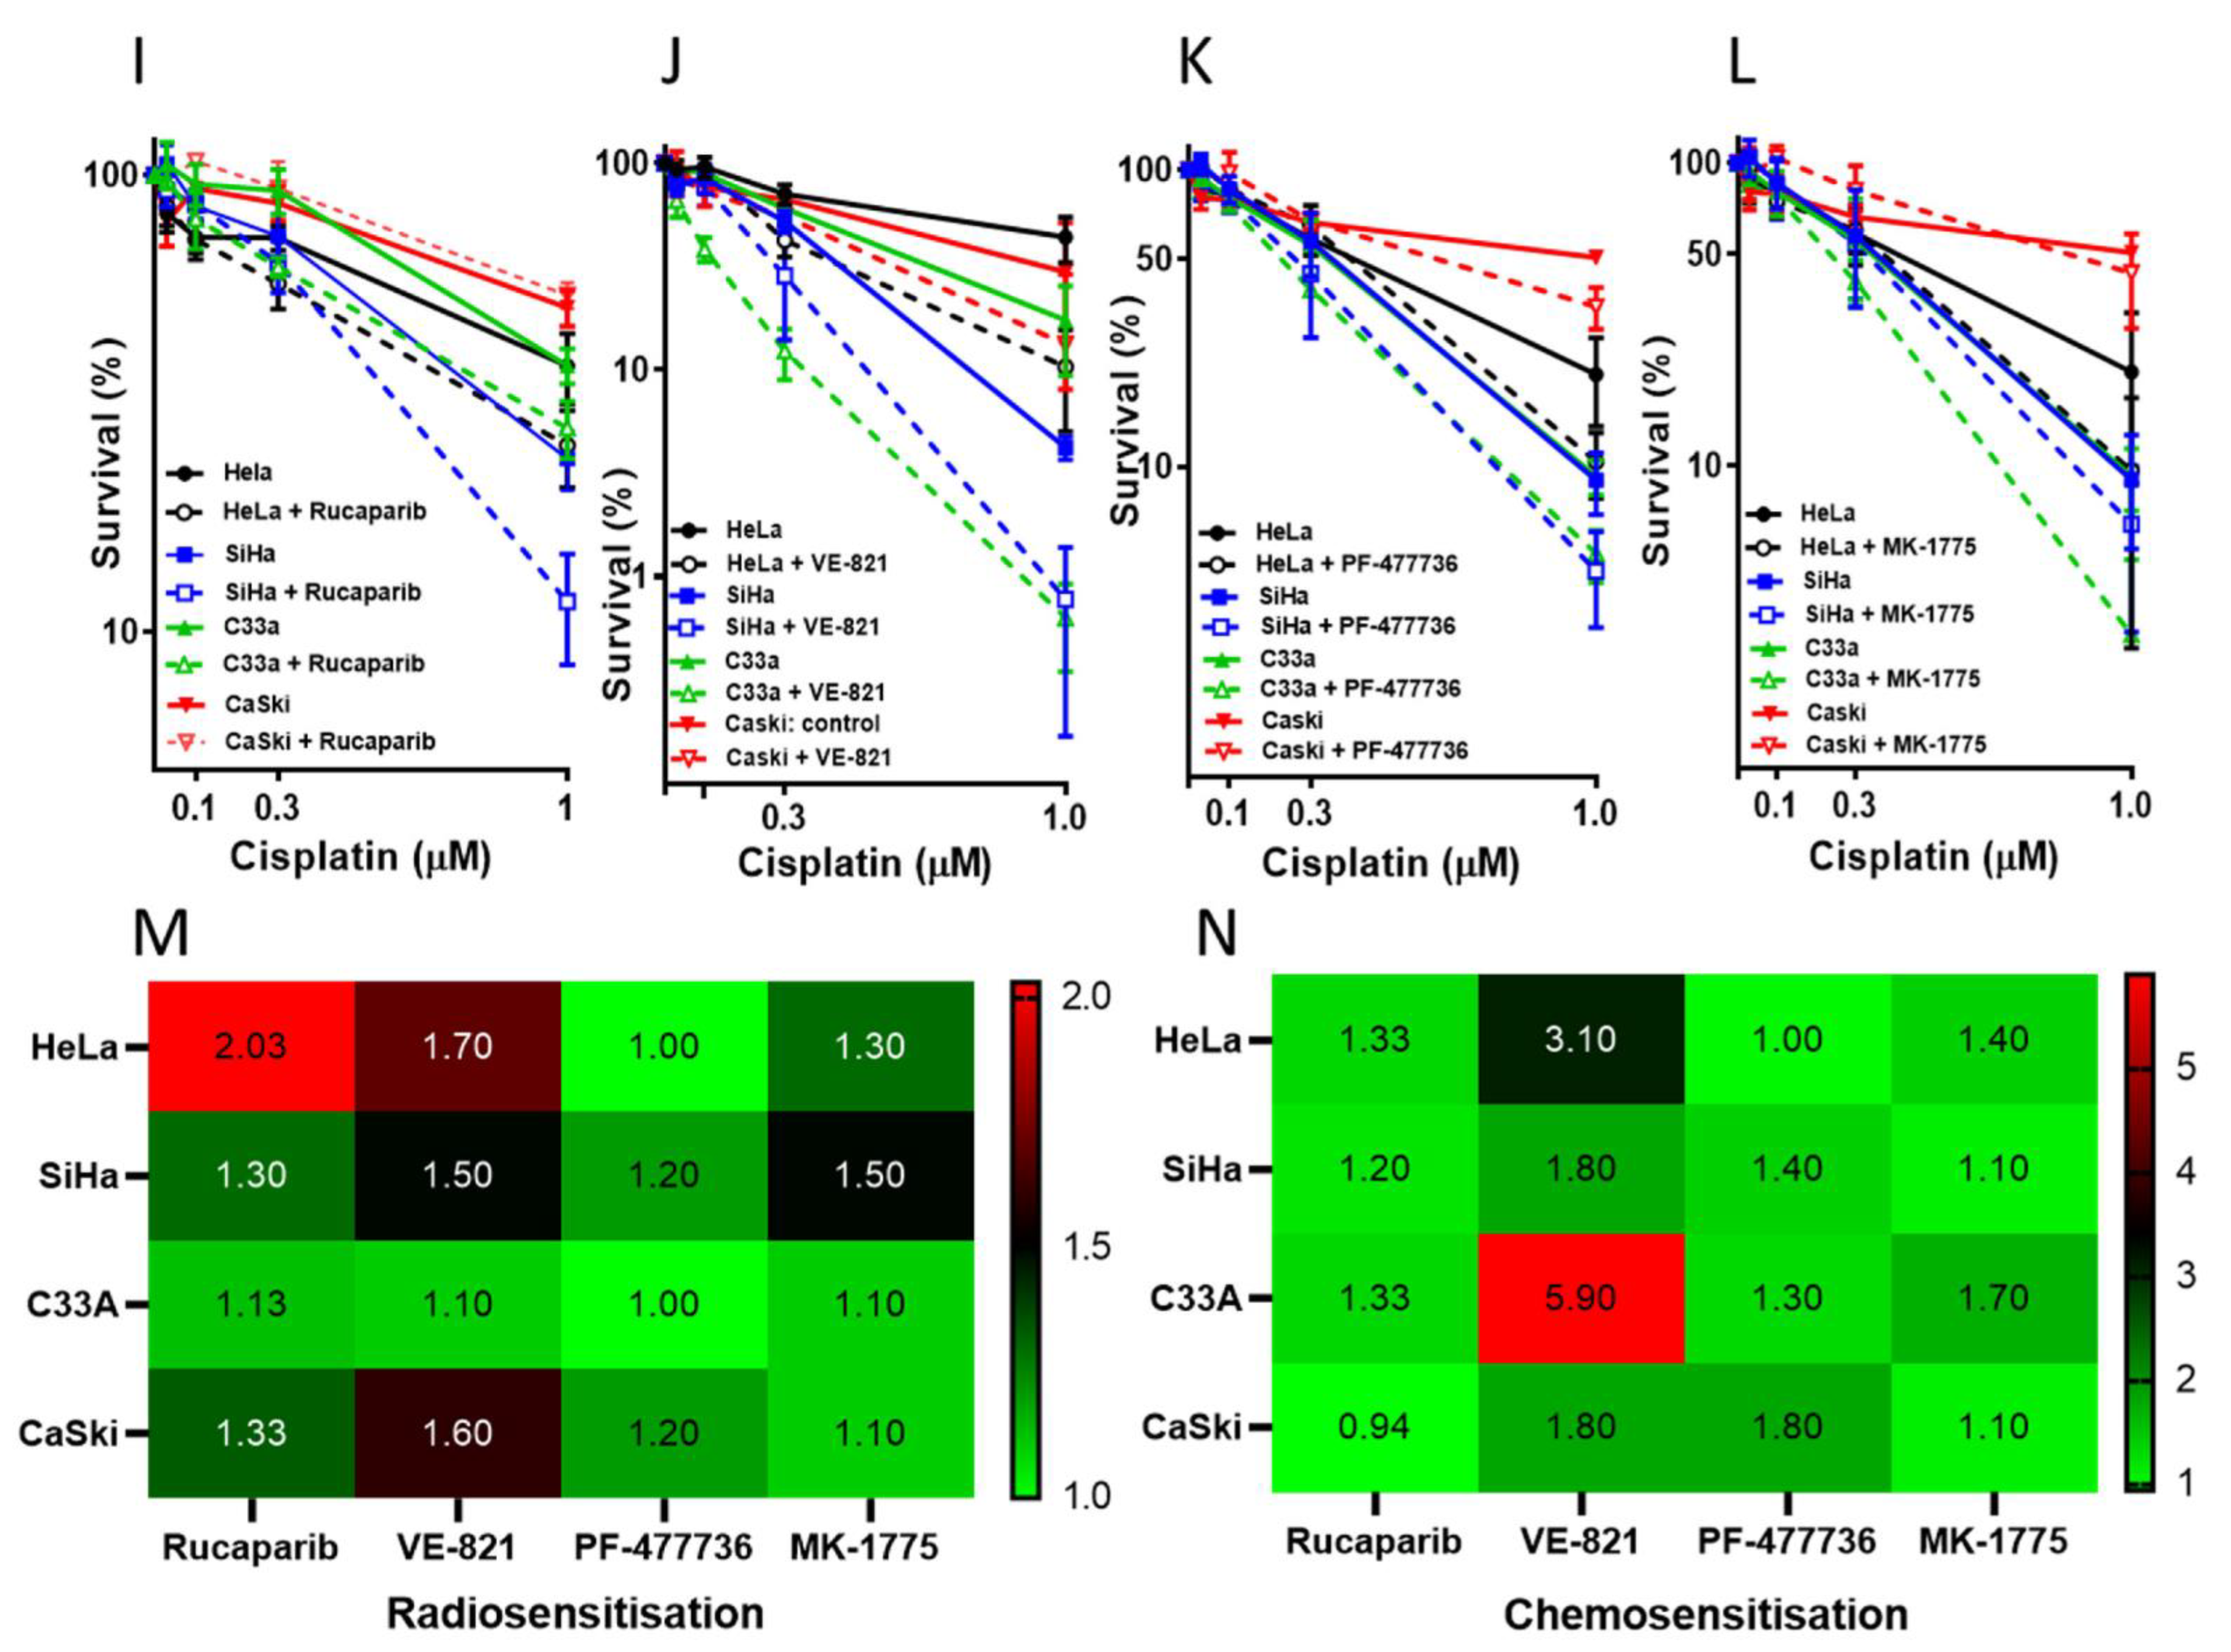
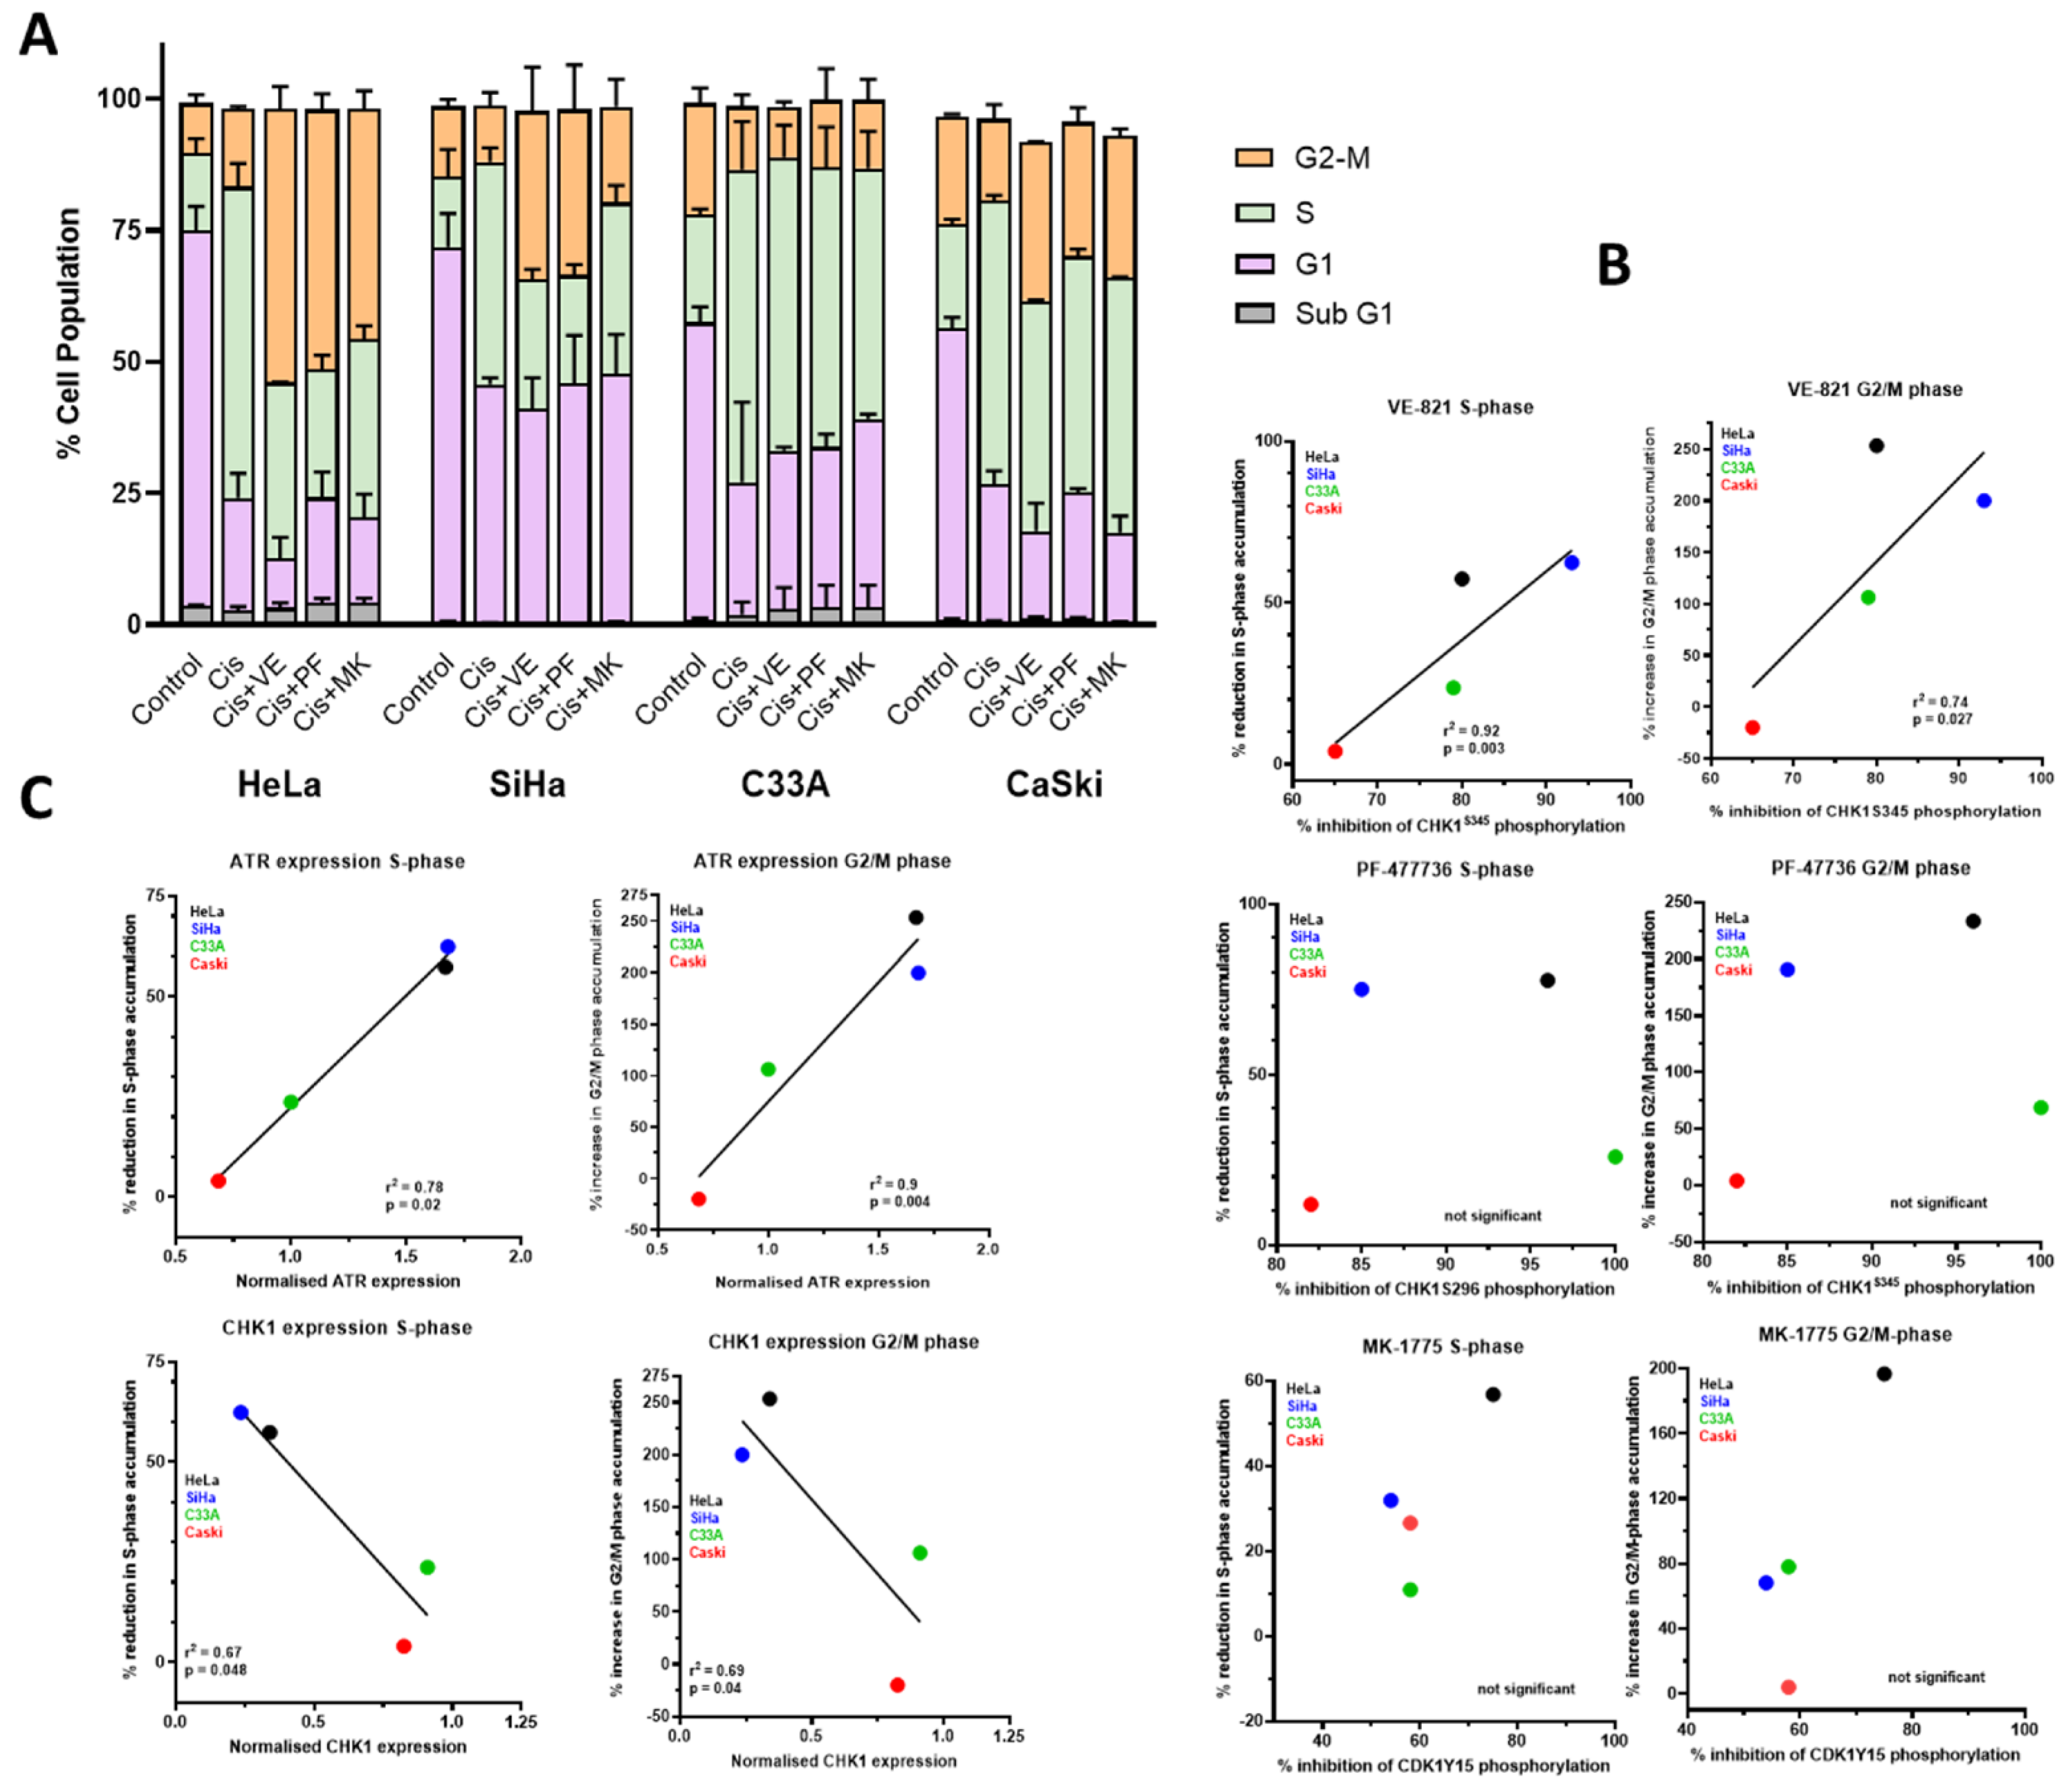
3.3. DNA Damage Induced Cell Cycle Effects and Impact of ATR, CHK1 and WEE1 Inhibitors
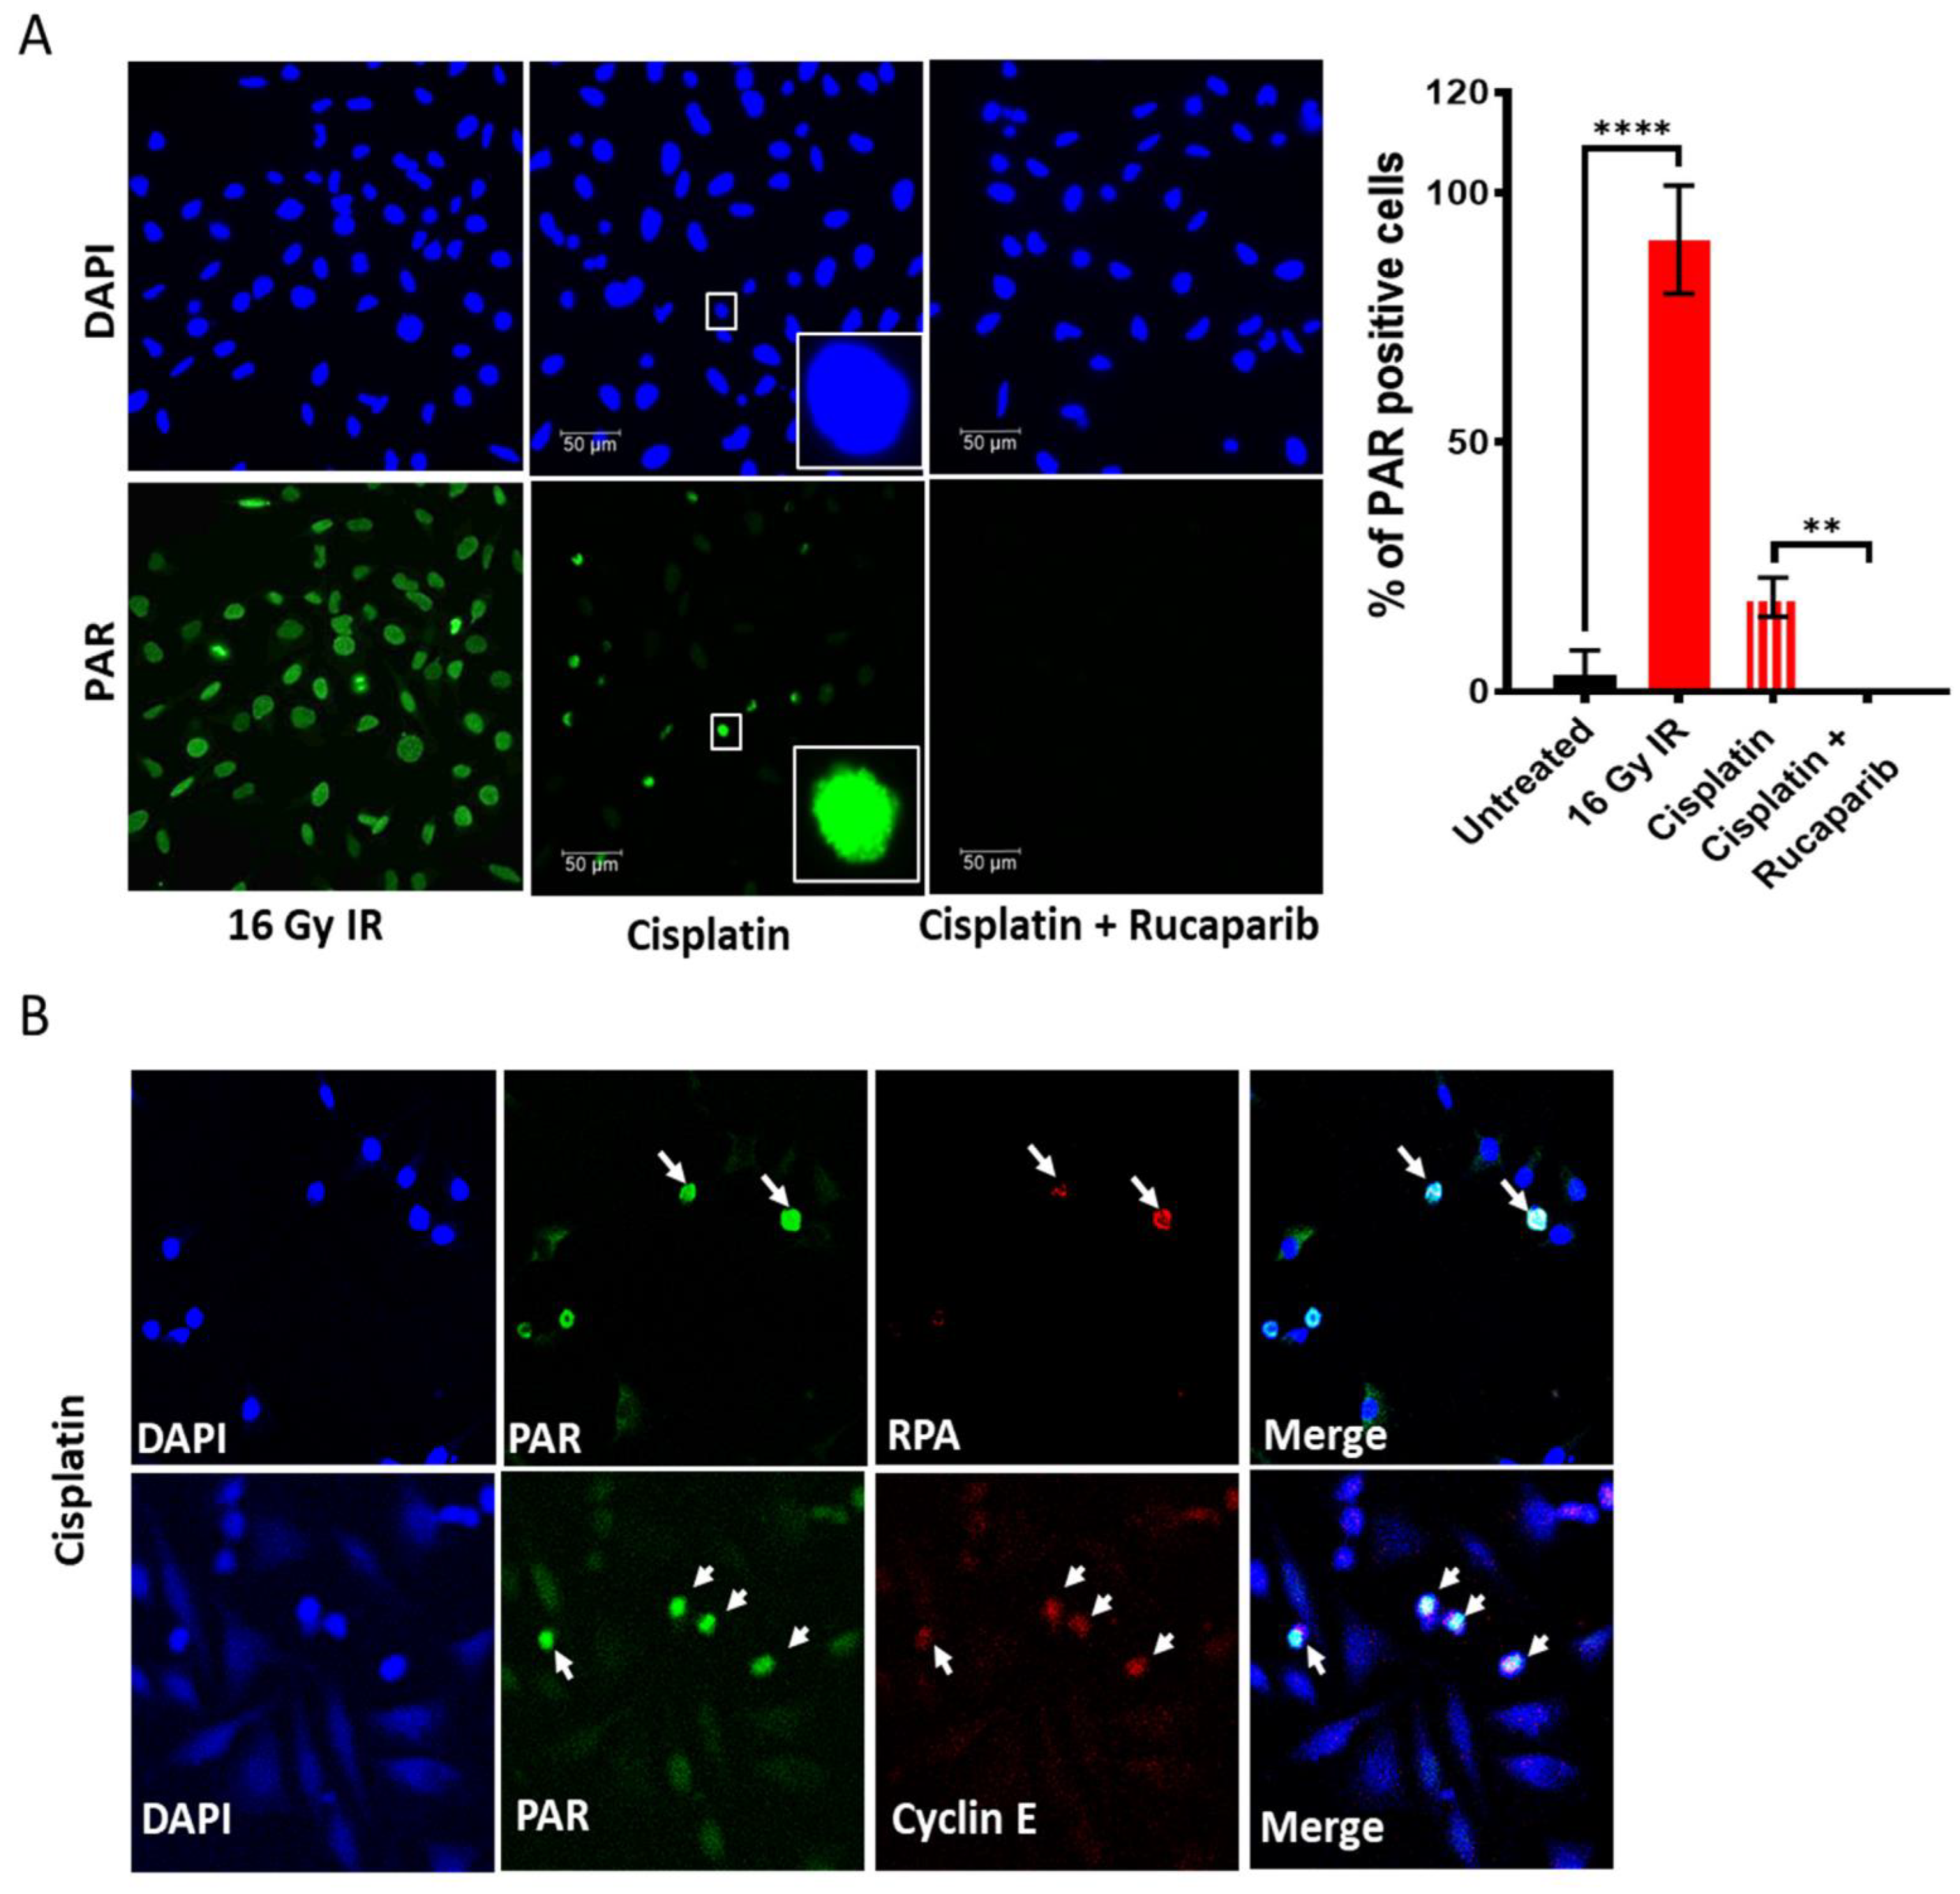
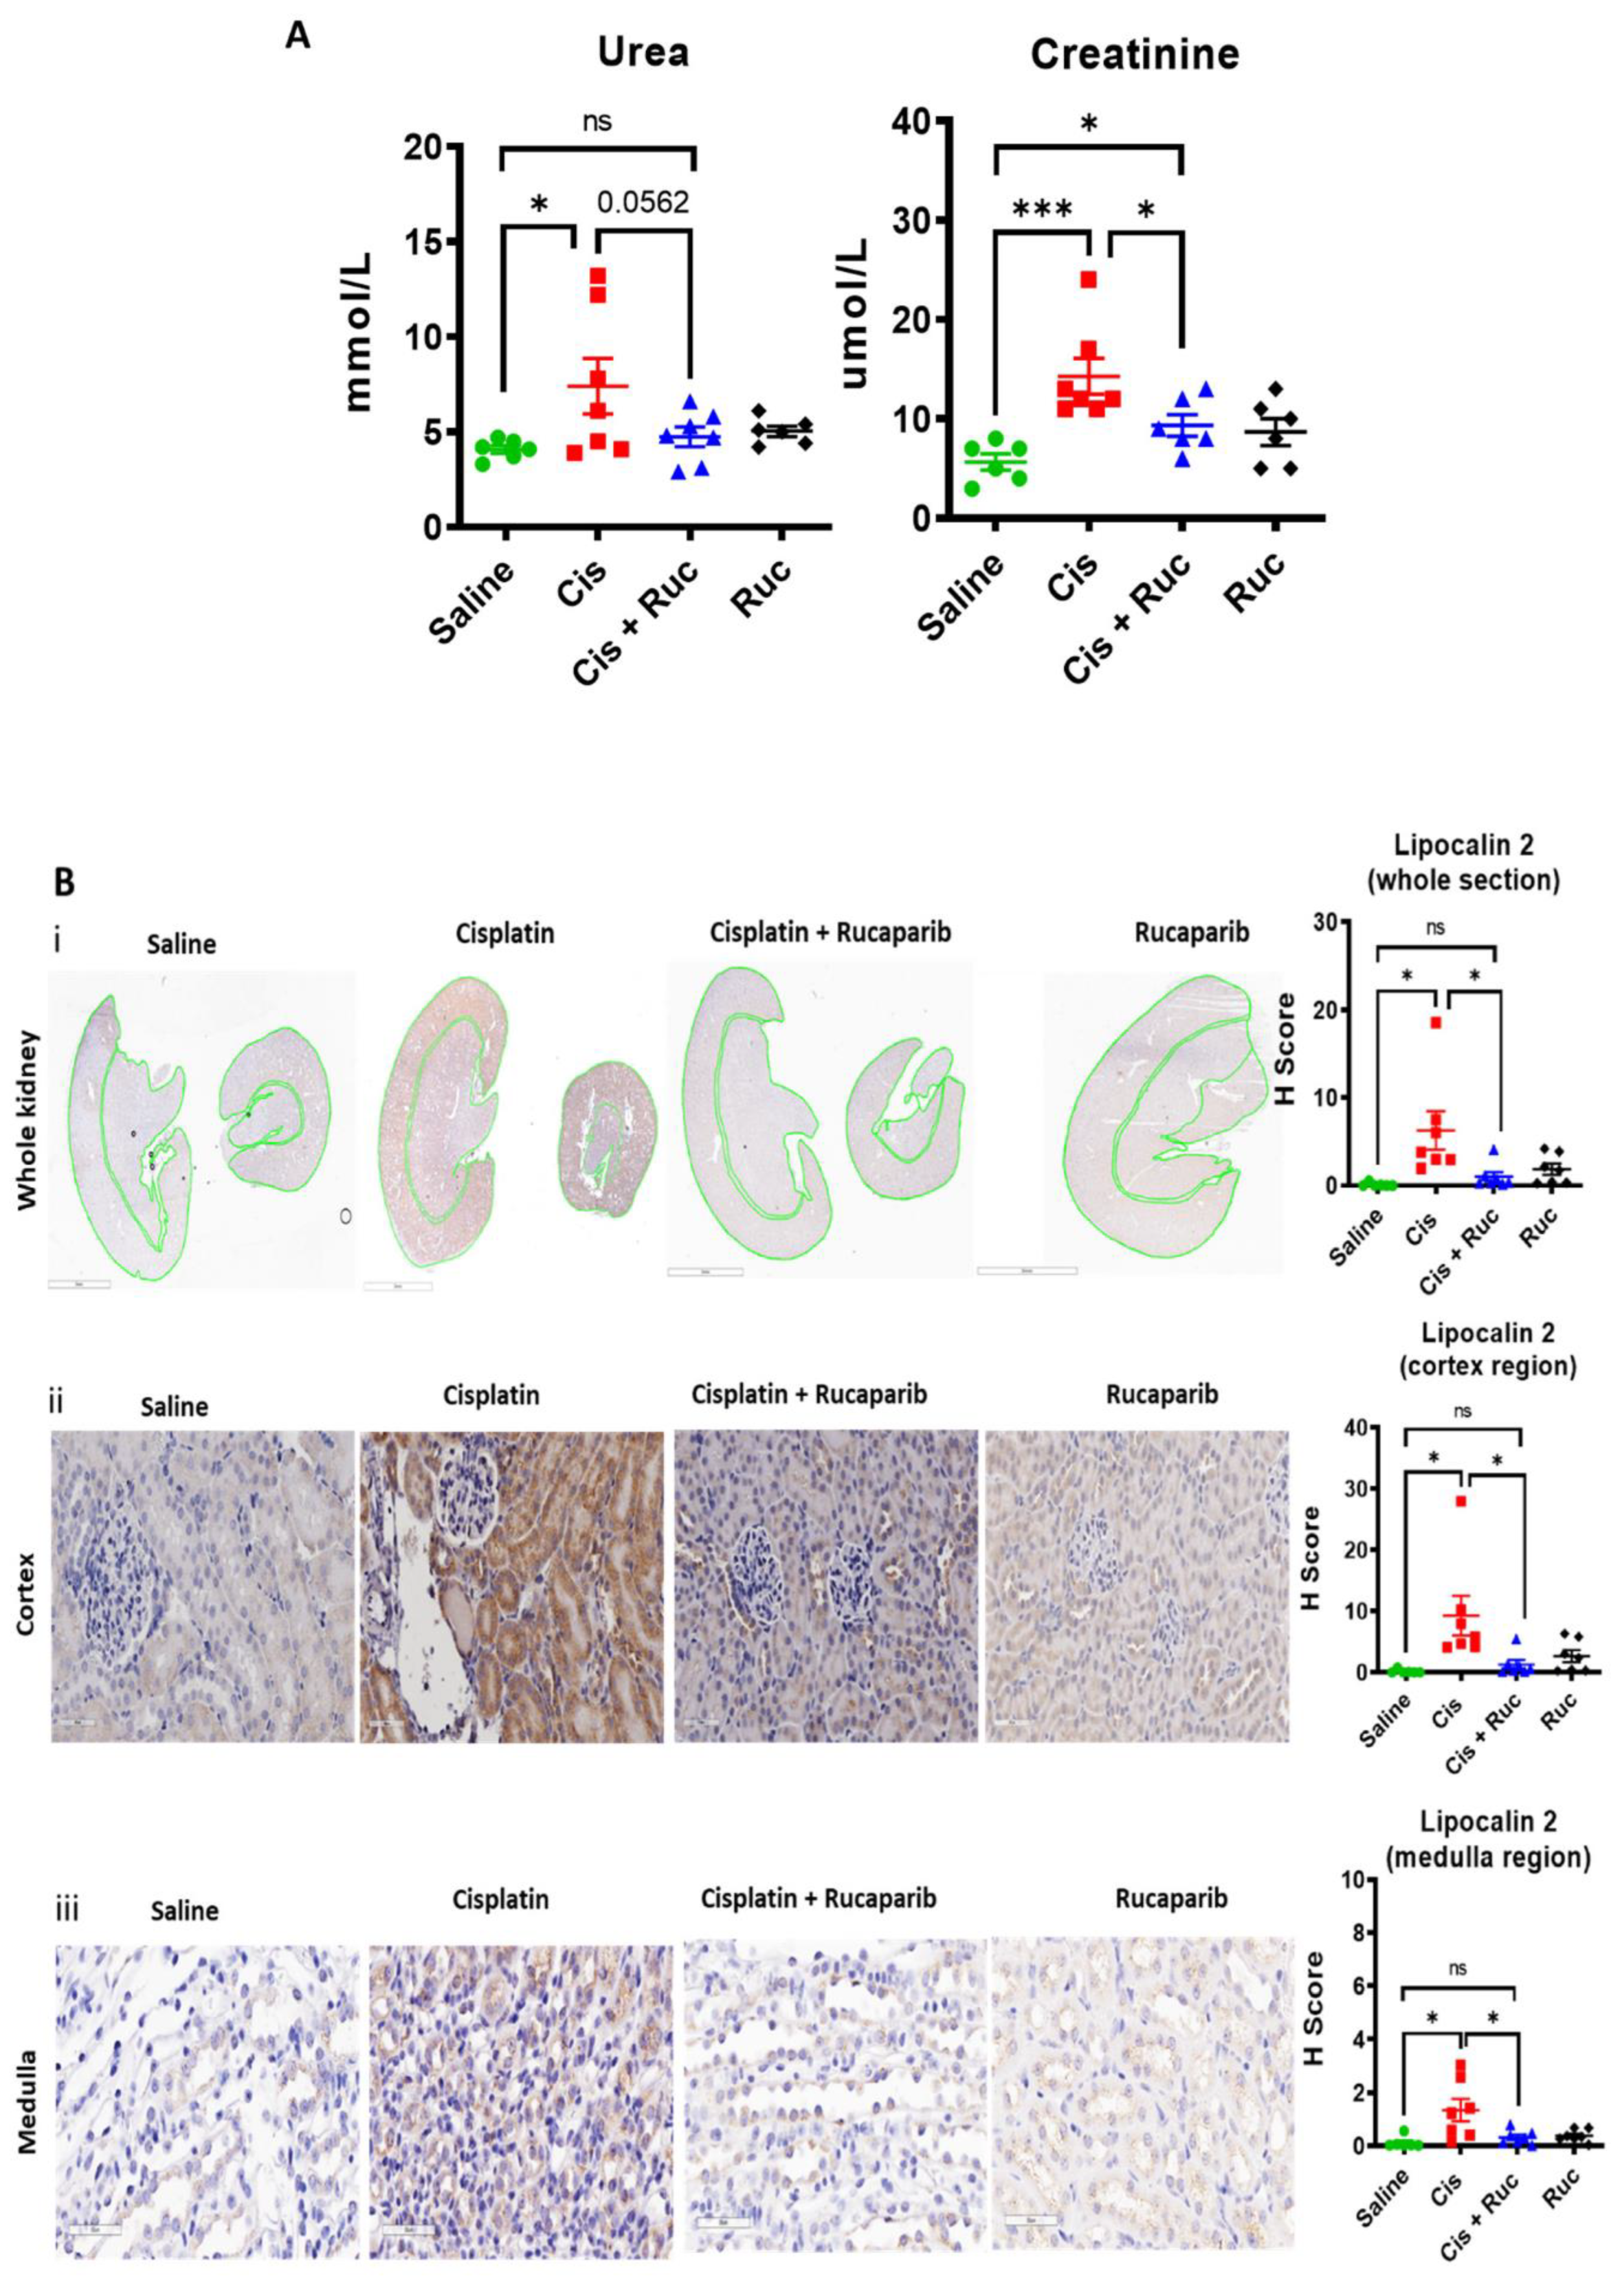
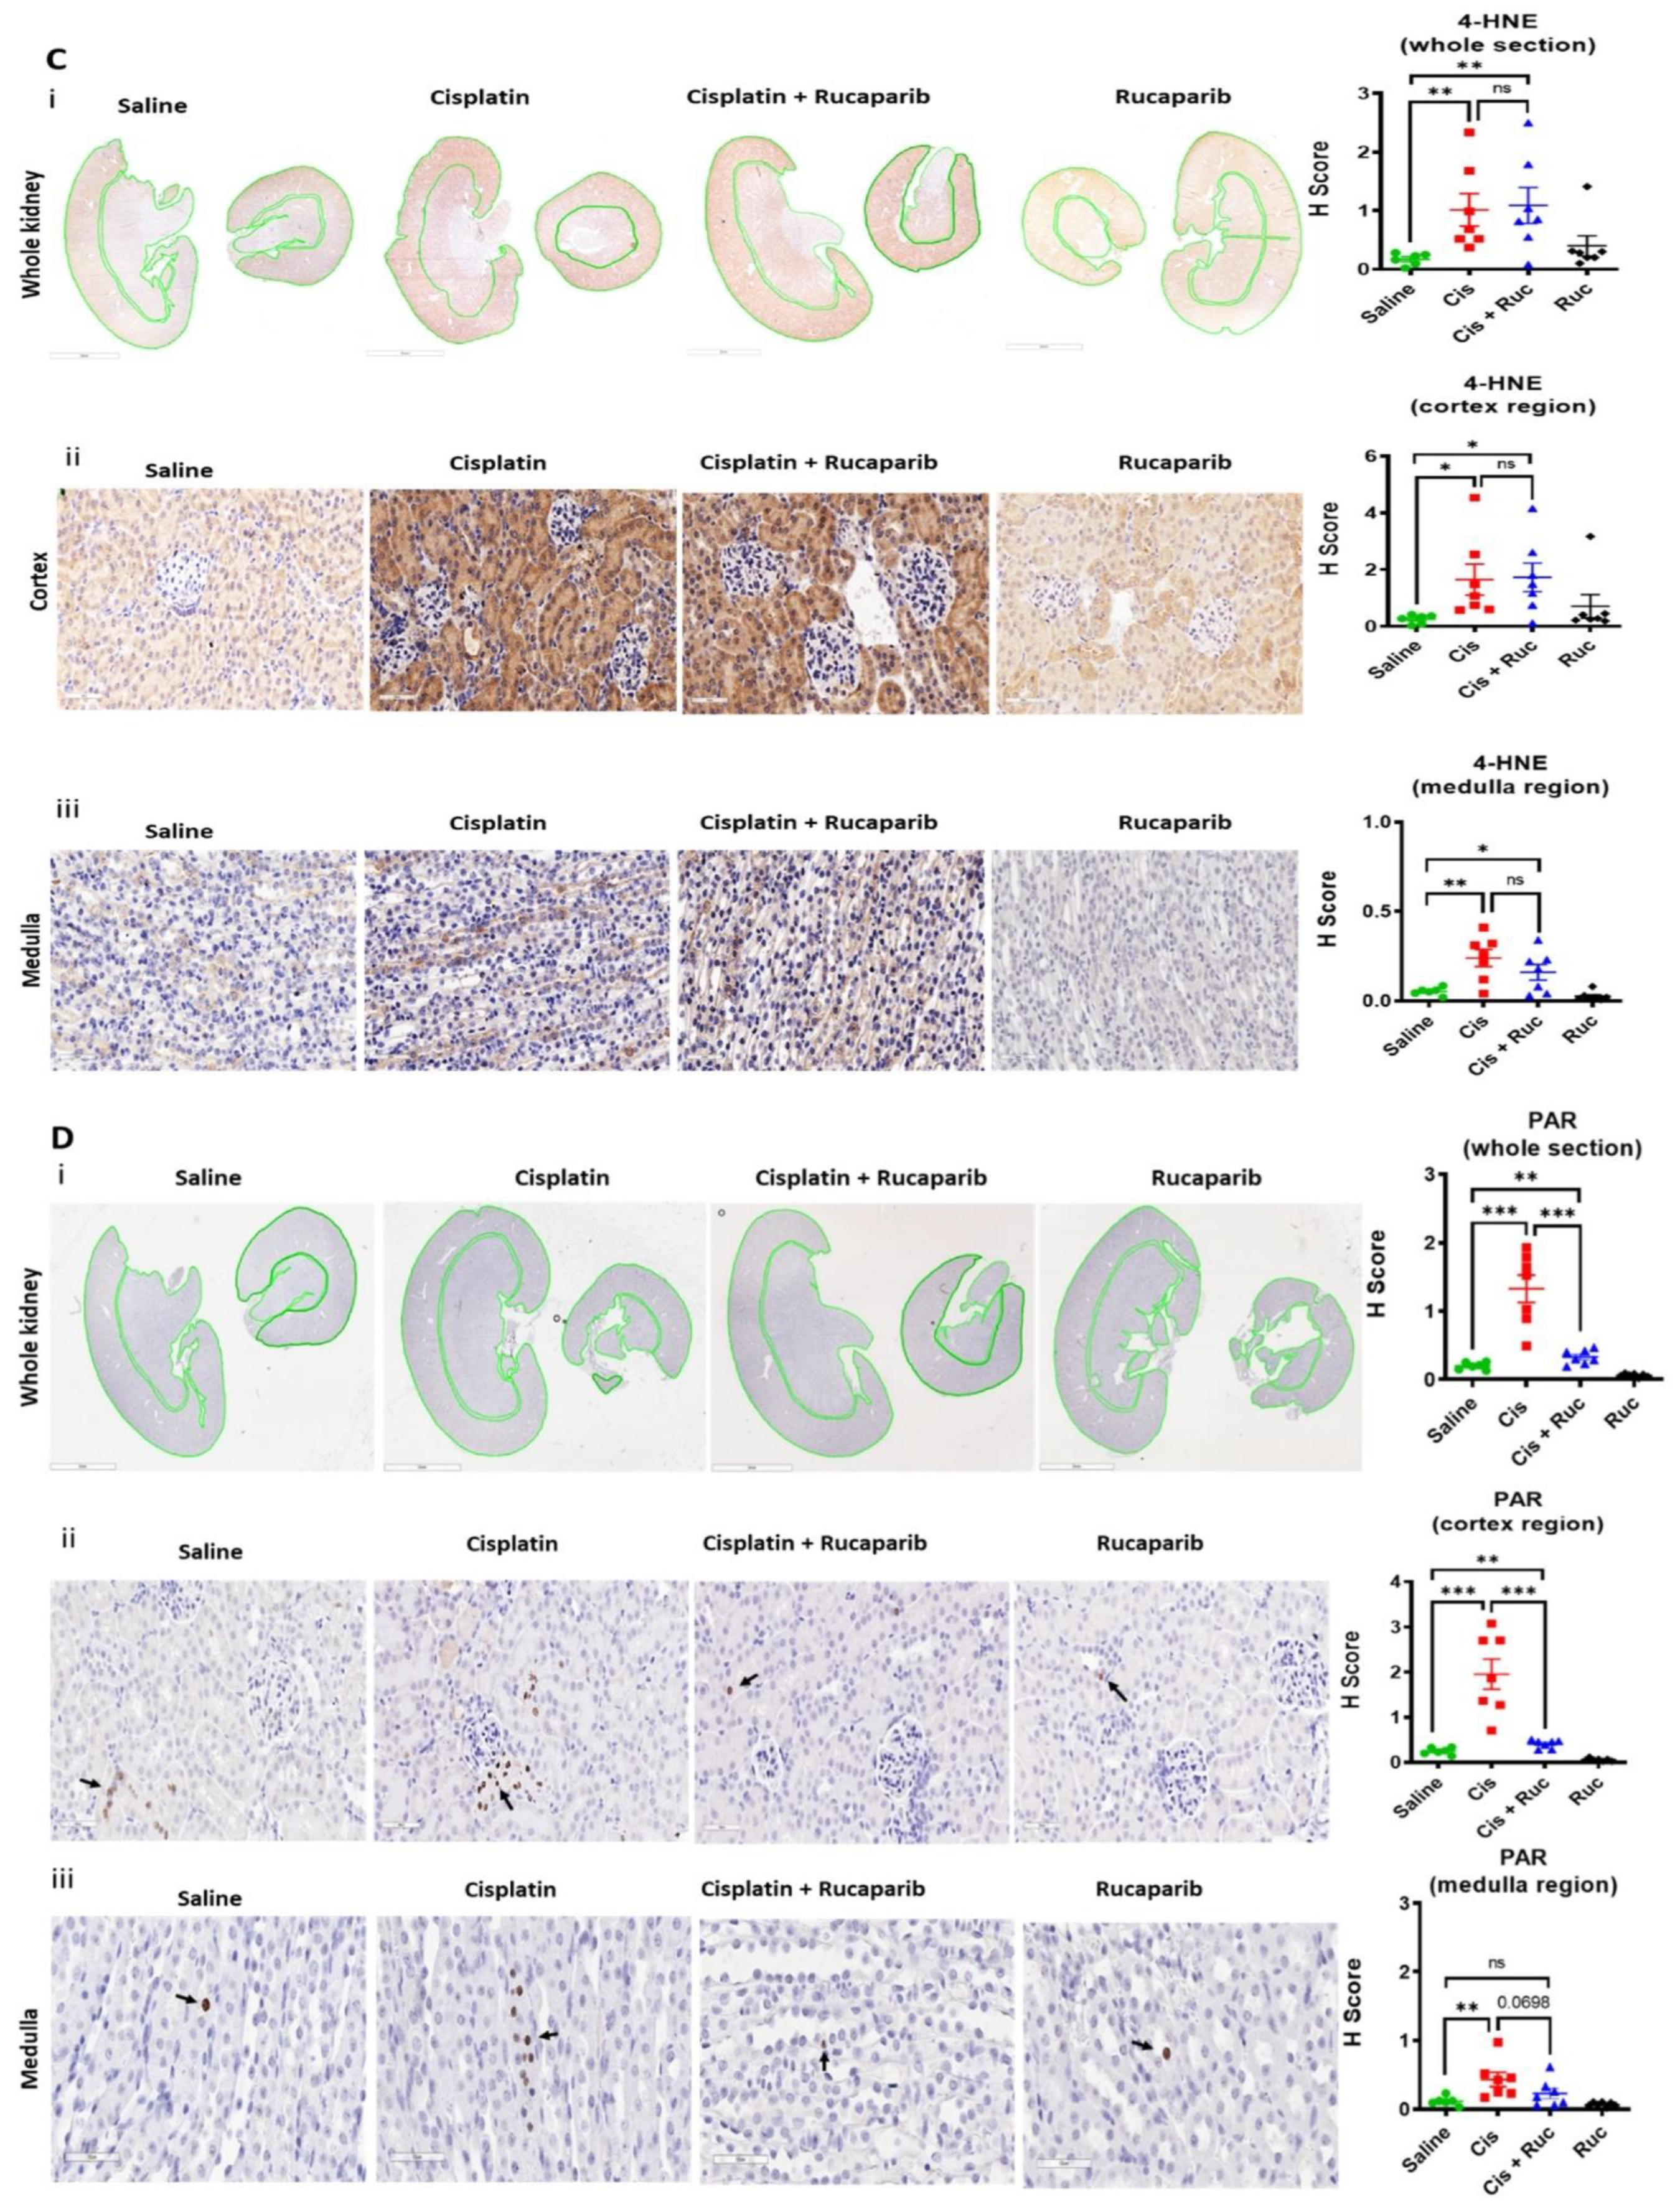
3.4. Amelioration of Cisplatin-Induced Kidney Injury by Rucaparib
4. Discussion
5. Conclusions
Supplementary Materials
Author Contributions
Funding
Institutional Review Board Statement
Informed Consent Statement
Data Availability Statement
Acknowledgments
Conflicts of Interest
References
- Sung, H.; Ferlay, J.; Siegel, R.L.; Laversanne, M.; Soerjomataram, I.; Jemal, A.; Bray, F. Global Cancer Statistics 2020: GLOBOCAN Estimates of Incidence and Mortality Worldwide for 36 Cancers in 185 Countries. CA Cancer J. Clin. 2021, 71, 209–249. [Google Scholar] [CrossRef] [PubMed]
- Cervical Cancer Statistics. Available online: https://www.cancerresearchuk.org/health-professional/cancer-statistics/statistics-by-cancer-type/cervical-cancer (accessed on 25 July 2022).
- Marth, C.; Landoni, F.; Mahner, S.; McCormack, M.; Gonzalez-Martin, A.; Colombo, N.; ESMO Guidelines Committee. Cervical cancer: ESMO Clinical Practice Guidelines for diagnosis, treatment and follow-up. Ann. Oncol. 2017, 28, iv72–iv83. [Google Scholar] [CrossRef] [PubMed]
- Boussios, S.; Seraj, E.; Zarkavelis, G.; Petrakis, D.; Kollas, A.; Kafantari, A.; Assi, A.; Tatsi, K.; Pavlidis, N.; Pentheroudakis, G. Management of patients with recurrent/advanced cervical cancer beyond first line platinum regimens: Where do we stand? A literature review. Crit. Rev. Oncol. 2016, 108, 164–174. [Google Scholar] [CrossRef]
- Basu, A.; Krishnamurthy, S. Cellular Responses to Cisplatin-Induced DNA Damage. J. Nucleic Acids 2010, 2010, 201367. [Google Scholar] [CrossRef] [PubMed]
- Lomax, M.E.; Folkes, L.K.; O’Neill, P. Biological consequences of radiation-induced DNA damage: Relevance to radiotherapy. Clin. Oncol. 2013, 25, 578–585. [Google Scholar] [CrossRef]
- Deans, A.J.; West, S.C. DNA interstrand crosslink repair and cancer. Nat. Rev. Cancer 2011, 11, 467–480. [Google Scholar] [CrossRef]
- Banerjee, N.S.; Moore, D.; Parker, C.J.; Broker, T.R.; Chow, L.T. Targeting DNA Damage Response as a Strategy to Treat HPV Infections. Int. J. Mol. Sci. 2019, 20, 5455. [Google Scholar] [CrossRef]
- Mitchell, J.; Smith, G.C.; Curtin, N.J. Poly(ADP-Ribose) Polymerase-1 and DNA-Dependent Protein Kinase Have Equivalent Roles in Double Strand Break Repair Following Ionizing Radiation. Int. J. Radiat. Oncol. Biol. Phys. 2009, 75, 1520–1527. [Google Scholar] [CrossRef]
- Smith, H.L.; Southgate, H.; Tweddle, D.A.; Curtin, N.J. DNA damage checkpoint kinases in cancer. Expert Rev. Mol. Med. 2020, 22, e2. [Google Scholar] [CrossRef]
- Curtin, N.J.; Szabo, C. Poly(ADP-ribose) polymerase inhibition: Past, present and future. Nat. Rev. Drug. Discov. 2020, 10, 711–736. [Google Scholar] [CrossRef]
- Thaker, P.H.; Salani, R.; Brady, W.E.; Lankes, H.A.; Cohn, D.; Mutch, D.G.; Mannel, R.S.; Bell-McGuinn, K.M.; Di Silvestro, P.A.; Jelovac, D.; et al. A phase I trial of paclitaxel, cisplatin, and veliparib in the treatment of persistent or recurrent carcinoma of the cervix: An NRG Oncology Study (NCT#01281852). Ann. Oncol. 2016, 28, 505–511. [Google Scholar]
- Study of Niraparib with Radiotherapy for Treatment of Metastatic Invasive Carcinoma of the Cervix (NIVIX). Available online: https://clinicaltrials.gov/ct2/show/NCT03644342 (accessed on 25 July 2022).
- Manohar, S.; Leung, N. Cisplatin nephrotoxicity: A review of the literature. J. Nephrol. 2017, 31, 15–25. [Google Scholar] [CrossRef] [PubMed]
- McSweeney, K.R.; Gadanec, L.K.; Qaradakhi, T.; Ali, B.A.; Zulli, A.; Apostolopoulos, V. Mechanisms of Cisplatin-Induced Acute Kidney Injury: Pathological Mechanisms, Pharmacological Interventions, and Genetic Mitigations. Cancers 2021, 13, 1572. [Google Scholar] [CrossRef] [PubMed]
- Mukhopadhyay, P.; Horváth, B.; Kechrid, M.; Tanchian, G.; Rajesh, M.; Naura, A.S.; Boulares, A.H.; Pacher, P. Poly(ADP-ribose) polymerase-1 is a key mediator of cisplatin-induced kidney inflammation and injury. Free Radic. Biol. Med. 2011, 51, 1774–1788. [Google Scholar] [CrossRef] [PubMed]
- Racz, I.; Tory, K.; Gallyas, F., Jr.; Berente, Z.; Osz, E.; Jaszlits, L.; Bernath, S.; Sumegi, B.; Rabloczky, G.; Literati-Nagy, P. BGP-15—A novel poly(ADP-ribose) polymerase inhibitor—Protects against nephrotoxicity of cisplatin without compromising its antitumor activity. Biochem. Pharmacol. 2002, 63, 1099–1111. [Google Scholar] [CrossRef]
- Ali, M.; Kamjoo, M.; Thomas, H.D.; Kyle, S.; Pavlovska, I.; Babur, M.; Telfer, B.A.; Curtin, N.J.; Williams, K.J. The Clinically Active PARP Inhibitor AG014699 Ameliorates Cardiotoxicity but Does Not Enhance the Efficacy of Doxorubicin, despite Improving Tumor Perfusion and Radiation Response in Mice. Mol. Cancer Ther. 2011, 10, 2320–2329. [Google Scholar] [CrossRef]
- ATr Inhibitor in Combination with Olaparib in Gynaecological Cancers with ARId1A Loss or No Loss (ATARI). Available online: https://clinicaltrials.gov/ct2/show/NCT04065269 (accessed on 25 July 2022).
- Testing AZD1775 in C Combination with Radiotherapy and Chemotherapy in Cervical, Upper Vaginal and Uterine Cancers. Available online: https://www.clinicaltrials.gov/ct2/show/NCT03345784 (accessed on 25 July 2022).
- Rundle, S.; Bradbury, A.; Drew, Y.; Curtin, N.J. Targeting the ATR-CHK1 Axis in Cancer Therapy. Cancers 2017, 9, 41. [Google Scholar] [CrossRef]
- Kwok, M.; Davies, N.; Agathanggelou, A.; Smith, E.; Oldreive, C.; Petermann, E.; Stewart, G.; Brown, J.; Lau, A.; Pratt, G.; et al. ATR inhibition induces synthetic lethality and overcomes chemoresistance in TP53- or ATM-defective chronic lymphocytic leukemia cells. Blood 2016, 127, 582–595. [Google Scholar] [CrossRef]
- Southgate, H.E.D.; Chen, L.; Tweddle, D.A.; Curtin, N.J. ATR Inhibition Potentiates PARP Inhibitor Cytotoxicity in High Risk Neuroblastoma Cell Lines by Multiple Mechanisms. Cancers 2020, 12, 1095. [Google Scholar] [CrossRef]
- A Study of ART0380 for the Treatment of Advanced or Metastatic Solid Tumors. Available online: https://clinicaltrials.gov/ct2/show/NCT04657068 (accessed on 25 July 2022).
- Phase II Trial of AZD6738 Alone and in Combination with Olaparib. Available online: https://clinicaltrials.gov/ct2/show/NCT03682289 (accessed on 25 July 2022).
- First-in-Human Study of ATR Inhibitor BAY1895344 in Patients with Advanced Solid Tumors and Lymphomas. Available online: https://clinicaltrials.gov/ct2/show/NCT03188965 (accessed on 25 July 2022).
- Study to Test How Well Patients With Advanced Solid Tumors Respond to Treatment With the Elimusertib in Combination With Pembrolizumab, to Find the Optimal Dose for Patients, How the Drug Is Tolerated and the Way the Body Absorbs, Distributes and Discharges the Drug. Available online: https://clinicaltrials.gov/ct2/show/NCT04095273 (accessed on 25 July 2022).
- M1774 in Participants with Metastatic or Locally Advanced Unresectable Solid Tumors (DDRiver Solid Tumors 301). Available online: https://clinicaltrials.gov/ct2/show/NCT04170153 (accessed on 25 July 2022).
- Middleton, F.K.; Patterson, M.J.; Elstob, C.J.; Fordham, S.; Herriott, A.; Wade, M.A.; McCormick, A.; Edmondson, R.; May, F.E.; Allan, J.M.; et al. Common cancer-associated imbalances in the DNA damage response confer sensitivity to single agent ATR inhibition. Oncotarget 2015, 6, 32396–32409. [Google Scholar] [CrossRef]
- Zaremba, T.; Thomas, H.D.; Cole, M.; Coulthard, S.A.; Plummer, E.R.; Curtin, N.J. Poly(ADP-ribose) polymerase-1 (PARP-1) pharmacogenetics, activity and expression analysis in cancer patients and healthy volunteers. Biochem. J. 2011, 436, 671–679. [Google Scholar] [CrossRef] [PubMed] [Green Version]
- Middleton, F.K.; Pollard, J.R.; Curtin, N.J. The Impact of p53 Dysfunction in ATR Inhibitor Cytotoxicity and Chemo- and Radiosensitisation. Cancers 2018, 10, 275. [Google Scholar] [CrossRef]
- Curtin, N.J.; Szabo, C. Therapeutic applications of PARP inhibitors: Anticancer therapy and beyond. Mol. Asp. Med. 2013, 34, 1217–1256. [Google Scholar] [CrossRef] [PubMed]
- Evers, B.; Drost, R.; Schut, E.; de Bruin, M.; van der Burg, E.; Derksen, P.W.; Holstege, H.; Liu, X.; van Drunen, E.; Beverloo, H.B.; et al. Selective Inhibition of BRCA2-Deficient Mammary Tumor Cell Growth by AZD2281 and Cisplatin. Clin. Cancer Res. 2008, 14, 3916–3925. [Google Scholar] [CrossRef] [PubMed]
- Smith, H.L. Probing Mechanisms of Synergy Between PARP Inhibitors and Inhibitors of ATR, CHK1 and WEE1 in Gynaecological Cancers. Ph.D. Thesis, Newcastle University Centre for Cancer Research, Faculty of Medical Sciences, Newcastle University, Newcastle upon Tyne, UK, October 2021. [Google Scholar]
- Kelland, L.R. Of mice and men: Values and liabilities of the athymic nude mouse model in anticancer drug development. Eur. J. Cancer 2004, 40, 827–836. [Google Scholar] [CrossRef]
- Foote, K.M.; Blades, K.; Cronin, A.; Fillery, S.; Guichard, S.S.; Hassall, L.; Hickson, I.; Jacq, X.; Jewsbury, P.J.; McGuire, T.M.; et al. Discovery of 4-{4-[(3R)-3-Methylmorpholin-4-yl]-6-[1-(methylsulfonyl)cyclopropyl]pyrimidin-2-yl}-1H-indole (AZ20): A potent and selective inhibitor of ATR protein kinase with monotherapy in vivo antitumor activity. J. Med. Chem. 2013, 56, 2125–2138. [Google Scholar] [CrossRef]
- Fokas, E.; Prevo, R.; Pollard, J.R.; Reaper, P.M.; Charlton, P.A.; Cornelissen, B.; Vallis, K.A.; Hammond, E.M.; Olcina, M.M.; Gillies McKenna, W.; et al. Targeting ATR in vivo using the novel inhibitor VE-822 results in selective sensitization of pancreatic tumors to radiation. Cell Death Dis. 2012, 3, e441. [Google Scholar] [CrossRef]
- Zabludoff, S.D.; Deng, C.; Grondine, M.R.; Sheehy, A.M.; Ashwell, S.; Caleb, B.L.; Green, S.; Haye, H.R.; Horn, C.L.; Janetka, J.W.; et al. AZD7762, a novel checkpoint kinase inhibitor, drives checkpoint abrogation and potentiates DNA-targeted therapies. Mol. Cancer Ther. 2008, 7, 2955–2966. [Google Scholar] [CrossRef]
- Lee, Y.-Y.; Cho, Y.-J.; Shin, S.-W.; Choi, C.; Ryu, J.-Y.; Jeon, H.-K.; Choi, J.-J.; Hwang, J.R.; Choi, C.H.; Kim, T.-J.; et al. Anti-Tumor Effects of Wee1 Kinase Inhibitor with Radiotherapy in Human Cervical Cancer. Sci. Rep. 2019, 9, 15394. [Google Scholar] [CrossRef]
- Wieringa, H.W.; van der Zee, A.G.; de Vries, E.G.; van Vugt, M.A. Breaking the DNA damage response to improve cervical cancer treatment. Cancer Treat. Rev. 2016, 42, 30–40. [Google Scholar] [CrossRef]
- Rundle, S. Investigating the Therapeutic Potential of ATR, CHK1 and WEE1 Inhibitors in Cervical Cancer. Ph.D. Thesis, Newcastle University Centre for Cancer Research, Faculty of Medical Sciences, Newcastle University, Newcastle upon Tyne, UK, August 2019. [Google Scholar]
- Scott, C.L.; Mackay, H.J.; Haluska, P., Jr. Patient-Derived Xenograft Models in Gynecologic Malignancies. Am. Soc. Clin. Oncol. Educ. Book 2014, 34, e258–e266. [Google Scholar] [CrossRef] [PubMed] [Green Version]
- Chaudary, N.; Hedley, D.W.; Hill, R.P. Orthotopic Xenograft Model of Cervical Cancer for Studying Microenvironmental Effects on Metastasis Formation and Response to Drug Treatment. Curr. Protoc. Pharmacol. 2011, 53, 14–19. [Google Scholar] [CrossRef] [PubMed]
- McIntosh, D.P.; Cooke, R.J.; McLachlan, A.J.; Daley-Yates, P.T.; Rowland, M. Pharmacokinetics and Tissue Distribution of Cisplatin and Conjugates of Cisplatin with Carboxymethyldextran and A5B7 Monoclonal Antibody in CD1 Mice. J. Pharm. Sci. 1997, 86, 1478–1483. [Google Scholar] [CrossRef] [PubMed]
- Park, S.; Yoon, S.P.; Kim, J. Cisplatin induces primary necrosis through poly(ADP-ribose) polymerase 1 activation in kidney proximal tubular cells. Anat. Cell Biol. 2015, 48, 66–74. [Google Scholar] [CrossRef]
- Perše, M.; Večerić-Haler, Ž. Cisplatin-Induced Rodent Model of Kidney Injury: Characteristics and Challenges. BioMed Res. Int. 2018, 2018, 1462802. [Google Scholar] [CrossRef]
- Zhu, S.; Pabla, N.; Tang, C.; He, L.; Dong, Z. DNA damage response in cisplatin-induced nephrotoxicity. Arch. Toxicol. 2015, 89, 2197–2205. [Google Scholar] [CrossRef]
- Sims, J.L.; Berger, S.J.; Berger, N.A. Poly(ADP-ribose) polymerase inhibitors preserve oxidized nicotinamide adenine dinucleotide and adenosine 5’-triphosphate pools in DNA-damaged cells: Mechanism of stimulation of unscheduled DNA synthesis. Biochemistry 1983, 22, 5188–5194. [Google Scholar] [CrossRef]
- Fatokun, A.A.; Dawson, V.L.; Dawson, T.M. Parthanatos: Mitochondrial-linked mechanisms and therapeutic opportunities. Br. J. Pharmacol. 2014, 171, 2000–2016. [Google Scholar] [CrossRef]
- Plummer, R.; Jones, C.; Middleton, M.; Wilson, R.; Evans, J.; Olsen, A.; Curtin, N.; Boddy, A.; McHugh, P.; Newell, D.; et al. Phase I study of the poly(ADP-ribose) polymerase inhibitor, AG014699, in combination with temozolomide in patients with advanced solid tumors. Clin Cancer Res. 2008, 14, 7917–7923. [Google Scholar] [CrossRef]
- Drew, Y.; Ledermann, J.; Hall, G.; Rea, D.; Glasspool, R.; Highley, M.; Jayson, G.; Sludden, J.; Murray, J.; Jamieson, D.; et al. Phase 2 multicentre trial investigating intermittent and continuous dosing schedules of the poly(ADP-ribose) polymerase inhibitor rucaparib in germline BRCA mutation carriers with advanced ovarian and breast cancer. Br. J. Cancer 2016, 114, e21. [Google Scholar] [CrossRef]
- Bürkle, A.; Chen, G.; Küpper, J.H.; Grube, K.; Zeller, W.J. Increased poly(ADP-ribosyl)ation in intact cells by cisplatin treatment. Carcinogenesis 1993, 14, 559–561. [Google Scholar] [CrossRef] [PubMed]
- Gunn, A.R.; Banos-Pinero, B.; Paschke, P.; Sanchez-Pulido, L.; Ariza, A.; Day, J.; Emrich, M.; Leys, D.; Ponting, C.P.; Ahel, I.; et al. The role of ADP-ribosylation in regulating DNA interstrand crosslink repair. J. Cell Sci. 2016, 129, 3845–3858. [Google Scholar] [CrossRef] [PubMed] [Green Version]


Publisher’s Note: MDPI stays neutral with regard to jurisdictional claims in published maps and institutional affiliations. |
© 2022 by the authors. Licensee MDPI, Basel, Switzerland. This article is an open access article distributed under the terms and conditions of the Creative Commons Attribution (CC BY) license (https://creativecommons.org/licenses/by/4.0/).
Share and Cite
Saha, S.; Rundle, S.; Kotsopoulos, I.C.; Begbie, J.; Howarth, R.; Pappworth, I.Y.; Mukhopadhyay, A.; Kucukmetin, A.; Marchbank, K.J.; Curtin, N. Determining the Potential of DNA Damage Response (DDR) Inhibitors in Cervical Cancer Therapy. Cancers 2022, 14, 4288. https://doi.org/10.3390/cancers14174288
Saha S, Rundle S, Kotsopoulos IC, Begbie J, Howarth R, Pappworth IY, Mukhopadhyay A, Kucukmetin A, Marchbank KJ, Curtin N. Determining the Potential of DNA Damage Response (DDR) Inhibitors in Cervical Cancer Therapy. Cancers. 2022; 14(17):4288. https://doi.org/10.3390/cancers14174288
Chicago/Turabian StyleSaha, Santu, Stuart Rundle, Ioannis C. Kotsopoulos, Jacob Begbie, Rachel Howarth, Isabel Y. Pappworth, Asima Mukhopadhyay, Ali Kucukmetin, Kevin J. Marchbank, and Nicola Curtin. 2022. "Determining the Potential of DNA Damage Response (DDR) Inhibitors in Cervical Cancer Therapy" Cancers 14, no. 17: 4288. https://doi.org/10.3390/cancers14174288