
Tri-Compartmental Restriction Spectrum Imaging Breast Model Distinguishes Malignant Lesions from Benign Lesions and Healthy Tissue on Diffusion-Weighted Imaging

 , ,
, ,
Abstract
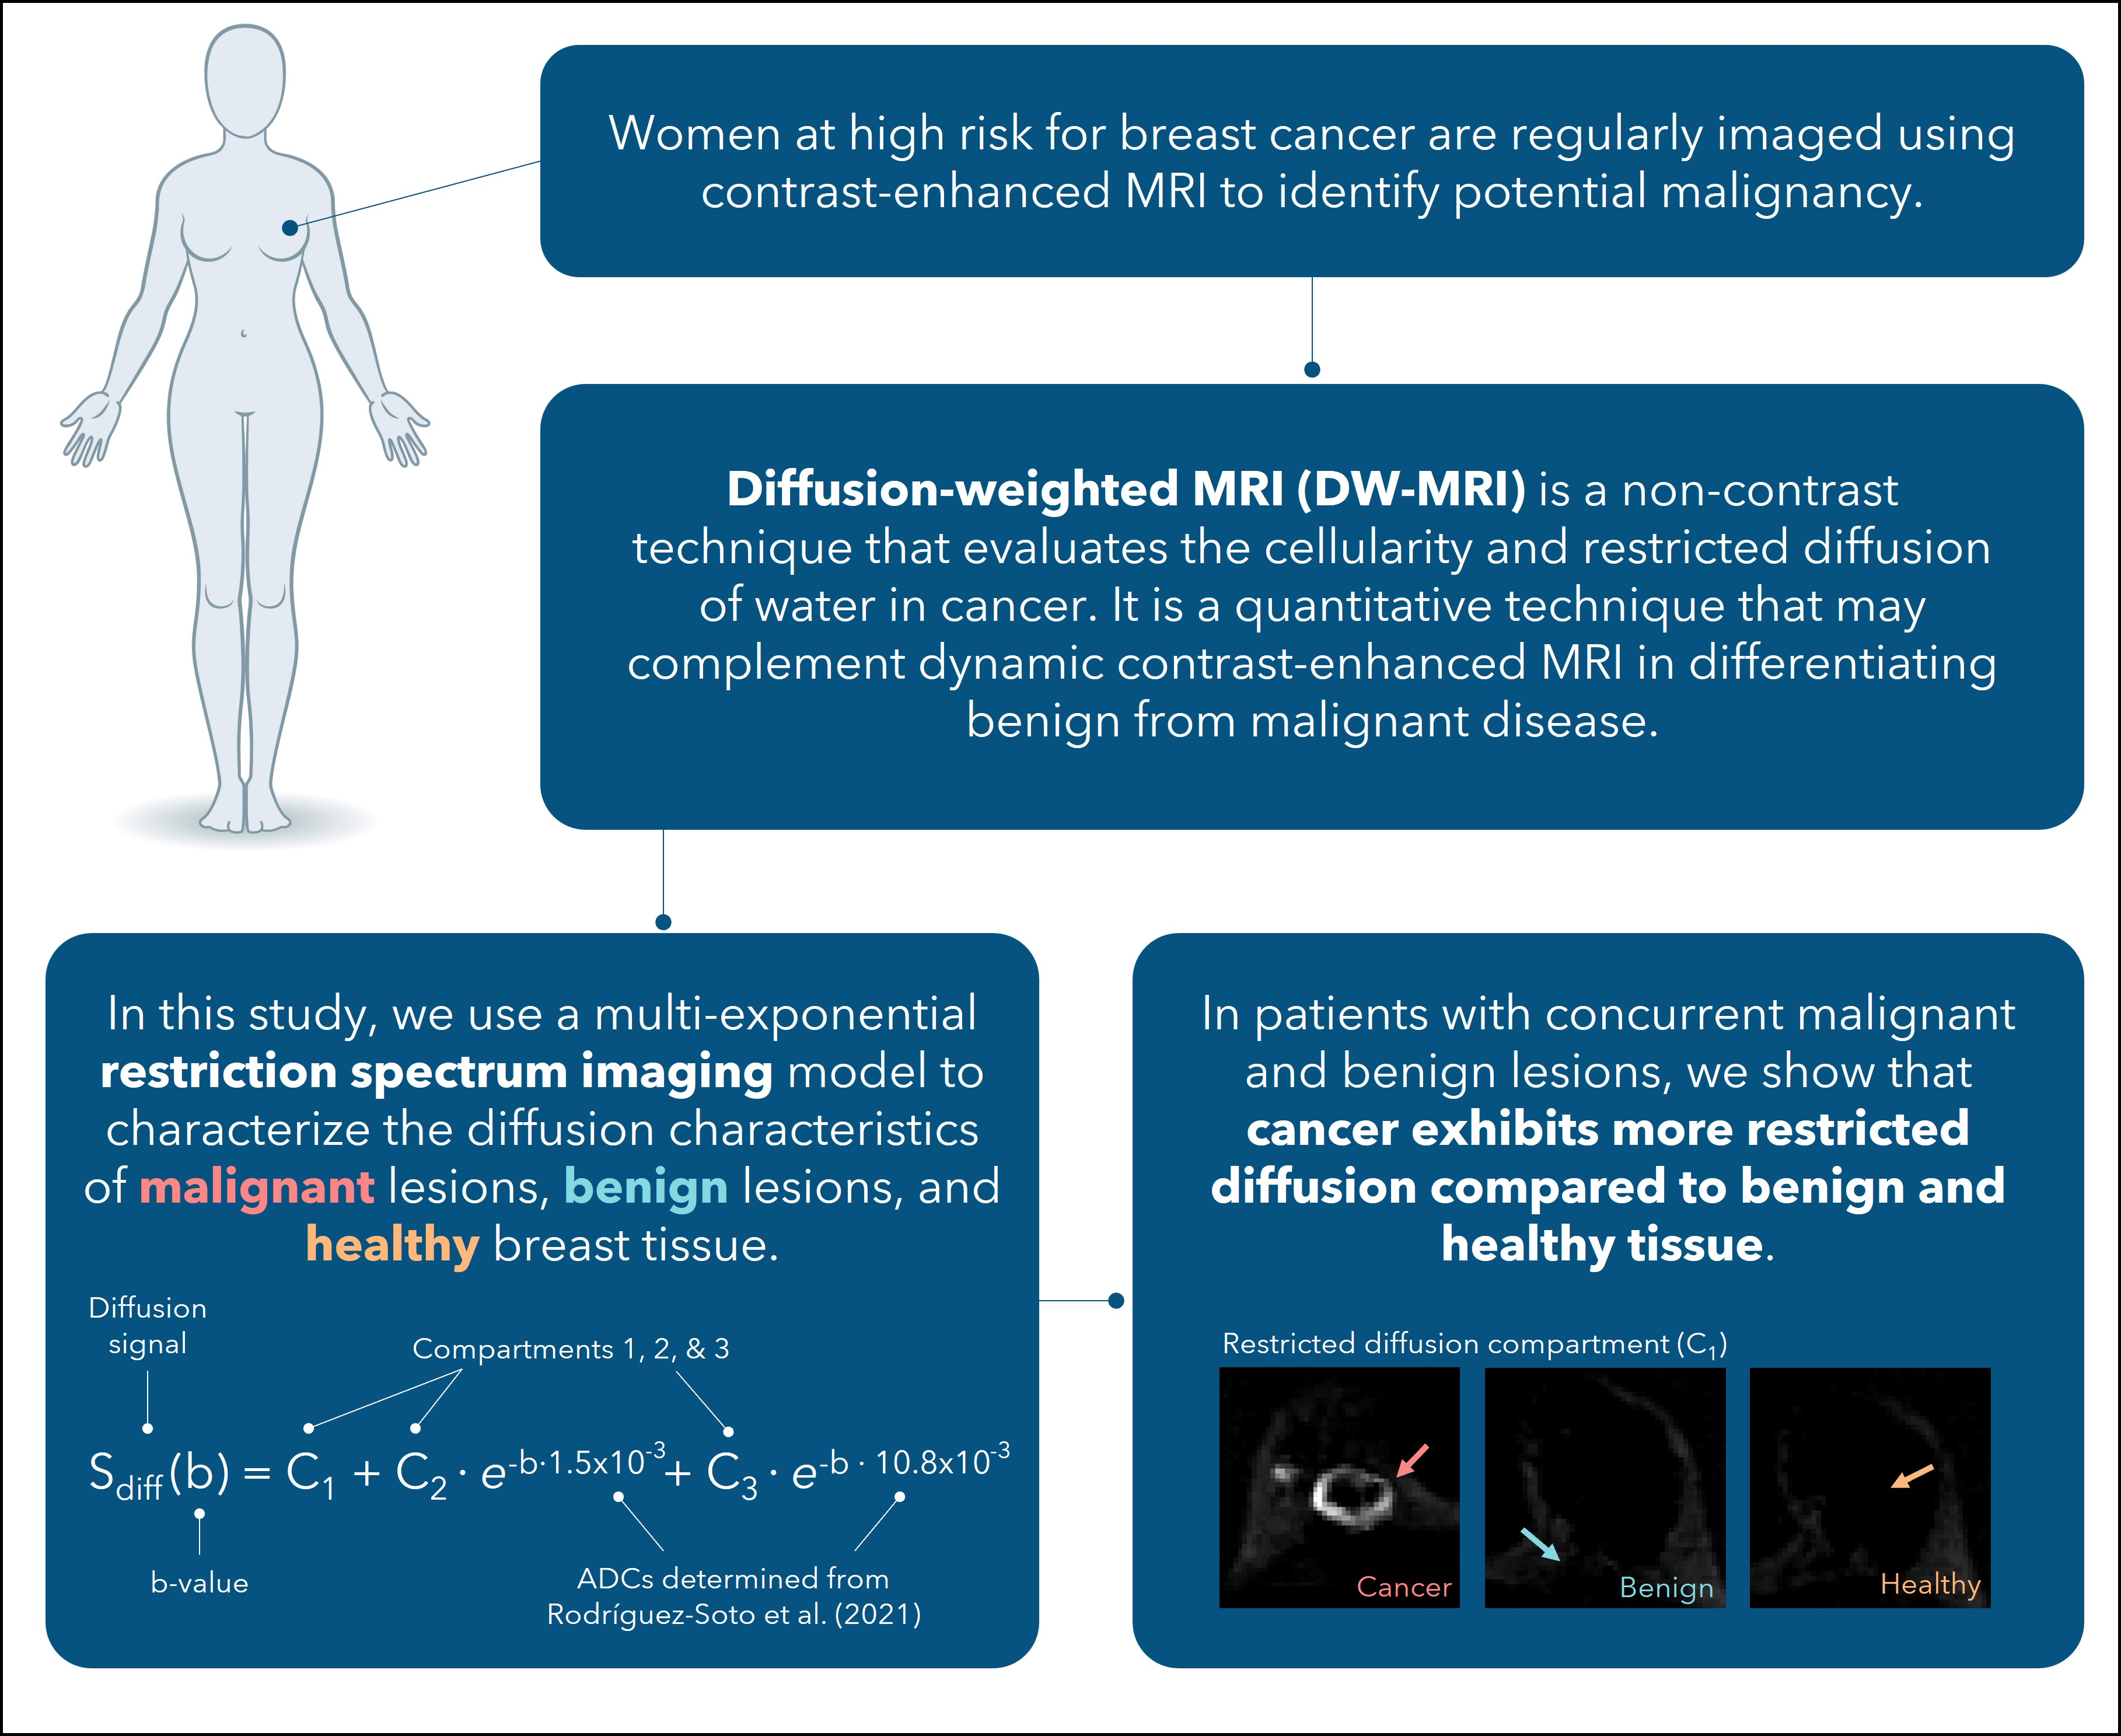
:Simple Summary
Abstract

1. Introduction
2. Materials and Methods
2.1. Subjects
2.2. Histopathology
2.3. MRI Data Acquisition
2.4. Data Processing
2.5. Statistical Analysis
3. Results
3.1. Contrast Enhancement Kinetics of Benign Lesions Suggest Suspicious Pathology
3.2. Malignant Lesions Display Higher C1 and C2 Compartment Values Compared to Benign Lesions and Healthy Tissue
3.3. Combinations of C1 and C2 Also Discriminate Malignant and Benign Lesions
4. Discussion
5. Conclusions
Author Contributions
Funding
Institutional Review Board Statement
Informed Consent Statement
Data Availability Statement
Acknowledgments
Conflicts of Interest
References
- Kuhl, C.K.; Schrading, S.; Leutner, C.C.; Morakkabati-Spitz, N.; Wardelmann, E.; Fimmers, R.; Kuhn, W.; Schild, H.H. Mammography, Breast Ultrasound, and Magnetic Resonance Imaging for Surveillance of Women at High Familial Risk for Breast Cancer. J. Clin. Oncol. 2005, 23, 8469–8476. [Google Scholar] [CrossRef]
- Kriege, M.; Brekelmans, C.T.M.; Boetes, C.; Besnard, P.E.; Zonderland, H.M.; Obdeijn, I.M.; Manoliu, R.A.; Kok, T.; Peterse, H.; Tilanus-Linthorst, M.M.A.; et al. Efficacy of MRI and Mammography for Breast-Cancer Screening in Women with a Familial or Genetic Predisposition. N. Engl. J. Med. 2004, 351, 427–437. [Google Scholar] [CrossRef] [Green Version]
- MARIBS Study Group. Screening with magnetic resonance imaging and mammography of a UK population at high familial risk of breast cancer: A prospective multicentre cohort study (MARIBS). Lancet 2005, 365, 1769–1778. [Google Scholar] [CrossRef]
- Obdeijn, I.-M.; Winter-Warnars, G.A.O.; Mann, R.; Hooning, M.J.; Hunink, M.G.M.; Tilanus-Linthorst, M.M.A. Should we screen BRCA1 mutation carriers only with MRI? A multicenter study. Breast Cancer Res. Treat. 2014, 144, 577–582. [Google Scholar] [CrossRef]
- Sardanelli, F.; Podo, F. Breast MR imaging in women at high-risk of breast cancer. Is something changing in early breast cancer detection? Eur. Radiol. 2007, 17, 873–887. [Google Scholar] [CrossRef]
- Monticciolo, D.L.; Newell, M.S.; Moy, L.; Niell, B.; Monsees, B.; Sickles, E.A. Breast Cancer Screening in Women at Higher-Than-Average Risk: Recommendations from the ACR. J. Am. Coll. Radiol. 2018, 15, 408–414. [Google Scholar] [CrossRef]
- Peters, N.H.G.M.; Rinkes, I.H.M.B.; Zuithoff, N.P.A.; Mali, W.P.T.M.; Moons, K.G.M.; Peeters, P.H.M. Meta-Analysis of MR Imaging in the Diagnosis of Breast Lesions. Radiology 2008, 246, 116–124. [Google Scholar] [CrossRef]
- White, N.S.; McDonald, C.R.; Farid, N.; Kuperman, J.; Karow, D.; Schenker-Ahmed, N.M.; Bartsch, H.; Rakow-Penner, R.; Holland, D.; Shabaik, A.; et al. Diffusion-Weighted Imaging in Cancer: Physical Foundations and Applications of Restriction Spectrum Imaging. Cancer Res. 2014, 74, 4638–4652. [Google Scholar] [CrossRef] [Green Version]
- Partridge, S.C.; Nissan, N.; Rahbar, H.; Kitsch, A.E.; Sigmund, E.E. Diffusion-weighted breast MRI: Clinical applications and emerging techniques. J. Magn. Reson. Imaging 2017, 45, 337–355. [Google Scholar] [CrossRef]
- Keenan, K.E.; Peskin, A.P.; Wilmes, L.J.; Aliu, S.O.; Jones, E.F.; Li, W.; Kornak, J.; Newitt, D.C.; Hylton, N.M. Variability and bias assessment in breast ADC measurement across multiple systems. J. Magn. Reson. Imaging 2016, 44, 846–855. [Google Scholar] [CrossRef] [Green Version]
- Partridge, S.C.; Zhang, Z.; Newitt, D.C.; Gibbs, J.E.; Chenevert, T.L.; Rosen, M.A.; Bolan, P.J.; Marques, H.S.; Romanoff, J.; Cimino, L.; et al. Diffusion-weighted MRI Findings Predict Pathologic Response in Neoadjuvant Treatment of Breast Cancer: The ACRIN 6698 Multicenter Trial. Radiology 2018, 289, 618–627. [Google Scholar] [CrossRef]
- Peters, N.H.; Vincken, K.L.; van den Bosch, M.A.A.J.; Luijten, P.R.; Mali, W.P.; Bartels, L.W. Quantitative diffusion weighted imaging for differentiation of benign and malignant breast lesions: The influence of the choice of b-values. J. Magn. Reson. Imaging 2010, 31, 1100–1105. [Google Scholar] [CrossRef]
- Miller, F.H.; Hammond, N.; Siddiqi, A.J.; Shroff, S.; Khatri, G.; Wang, Y.; Merrick, L.B.; Nikolaidis, P. Utility of diffusion-weighted MRI in distinguishing benign and malignant hepatic lesions. J. Magn. Reson. Imaging 2010, 32, 138–147. [Google Scholar] [CrossRef]
- Woodhams, R.; Matsunaga, K.; Kan, S.; Hata, H.; Ozaki, M.; Iwabuchi, K.; Kuranami, M.; Watanabe, M.; Hayakawa, K. ADC Mapping of Benign and Malignant Breast Tumors. Magn. Reson. Med. Sci. 2005, 4, 35–42. [Google Scholar] [CrossRef] [Green Version]
- Mann, R.M.; Cho, N.; Moy, L. Breast MRI: State of the Art. Radiology 2019, 292, 520–536. [Google Scholar] [CrossRef]
- Pinker, K.; Helbich, T.H.; Morris, E.A. The potential of multiparametric MRI of the breast. Br. J. Radiol. 2017, 90, e20160715. [Google Scholar] [CrossRef] [Green Version]
- White, N.S.; Dale, A.M. Distinct effects of nuclear volume fraction and cell diameter on high b-value diffusion MRI contrast in tumors. Magn. Reson. Med. 2014, 72, 1435–1443. [Google Scholar] [CrossRef] [Green Version]
- White, N.S.; Leergaard, T.B.; D’Arceuil, H.; Bjaalie, J.G.; Dale, A.M. Probing tissue microstructure with restriction spectrum imaging: Histological and theoretical validation. Hum. Brain Mapp. 2013, 34, 327–346. [Google Scholar] [CrossRef] [Green Version]
- White, N.S.; McDonald, C.R.; Farid, N.; Kuperman, J.M.; Kesari, S.; Dale, A.M. Improved Conspicuity and Delineation of High-Grade Primary and Metastatic Brain Tumors Using “Restriction Spectrum Imaging”: Quantitative Comparison with High B-Value DWI and ADC. Am. J. Neuroradiol. 2013, 34, 958–964. [Google Scholar] [CrossRef] [Green Version]
- Brunsing, R.L.; Schenker-Ahmed, N.M.; White, N.S.; Parsons, J.K.; Kane, C.; Kuperman, J.M.; Bartsch, H.; Kader, A.K.; Rakow-Penner, R.A.; Seibert, T.M.; et al. Restriction spectrum imaging: An evolving imaging biomarker in prostate MRI. J. Magn. Reson. Imaging 2017, 45, 323–336. [Google Scholar] [CrossRef] [Green Version]
- Conlin, C.C.; Feng, C.H.; Rodriguez-Soto, A.E.; Karunamuni, R.A.; Kuperman, J.M.; Holland, D.; Rakow-Penner, R.A.; Hahn, M.E.; Seibert, T.M.; Dale, A.M. Improved Characterization of Diffusion in Normal and Cancerous Prostate Tissue Through Optimization of Multicompartmental Signal Models. J. Magn. Reson. Imaging 2021, 53, 628–639. [Google Scholar] [CrossRef] [PubMed]
- Vidić, I.; Egnell, L.; Jerome, N.P.; White, N.S.; Karunamuni, R.; Rakow-Penner, R.A.; Dale, A.M.; Bathen, T.F.; Goa, P.E. Modeling the diffusion-weighted imaging signal for breast lesions in the b = 200 to 3000 s/mm2 range: Quality of fit and classification accuracy for different representations. Magn. Reson. Med. 2020, 84, 1011–1023. [Google Scholar] [CrossRef] [Green Version]
- Rodríguez-Soto, A.E.; Andreassen, M.M.S.; Fang, L.K.; Conlin, C.C.; Park, H.H.; Ahn, G.S.; Bartsch, H.; Kuperman, J.; Vidić, I.; Ojeda-Fournier, H.; et al. Characterization of the Diffusion Signal of Breast Tissues using Multi-exponential Models. Magn. Reson. Med. 2021, 87, 1938–1951. [Google Scholar] [CrossRef]
- Andreassen, M.M.S.; Rodríguez-Soto, A.E.; Conlin, C.C.; Vidić, I.; Seibert, T.M.; Wallace, A.M.; Zare, S.; Kuperman, J.; Abudu, B.; Ahn, G.S.; et al. Discrimination of Breast Cancer from Healthy Breast Tissue Using a Three-Component Diffusion-Weighted MRI Model. Clin. Cancer Res. 2021, 27, 1094–1104. [Google Scholar] [CrossRef]
- Morris, E.A.; Comstock, C.E.; Lee, C.H. ACR BI-RADS® Magnetic Resonance Imaging. In ACR BI-RADS® Atlas, Breast Imaging Reporting and Data System; American College of Radiology: Reston, VA, USA, 2013. [Google Scholar]
- Holland, D.; Kuperman, J.M.; Dale, A.M. Efficient correction of inhomogeneous static magnetic field-induced distortion in Echo Planar Imaging. NeuroImage 2010, 50, 175–183. [Google Scholar] [CrossRef] [Green Version]
- Rodríguez-Soto, A.E.; Fang, L.K.; Holland, D.; Zou, J.; Park, H.H.; Keenan, K.E.; Bartsch, H.; Kuperman, J.; Wallace, A.M.; Hahn, M.E.; et al. Correction of Artifacts Induced by B(0) Inhomogeneities in Breast MRI Using Reduced-Field-of-View Echo-Planar Imaging and Enhanced Reversed Polarity Gradient Method. J. Magn. Reason. Imaging 2021, 53, 1581–1591. [Google Scholar] [CrossRef]
- Baron, P.; Dorrius, M.D.; Kappert, P.; Oudkerk, M.; Sijens, P.E. Diffusion-weighted imaging of normal fibroglandular breast tissue: Influence of microperfusion and fat suppression technique on the apparent diffusion coefficient. NMR Biomed. 2010, 23, 399–405. [Google Scholar] [CrossRef]
- Sharma, U.; Sah, R.G.; Agarwal, K.; Parshad, R.; Seenu, V.; Mathur, S.R.; Hari, S.; Jagannathan, N.R. Potential of Diffusion-Weighted Imaging in the Characterization of Malignant, Benign, and Healthy Breast Tissues and Molecular Subtypes of Breast Cancer. Front. Oncol. 2016, 6, 126. [Google Scholar] [CrossRef] [Green Version]
- McDonald, E.S.; Schopp, J.G.; Peacock, S.; DeMartini, W.B.; Rahbar, H.; Lehman, C.D.; Partridge, S.C. Diffusion-Weighted MRI: Association Between Patient Characteristics and Apparent Diffusion Coefficients of Normal Breast Fibroglandular Tissue at 3 T. Am. J. Roentgenol. 2014, 202, W496–W502. [Google Scholar] [CrossRef] [Green Version]
- McDonald, E.S.; Romanoff, J.; Rahbar, H.; Kitsch, A.E.; Harvey, S.M.; Whisenant, J.G.; Yankeelov, T.E.; Moy, L.; DeMartini, W.B.; Dogan, B.E.; et al. Mean Apparent Diffusion Coefficient Is a Sufficient Conventional Diffusion-weighted MRI Metric to Improve Breast MRI Diagnostic Performance: Results from the ECOG-ACRIN Cancer Research Group A6702 Diffusion Imaging Trial. Radiology 2021, 298, 60–70. [Google Scholar] [CrossRef]
- Rahbar, H.; Zhang, Z.; Chenevert, T.L.; Romanoff, J.; Kitsch, A.E.; Hanna, L.G.; Harvey, S.M.; Moy, L.; DeMartini, W.B.; Dogan, B.; et al. Utility of Diffusion-weighted Imaging to Decrease Unnecessary Biopsies Prompted by Breast MRI: A Trial of the ECOG-ACRIN Cancer Research Group (A6702). Clin. Cancer Res. 2019, 25, 1756–1765. [Google Scholar] [CrossRef]
- Surov, A.; Meyer, H.J.; Wienke, A. Can apparent diffusion coefficient (ADC) distinguish breast cancer from benign breast findings? A meta-analysis based on 13 847 lesions. BMC Cancer 2019, 19, 955. [Google Scholar] [CrossRef] [Green Version]


| Malignant (n = 12) | Benign (n = 14) | ||
|---|---|---|---|
| Histology | n | Histology | n |
| IDC 1 | 7 | Stromal fibrosis | 6 |
| IMC 2 | 1 | Fibroadenoma | 4 |
| ILC 3 | 1 | Focal ductal hyperplasia | 1 |
| IDC + DCIS 1,4 | 1 | Benign sclerosing adenosis | 1 |
| IMC + DCIS 2,4 | 1 | Radial scar | 1 |
| DCIS 4 | 1 | Benign breast parenchyma | 1 |
| Type | n | Type | n |
| Mass | 9 | Mass | 10 |
| NME 5 | 1 | NME 5 | 3 |
| Mass + NME 5 | 2 | Mass + NME 5 | 1 |
| Tissue Type | ROI Volume [cm3] | ADC × 10−3 [mm2/s] | C1 | C2 | C3 | C1C2 | p | |
|---|---|---|---|---|---|---|---|---|
| Malignant | 6.4 (10.5) | 0.94 (0.23) | 0.32 (0.18) | 2.6 (1.7) | 0.13 (0.40) | 0.70 (1.0) | 0.82 (0.58) | 3.5 × 10⁻⁵ |
| Benign | 0.5 (0.8) | 1.16 (0.27) | 0.05 (0.12) | 1.6 (1.5) | 0.34 (0.70) | 0.08 (0.29) | 0.29 (0.46) | 0.003 |
| Healthy | 199.2 (10.5) | 0.97 (0.25) | 0.08 (0.13) | 0.90 (0.73) | 0.34 (0.43) | 0.03 (0.05) | 0.16 (0.16) | 3.3 × 10⁻⁴ |
| p | ns | 1.4 × 10⁻⁵ | 0.001 | ns | 6.2 × 10⁻⁶ | 5.9 × 10⁻⁶ | ||
| Compartment | Groups | Bonferroni-Adjusted p-Value | Significance |
|---|---|---|---|
| C1 | Malignant vs. Benign | 0.001 | ** |
| Malignant vs. Healthy | 0.001 | ** | |
| Benign vs. Healthy | 1.0 | ns | |
| C2 | Malignant vs. Benign | 0.30 | ns |
| Malignant vs. Healthy | 0.01 | ** | |
| Benign vs. Healthy | 0.90 | ns | |
| C3 | Malignant vs. Benign | 1.0 | ns |
| Malignant vs. Healthy | 0.70 | ns | |
| Benign vs. Healthy | 1.0 | ns | |
| C1C2 | Malignant vs. Benign | 0.004 | ** |
| Malignant vs. Healthy | 0.001 | ** | |
| Benign vs. Healthy | 0.11 | ns | |
| Malignant vs. Benign | 0.003 | ** | |
| Malignant vs. Healthy | 0.008 | ** | |
| Benign vs. Healthy | 0.23 | ns |
Publisher’s Note: MDPI stays neutral with regard to jurisdictional claims in published maps and institutional affiliations. |
© 2022 by the authors. Licensee MDPI, Basel, Switzerland. This article is an open access article distributed under the terms and conditions of the Creative Commons Attribution (CC BY) license (https://creativecommons.org/licenses/by/4.0/).
Share and Cite
Besser, A.H.; Fang, L.K.; Tong, M.W.; Sjaastad Andreassen, M.M.; Ojeda-Fournier, H.; Conlin, C.C.; Loubrie, S.; Seibert, T.M.; Hahn, M.E.; Kuperman, J.M.; et al. Tri-Compartmental Restriction Spectrum Imaging Breast Model Distinguishes Malignant Lesions from Benign Lesions and Healthy Tissue on Diffusion-Weighted Imaging. Cancers 2022, 14, 3200. https://doi.org/10.3390/cancers14133200
Besser AH, Fang LK, Tong MW, Sjaastad Andreassen MM, Ojeda-Fournier H, Conlin CC, Loubrie S, Seibert TM, Hahn ME, Kuperman JM, et al. Tri-Compartmental Restriction Spectrum Imaging Breast Model Distinguishes Malignant Lesions from Benign Lesions and Healthy Tissue on Diffusion-Weighted Imaging. Cancers. 2022; 14(13):3200. https://doi.org/10.3390/cancers14133200
Chicago/Turabian StyleBesser, Alexandra H., Lauren K. Fang, Michelle W. Tong, Maren M. Sjaastad Andreassen, Haydee Ojeda-Fournier, Christopher C. Conlin, Stéphane Loubrie, Tyler M. Seibert, Michael E. Hahn, Joshua M. Kuperman, and et al. 2022. "Tri-Compartmental Restriction Spectrum Imaging Breast Model Distinguishes Malignant Lesions from Benign Lesions and Healthy Tissue on Diffusion-Weighted Imaging" Cancers 14, no. 13: 3200. https://doi.org/10.3390/cancers14133200