
Carnitine Palmitoyltransferase 1 Regulates Prostate Cancer Growth under Hypoxia

 , , and
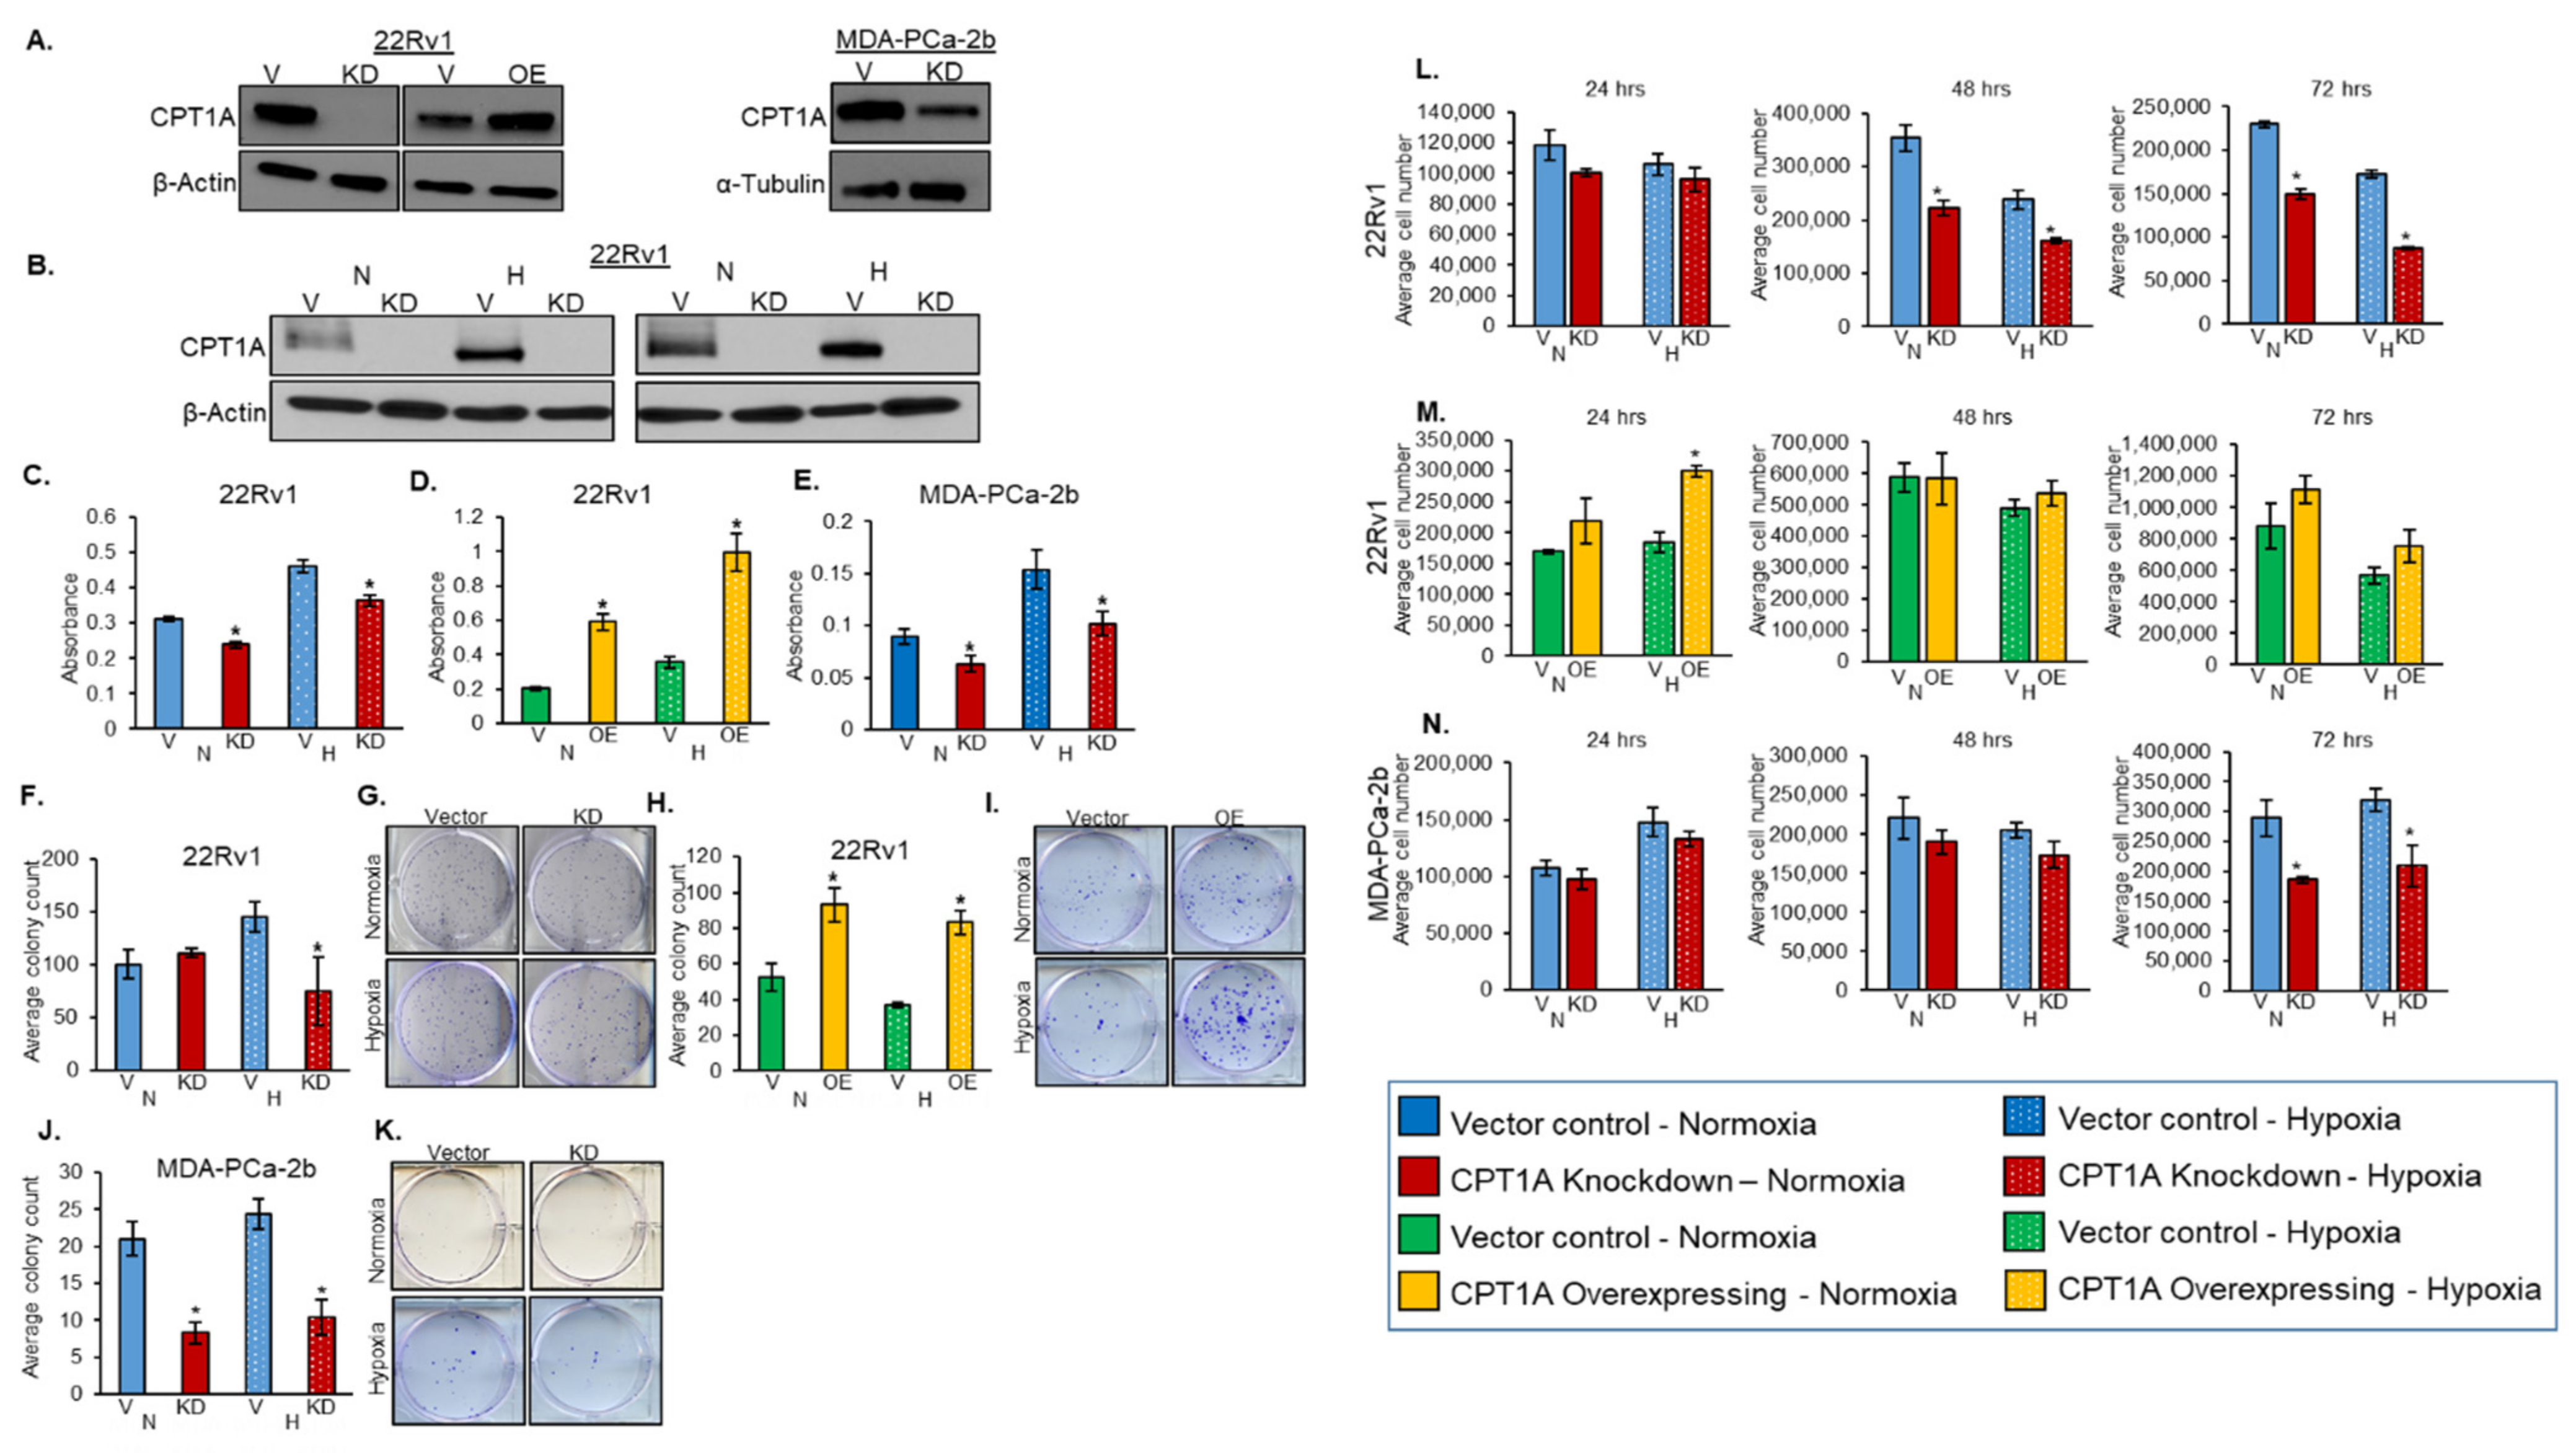
Abstract
:Simple Summary
Abstract
1. Introduction
2. Materials and Methods
2.1. Cell Culture and Lentiviral Transfections
2.2. Hypoxia Exposure
2.3. Western Blot Analysis
2.4. MTT Assay
2.5. Trypan Blue Exclusion Assay
2.6. Colony Formation Assay
2.7. Spheroid Assay
2.8. Histopathology
2.9. Immunohistochemistry (IHC)
2.10. Xenograft Mouse Experiments
2.11. Immunofluorescence
2.12. TCGA (The Cancer Genome Atlas) Data Analysis
2.13. Statistical Analysis
3. Results
3.1. Role of CPT1A in Regulating PCa Cell Proliferation and Colony Formation under Hypoxic Conditions
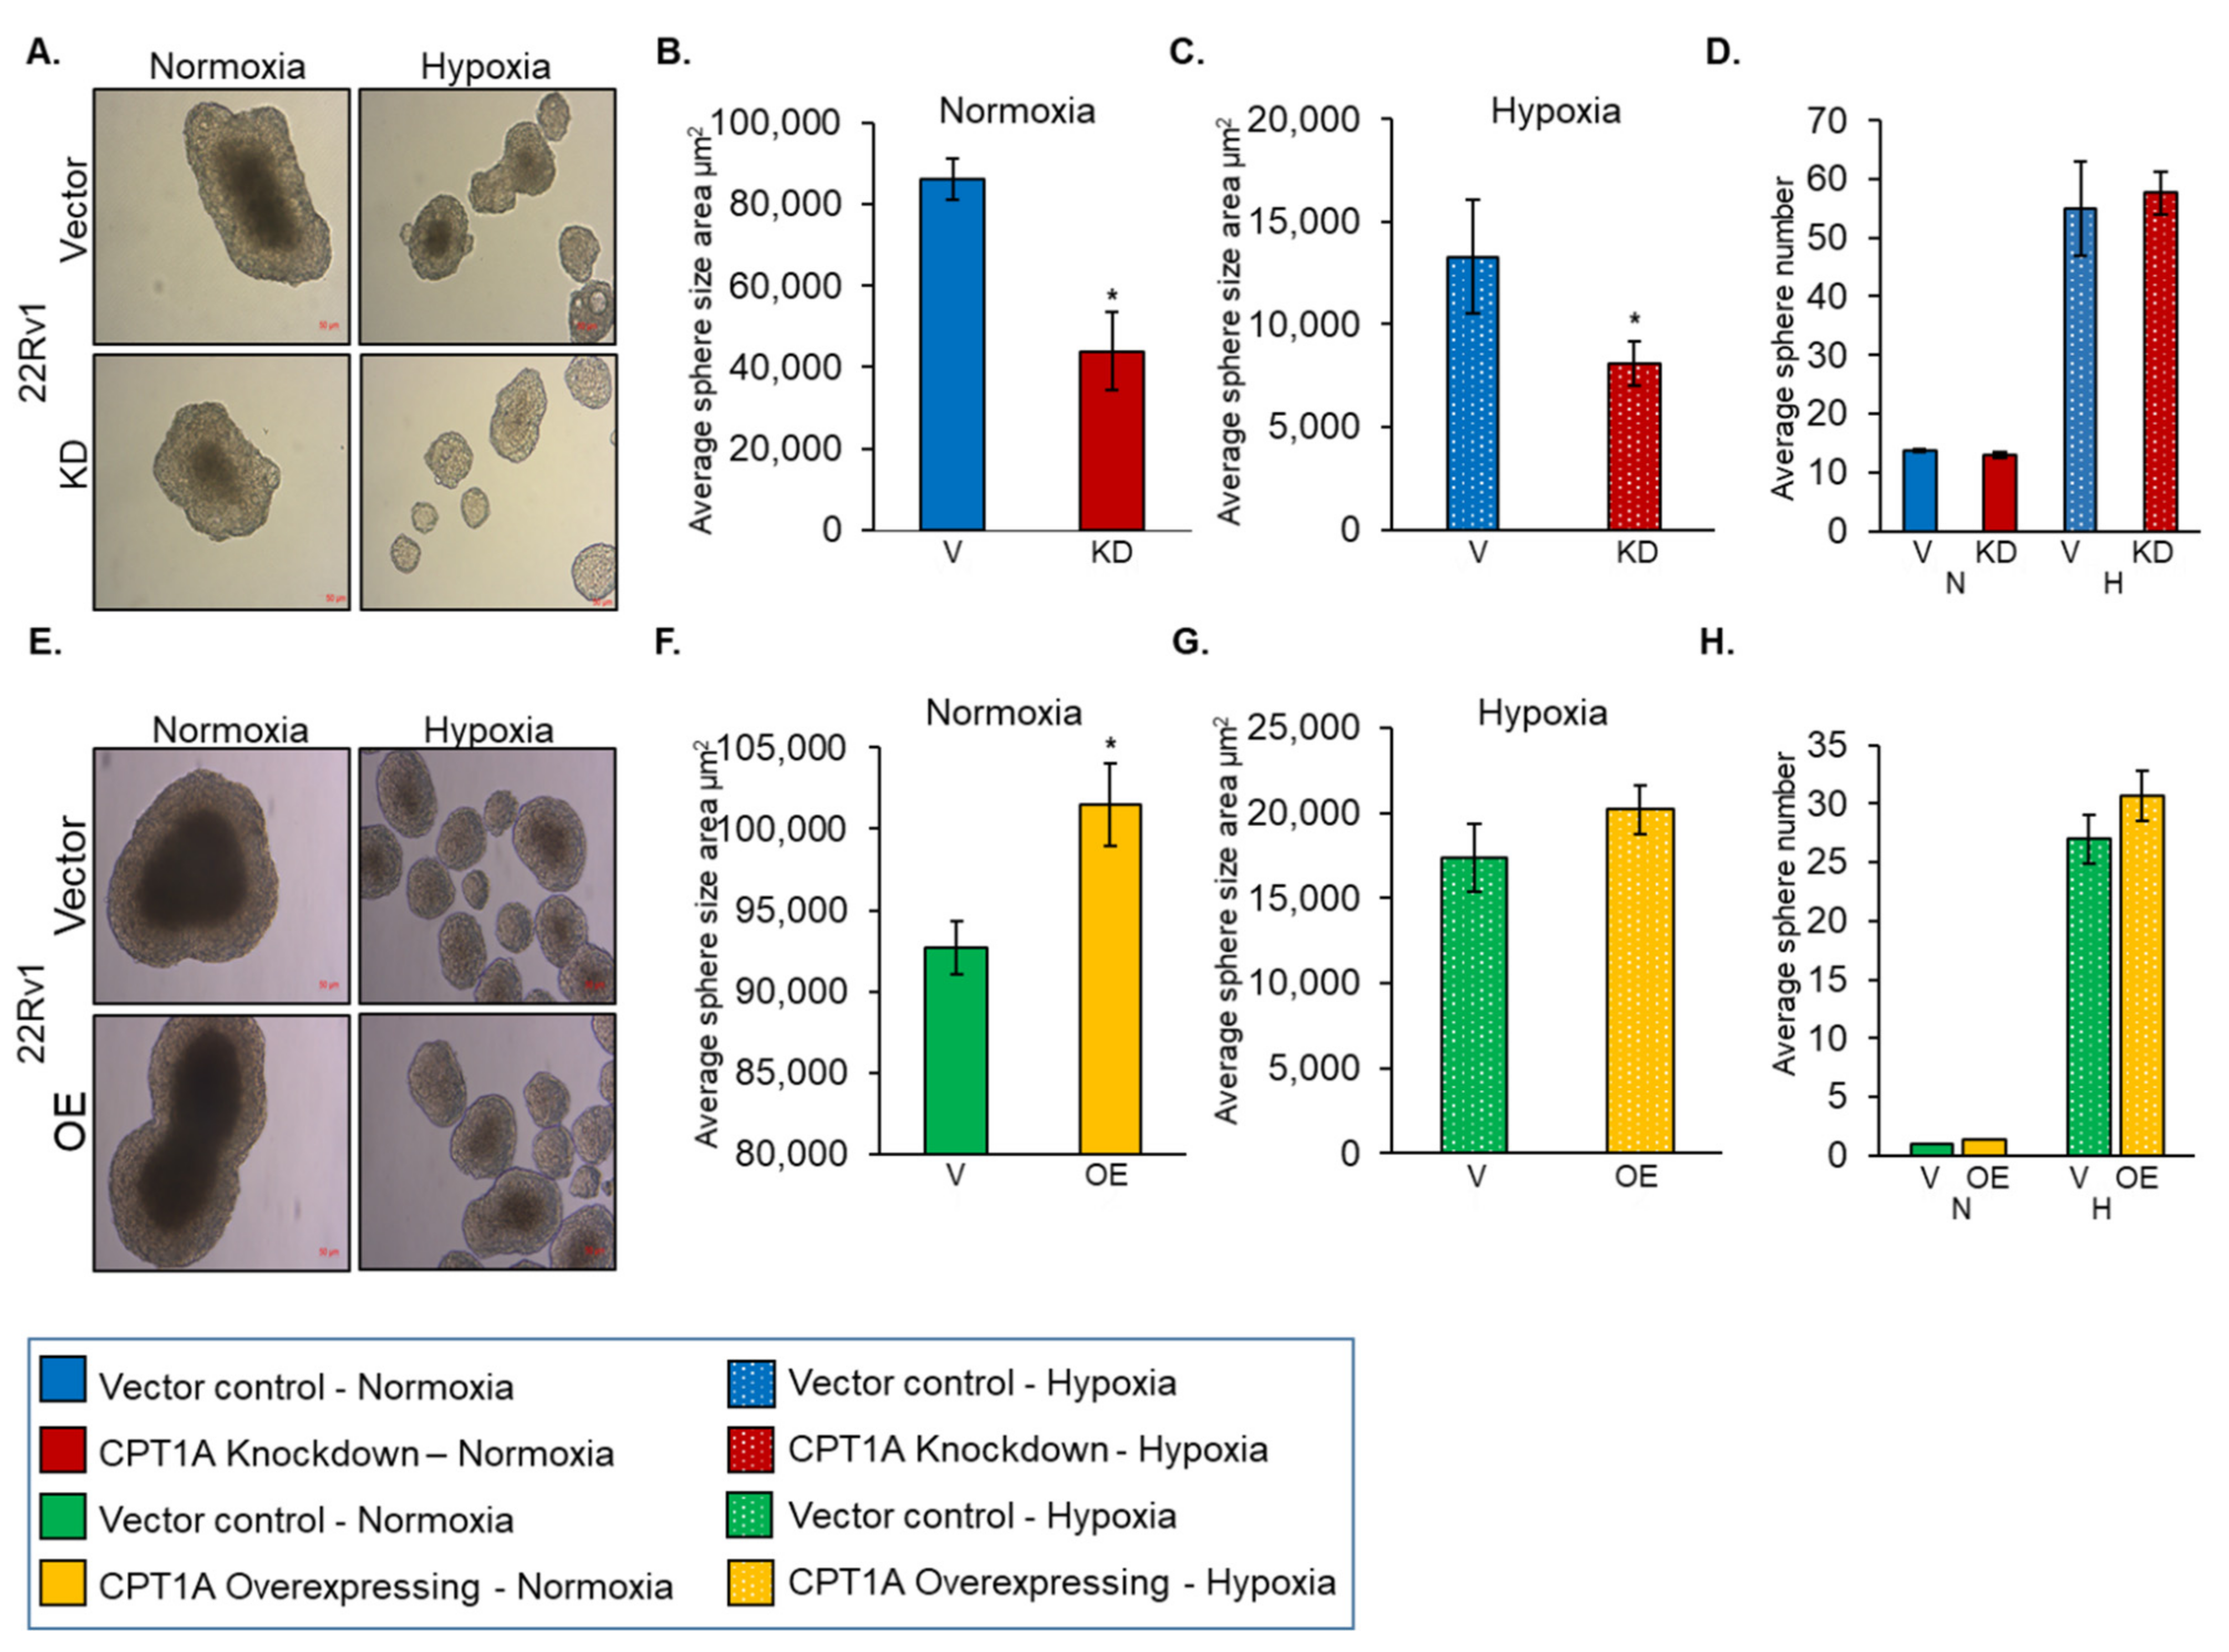
3.2. Role of CPT1A in Regulating Sphere Formation by PCa Cells under Hypoxic Condition
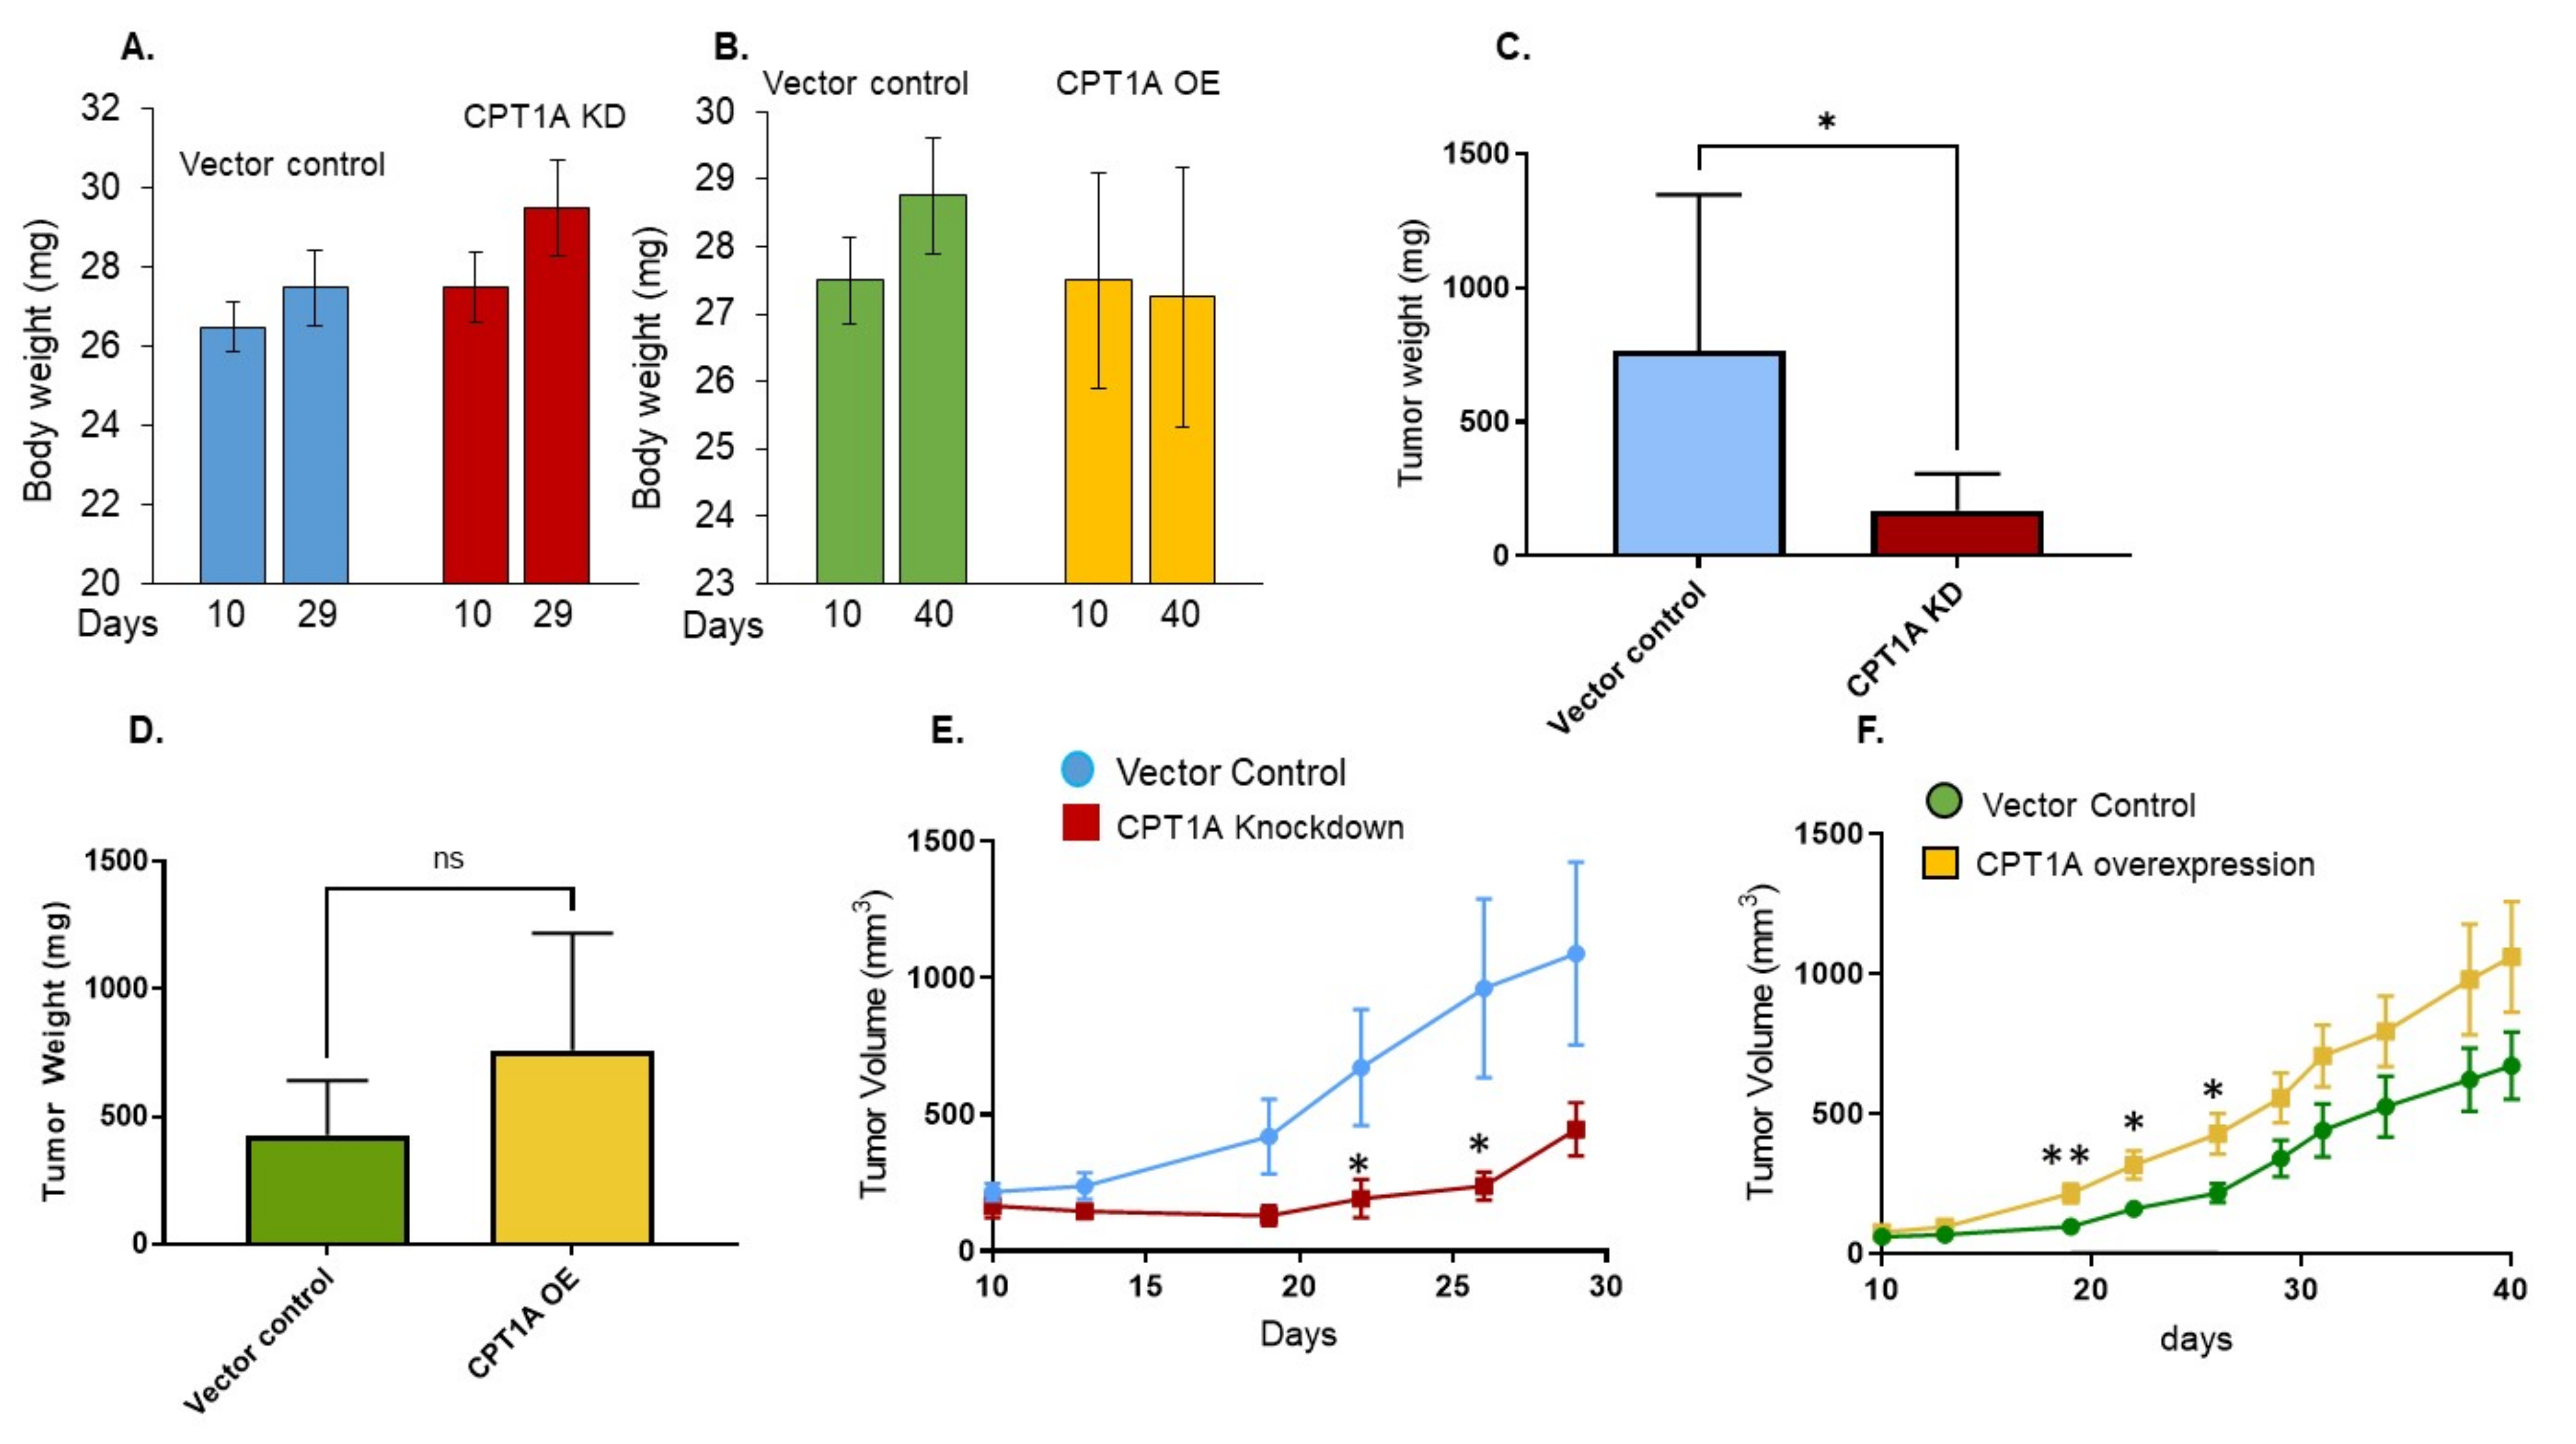
3.3. The Effect of CPT1A Expression on In Vivo Growth of 22Rv1 Cells in Immunocompromised Athymic Nude Mice
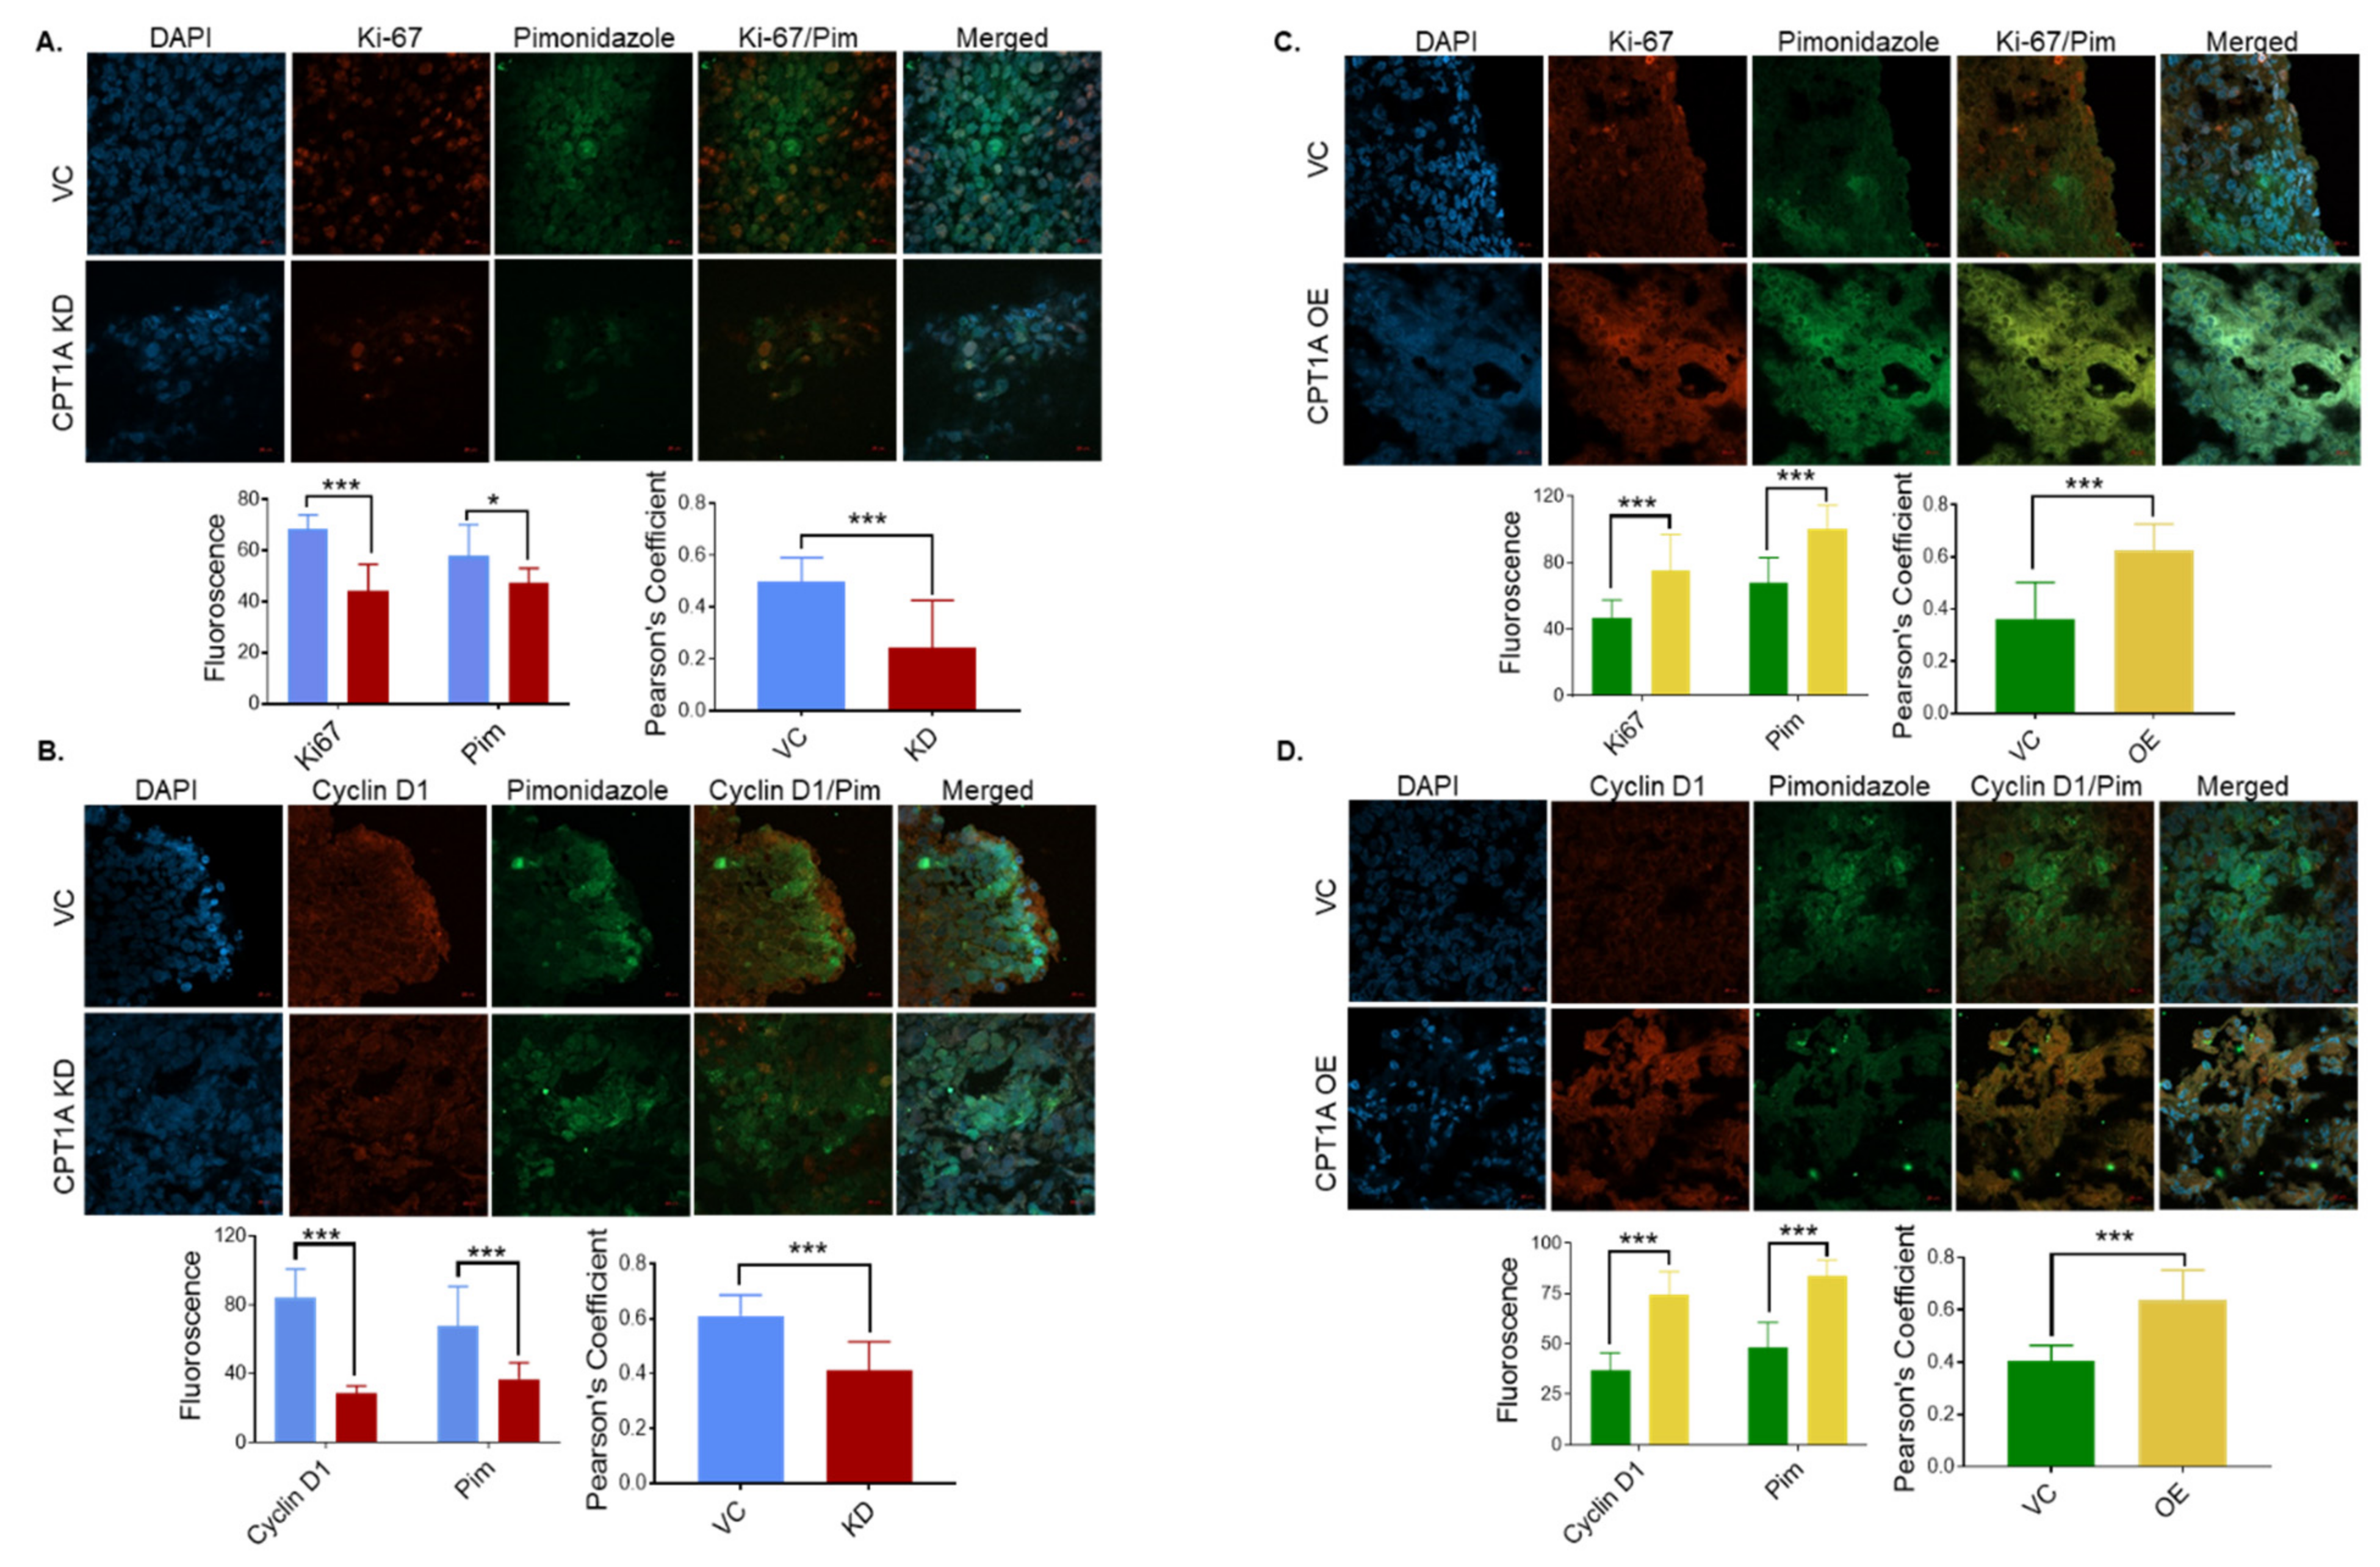
3.4. CPT1A Expression Regulates the Extent of Hypoxic Regions and Expression of Proliferation Biomarkers in 22Rv1 Tumors
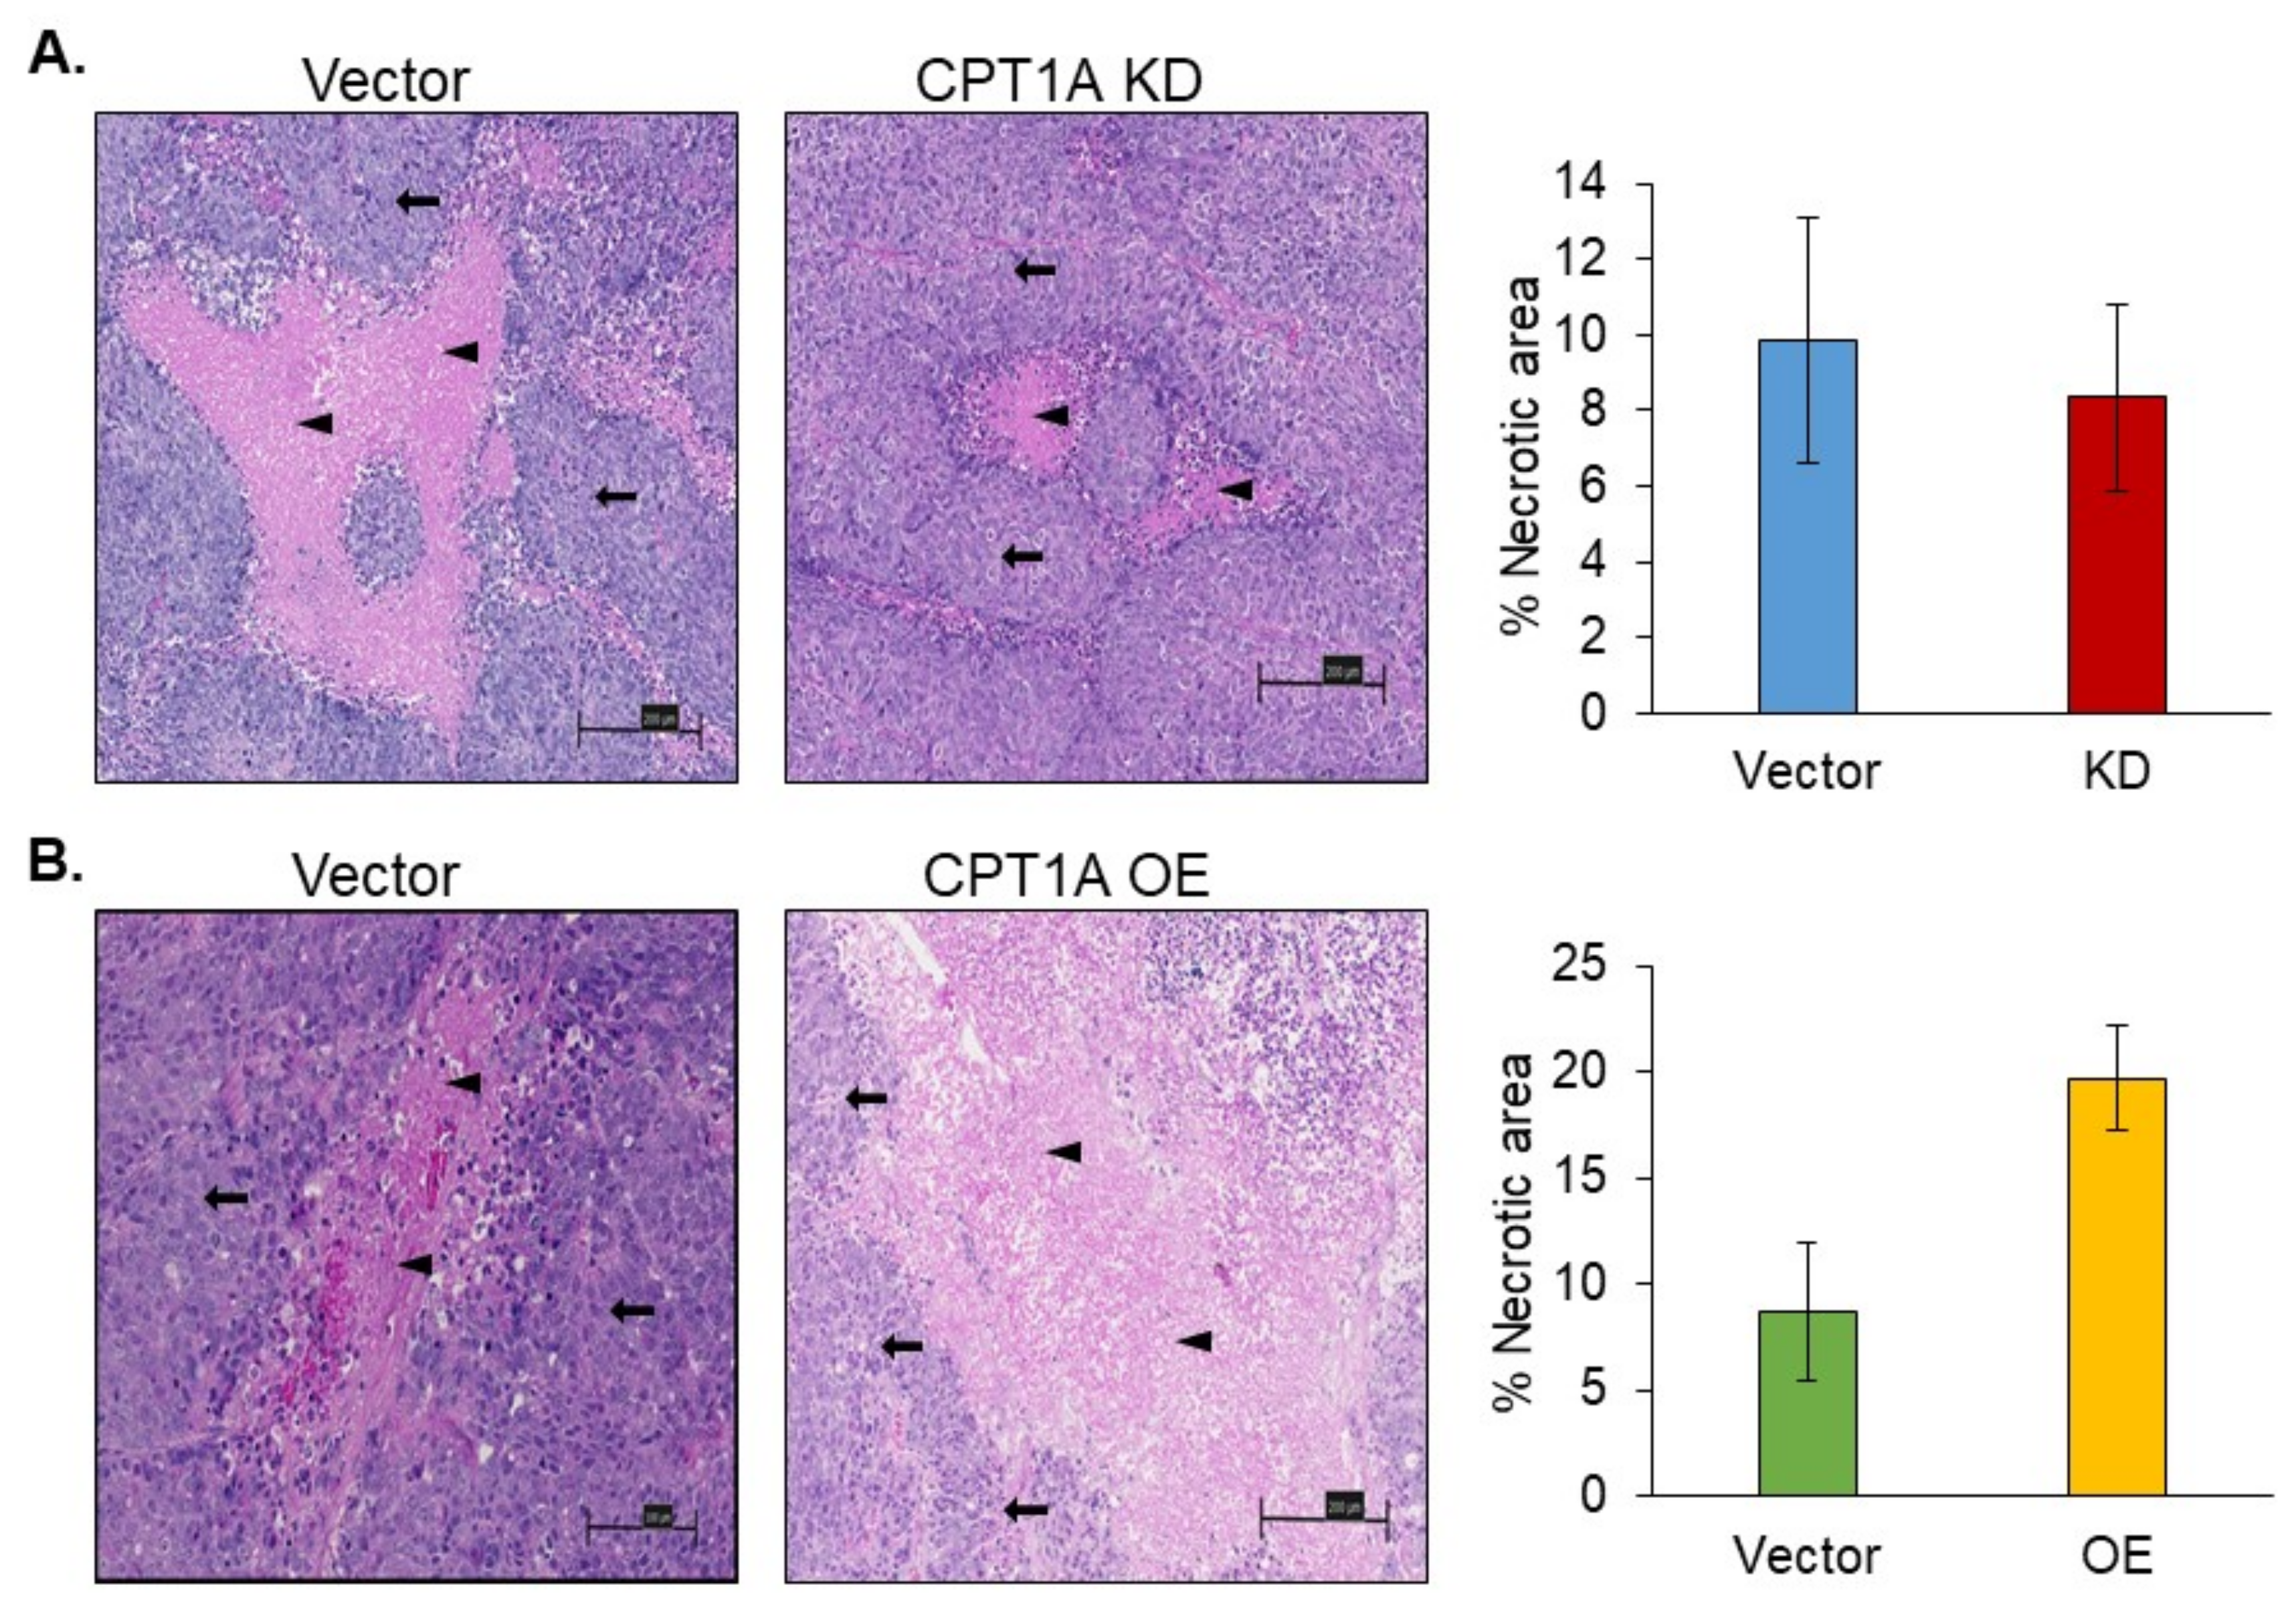
3.5. Necrosis in 22Rv1 Tumors with Stable Knockdown or Overexpression of CPT1A
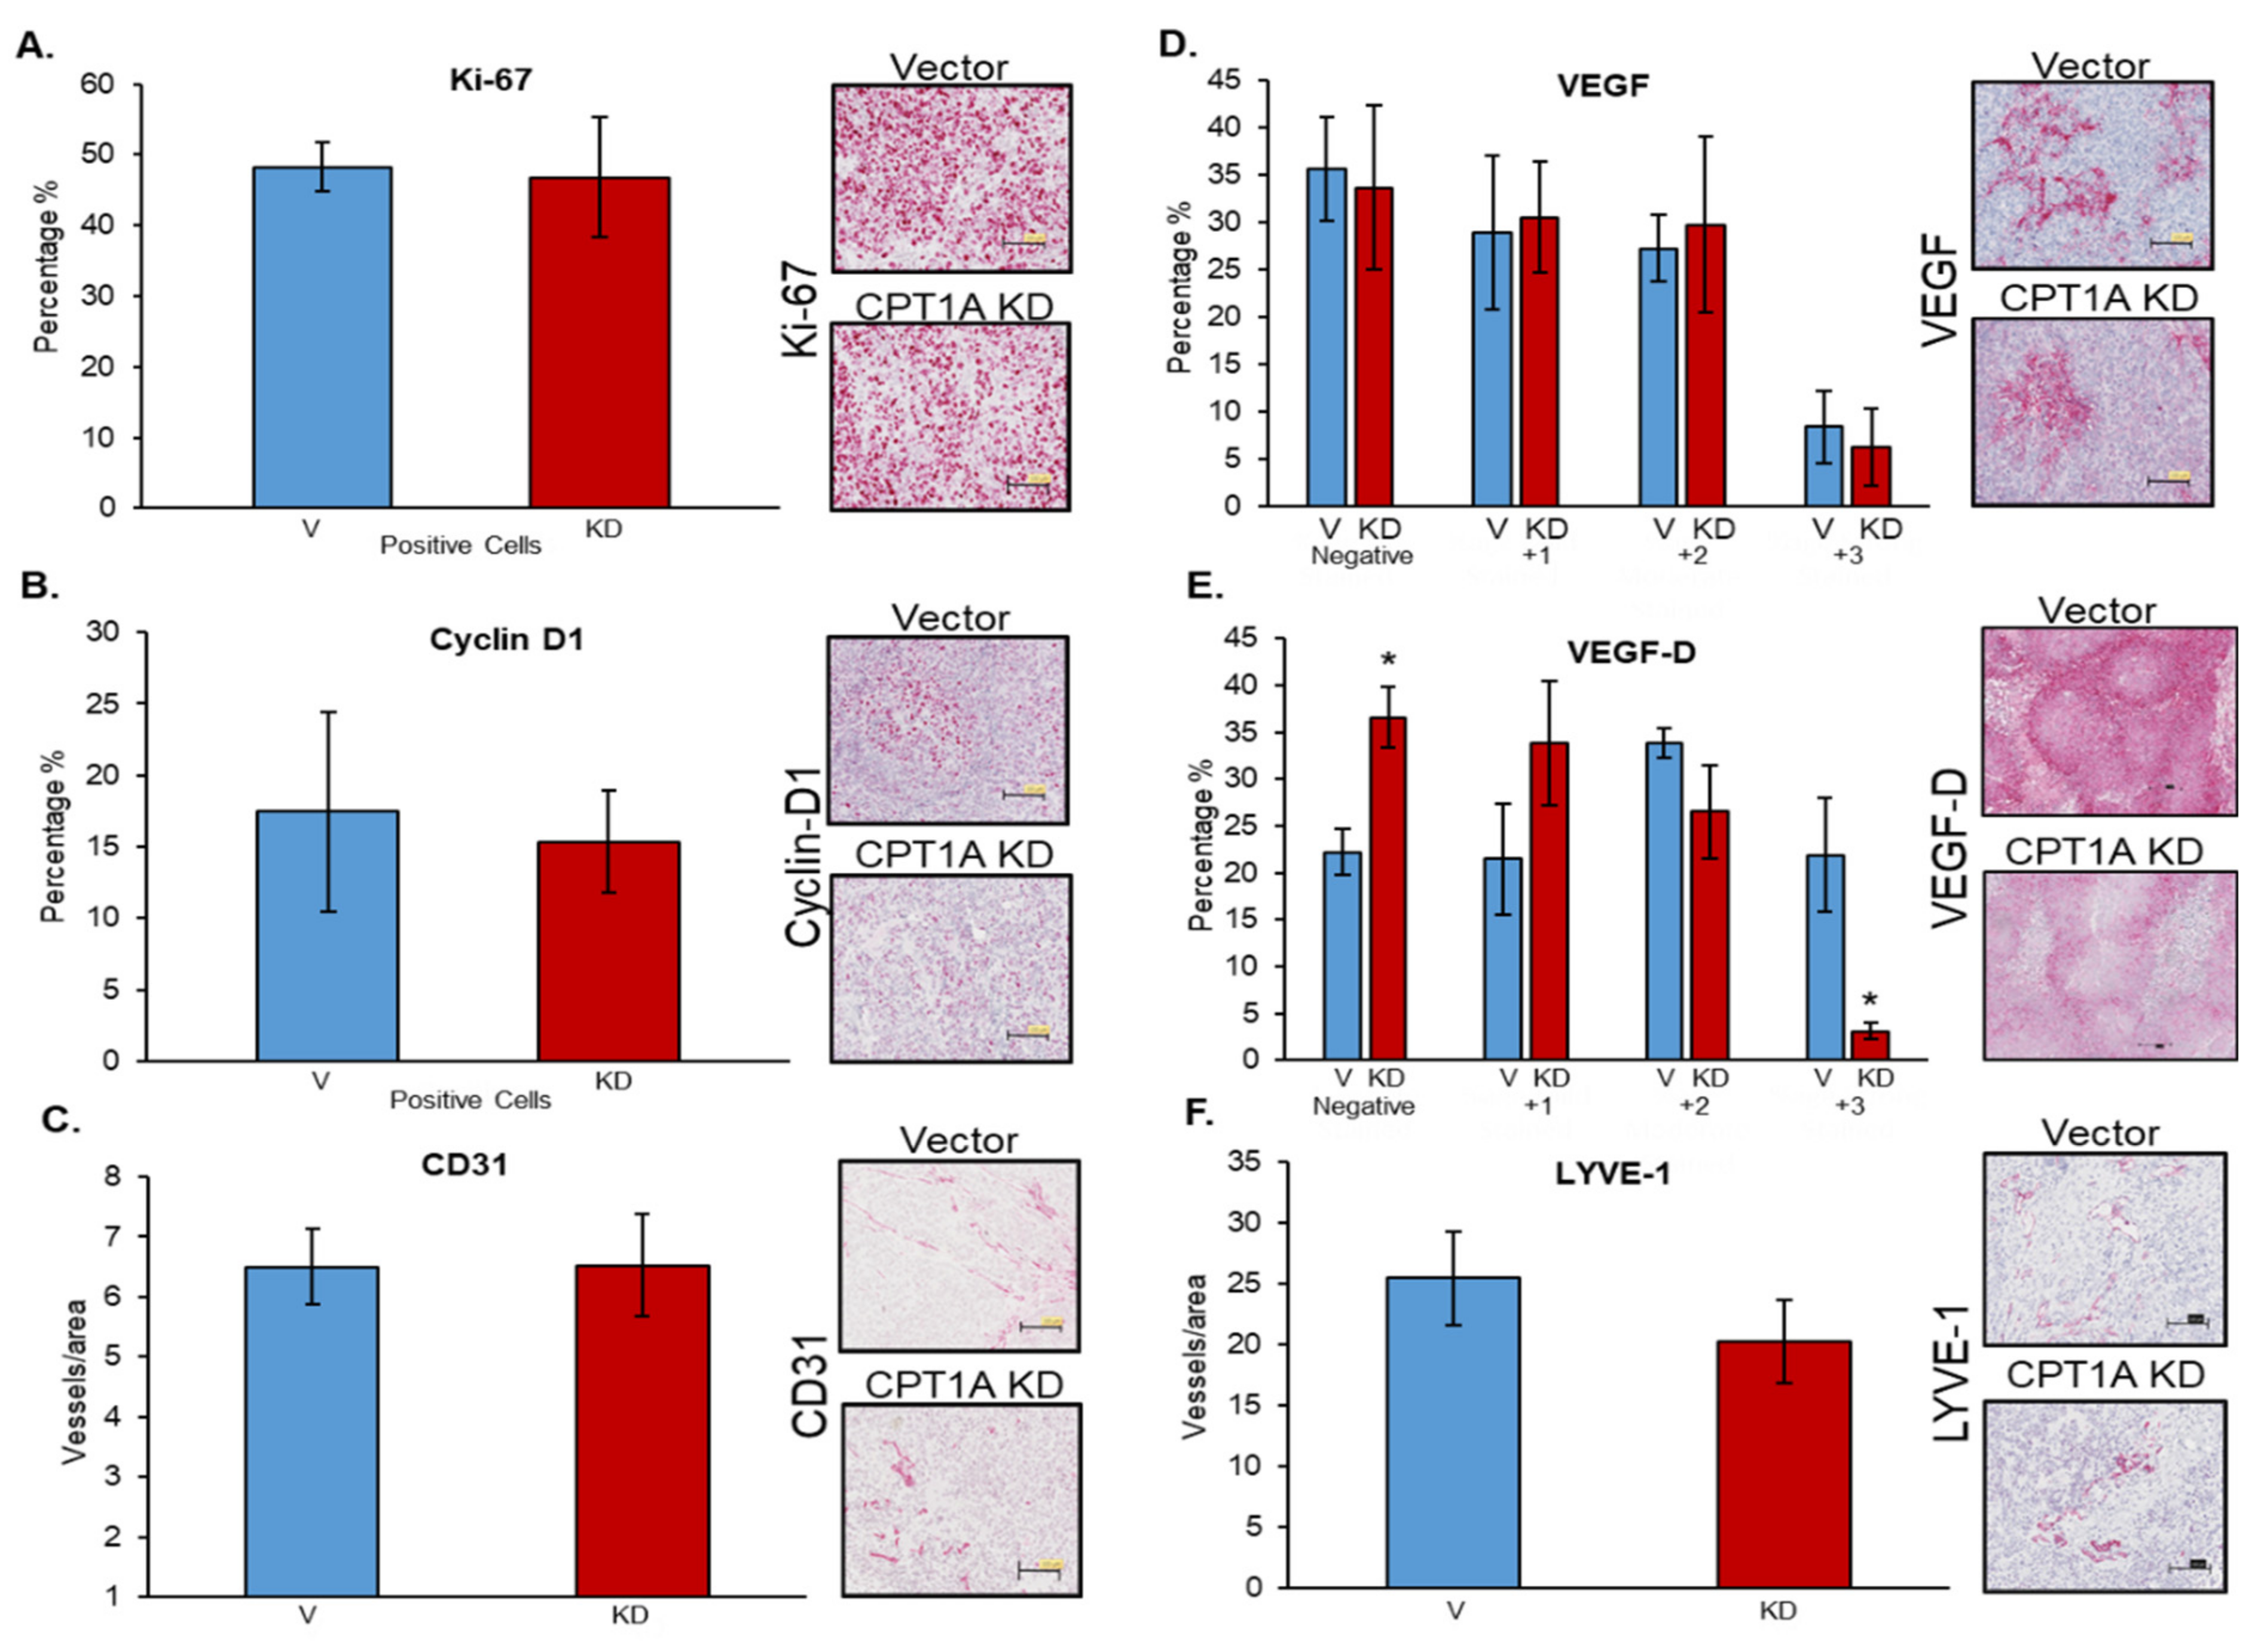
3.6. Effects of CPT1A Knockdown on Proliferation-, Angiogenesis-, and Lymphangiogenesis-Related Biomarkers
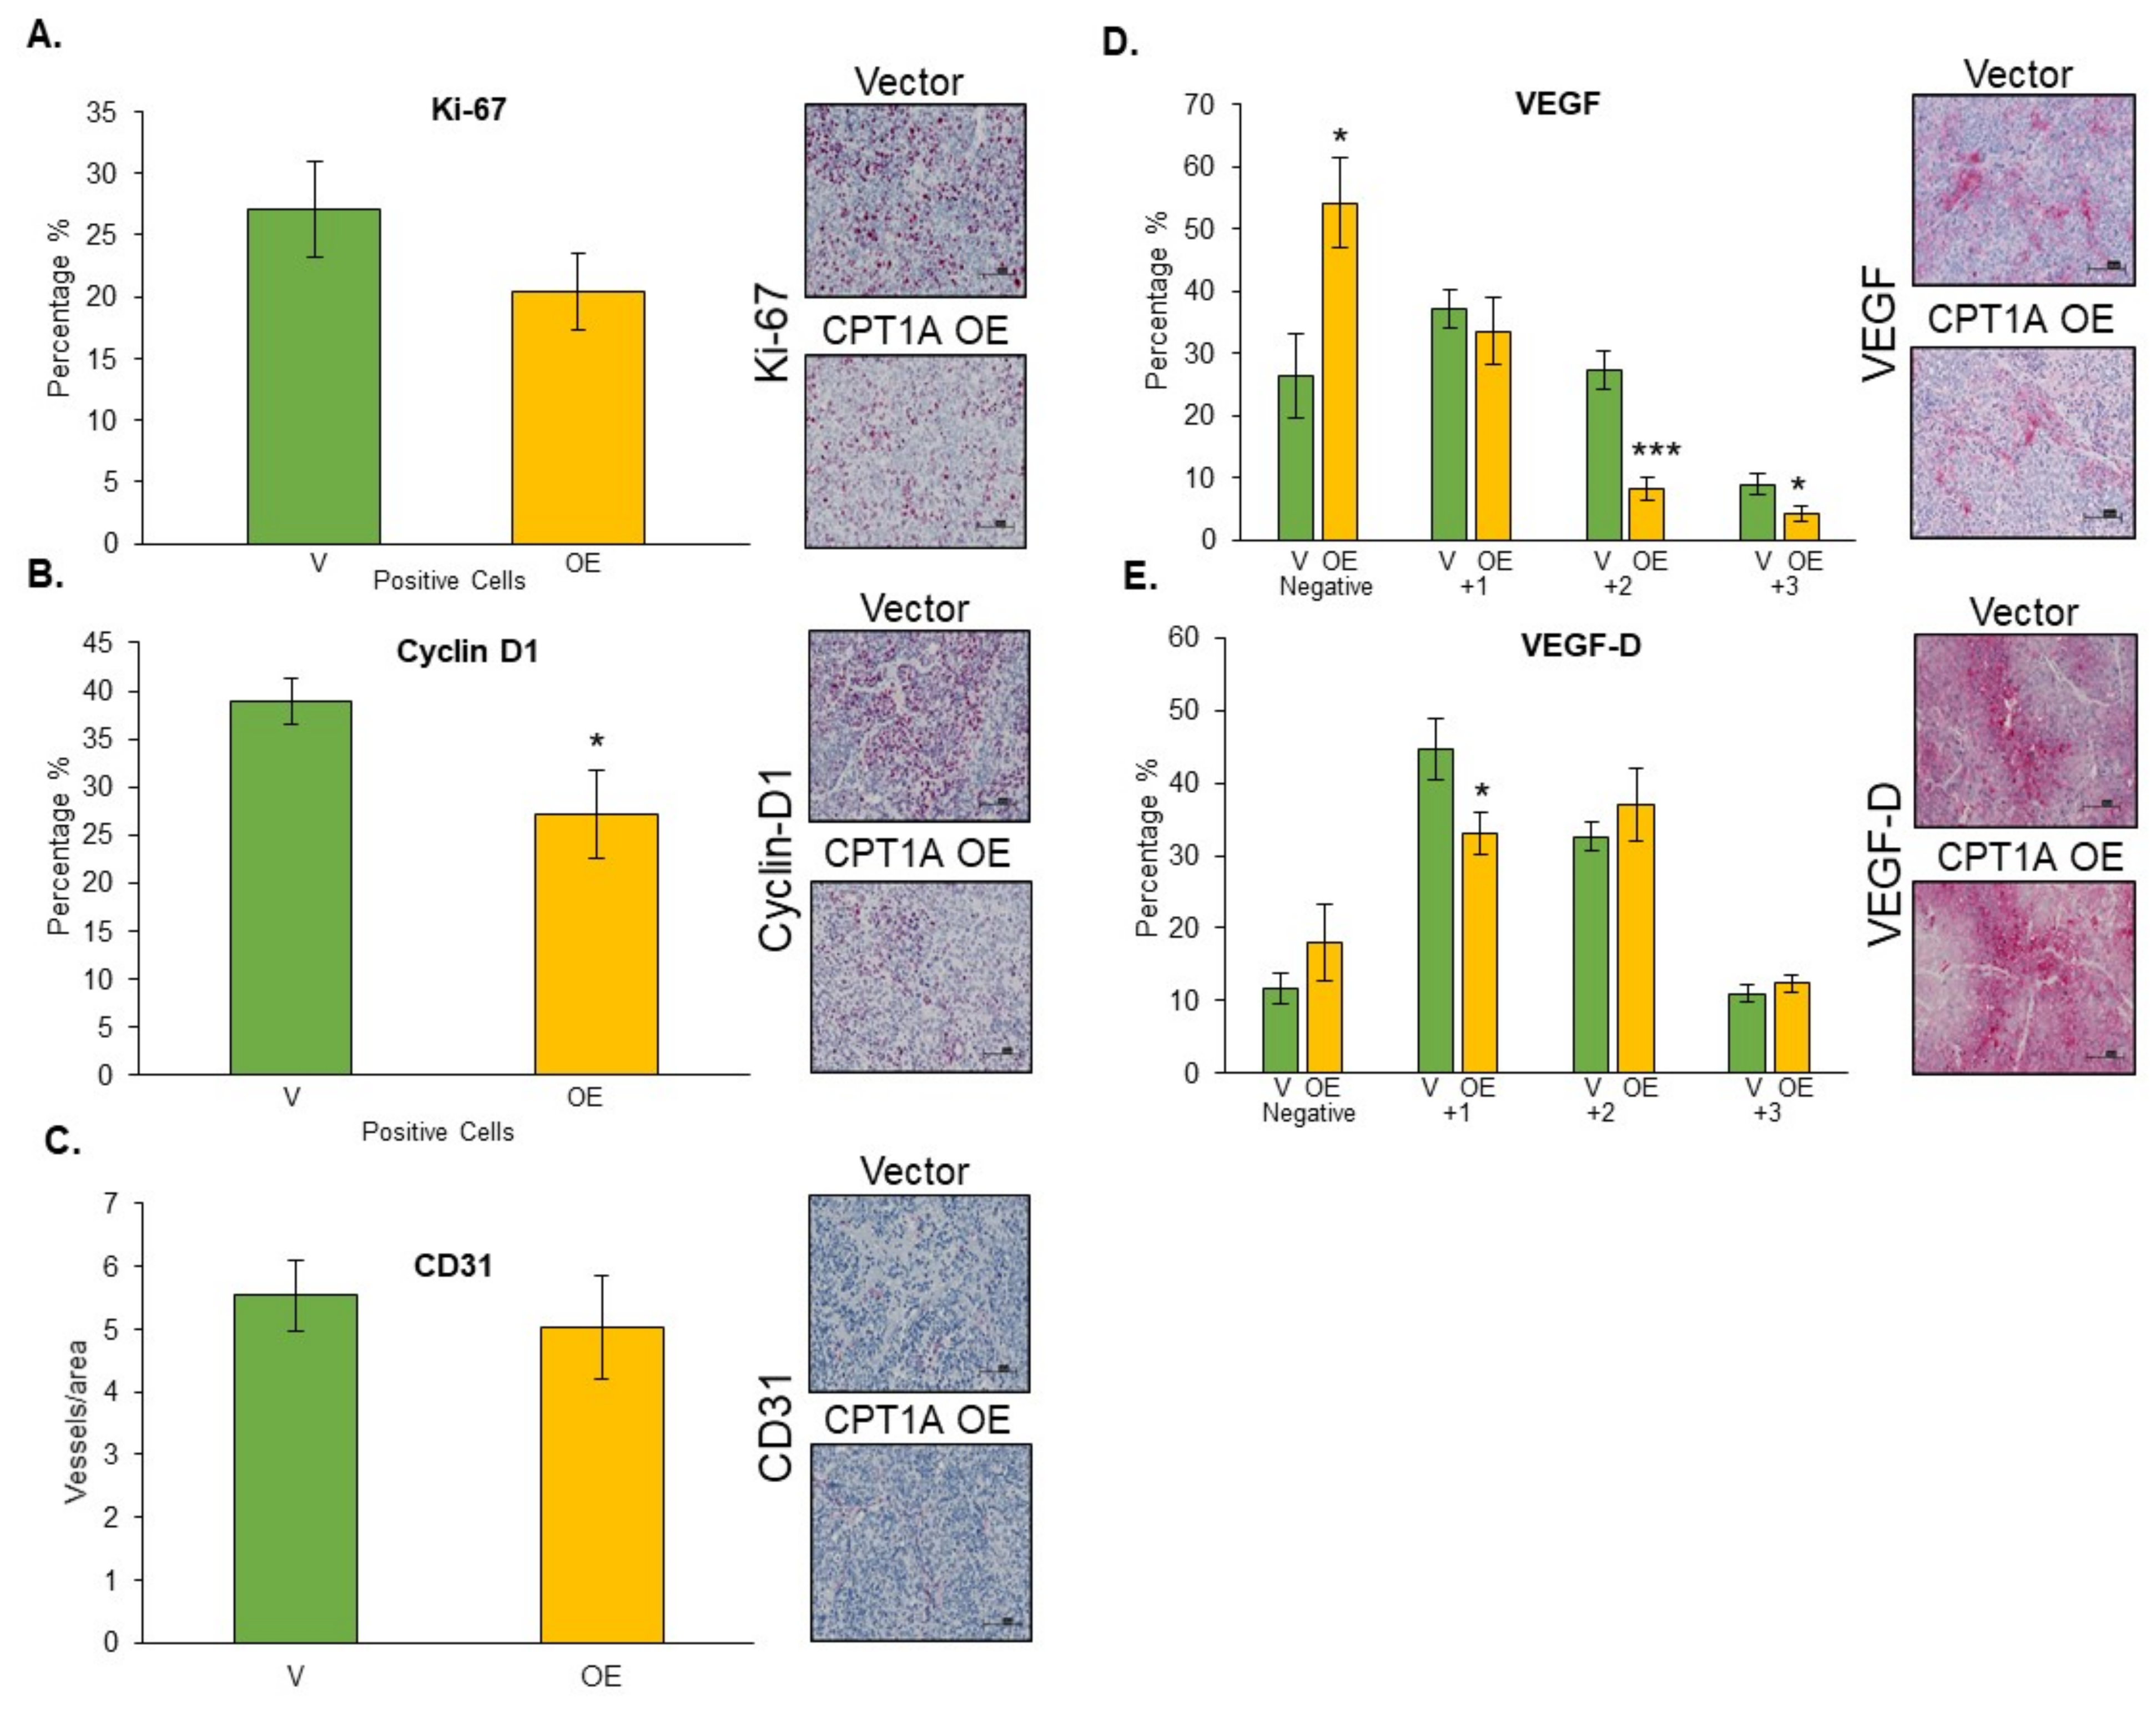
3.7. Effects of CPT1A Overexpression on Proliferation-, Angiogenesis-, and Lymphangiogenesis-Related Biomarkers
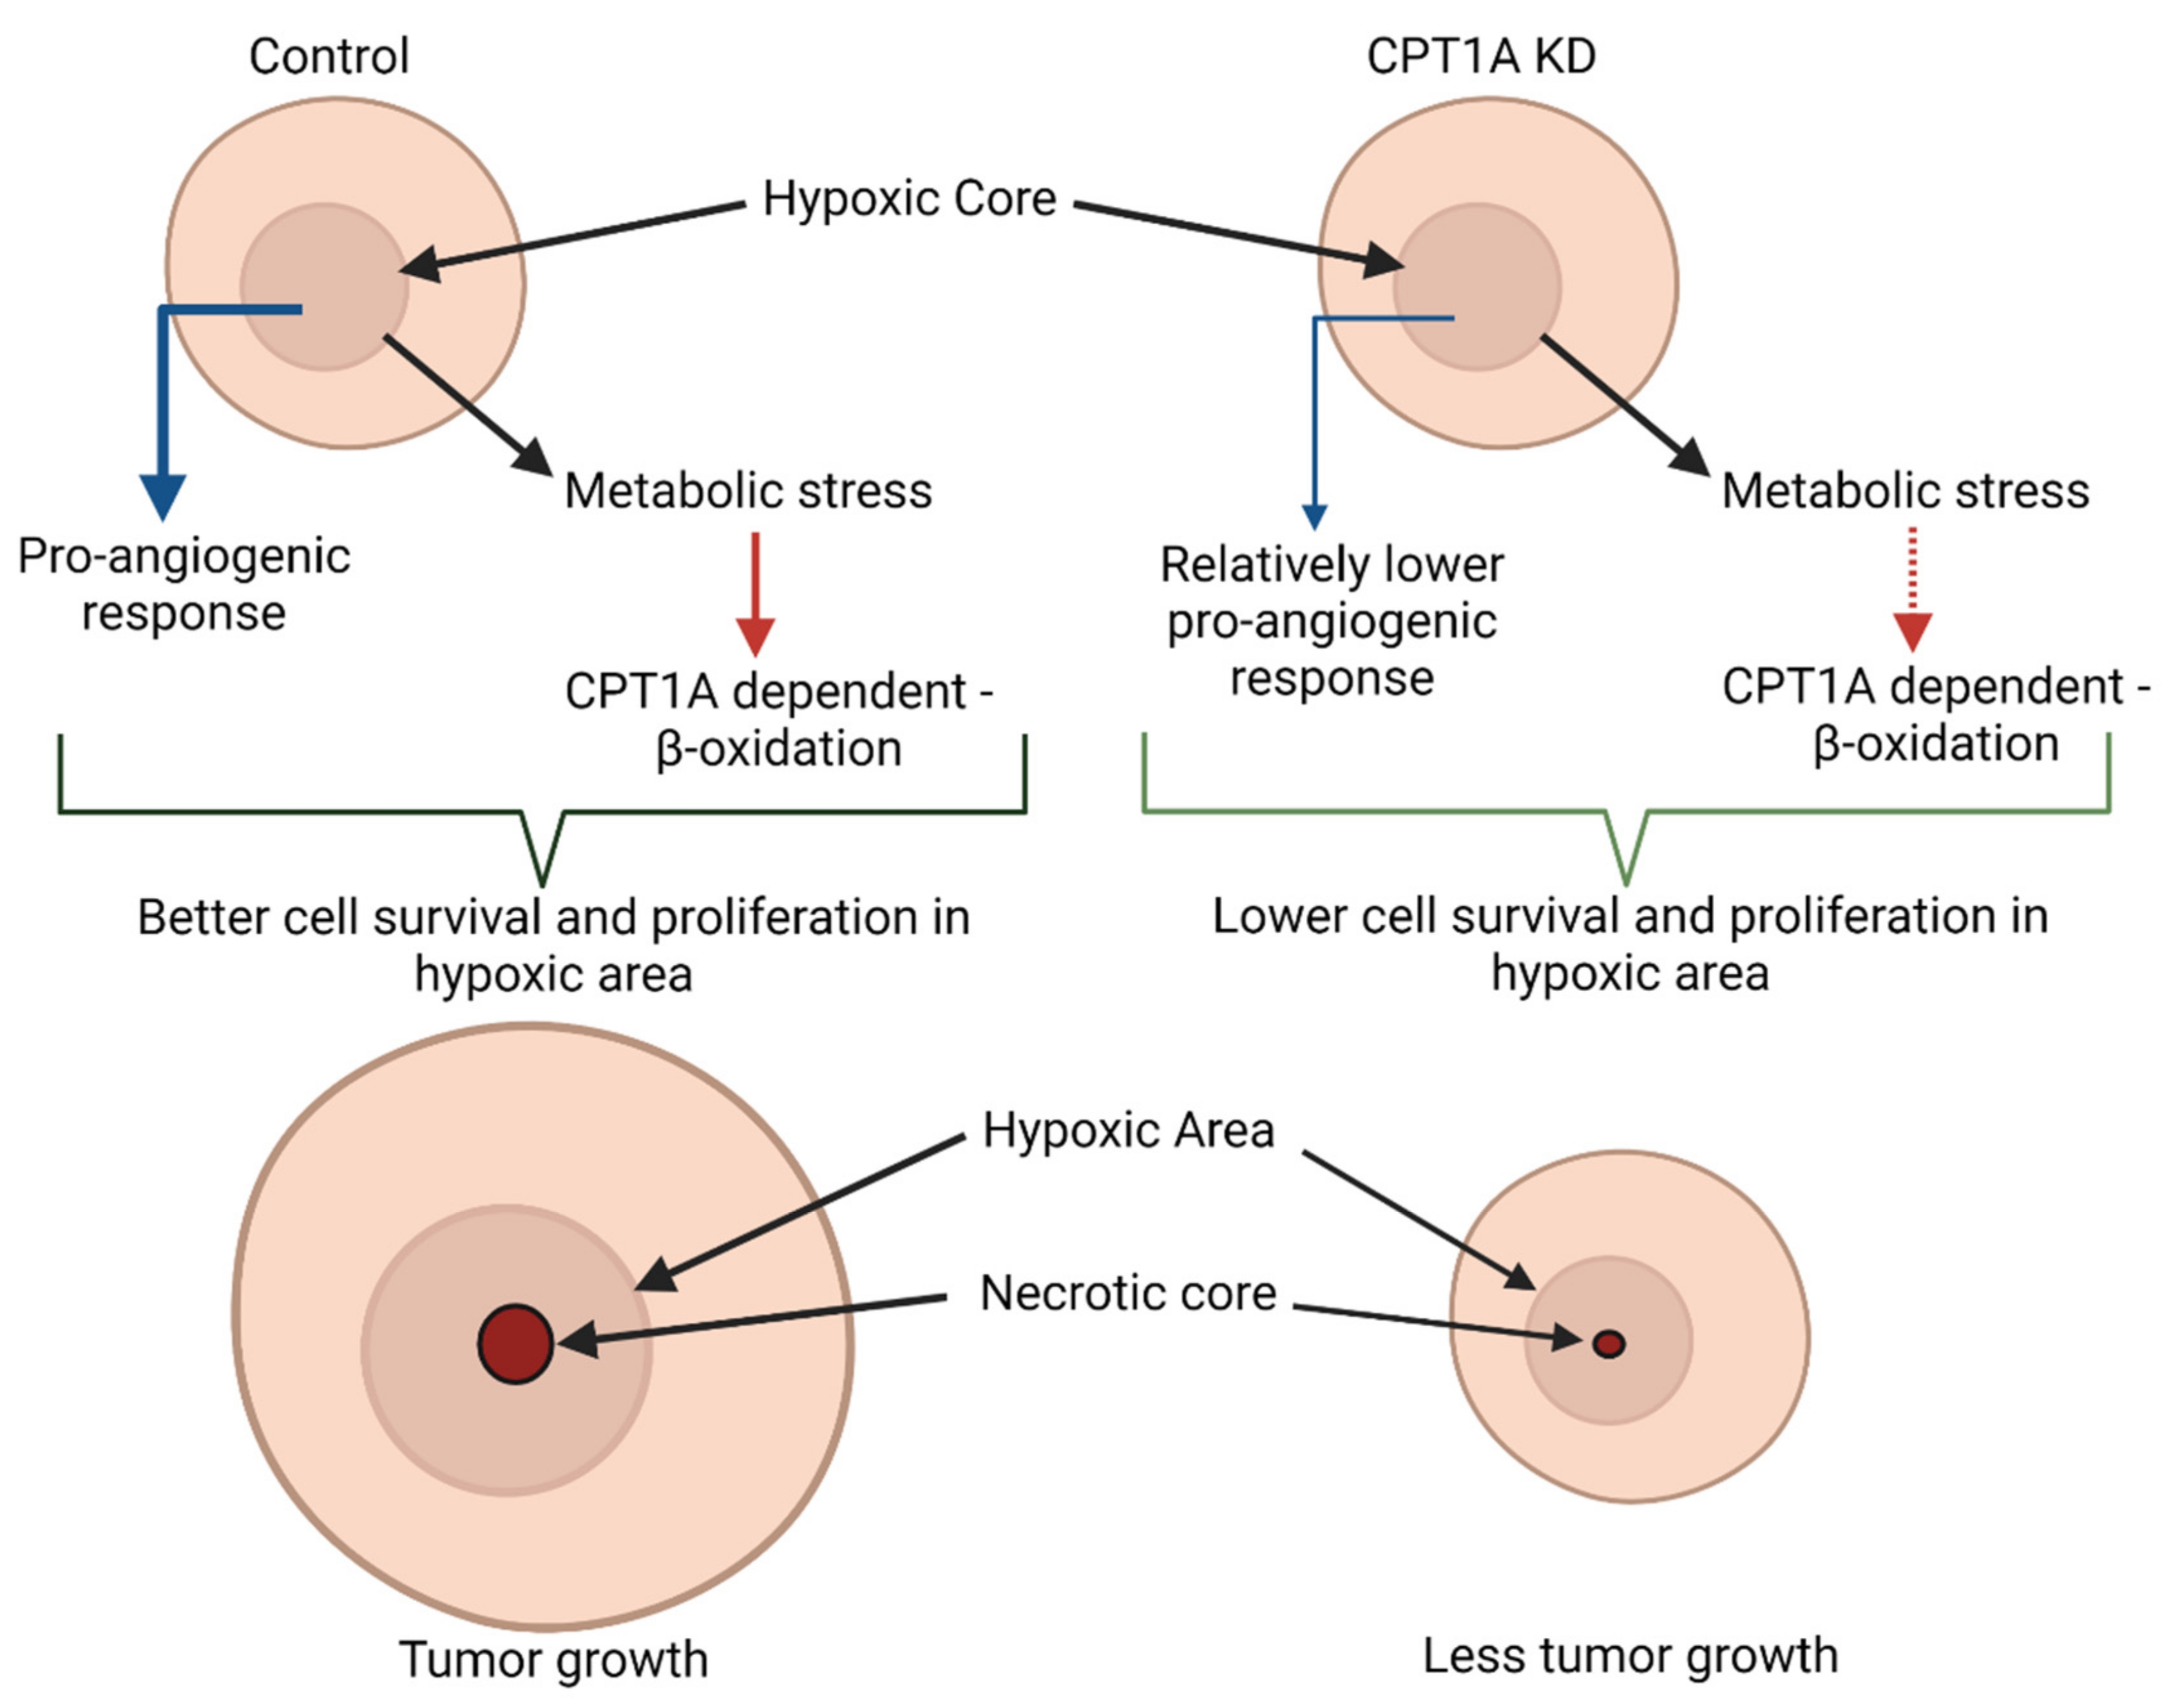
4. Discussion
5. Conclusions
Supplementary Materials
Author Contributions
Funding
Institutional Review Board Statement
Informed Consent Statement
Data Availability Statement
Conflicts of Interest
References
- Siegel, R.L.; Miller, K.D.; Fuchs, H.E.; Jemal, A. Cancer Statistics, 2021. CA Cancer J. Clin. 2021, 71, 7–33. [Google Scholar] [CrossRef] [PubMed]
- DeSantis, C.E.; Miller, K.D.; Goding Sauer, A.; Jemal, A.; Siegel, R.L. Cancer statistics for African Americans, 2019. CA Cancer J. Clin. 2019, 69, 211–233. [Google Scholar] [CrossRef] [Green Version]
- Attard, G.; Parker, C.; Eeles, R.A.; Schroder, F.; Tomlins, S.A.; Tannock, I.; Drake, C.G.; de Bono, J.S. Prostate cancer. Lancet 2016, 387, 70–82. [Google Scholar] [CrossRef]
- Davies, A.; Conteduca, V.; Zoubeidi, A.; Beltran, H. Biological Evolution of Castration-resistant Prostate Cancer. Eur. Urol. Focus 2019, 5, 147–154. [Google Scholar] [CrossRef]
- Knudsen, K.E.; Scher, H.I. Starving the addiction: New opportunities for durable suppression of AR signaling in prostate cancer. Clin. Cancer Res. 2009, 15, 4792–4798. [Google Scholar] [CrossRef] [PubMed] [Green Version]
- Deep, G.; Panigrahi, G.K. Hypoxia-Induced Signaling Promotes Prostate Cancer Progression: Exosomes Role as Messenger of Hypoxic Response in Tumor Microenvironment. Crit. Rev. Oncog. 2015, 20, 419–434. [Google Scholar] [CrossRef] [Green Version]
- Turaka, A.; Buyyounouski, M.K.; Hanlon, A.L.; Horwitz, E.M.; Greenberg, R.E.; Movsas, B. Hypoxic prostate/muscle PO2 ratio predicts for outcome in patients with localized prostate cancer: Long-term results. Int. J. Radiat. Oncol. Biol. Phys. 2012, 82, e433–e439. [Google Scholar] [CrossRef]
- Milosevic, M.; Warde, P.; Menard, C.; Chung, P.; Toi, A.; Ishkanian, A.; McLean, M.; Pintilie, M.; Sykes, J.; Gospodarowicz, M.; et al. Tumor hypoxia predicts biochemical failure following radiotherapy for clinically localized prostate cancer. Clin. Cancer Res. 2012, 18, 2108–2114. [Google Scholar] [CrossRef] [PubMed] [Green Version]
- O’Reilly, D.; Johnson, P.; Buchanan, P.J. Hypoxia induced cancer stem cell enrichment promotes resistance to androgen deprivation therapy in prostate cancer. Steroids 2019, 152, 108497. [Google Scholar] [CrossRef] [PubMed]
- Dheeraj, A.; Agarwal, C.; Schlaepfer, I.R.; Raben, D.; Singh, R.; Agarwal, R.; Deep, G. A novel approach to target hypoxic cancer cells via combining beta-oxidation inhibitor etomoxir with radiation. Hypoxia 2018, 6, 23–33. [Google Scholar] [CrossRef] [PubMed] [Green Version]
- Wigerup, C.; Pahlman, S.; Bexell, D. Therapeutic targeting of hypoxia and hypoxia-inducible factors in cancer. Pharmacol. Ther. 2016, 164, 152–169. [Google Scholar] [CrossRef] [Green Version]
- Pires, I.M.; Olcina, M.M.; Anbalagan, S.; Pollard, J.R.; Reaper, P.M.; Charlton, P.A.; McKenna, W.G.; Hammond, E.M. Targeting radiation-resistant hypoxic tumour cells through ATR inhibition. Br. J. Cancer 2012, 107, 291–299. [Google Scholar] [CrossRef] [Green Version]
- Bensaad, K.; Favaro, E.; Lewis, C.A.; Peck, B.; Lord, S.; Collins, J.M.; Pinnick, K.E.; Wigfield, S.; Buffa, F.M.; Li, J.L.; et al. Fatty acid uptake and lipid storage induced by HIF-1alpha contribute to cell growth and survival after hypoxia-reoxygenation. Cell Rep. 2014, 9, 349–365. [Google Scholar] [CrossRef] [Green Version]
- Huang, D.; Li, T.; Li, X.; Zhang, L.; Sun, L.; He, X.; Zhong, X.; Jia, D.; Song, L.; Semenza, G.L.; et al. HIF-1-mediated suppression of acyl-CoA dehydrogenases and fatty acid oxidation is critical for cancer progression. Cell Rep. 2014, 8, 1930–1942. [Google Scholar] [CrossRef] [PubMed] [Green Version]
- Metallo, C.M.; Gameiro, P.A.; Bell, E.L.; Mattaini, K.R.; Yang, J.; Hiller, K.; Jewell, C.M.; Johnson, Z.R.; Irvine, D.J.; Guarente, L.; et al. Reductive glutamine metabolism by IDH1 mediates lipogenesis under hypoxia. Nature 2011, 481, 380–384. [Google Scholar] [CrossRef] [PubMed] [Green Version]
- Sun, R.C.; Denko, N.C. Hypoxic regulation of glutamine metabolism through HIF1 and SIAH2 supports lipid synthesis that is necessary for tumor growth. Cell Metab. 2014, 19, 285–292. [Google Scholar] [CrossRef] [Green Version]
- Flaig, T.W.; Salzmann-Sullivan, M.; Su, L.J.; Zhang, Z.; Joshi, M.; Gijon, M.A.; Kim, J.; Arcaroli, J.J.; Van Bokhoven, A.; Lucia, M.S.; et al. Lipid catabolism inhibition sensitizes prostate cancer cells to antiandrogen blockade. Oncotarget 2017, 8, 56051–56065. [Google Scholar] [CrossRef] [PubMed] [Green Version]
- Schlaepfer, I.R.; Joshi, M. CPT1A-mediated Fat Oxidation, Mechanisms, and Therapeutic Potential. Endocrinology 2020, 161, bqz046. [Google Scholar] [CrossRef] [PubMed]
- Schlaepfer, I.R.; Nambiar, D.K.; Ramteke, A.; Kumar, R.; Dhar, D.; Agarwal, C.; Bergman, B.; Graner, M.; Maroni, P.; Singh, R.P.; et al. Hypoxia induces triglycerides accumulation in prostate cancer cells and extracellular vesicles supporting growth and invasiveness following reoxygenation. Oncotarget 2015, 6, 22836–22856. [Google Scholar] [CrossRef] [PubMed]
- Deep, G.; Schlaepfer, I.R. Aberrant Lipid Metabolism Promotes Prostate Cancer: Role in Cell Survival under Hypoxia and Extracellular Vesicles Biogenesis. Int. J. Mol. Sci. 2016, 17, 1061. [Google Scholar] [CrossRef] [PubMed] [Green Version]
- Schlaepfer, I.R.; Rider, L.; Rodrigues, L.U.; Gijon, M.A.; Pac, C.T.; Romero, L.; Cimic, A.; Sirintrapun, S.J.; Glode, L.M.; Eckel, R.H.; et al. Lipid catabolism via CPT1 as a therapeutic target for prostate cancer. Mol. Cancer Ther. 2014, 13, 2361–2371. [Google Scholar] [CrossRef] [PubMed] [Green Version]
- Joshi, M.; Stoykova, G.E.; Salzmann-Sullivan, M.; Dzieciatkowska, M.; Liebman, L.N.; Deep, G.; Schlaepfer, I.R. CPT1A Supports Castration-Resistant Prostate Cancer in Androgen-Deprived Conditions. Cells 2019, 8, 1115. [Google Scholar] [CrossRef] [Green Version]
- Sramkoski, R.M.; Pretlow, T.G., 2nd; Giaconia, J.M.; Pretlow, T.P.; Schwartz, S.; Sy, M.S.; Marengo, S.R.; Rhim, J.S.; Zhang, D.; Jacobberger, J.W. A new human prostate carcinoma cell line, 22Rv1. In Vitro Cell Dev. Biol. Anim. 1999, 35, 403–409. [Google Scholar] [CrossRef] [PubMed]
- Peak, T.C.; Panigrahi, G.K.; Praharaj, P.P.; Su, Y.; Shi, L.; Chyr, J.; Rivera-Chavez, J.; Flores-Bocanegra, L.; Singh, R.; Vander Griend, D.J.; et al. Syntaxin 6-mediated exosome secretion regulates enzalutamide resistance in prostate cancer. Mol. Carcinog. 2020, 59, 62–72. [Google Scholar] [CrossRef] [PubMed]
- Gao, J.; Aksoy, B.A.; Dogrusoz, U.; Dresdner, G.; Gross, B.; Sumer, S.O.; Sun, Y.; Jacobsen, A.; Sinha, R.; Larsson, E.; et al. Integrative analysis of complex cancer genomics and clinical profiles using the cBioPortal. Sci. Signal. 2013, 6, pl1. [Google Scholar] [CrossRef] [PubMed] [Green Version]
- Cerami, E.; Gao, J.; Dogrusoz, U.; Gross, B.E.; Sumer, S.O.; Aksoy, B.A.; Jacobsen, A.; Byrne, C.J.; Heuer, M.L.; Larsson, E.; et al. The cBio cancer genomics portal: An open platform for exploring multidimensional cancer genomics data. Cancer Discov. 2012, 2, 401–404. [Google Scholar] [CrossRef] [Green Version]
- Kim, H.; Yoon, S.C.; Lee, T.Y.; Jeong, D. Discriminative cytotoxicity assessment based on various cellular damages. Toxicol. Lett. 2009, 184, 13–17. [Google Scholar] [CrossRef]
- Qu, Q.; Zeng, F.; Liu, X.; Wang, Q.J.; Deng, F. Fatty acid oxidation and carnitine palmitoyltransferase I: Emerging therapeutic targets in cancer. Cell Death Dis. 2016, 7, e2226. [Google Scholar] [CrossRef]
- Gross, M.W.; Karbach, U.; Groebe, K.; Franko, A.J.; Mueller-Klieser, W. Calibration of misonidazole labeling by simultaneous measurement of oxygen tension and labeling density in multicellular spheroids. Int. J. Cancer 1995, 61, 567–573. [Google Scholar] [CrossRef]
- Schluter, A.; Weller, P.; Kanaan, O.; Nel, I.; Heusgen, L.; Hoing, B.; Hasskamp, P.; Zander, S.; Mandapathil, M.; Dominas, N.; et al. CD31 and VEGF are prognostic biomarkers in early-stage, but not in late-stage, laryngeal squamous cell carcinoma. BMC Cancer 2018, 18, 272. [Google Scholar] [CrossRef] [Green Version]
- Plate, K. From angiogenesis to lymphangiogenesis. Nat. Med. 2001, 7, 151–152. [Google Scholar] [CrossRef] [PubMed]
- Jackson, D.G.; Prevo, R.; Clasper, S.; Banerji, S. LYVE-1, the lymphatic system and tumor lymphangiogenesis. Trends Immunol. 2001, 22, 317–321. [Google Scholar] [CrossRef]
- Teo, M.Y.; Rathkopf, D.E.; Kantoff, P. Treatment of Advanced Prostate Cancer. Annu. Rev. Med. 2019, 70, 479–499. [Google Scholar] [CrossRef] [PubMed]
- Yasuda, M.; Shimizu, M.; Fujita, M.; Miyazawa, M.; Tang, X.; Kajiwara, H.; Osamura, R.Y.; Shoji, S.; Tokunaga, M.; Terachi, T. Usefulness of hypoxia inducible factor-1 alpha in evaluating the prostatic adenocarcinoma viability following neoadjuvant hormone therapy. Cancer Detect. Prev. 2007, 31, 396–401. [Google Scholar] [CrossRef] [PubMed]
- Stewart, G.D.; Gray, K.; Pennington, C.J.; Edwards, D.R.; Riddick, A.C.; Ross, J.A.; Habib, F.K. Analysis of hypoxia-associated gene expression in prostate cancer: Lysyl oxidase and glucose transporter-1 expression correlate with Gleason score. Oncol. Rep. 2008, 20, 1561–1567. [Google Scholar] [CrossRef] [PubMed] [Green Version]
- Vergis, R.; Corbishley, C.M.; Norman, A.R.; Bartlett, J.; Jhavar, S.; Borre, M.; Heeboll, S.; Horwich, A.; Huddart, R.; Khoo, V.; et al. Intrinsic markers of tumour hypoxia and angiogenesis in localised prostate cancer and outcome of radical treatment: A retrospective analysis of two randomised radiotherapy trials and one surgical cohort study. Lancet Oncol. 2008, 9, 342–351. [Google Scholar] [CrossRef]
- Ragnum, H.B.; Vlatkovic, L.; Lie, A.K.; Axcrona, K.; Julin, C.H.; Frikstad, K.M.; Hole, K.H.; Seierstad, T.; Lyng, H. The tumour hypoxia marker pimonidazole reflects a transcriptional programme associated with aggressive prostate cancer. Br. J. Cancer 2015, 112, 382–390. [Google Scholar] [CrossRef] [Green Version]
- Carnell, D.M.; Smith, R.E.; Daley, F.M.; Saunders, M.I.; Bentzen, S.M.; Hoskin, P.J. An immunohistochemical assessment of hypoxia in prostate carcinoma using pimonidazole: Implications for radioresistance. Int. J. Radiat. Oncol. Biol. Phys. 2006, 65, 91–99. [Google Scholar] [CrossRef] [PubMed]
- Hompland, T.; Fjeldbo, C.S.; Lyng, H. Tumor Hypoxia as a Barrier in Cancer Therapy: Why Levels Matter. Cancers 2021, 13, 499. [Google Scholar] [CrossRef]
- Panigrahi, G.K.; Praharaj, P.P.; Peak, T.C.; Long, J.; Singh, R.; Rhim, J.S.; Elmageed, Z.Y.A.; Deep, G. Hypoxia-induced exosome secretion promotes survival of African-American and Caucasian prostate cancer cells. Sci. Rep. 2018, 8, 3853. [Google Scholar] [CrossRef] [PubMed]
- Wong, B.W.; Wang, X.; Zecchin, A.; Thienpont, B.; Cornelissen, I.; Kalucka, J.; Garcia-Caballero, M.; Missiaen, R.; Huang, H.; Bruning, U.; et al. The role of fatty acid beta-oxidation in lymphangiogenesis. Nature 2017, 542, 49–54. [Google Scholar] [CrossRef] [PubMed]
- Beloribi-Djefaflia, S.; Vasseur, S.; Guillaumond, F. Lipid metabolic reprogramming in cancer cells. Oncogenesis 2016, 5, e189. [Google Scholar] [CrossRef]
- Helczynska, K.; Kronblad, A.; Jogi, A.; Nilsson, E.; Beckman, S.; Landberg, G.; Pahlman, S. Hypoxia promotes a dedifferentiated phenotype in ductal breast carcinoma in situ. Cancer Res. 2003, 63, 1441–1444. [Google Scholar] [PubMed]
- Messmer-Blust, A.; An, X.; Li, J. Hypoxia-regulated angiogenic inhibitors. Trends Cardiovasc. Med. 2009, 19, 252–256. [Google Scholar] [CrossRef] [Green Version]
- Gaustad, J.-V.; Simonsen, T.G.; Andersen, L.M.K.; Rofstad, E.K. Vascular abnormalities and development of hypoxia in microscopic melanoma xenografts. J. Transl. Med. 2017, 15, 241. [Google Scholar] [CrossRef] [PubMed] [Green Version]
- O’Connor, R.S.; Guo, L.; Ghassemi, S.; Snyder, N.W.; Worth, A.J.; Weng, L.; Kam, Y.; Philipson, B.; Trefely, S.; Nunez-Cruz, S.; et al. The CPT1a inhibitor, etomoxir induces severe oxidative stress at commonly used concentrations. Sci. Rep. 2018, 8, 6289. [Google Scholar] [CrossRef] [Green Version]
- Holubarsch, C.J.; Rohrbach, M.; Karrasch, M.; Boehm, E.; Polonski, L.; Ponikowski, P.; Rhein, S. A double-blind randomized multicentre clinical trial to evaluate the efficacy and safety of two doses of etomoxir in comparison with placebo in patients with moderate congestive heart failure: The ERGO (etomoxir for the recovery of glucose oxidation) study. Clin. Sci. 2007, 113, 205–212. [Google Scholar] [CrossRef] [PubMed]
- Yao, C.H.; Liu, G.Y.; Wang, R.; Moon, S.H.; Gross, R.W.; Patti, G.J. Identifying off-target effects of etomoxir reveals that carnitine palmitoyltransferase I is essential for cancer cell proliferation independent of beta-oxidation. PLoS Biol. 2018, 16, e2003782. [Google Scholar] [CrossRef] [PubMed] [Green Version]
- Masaki, Y.; Shimizu, Y.; Yoshioka, T.; Feng, F.; Zhao, S.; Higashino, K.; Numata, Y.; Kuge, Y. Imaging Mass Spectrometry Revealed the Accumulation Characteristics of the 2-Nitroimidazole-Based Agent “Pimonidazole” in Hypoxia. PLoS ONE 2016, 11, e0161639. [Google Scholar] [CrossRef]


Publisher’s Note: MDPI stays neutral with regard to jurisdictional claims in published maps and institutional affiliations. |
© 2021 by the authors. Licensee MDPI, Basel, Switzerland. This article is an open access article distributed under the terms and conditions of the Creative Commons Attribution (CC BY) license (https://creativecommons.org/licenses/by/4.0/).
Share and Cite
Rios-Colon, L.; Kumar, P.; Kim, S.; Sharma, M.; Su, Y.; Kumar, A.; Singh, S.; Stocks, N.; Liu, L.; Joshi, M.; et al. Carnitine Palmitoyltransferase 1 Regulates Prostate Cancer Growth under Hypoxia. Cancers 2021, 13, 6302. https://doi.org/10.3390/cancers13246302
Rios-Colon L, Kumar P, Kim S, Sharma M, Su Y, Kumar A, Singh S, Stocks N, Liu L, Joshi M, et al. Carnitine Palmitoyltransferase 1 Regulates Prostate Cancer Growth under Hypoxia. Cancers. 2021; 13(24):6302. https://doi.org/10.3390/cancers13246302
Chicago/Turabian StyleRios-Colon, Leslimar, Pawan Kumar, Susy Kim, Mitu Sharma, Yixin Su, Ashish Kumar, Sangeeta Singh, Nalexus Stocks, Liang Liu, Molishree Joshi, and et al. 2021. "Carnitine Palmitoyltransferase 1 Regulates Prostate Cancer Growth under Hypoxia" Cancers 13, no. 24: 6302. https://doi.org/10.3390/cancers13246302