Article

Analysis of Circulating Tumour Cells in Early-Stage Uveal Melanoma: Evaluation of Tumour Marker Expression to Increase Capture

1
School of Medical and Health Sciences, Edith Cowan University, Joondalup, WA 6027, Australia
2
Centre for Precision Health, Edith Cowan University, Joondalup, WA 6027, Australia
3
Perth Retina, Subiaco, WA 6008, Australia
4
Centre for Ophthalmology and Visual Science (Incorporating Lions Eye Institute), The University of Western Australia, Perth, WA 6000, Australia
5
Department of Ophthalmology, Royal Perth Hospital, Perth, WA 6000, Australia
6
Anatomical Pathology, PathWest Laboratory Medicine, Fiona Stanley Hospital, Murdoch, WA 6150, Australia
7
Anatomical Pathology, PathWest Laboratory Medicine, Royal Perth Hospital, Perth, WA 6000, Australia
8
Royal Victorian Eye & Ear Hospital, Melbourne, VIC 3000, Australia
9
Ocular Oncology Unit, Sydney Eye Hospital and The Kinghorn Cancer Centre, Sydney, NSW 2000, Australia
10
Save Sight Institute, The University of Sydney, Sydney, NSW 2000, Australia
11
School of Biomedical Sciences, University of Western Australia, Perth, WA 6000, Australia
*
Author to whom correspondence should be addressed.
Cancers 2021, 13(23), 5990; https://doi.org/10.3390/cancers13235990
Submission received: 7 November 2021 / Revised: 23 November 2021 / Accepted: 24 November 2021 / Published: 28 November 2021
(This article belongs to the Special Issue Uveal Melanoma: From Diagnosis to Therapy)

Abstract

:

Simple Summary

Approximately 50% of patients with uveal melanoma will develop incurable metastatic disease. This can be predicted, but requires a biopsy of the eye, which outside of centres of excellence, are not routinely performed. Given that uveal melanoma spreads through the blood, utilising circulating tumour cells from the blood might provide an alternative minimally invasive method to avoid the biopsy. However, the clinical application hinges on the detection rate of circulating tumour cells. Herein we assessed markers to improve the capture and detection of uveal melanoma circulating tumour cells and found that they could be detected in 86% of patients. We further found that ≥3 circulating tumour cells was significantly associated with worse survival.

Abstract

(1) Background: The stratification of uveal melanoma (UM) patients into prognostic groups is critical for patient management and for directing patients towards clinical trials. Current classification is based on clinicopathological and molecular features of the tumour. Analysis of circulating tumour cells (CTCs) has been proposed as a tool to avoid invasive biopsy of the primary tumour. However, the clinical utility of such liquid biopsy depends on the detection rate of CTCs. (2) Methods: The expression of melanoma, melanocyte, and stem cell markers was tested in a primary tissue microarray (TMA) and UM cell lines. Markers found to be highly expressed in primary UM were used to either immunomagnetically isolate or immunostain UM CTCs prior to treatment of the primary lesion. (3) Results: TMA and cell lines had heterogeneous expression of common melanoma, melanocyte, and stem cell markers. A multi-marker panel of immunomagnetic beads enabled isolation of CTCs in 37/43 (86%) patients with UM. Detection of three or more CTCs using the multi-marker panel, but not MCSP alone, was a significant predictor of shorter progression free (p = 0.040) and overall (p = 0.022) survival. (4) Conclusions: The multi-marker immunomagnetic isolation protocol enabled the detection of CTCs in most primary UM patients. Overall, our results suggest that a multi-marker approach could be a powerful tool for CTC separation for non-invasive prognostication of UM.

1. Introduction

Uveal melanoma (UM) is the most common primary intraocular malignancy and the leading cause of death because of intraocular disease in adults [1]. Despite improvement in the treatment of the primary UM, overall survival has not changed significantly in the last 30 years [2]. Even with successful control of the primary tumour, incurable metastatic disease will ultimately develop in up to 50% of patients [3]. Extensive analysis of primary UMs has defined molecular features of the tumour cells that predict, with high accuracy, a patient’s risk for developing metastases. Highly predictive biomarkers of poor prognosis include histopathological features of the tumour, and chromosome alterations, including monosomy 3 together with 8q-gain [4,5], which correlate with the FDA approved gene expression profile test, DecisionDx-UM [6]. Although distinct biomarker profiles have been validated for personalised patient management, invasive surgical procedures with significant risk of sight-threatening complications are required in order to obtain sufficient tumour tissue for molecular analysis [7]. Routine implementation of less invasive strategies would enable early detection of metastasis and/or implementation of pre-emptive treatment strategies.
Given that metastasis in UM arises from haematogenous dissemination, investigation of circulating tumour cells (CTCs) could provide a unique opportunity for genetic analysis of the patient’s tumour through a simple and safe blood test. CTCs have been previously detected in early-stage UM patients [8,9,10]. CTCs have been shown to constitute a source of tumour DNA that reflects the genetic landscape of the tumour of origin [10,11,12]. Therefore, CTCs can potentially detect tumour specific mutations and chromosomal copy number variations that predict the risk of metastasis for individual UM patients. To achieve this, CTCs need to be efficiently isolated in early-stage UM cases.
Current methods for isolating UM CTCs involve immunomagnetic capture and size-based filtration. However, the heterogeneous nature of UM cells may pose a significant barrier to the successful isolation and identification of CTCs from all patients, as the CTCs may express different markers [13]. Immunomagnetic capture of UM CTCs by targeting the melanoma-associated chondroitin sulphate proteoglycan (MCSP (also known as CSPG4, NG2)) protein was shown to successfully detect CTCs in patients with primary disease. Previous studies have shown detection of CTCs in 19% (1–5 CTCs per 50 mL of whole blood) [9], 14% (1–8 CTCs per 50 mL of whole blood) [8], and 69% (1–37 per 8 mL of whole blood) [10] of patients. Bidard et al. detected UM CTCs in only 30% of patients with metastatic disease using the CellSearch (Menarini Silicon Biosystems, Florence, Italy) system which targets the melanoma marker MCAM (melanoma cell adhesion molecule) and stains for MCSP [14]. A method using a dual marker enrichment protocol targeting CD63 (NKI/C3) and glycoprotein 100 (surface epitope), allowed for the detection of CTCs in 94% of patients with primary UM [15]. Thus, a multi-marker approach may be key to enriching the capture of CTCs from patients with UM. In fact, our previous study in metastatic cutaneous melanoma showed that targeting multiple membrane proteins resulted in the enrichment of a larger number of CTCs [16]. However, UM is clinically, phenotypically and genetically very different from cutaneous melanoma [17]. Thus, expression of potential markers for CTC isolation needs to be validated in UM tissue.
To enable greater efficacy and accuracy in capturing CTCs from UM patients, we systematically analysed the expression of several markers in a primary UM tumour microarray and in five UM cell lines. We then prospectively analysed a cohort of primary UM patients (n = 43) using a multi-marker capture assay and compared CTC detection rates to the results of our previously reported study (n = 26), in which MCSP alone was used for CTC capture.

2. Materials and Methods

2.1. Patients and Sample Collection

UM patients from the Lions Eye Institute, St John of God Hospital (Subiaco), and Royal Perth Hospital in Perth, Western Australia; The Royal Victorian Ear and Eye Institute, Melbourne, Victoria; and St Vincent’s Hospital, Sydney, New South Wales were enrolled in the study between March 2014 and July 2020. UM was diagnosed by clinical and ultrasound examination performed by a specialist ophthalmologist (ocular oncologists TI, RMC, DM) to evaluate the size and location of the intraocular tumour including the presence of ciliary body involvement. This study received approval from the Human Research Ethics Committee of Edith Cowan University (No. 11543 and No. 18957) and Sir Charles Gairdner Hospital (No. 2013-246 and No. RGS0000003289). Written consent was obtained from all patients under approved human research ethics committee protocols which complied with the Declaration of Helsinki.
Peripheral blood samples were taken prior to radiation plaque insertion or enucleation. For CTC quantification, 8 mL blood was collected in either K2EDTA (BD, Franklin Lakes, NJ, USA) or TransFix CTC-TVTs (Cytomark, Buckingham, UK) tubes and processed within 1 h for EDTA, or 1–72 h for TransFix collected blood.

2.2. Immunohistochemistry

We performed a literature search and selected cell surface markers that could be used in combination to improve the number of CTCs captured and intracellular markers that could improve CTC identification (Table S1).
Immunohistochemistry was performed on 4 µm sections cut from the formalin-fixed paraffin-embedded (FFPE) tissue microarray (TMA) block (Supplementary Methods). Sections were deparaffinised in xylene followed by rehydration in graded ethanol for 3 min each then washed in running deionised H2O (dH2O) for 1 min. Antigen retrieval was performed in an 850W microwave oven for 15 min on 100% power in sodium citrate pH 6.0 buffer (gp100, MART1) or EDTA pH 8.0 buffer (MCAM, Nestin, ABCB5, RANK, 5HT2B, S100β, MCSP). Slides were then cooled for 8 min in running dH2O, permeabilised in Tris-Buffered Saline (TBS) containing 0.025% Triton X-100 (TX-100) in TBS (TBS: 50 mM Tris-Cl, 150 mM NaCl, pH 7.6) for 20 min then immunostained using an EnVision+ Dual Link System-HRP (DAB+) (Dako) according to the manufacturer’s instructions. Briefly, slides were incubated with Endogenous Enzyme Block for 10 min, rinsed 3 times for 5 min in TBS/0.025% TX-100 then incubated overnight at 4 °C with primary antibody diluted in TBS/1% Bovine Serum Albumin (BSA) (Table S1). The following day, slides were washed 5 times for 5 min each in TBS/0.025% TX-100, incubated with Labelled Polymer-HRP for 30 min, rinsed 3 times for 5 min each in TBS/0.025% TX-100, incubated for 5 min with Substrate Chromogen, and then rinsed in dH2O. Slides were counterstained with weak Harris hematoxylin (Sigma) for 8 min, rinsed in running dH2O for 1 min, blued in 0.2% ammonia water for 2 min and mounted with ProLong Gold Antifade Mountant (Thermo Fisher Scientific). Immunostaining for each marker was evaluated by two independent (TV, ABB) unblinded observers as follows: negative (0), weak (1), moderate (2) or strong (3).

2.3. Cell Lines

The cell lines MM28, MP38, MP46, MP65 and MP41 exhibiting genetic profiles typical of UM were kindly donated by Prof Roman-Roman from the Institut Curie, France [18]. Cells were cultured in RPMI 1640 medium supplemented with 20% foetal bovine serum (FBS) at 37 °C in a humidified 5% CO2 incubator.

2.4. Flow Cytometry

MM28, MP38, MP41, MP46, and MP65 cells were harvested by incubation in 5 mM EDTA in RPMI 1640, resuspended then washed 3 times in Fluorescence-activated cell sorting (FACS) buffer (Phosphate-Buffered Saline (PBS) with 0.1% BSA, 25 mM HEPES, 1 mM EDTA, pH 7.0), incubated with primary antibody (Table S1) for 30 min at 4 °C and washed 3 times in FACS buffer. Cells were then incubated with secondary antibody Alexa Fluor 488 conjugated donkey anti-rabbit or anti-mouse Ig (Abcam, Cambridge, UK) diluted 1:500 in FACS buffer for 15 min at room temperature (RT) and washed 3 times in FACS buffer prior to flow cytometric analysis on a Gallios Flow Cytometer (Beckman Coulter, Pasadena, CA, USA) and analysed with the Kaluza software package (Beckman Coulter). Comparison of the MCSP clones LHM2 and 9.2.27 was performed by flow cytometry, and no difference was observed in their binding to UM cells (Supplementary Figure S1).

2.5. Immunocytochemistry

UM cell lines were fixed in PBS/4% paraformaldehyde for 10 min, washed 3 times for 5 min each in PBS, blocked and permeabilised in PBS/1% BSA/10% Normal Donkey Serum (NDS)/0.025% TX-100 for 20 min, then incubated overnight at 4 °C with primary antibody (Table S1) diluted in PBS/1% BSA/1% NDS and washed 5 times for 5 min each in PBS/1% BSA/0.025% TX-100. Cells were then incubated for 1 h at RT with Alexa Fluor 488 conjugated donkey anti-rabbit or anti-mouse IgG (Abcam, Table S1) diluted 1:500 in PBS/1% BSA/1% NDS, washed 3 times for 5 min in PBS/0.025% TX-100, mounted with ProLong Gold Antifade Mountant plus DAPI (ThermoFisher Scientific, Waltham, MA, USA) and analysed using an Olympus BX51 microscope equipped with an Olympus DP71 camera and DP Manager Software (Olympus, Shinjuku, Japan).

2.6. Circulating Tumour Cell Capture and Quantification

Peripheral blood mononuclear cells (PBMCs) were isolated from 8 mL of blood by density gradient centrifugation over Ficoll-Paque (GE Healthcare, Chicago, IL) and resuspended in 1 mL Magnetic-Activated Cell Sorting (MACS) buffer (0.5% bovine serum albumin (BSA), 2 mM EDTA in PBS, pH 7.2) prior to the addition of 3 µL of each individual anti-ABCB5, gp100, MCAM, and MCSP coated immunomagnetic beads (Antibody coupling detailed in Supplementary Methods). Cells and beads were incubated at 4 °C for one hour with rotation. Using a DynaMag-2 magnet (Life Technologies, Carlsbad, CA, USA), bead-captured cells were washed 3 times with MACS buffer, and then fixed with Medium A of the FIX & PERM Cell Permeabilization Kit (ThermoFisher Scientific) for 10 min at RT. Cells were washed twice in PBS, incubated in PBS containing 5% FcR Blocking Agent (Miltenyi Biotec, Bergisch Gladbach, Germany) for 10 min then incubated for 1 h at RT with anti-MART1/gp100/S100β and with anti-CD45 and CD16 antibodies conjugated with Alexa Fluor 647 diluted in Medium B of FIX & PERM Cell Permeabilization Kit (ThermoFisher Scientific)/2% NDS. After incubation, cells were washed in PBS, and incubated in 1:500 donkey anti-rabbit Alexa Fluor IgG 488 (ThermoFisher Scientific) diluted in Medium B/2% NDS/10 μg/mL Hoechst 33342 (Life Technologies) for 30 min at RT and placed on a magnet for 2 min. The resulting pellets were washed 3 times with PBS, resuspended in PBS, then mounted using Prolong Gold Anti-Fade reagent (Life Technologies). Slides were stored at 4 °C, visualised and scanned using an Eclipse Ti-E inverted fluorescent microscope (Nikon, Minato, Japan). Stained cells were analysed using the NIS-Elements Analysis software, version 4.2 (Nikon). CTCs were defined as nucleated cells (DAPI positive) that were positively stained for gp100/MART1/S100β, and negatively stained for CD45/CD16.

2.7. Statistical Analysis

The Spearman rank correlation coefficient was used to test the correlation between the number of CTCs, tumour size, and age. The numbers of captured CTCs in patients with and without monosomy of chromosome 3 were compared using a non-parametric Mann-Whitney U-test. Statistical analyses were performed using R (The R Project, V 4.1.0).
Progression free survival (PFS) was defined as the time interval between blood collection and the date of first disease progression/death. Disease progression was determined by clinician assessment based on both radiological and clinical presentation of the patient. Overall survival (OS) was defined as the time between blood collection and death. OS and PFS were estimated using the Kaplan-Meier method and differences between curves were estimated using log-rank in the survival package in R (V 3.2-11) [19,20] and plotted using survminer (V 0.4.9) [21]. The cutp() function from survMisc (V 0.5.5) [22] was used to determine the optimal CTC cut-off of <3 and ≥3 for the Kaplan-Meier estimates.

3. Results

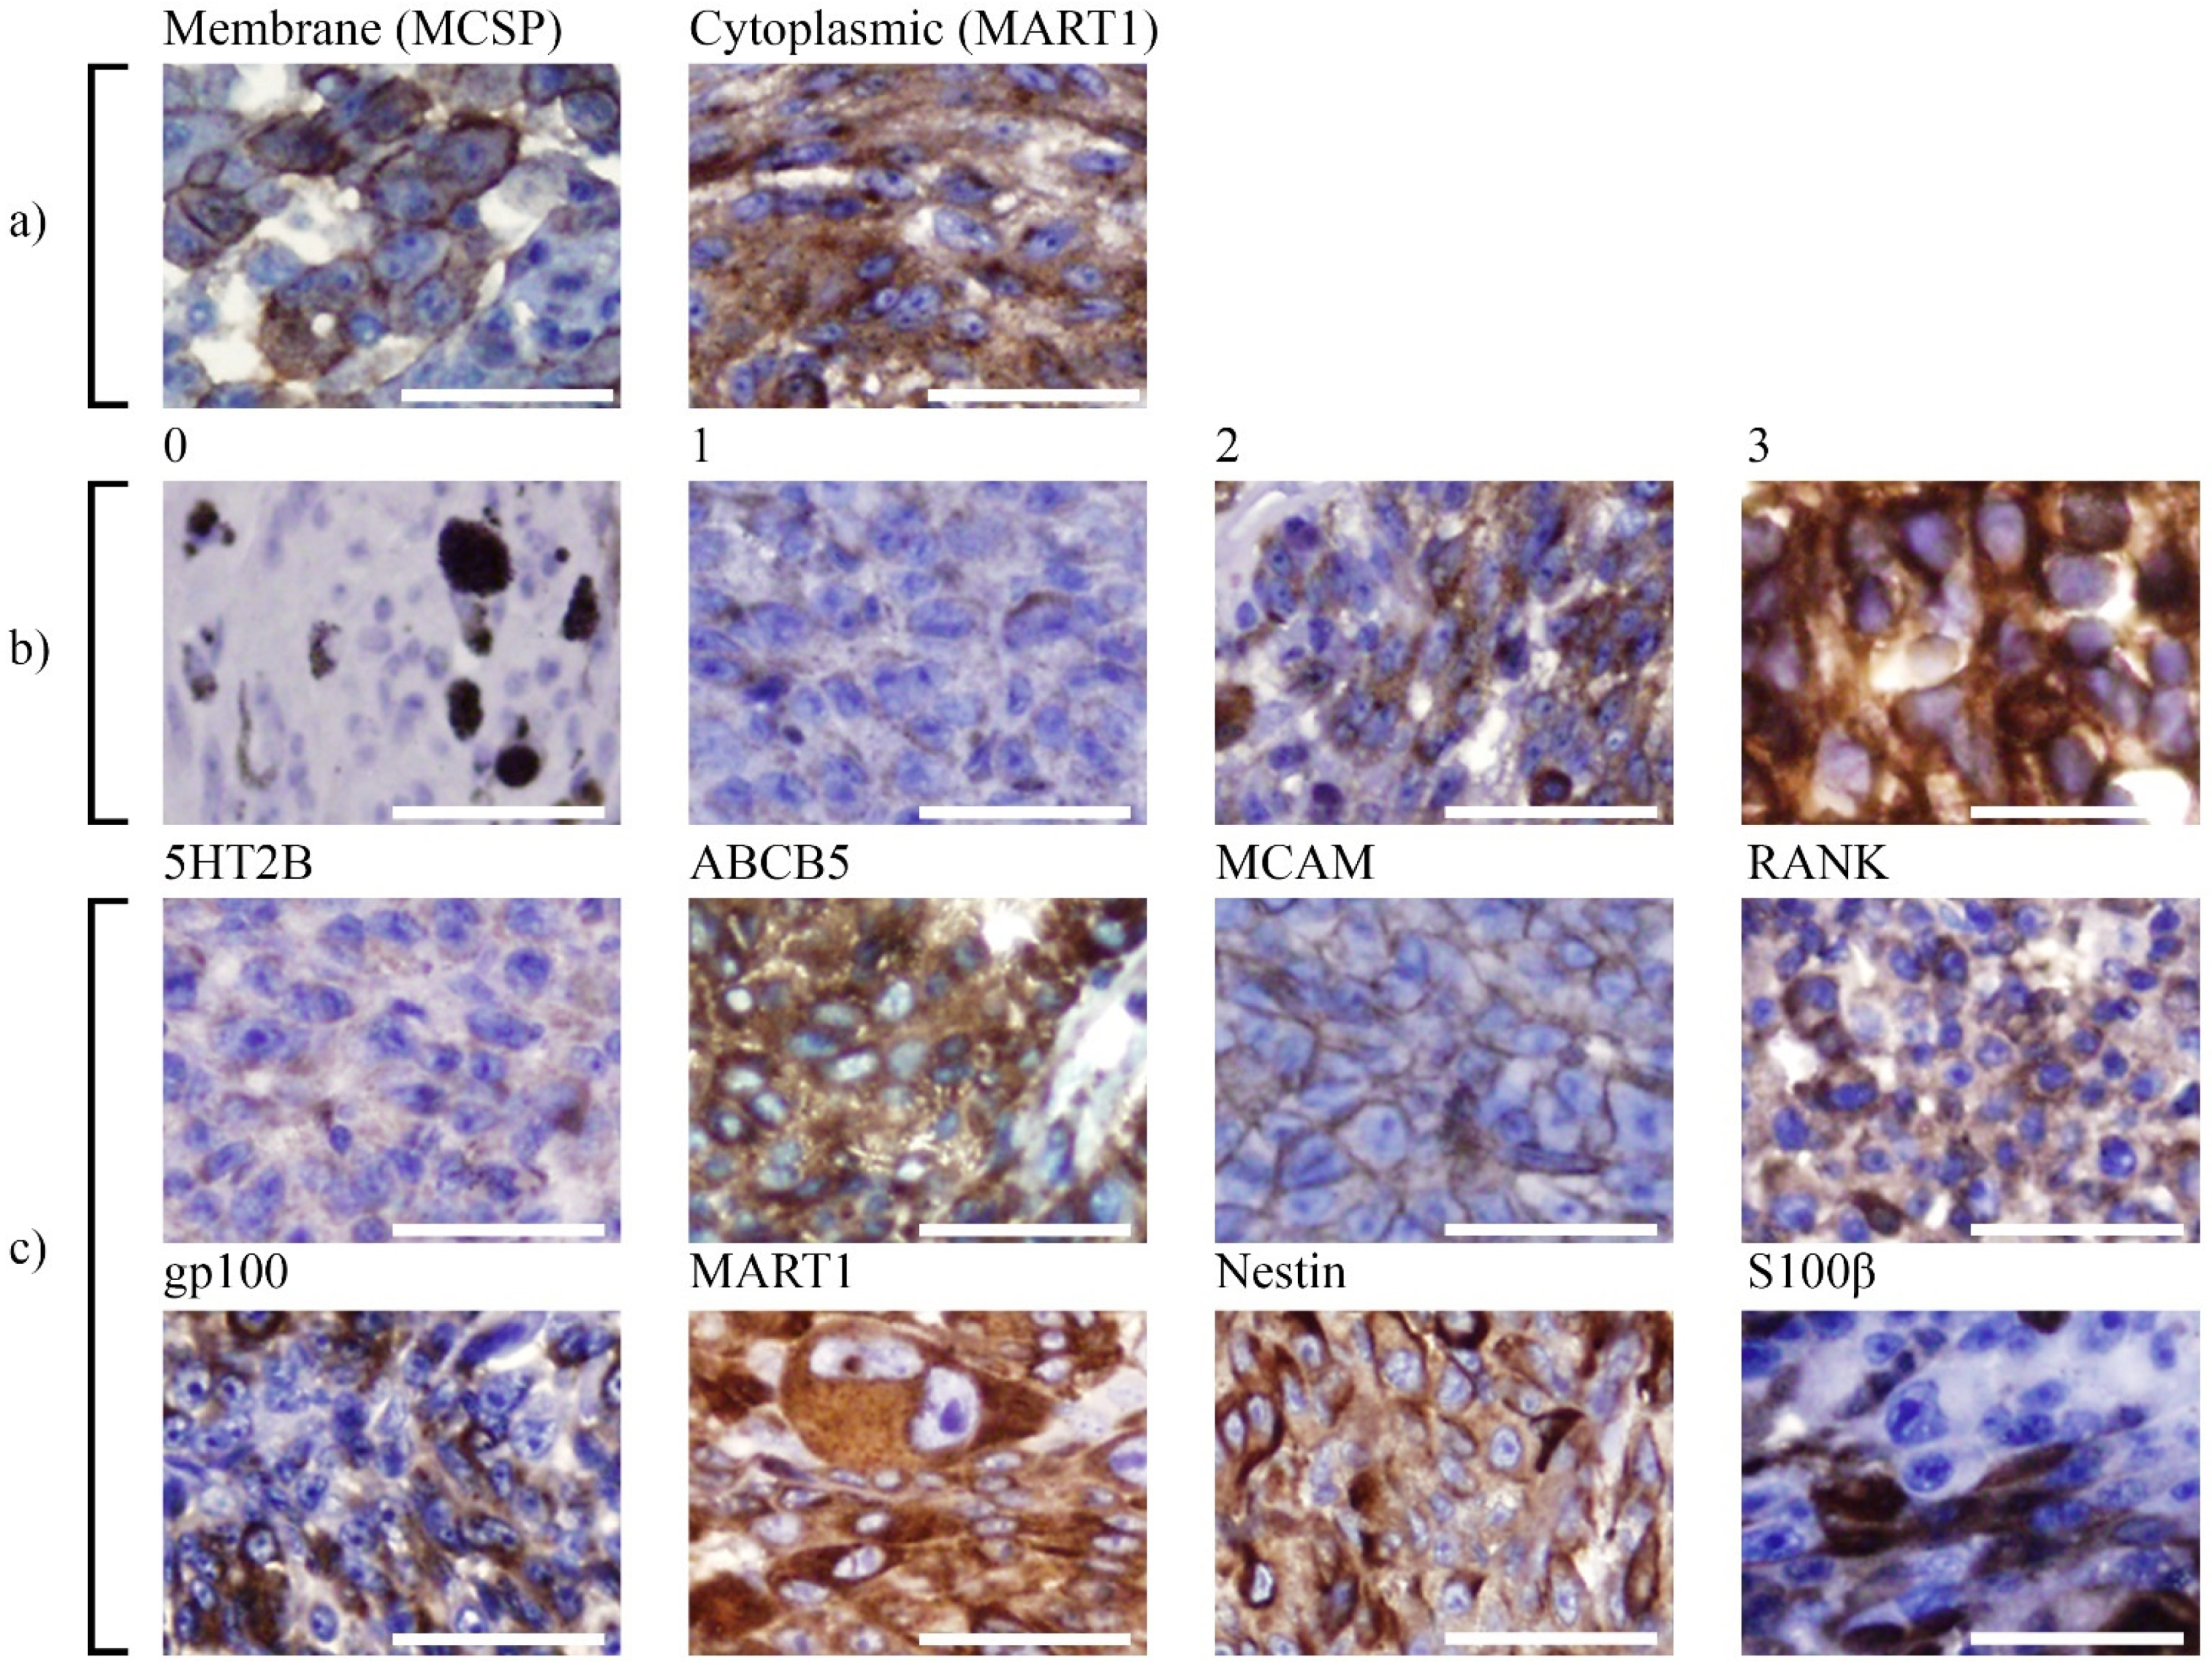
3.1. Analysis of Marker Expression in Primary UM Tumours

We assessed the expression of the selected markers (Table S1) in a tumour microarray of 10 UM FFPE tumours. The markers used for CTC capture in our study were chosen based on earlier studies of their role in UM [9,10,15,23,24,25] and the evaluation of their expression in a UM TMA. ABCB5 is a known chemoresistance marker in cutaneous melanoma [26]; gp100 and MART1 are critical in melanosome biogenesis [27]; MCAM is an adhesion molecule, with some recent evidence suggesting that it plays a role in signalling [28]; MCSP can facilitate spreading of cutaneous melanoma, and lastly, S100β inhibits TP53 activity [29].
Detailed clinical characteristics of the tumour specimens included are described in Table 1. Antigen expression was scored according to the intensity of immunohistochemistry staining (Figure 1a,b). All tumour cores were assessable, except for tumour specimen PUM7, where only 3 of 4 cores could be scored. Representative images of positively stained cores for each of the markers are shown in Figure 1c. Duplicate cores were generally consistent in their staining intensity and the average intensity score per protein was calculated relative to the mean intensity score of all tumours that expressed the protein. For most cases, where strong staining for an individual marker was observed, that marker was homogeneously expressed in the tumour (Figure 1c). An exception was S100β where only a proportion of tumour cells exhibited strong expression, with positively stained cells often clustered in small areas (Figure 1c).
Overall, all tumours expressed gp100 and MART1, with an average expression intensity of 1.4 ± 0.4 and 2.5 ± 0.7 respectively (Table 2). Other intracellular markers, S100β and Nestin were expressed at similar intensity but in a lower proportion of tumours (70% and 60%, respectively). Interestingly, ABCB5 was strongly expressed in 90% of tumours (average expression intensity 2.7 ± 0.5). Of note, in addition to its well-characterised membranous location [30], ABCB5 was also localised within the cytoplasm of UM cells (Figure 1c). Other markers such as 5HT2B (1.1 ± 0.2), MCAM (1.6 ± 0.5) and RANK (1.3 ± 0.4) exhibited moderate levels of predominantly membrane-associated expression and were expressed in a lower proportion of tumour samples (Table 2). Interestingly, 5HT2B and MCAM expression coincided in various tumours (PUM5, 6, 10 and 9) and within areas of the tumours (Figure 1c). Strikingly, MCSP was not detected in any of the UM specimens but was strongly expressed in the cutaneous melanomas used as positive controls (Figure 1a).

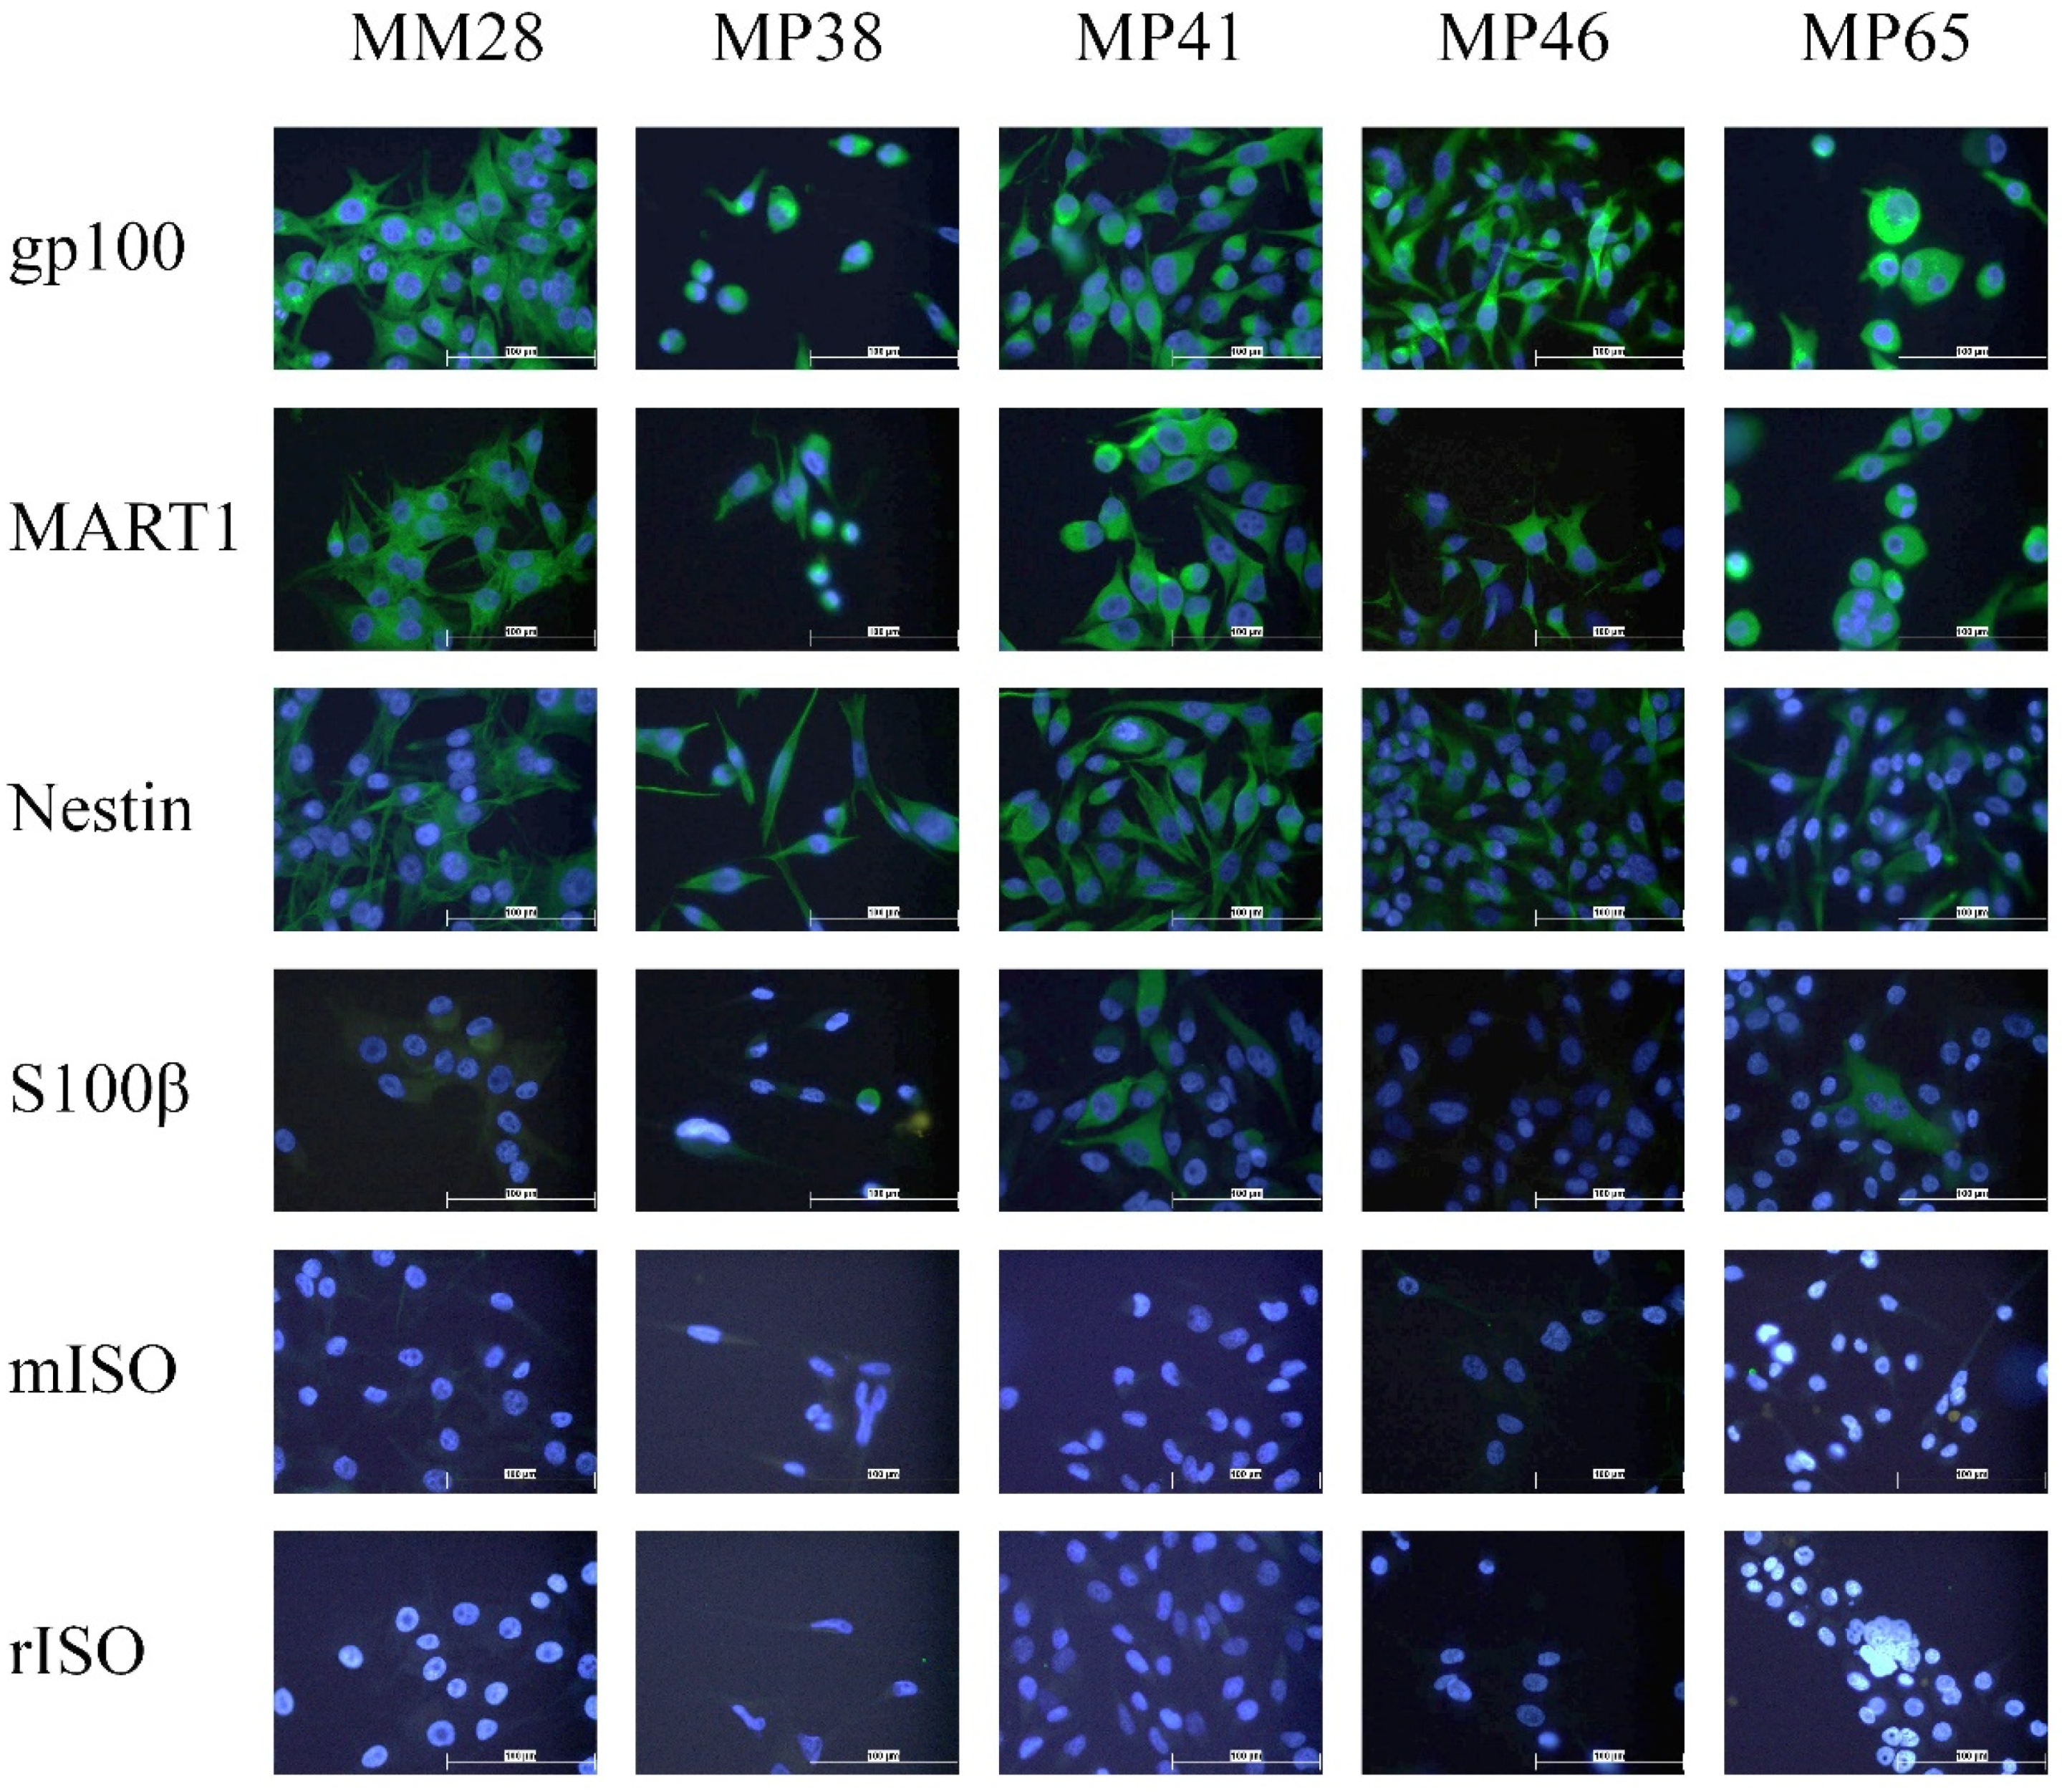
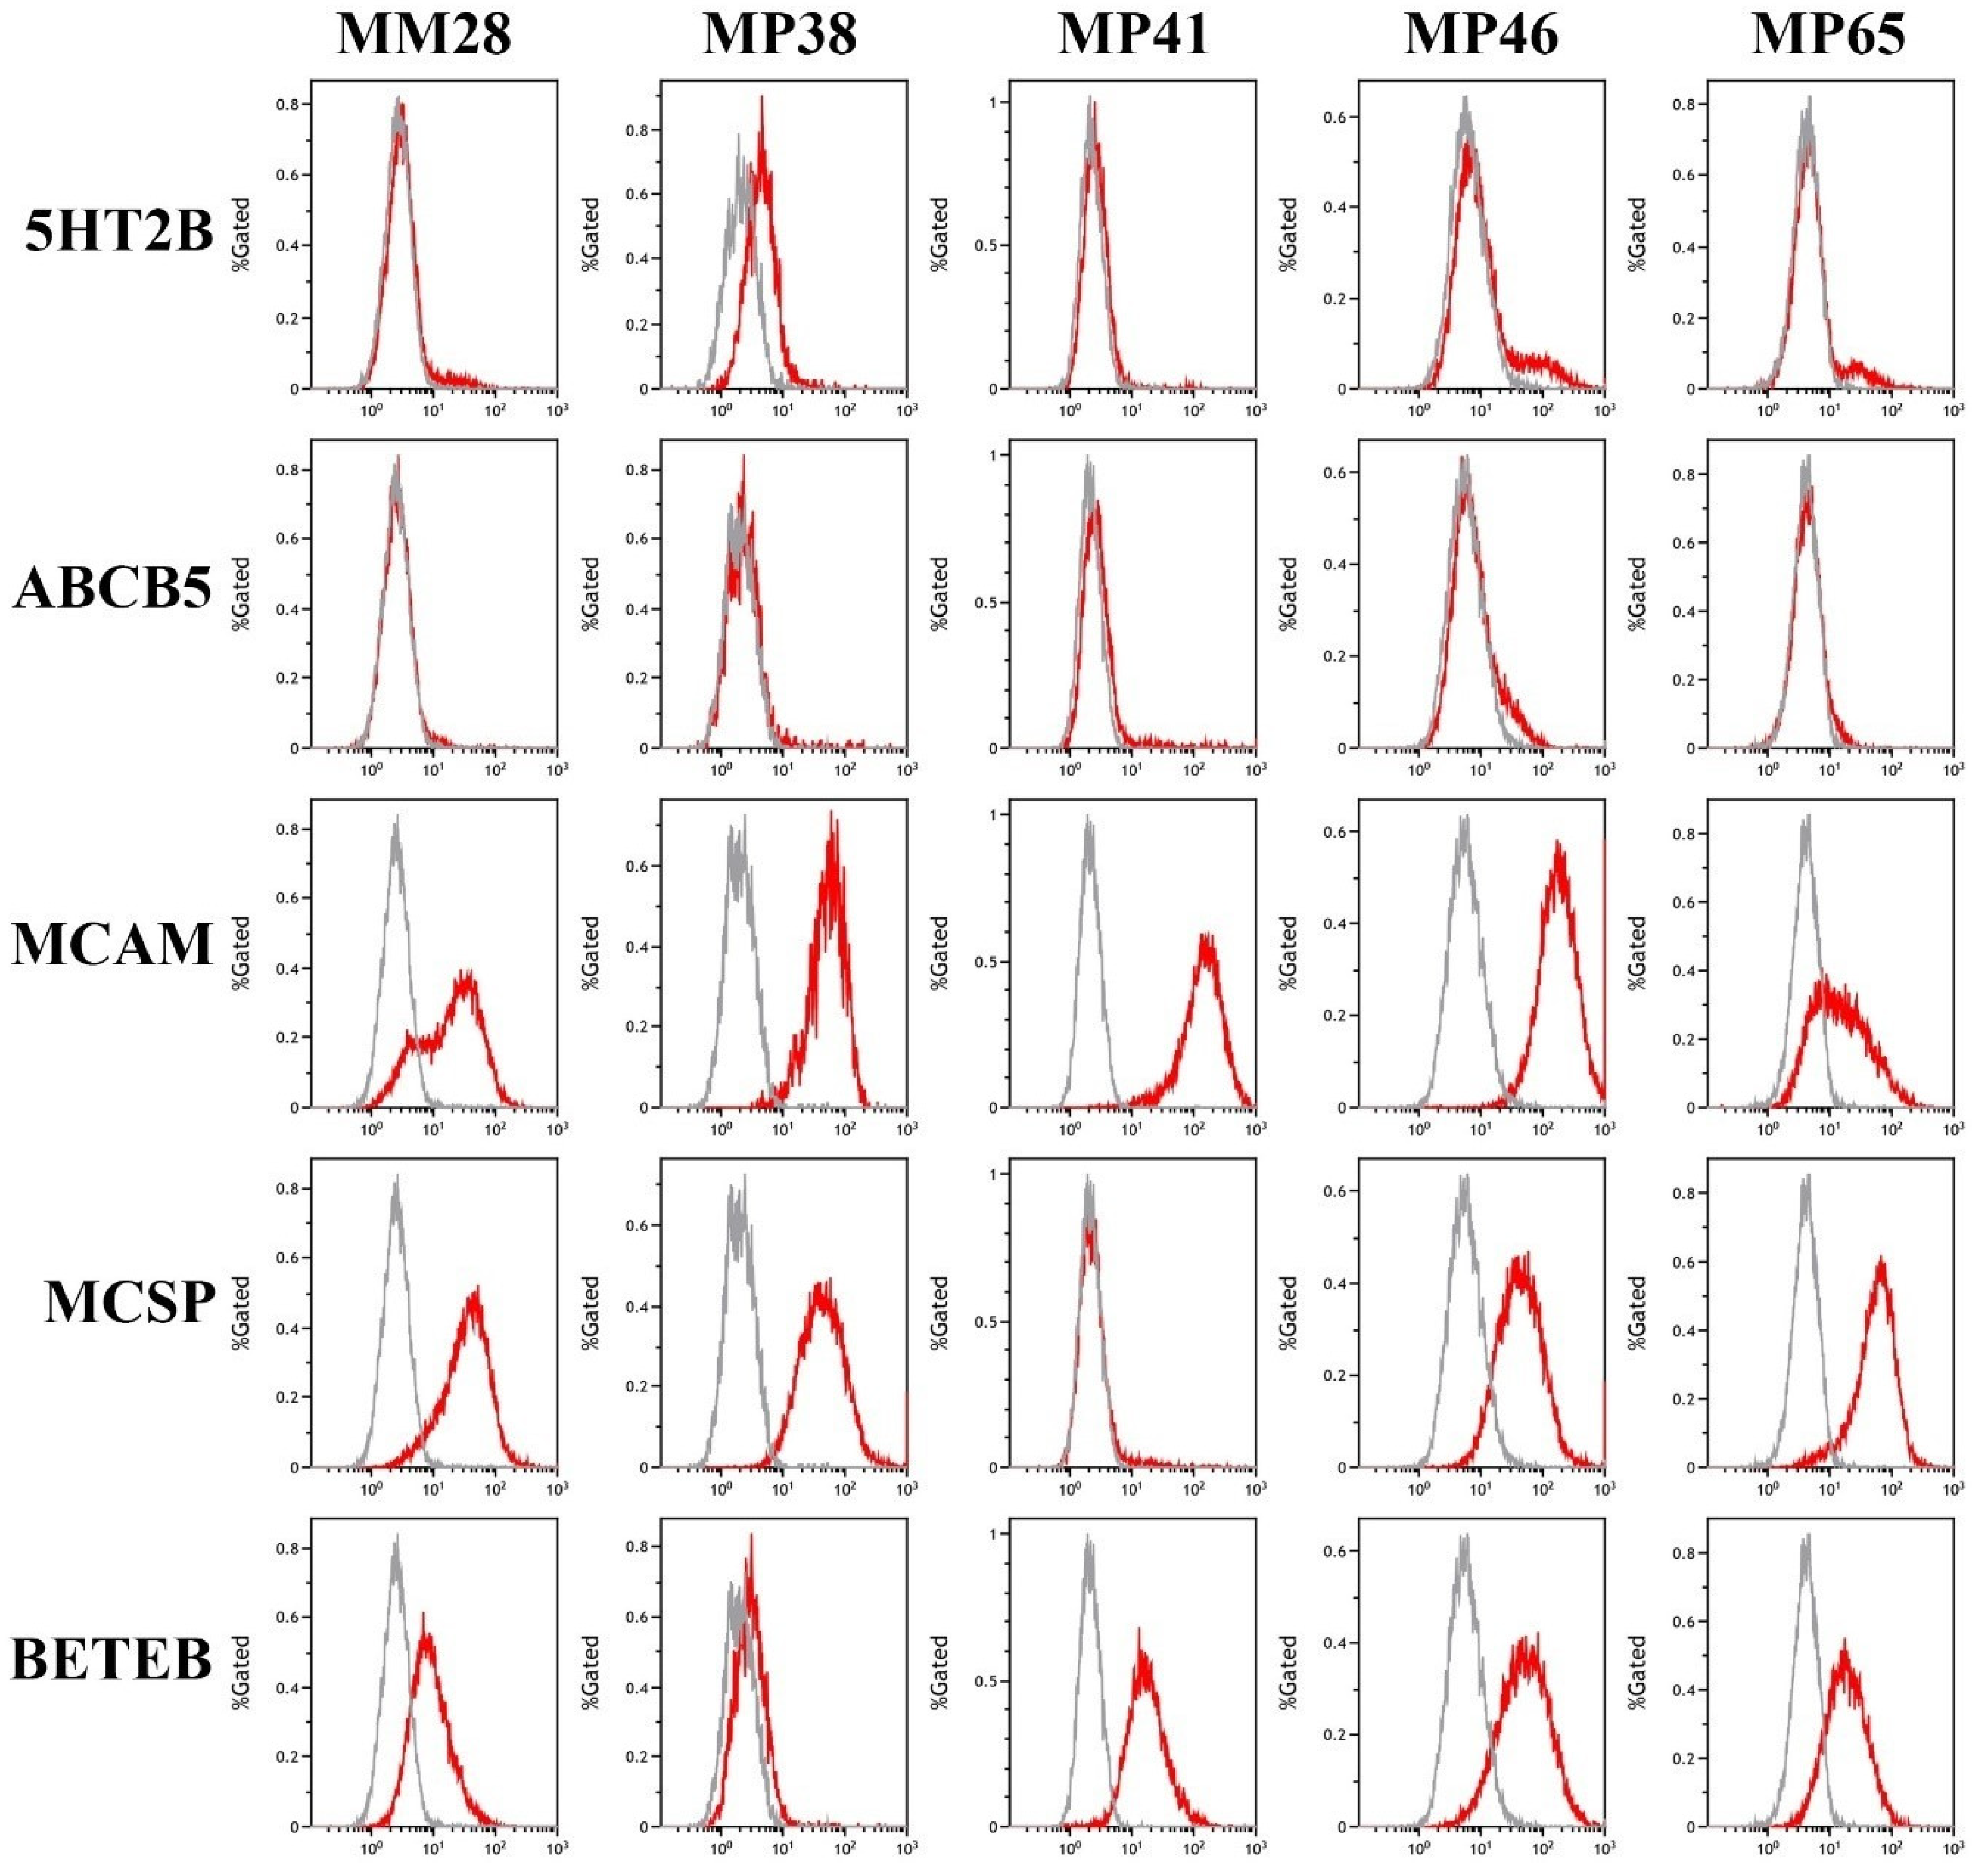
3.2. Analysis of Marker Expression in Primary and Metastatic UM Cell Lines

We evaluated the expression of marker proteins in cell lines derived from primary (MP38, MP41, MP46, and MP65) and metastatic (MM28) UM. Flow cytometry was used to test the cell surface expression of 5HT2B, ABCB5, MCAM, MCSP and extracellular gp100 (referred to by its clone name, BETEB), to allow for accurate quantification of the percentage of cells expressing each marker. Immunocytochemistry was used for analysis of the intracellular markers, gp100, MART-1, Nestin, and S100β, as these markers could be used to confirm the identity of CTCs after immunocapture.
Flow cytometric analysis of UM cell lines revealed high levels of expression of cell surface MCSP, MCAM and gp100 (BETEB), with differential marker expression between cell lines (Figure 2). For example, MCSP, a biomarker commonly used to capture CTCs was expressed in all cell lines except for MP41. However, MP41 cell were strongly positive for MCAM and clearly positive for gp100 (BETEB). In contrast, 5HT2B and ABCB5 were expressed in only a small proportion of the cells within each cell line, apart from MP38, which exhibited low but homogeneous staining for 5HT2B (Figure 2).
We also assessed, by immunocytochemistry, the expression of intracellular markers which can be used for identification of CTCs and found that the melanocyte markers gp100 and MART1 were uniformly expressed in all cell lines. Nestin and S100β were expressed in a more heterogeneous pattern, with Nestin exhibiting high expression in MM28, MP38, and MP41 whilst MP46 and MP65 had medium levels of expression, and S100β only expressed in a subset of cells in each cell line (Figure 3).

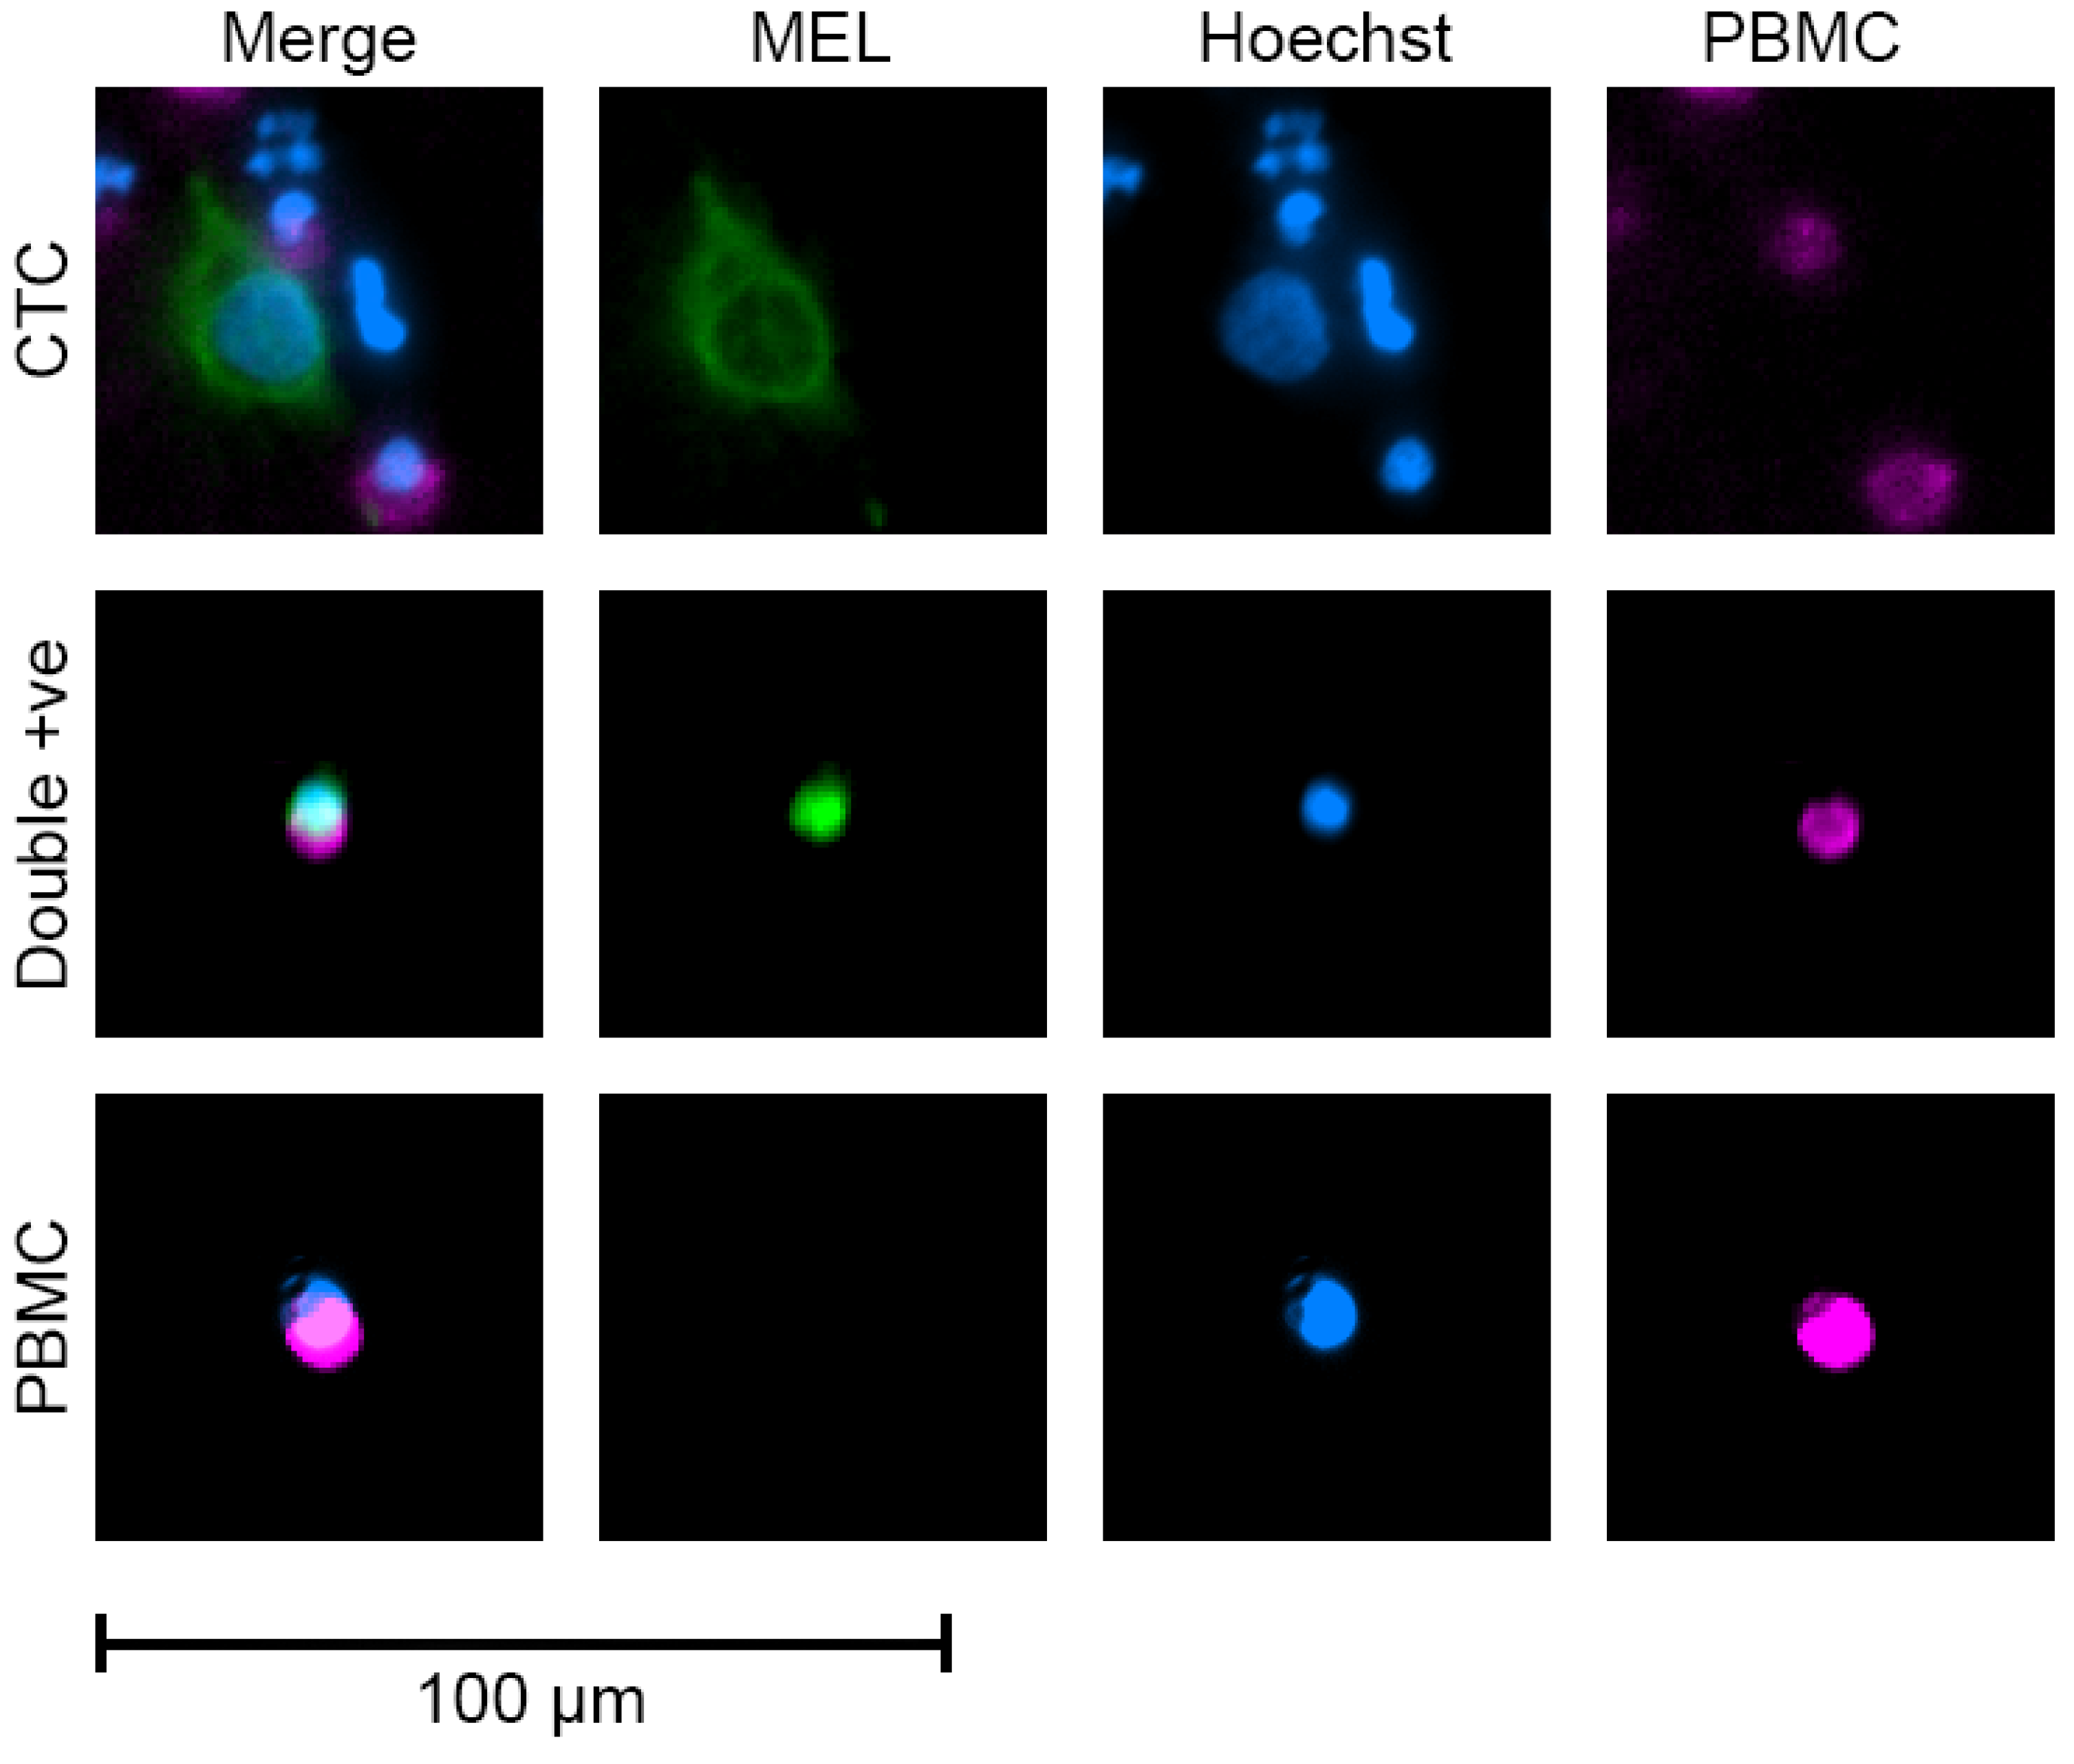
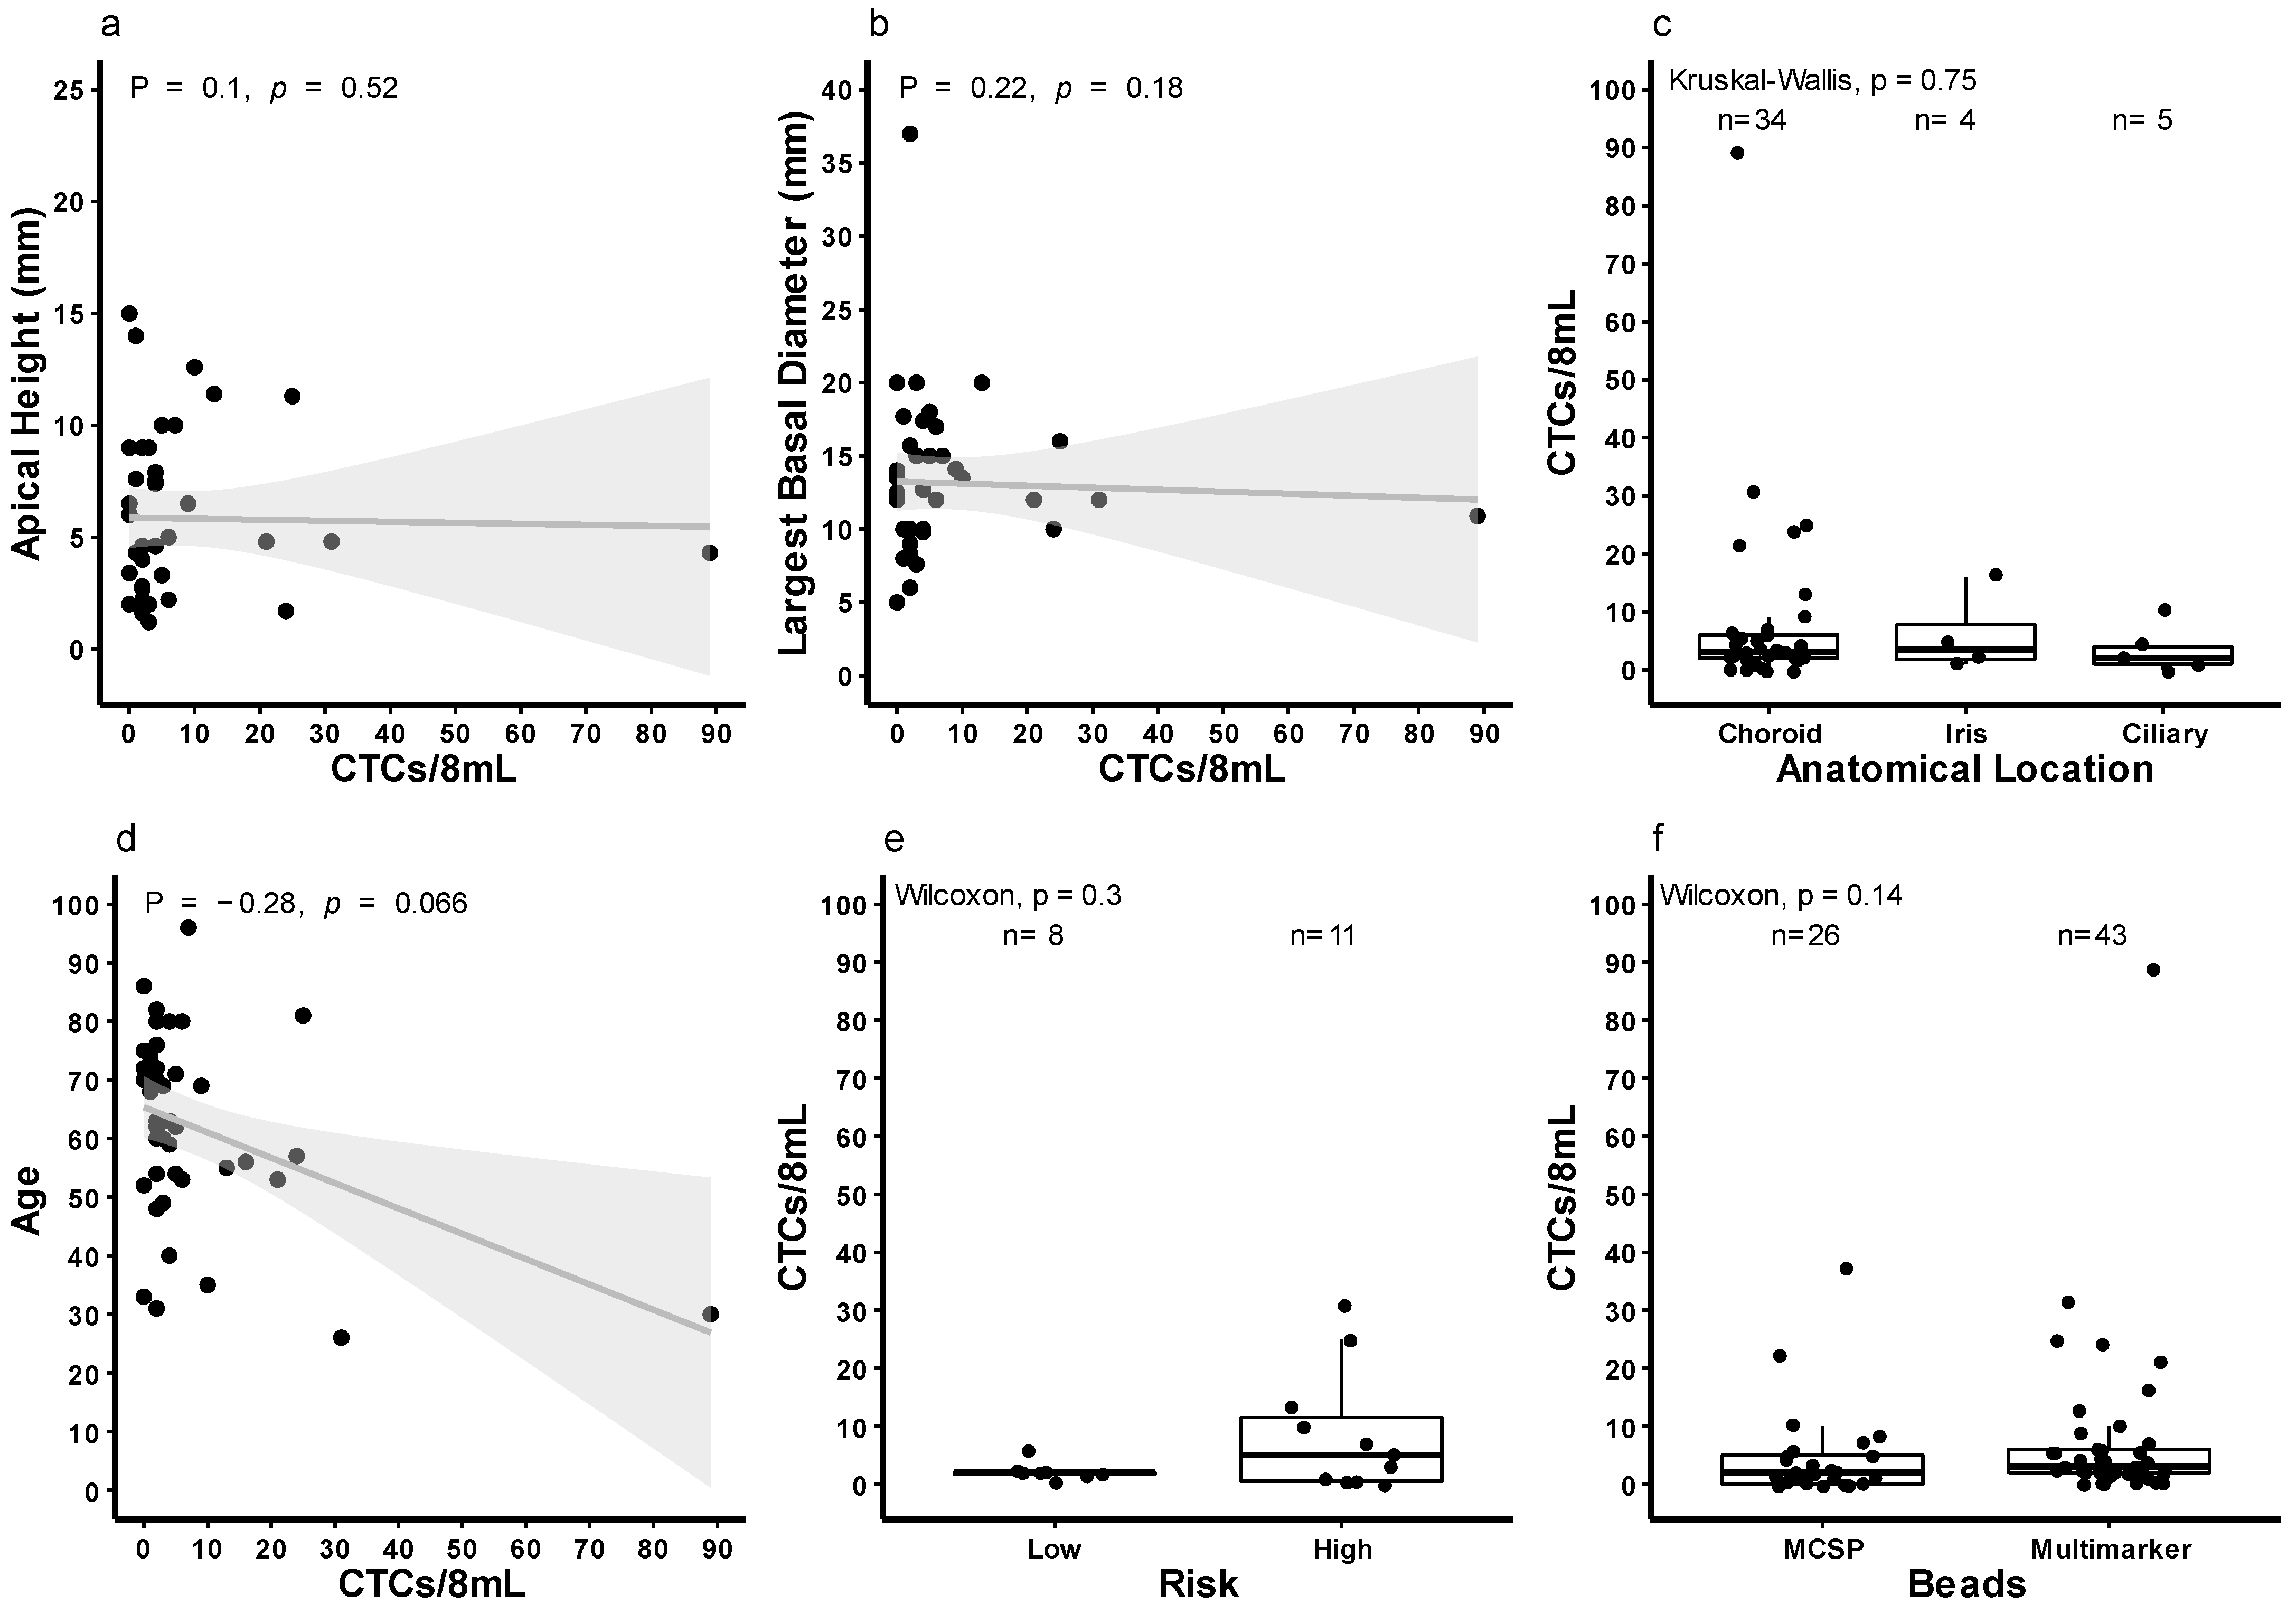
3.3. Quantification of CTCs in Patients with Localised Disease Using Multi-Marker Immunomagnetic Beads

We next determined if the combination of ABCB5, gp100, MCAM, and MCSP would improve the rate of capture in samples from patients with UM. No suitable mouse monoclonal 5HT2B clone could be found and therefore this antibody was not included for CTC capture. We analysed the blood of 43 patients with localised primary UM (Table 3), without the presence of clinically identifiable metastatic disease. The blood sample was obtained before first-line therapy (radiotherapy or enucleation). CTCs were identified by positive staining of MART1/gp100/S100β (no suitable rabbit monoclonal Nestin clone could be found) and negative staining of CD45 and CD16. We found 37/43 (86%) patients with at least one detectable CTC in 8 mL of blood, with a range of 1–89 CTCs, and a mean and median of 7.5 and 3 CTCs, respectively. Representative images in Figure 4.
Tumour size, by apical height or basal diameter had no effect on the number of CTC detected detection of CTCs in patients (Figure 5a,b). The number of CTCs was comparable between anatomical location subgroups (Figure 5c). There was a negative correlation between age and CTC counts (Figure 5d). Amongst 19 patients with prognostic assessment by MLPA, the number of CTCs was higher and more variable in patients with high-risk UM tumours but was not significantly different (Figure 5e). Furthermore, we compared the number of CTCs recovered using the multi-marker assay to those previously obtained by targeting MCSP [10]. The detection rate was higher using the multi-marker assay (86%) compared to targeting MSCP alone (69%) (p = 0.14, Figure 5f).

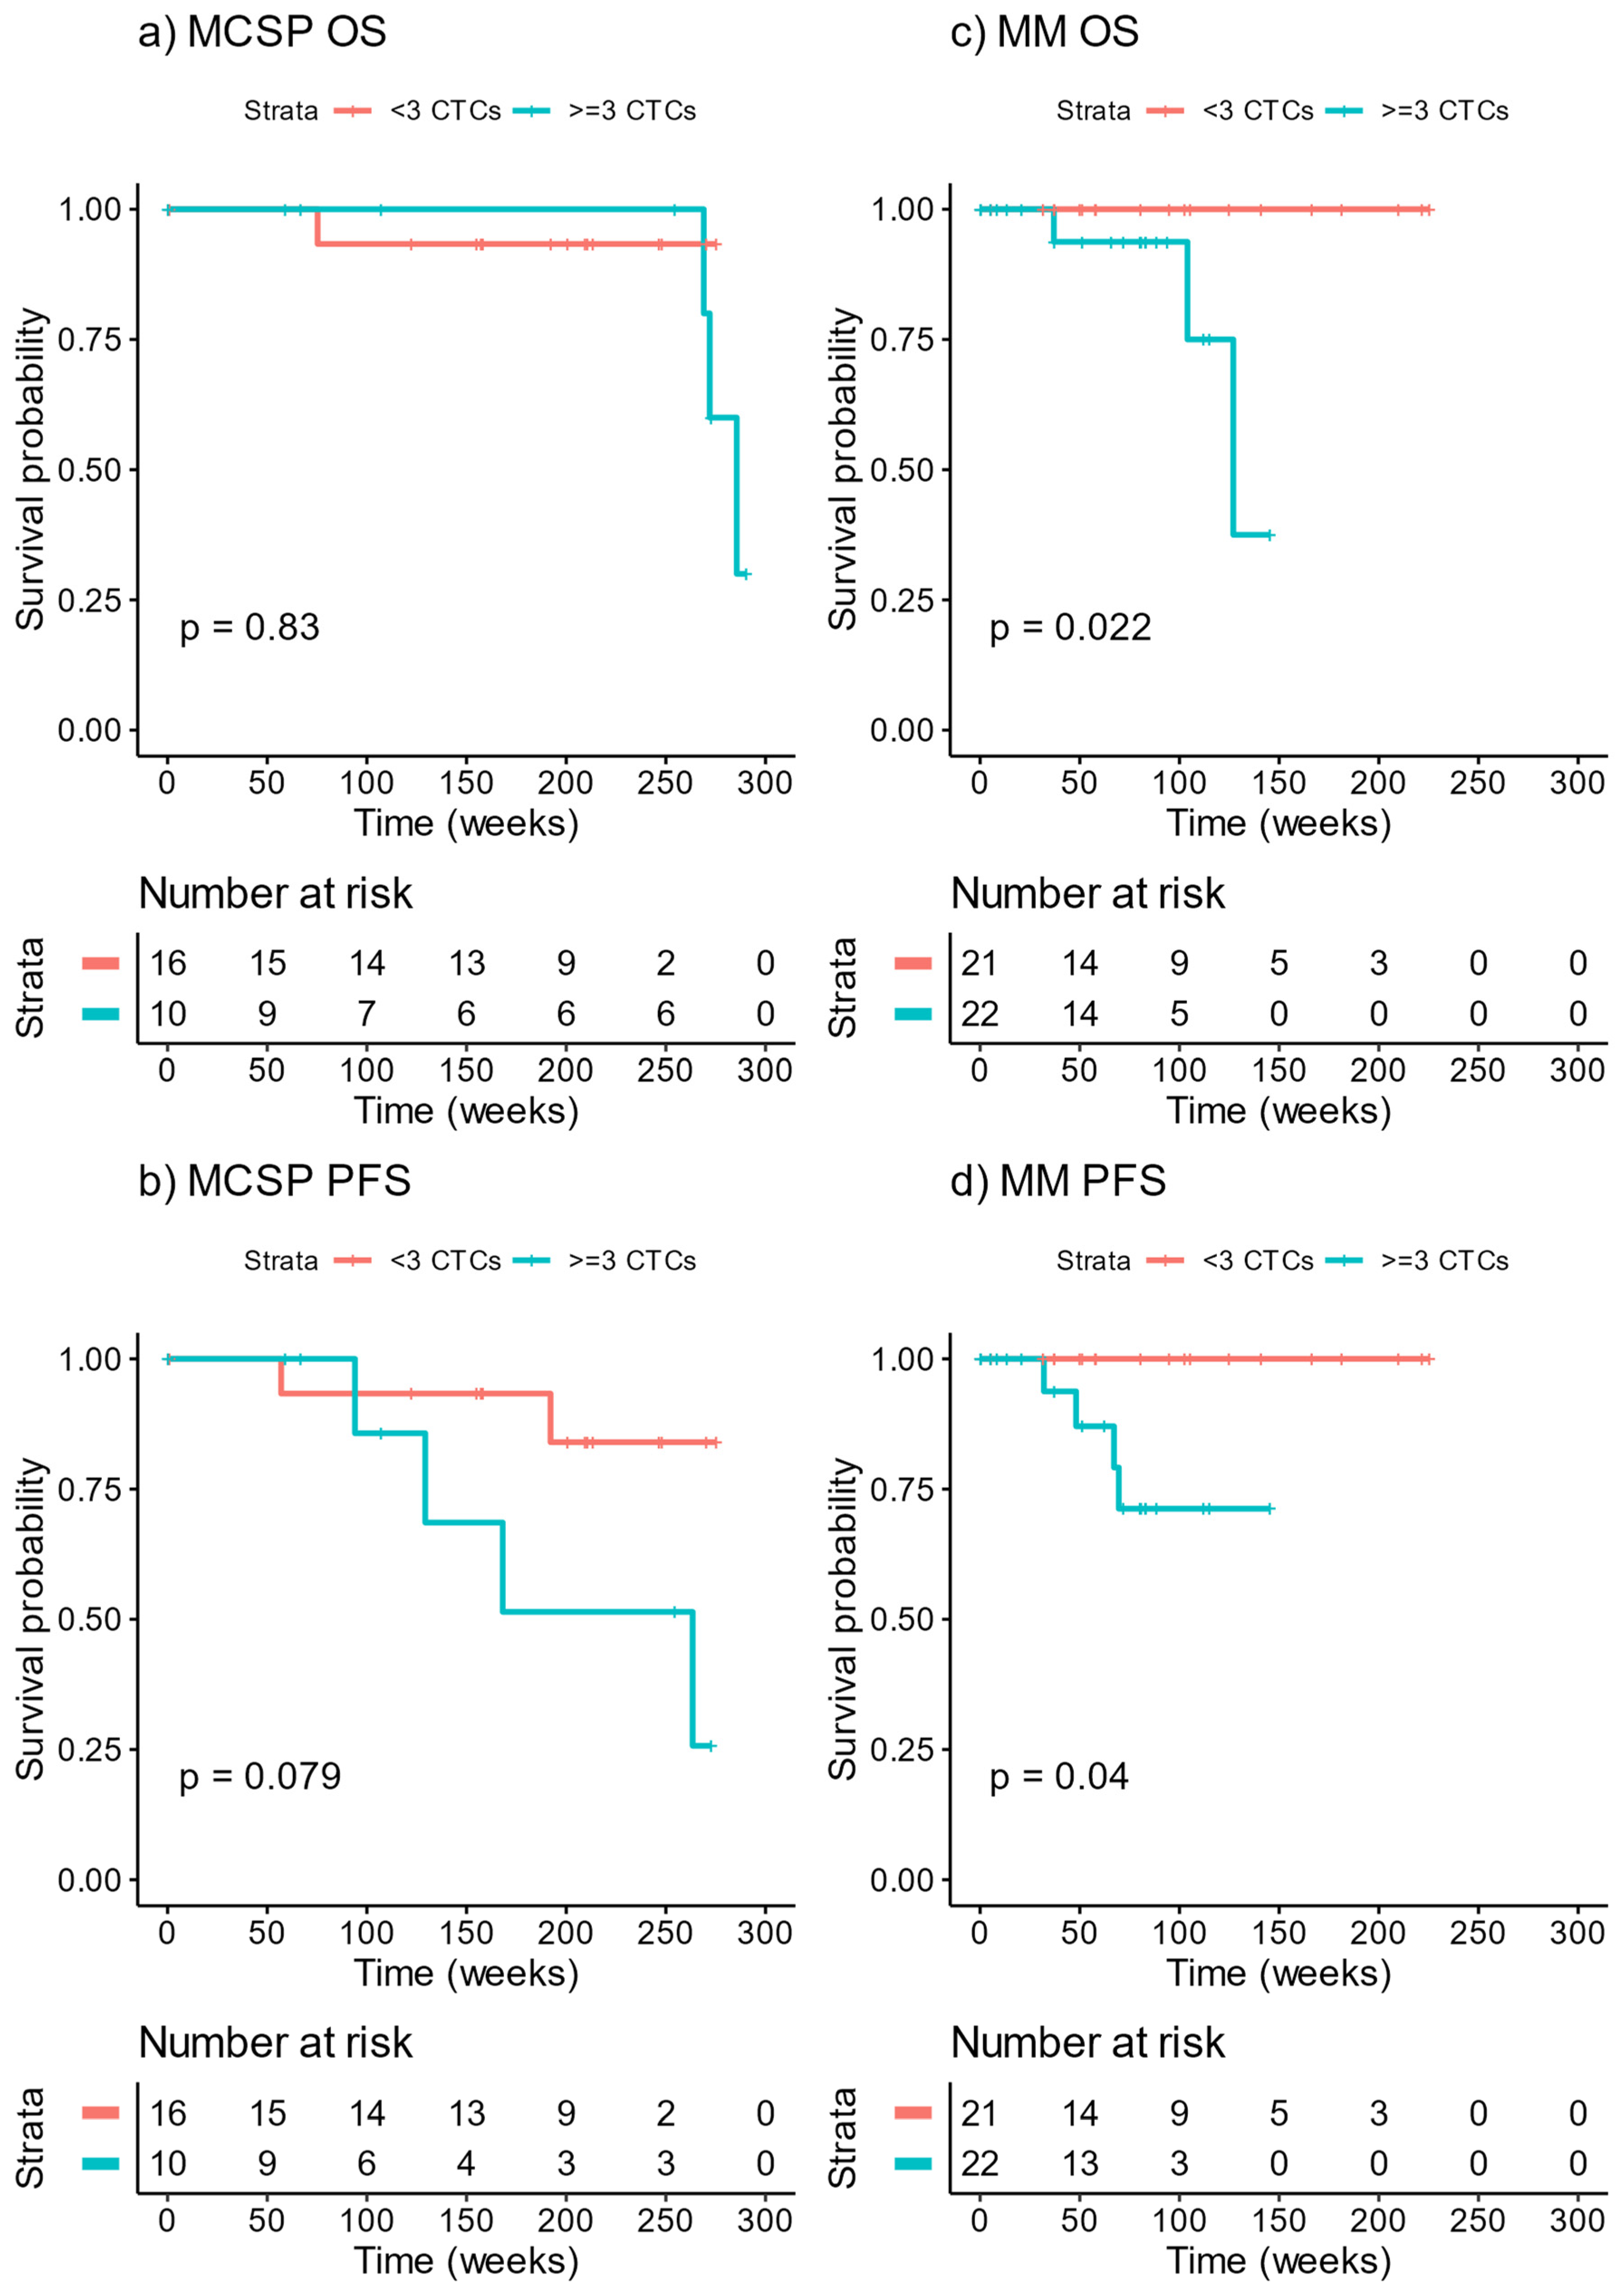
3.4. Survival of Patients Stratified by CTC Count at Baseline

The median follow-up time of patients was 72 weeks (range 0–225) for the multi-marker cohort and 200 weeks (range 0–275) for the MCSP cohort (see Beasley et al., 2018 [10] for detailed cohort characteristics). Both cohorts were stratified into patients with <3 CTCs or ≥3 CTCs per 8 mL of blood. For MCSP captured CTCs, no significant association was found with OS (Figure 6a) or PFS (Figure 6b). On the other hand, CTCs captured using the multi-marker approach showed a significant association with OS (Figure 6c, p = 0.022) and PFS (Figure 6d, p = 0.04). The median OS for patients with ≥3 CTCs was 127 weeks, while no deaths were reported for those with <3 CTCs.

4. Discussion

Currently, outside of specialist ocular oncology centres, intraocular biopsies to determine prognosis are rarely performed. The analysis of CTCs may enable a minimally invasive alternative prognostication method, enabling closer follow-up of high-risk patients. Herein, we validated a panel of markers to capture CTCs in 86% of primary UM patients and demonstrated the association between CTCs and shorter PFS and OS.
Surprisingly, MCSP, which we and others have successfully used to capture CTCs, was not found to be expressed in any of the primary human UM tumour specimens included in our TMA. However, strong expression was observed in all but one of the UM cell-lines. Similar results of MCSP variable expression have also been reported on other UM cell lines [31]. MCSP is highly expressed in cutaneous melanomas, and although its expression is not well characterised in UM, a previous study has described its expression in approximately 95% (18/19) of primary UM tumours [32,33]. Reasons for the apparent lack of concordance between MCSP immunohistochemistry results and our successful use of MCSP antibodies to capture UM CTCs, along with results reported by Li et al. [32], are unknown. Notably, the MCSP antibody clone (9.2.27) used in our CTC capture protocol, and by Li et al. [32] the same, but differed from the antibody clone used here for immunohistochemical detection of MCSP (LHM2). Therefore, we evaluated the expression of MCSP in MP38 and MP41 cells by flow cytometry using the LHM2 clone and found results to be concordant with the 9.2.27 clone (Supplementary Figure S1). Another explanation for our lack of apparent immunostaining of MCSP in our UM specimens may be because of the chemical fixation protocol, improper storage conditions, or length of storage [34,35]. The specific effects of these conditions on MCSP exposure are unknown. However, the other markers evaluated were positively stained in the same tumour samples.
The well-characterised melanoma antigens, MART1 and gp100 were expressed in all of our UM tumours, supporting previous studies of their detection in UM specimens and their potential inclusion in marker panels to capture UM CTCs [36]. Similarly, S100β was widely expressed but in a lesser proportion (70%) of our UM specimens, while MCAM, which was previously reported to be expressed in all of a cohort of 35 specimens [37], was expressed in just 4 of our 10 UM specimens. The TMA provides a useful means to evaluate biomarker expression. However, the relatively small areas of tumour tissue that can be evaluated in 1 mm cores may result in an underestimation of antigen expression if the immunohistochemical staining pattern is heterogeneous. For example, heterogeneous MCAM expression in UM described in a previous report [37] may have contributed to the lower proportion of MCAM-expressing tumours identified in the present study.
An interesting finding was that ABCB5 was expressed at elevated levels in a high proportion (90%) of UM specimens, predominantly localised to the cytoplasm. This contrasts with the sporadic expression of ABCB5 in cutaneous melanoma tumours [26,38]. ABCB5 is a cancer stem cell marker [39] over-expressed in cutaneous melanoma CTCs [38,40].
Biomarker expression was also examined in UM cell lines, which carry chromosomal losses and gains typical of human UM specimens [41,42]. Several of the markers, notably MCAM, MCSP and gp100 (BETEB) were expressed in most UM cell lines and in most cells in those cell lines. In contrast, 5HT2B and ABCB5, which were highly expressed in human UM tissue, were weakly and sporadically expressed in the UM cell lines analysed. Discordance of antigen expression between tumour tissue and cell lines could be attributed to environmental differences, and selection or adaptation to in vitro growing conditions [43].
More recently, microfluidics and sized based filtration have been used to isolate CTCs in various cancers [44,45,46], including cutaneous melanoma [47,48,49,50]. However, no studies have reported the isolation of UM CTCs using microfluidics. Mazzini et al. showed the isolation of UM CTCs using Isolation by Size of Epithelial Tumour cells (ISET). In that study, CTCs were detected in 17 of 31 (~58%) patients with localised disease [51]. This isolation rate was similar to detection of CTCs by MCSP alone in our previous study. Identification of CTCs following enrichment using a microfluidic device or other size-based separation method will still require immunostaining for antigens commonly expressed in UM. Thus, the results presented here could support the selection of markers to be used for UM CTC identification in future studies using any separation technology, including size-based separation or microfluidic devices.
Some of the earlier literature describing the associations between CTC enumeration and prognosis in UM are conflicting. Previous reports have identified that the numbers of CTCs found in patients with localised UM do not appear to correlate with prognosis or survival outcomes [8,15]. In contrast, other studies have found that CTC levels correlate with features of poor prognosis [9], reduced disease-free survival [51] and OS [52] in localised UM, or shorter PFS and OS in metastatic UM [14]. Here, we found that using our multi-marker approach, ≥3 CTCs were predictive of shorter OS and PFS. It should be noted that only a few patients progressed during the study time period, limiting the number of events. Given that the median follow-up time from diagnosis of the primary lesion is approximately 2.4–4.4 years [53,54,55,56] a longer-term follow-up study is required. However, we found here and in our previous study [10] that CTC numbers were not significantly associated with genome-based prognostic classes described previously [4]. One major limitation is that prognostic biopsies were only performed in a small subset of patients, restricting the assertiveness of this result.
While CTC enumeration appears to be promising for UM prognostication, our ultimate aim is to capture CTCs in most patients to provide sufficient cells for genetic analysis of the parental tumour. CTCs have been shown to constitute a source of tumour genetic material which represents that within the primary tumour [57]. Tura et al. [58] showed that chromosome 3 loss, a marker of poor prognosis, could be determined by fluorescence in-situ hybridisation in single CTCs and that these results matched the primary tumour in 10/11 cases. Furthermore, we have previously shown that CTCs from a patient with metastatic UM harboured virtually identical SCNAs as the primary excised tumour [10].

5. Conclusions

In summary, our study assessed the heterogeneity of expression of melanocytes, melanoma, and stem cell protein markers in UM tissues and cell-lines to select a panel of antibodies that could capture and identify CTCs in the blood of patients with primary UM. We found that when compared to our original study, where CTCs were captured using anti-MCSP alone, our multi-marker method improved both the number of patients with detectable CTCs, and the number of CTCs isolated. We further found that the enumeration of CTCs was significantly associated with shorter PFS and OS.

Supplementary Materials

The following are available online at https://www.mdpi.com/article/10.3390/cancers13235990/s1, Supplementary Methods, Figure S1: Comparison of LHM2 and 9.2.27 MCSP Antibody Clones, Table S1: Antibody Information.

Author Contributions

Conceptualisation, E.S.G., A.B.B. and M.R.Z.; methodology, E.S.G., A.B.B. and J.F.; formal analysis, A.B.B.; investigation, A.B.B., T.W.I., T.V., J.-L.D., R.B., D.H., A.R., F.K.C., J.B., D.M., R.M.C., M.R.P., B.M., L.C. and W.N.E.; resources, E.S.G. and M.R.Z.; data curation, A.B.B., T.W.I., D.H., A.R., F.K.C., D.M. and R.M.C.; writing—original draft preparation, A.B.B. and E.S.G.; writing—review and editing, A.B.B., T.W.I., T.V., J.F., J.-L.D., R.B., D.H., A.R., F.K.C., J.B., D.M., R.M.C., M.R.P., B.M., L.C., W.N.E., M.R.Z. and E.S.G.; visualisation, A.B.B.; supervision, E.S.G.; project administration, A.B.B. and E.S.G.; funding acquisition, E.S.G. All authors have read and agreed to the published version of the manuscript.

Funding

A.B.B. is supported by an Edith Cowan University Postgraduate Scholarship and a Cancer Council of Western Australia PhD Top-up Scholarship. E.S.G. is supported by a Fellowship from the Cancer Council of Western Australia. F.K.C. is supported by the Australian National Health and Medical Research Council Career Development Fellowship (MRF1142962). The study was funded by a Raine Medical Research Foundation Priming grant and Ophthalmic Research Institute of Australia grant.

Institutional Review Board Statement

This study received approval from the Human Research Ethics Committee of Edith Cowan University (No. 11543 and No. 18957) and Sir Charles Gairdner Hospital (No. 2013-246 and No. RGS0000003289). Written consent was obtained from all patients under approved human research ethics committee protocols which complied with the Declaration of Helsinki.

Informed Consent Statement

Informed consent was obtained from all subjects involved in the study.

Data Availability Statement

Data sharing not applicable. All tabulated data is available within the manuscript.

Acknowledgments

The authors thank all the participants, patients, and healthy volunteers, for their assistance with the study. The authors would like to thank Danielle Dye ([59,60] & supplementary) for the kind donation of the CC9 anti-MCAM antibody, Pauline Zaenker, Ashleigh McEvoy, and Danielle Bartlett for their phlebotomy services, William Cunningham and Rian Vijoen for assisting with patient recruitment at Royal Perth Hospital, and Karen Shakespeare for gathering the clinical data for patients. We would also like to thank the theatre and ward staff at Royal Perth Hospital and St John of God Hospital, Subiaco for all their assistance. We also thank Sergio Roman-Roman, from the Institut Curie, France, for kindly supplying the uveal melanoma cell lines used in the study.

Conflicts of Interest

The authors declare no conflict of interest.

References

  1. McLaughlin, C.C.; Wu, X.C.; Jemal, A.; Martin, H.J.; Roche, L.M.; Chen, V.W. Incidence of noncutaneous melanomas in the U.S. Cancer 2005, 103, 1000–1007. [Google Scholar] [CrossRef]
  2. Beasley, A.B.; Preen, D.B.; McLenachan, S.; Gray, E.S.; Chen, F.K. Incidence and Mortality of Uveal Melanoma in Australia (1982 to 2014). Br. J. Ophthalmol. 2021, in press. [Google Scholar]
  3. Blum, E.S.; Yang, J.; Komatsubara, K.M.; Carvajal, R.D. Clinical Management of Uveal and Conjunctival Melanoma. Oncology 2016, 30, 29–32. [Google Scholar]
  4. Robertson, A.G.; Shih, J.; Yau, C.; Gibb, E.A.; Oba, J.; Mungall, K.L.; Hess, J.M.; Uzunangelov, V.; Walter, V.; Danilova, L.; et al. Integrative Analysis Identifies Four Molecular and Clinical Subsets in Uveal Melanoma. Cancer Cell 2017, 32, 204–220.e15. [Google Scholar] [CrossRef] [Green Version]
  5. Vichitvejpaisal, P.; Dalvin, L.A.; Mazloumi, M.; Ewens, K.G.; Ganguly, A.; Shields, C.L. Genetic Analysis of Uveal Melanoma in 658 Patients Using the Cancer Genome Atlas Classification of Uveal Melanoma as A, B, C, and D. Ophthalmology 2019, 126, 1445–1453. [Google Scholar] [CrossRef]
  6. Harbour, J.W.; Roberson, E.D.O.; Anbunathan, H.; Onken, M.D.; Worley, L.A.; Bowcock, A.M. Recurrent mutations at codon 625 of the splicing factor SF3B1 in uveal melanoma. Nat. Genet. 2013, 45, 133–135. [Google Scholar] [CrossRef]
  7. Pereira, P.R.; Odashiro, A.N.; Lim, L.A.; Miyamoto, C.; Blanco, P.L.; Odashiro, M.; Maloney, S.; De Souza, D.F.; Burnier, M.N., Jr. Current and emerging treatment options for uveal melanoma. J. Clin. Ophthalmol. 2013, 7, 1669–1682. [Google Scholar] [CrossRef] [PubMed] [Green Version]
  8. Suesskind, D.; Ulmer, A.; Schiebel, U.; Fierlbeck, G.; Spitzer, B.; Spitzer, M.S.; Bartz-Schmidt, K.U.; Grisanti, S. Circulating melanoma cells in peripheral blood of patients with uveal melanoma before and after different therapies and association with prognostic parameters: A pilot study. Acta Ophthalmol. 2011, 89, 17–24. [Google Scholar] [CrossRef]
  9. Ulmer, A.; Beutel, J.; Susskind, D.; Hilgers, R.D.; Ziemssen, F.; Luke, M.; Rocken, M.; Rohrbach, M.; Fierlbeck, G.; Bartz-Schmidt, K.U.; et al. Visualization of circulating melanoma cells in peripheral blood of patients with primary uveal melanoma. Clin. Cancer Res. 2008, 14, 4469–4474. [Google Scholar] [CrossRef] [PubMed] [Green Version]
  10. Beasley, A.; Isaacs, T.; Khattak, M.A.; Freeman, J.B.; Allcock, R.; Chen, F.K.; Pereira, M.R.; Yau, K.; Bentel, J.; Vermeulen, T.; et al. Clinical Application of Circulating Tumor Cells and Circulating Tumor DNA in Uveal Melanoma. JCO Precis. Oncol. 2018, 2, 1–12. [Google Scholar] [CrossRef] [PubMed]
  11. Paoletti, C.; Cani, A.K.; Larios, J.M.; Hovelson, D.H.; Aung, K.; Darga, E.P.; Cannell, E.M.; Baratta, P.J.; Liu, C.-J.; Chu, D.; et al. Comprehensive Mutation and Copy Number Profiling in Archived Circulating Breast Cancer Tumor Cells Documents Heterogeneous Resistance Mechanisms. Cancer Res. 2018, 78, 1110–1122. [Google Scholar] [CrossRef] [Green Version]
  12. Mishima, Y.; Paiva, B.; Shi, J.; Park, J.; Manier, S.; Takagi, S.; Massoud, M.; Perilla-Glen, A.; Aljawai, Y.; Huynh, D.; et al. The Mutational Landscape of Circulating Tumor Cells in Multiple Myeloma. Cell Rep. 2017, 19, 218–224. [Google Scholar] [CrossRef] [Green Version]
  13. Yu, M.; Bardia, A.; Wittner, B.S.; Stott, S.L.; Smas, M.E.; Ting, D.T.; Isakoff, S.J.; Ciciliano, J.C.; Wells, M.N.; Shah, A.M.; et al. Circulating breast tumor cells exhibit dynamic changes in epithelial and mesenchymal composition. Science 2013, 339, 580–584. [Google Scholar] [CrossRef] [PubMed] [Green Version]
  14. Bidard, F.C.; Madic, J.; Mariani, P.; Piperno-Neumann, S.; Rampanou, A.; Servois, V.; Cassoux, N.; Desjardins, L.; Milder, M.; Vaucher, I.; et al. Detection rate and prognostic value of circulating tumor cells and circulating tumor DNA in metastatic uveal melanoma. Int. J. Cancer 2014, 134, 1207–1213. [Google Scholar] [CrossRef]
  15. Tura, A.; Luke, J.; Merz, H.; Reinsberg, M.; Luke, M.; Jager, M.J.; Grisanti, S. Identification of circulating melanoma cells in uveal melanoma patients by dual-marker immunoenrichment. Investig. Ophthalmol. Vis. Sci. 2014, 55, 4395–4404. [Google Scholar] [CrossRef] [Green Version]
  16. Freeman, J.B.; Gray, E.S.; Millward, M.; Pearce, R.; Ziman, M. Evaluation of a multi-marker immunomagnetic enrichment assay for the quantification of circulating melanoma cells. J. Transl. Med. 2012, 10, 192. [Google Scholar] [CrossRef] [Green Version]
  17. Wu, J.; Brunner, G.; Celebi, J.T. A Melanoma Subtype: Uveal Melanoma. J. Am. Acad. Dermatol. 2011, 64, 1185–1186. [Google Scholar] [CrossRef] [Green Version]
  18. Amirouchene-Angelozzi, N.; Nemati, F.; Gentien, D.; Nicolas, A.; Dumont, A.; Carita, G.; Camonis, J.; Desjardins, L.; Cassoux, N.; Piperno-Neumann, S.; et al. Establishment of novel cell lines recapitulating the genetic landscape of uveal melanoma and preclinical validation of mTOR as a therapeutic target. Mol. Oncol. 2014, 8, 1508–1520. [Google Scholar] [CrossRef]
  19. Therneau, T.M. A Package for Survival Analysis in R. Available online: https://CRAN.R-project.org/package=survival (accessed on 13 September 2021).
  20. Therneau, T.M.; Grambsch, P.M.; Therneau, T.M.; Grambsch, P.M. The cox model. In Modeling Survival Data: Extending the Cox Model; Springer: Cham, Switzerland, 2000; pp. 39–77. [Google Scholar]
  21. Kassambara, A.; Kosinski, M.; Biecek, P. survminer: Drawing Survival Curves Using ’ggplot2’. Available online: https://CRAN.R-project.org/package=survminer (accessed on 13 September 2021).
  22. Dardis, C. survMisc: Miscellaneous Functions for Survival Data. R Package Version 0.5.5. Available online: https://CRAN.R-project.org/package=survMisc (accessed on 13 September 2021).
  23. Thill, M.; Berna, M.J.; Grierson, R.; Reinhart, I.; Voelkel, T.; Piechaczek, C.; Galambos, P.; Jager, M.J.; Richard, G.; Lange, C.; et al. Expression of CD133 and other putative stem cell markers in uveal melanoma. Melanoma Res. 2011, 21, 405–416. [Google Scholar] [CrossRef] [PubMed]
  24. Harbour, J.W.; Chen, R. The DecisionDx-UM Gene Expression Profile Test Provides Risk Stratification and Individualized Patient Care in Uveal Melanoma. PLoS Curr. 2013, 5, ecurrents.eogt.af8ba80fc776c778f771ce778f775dc485d774a618. [Google Scholar] [CrossRef]
  25. Bande, M.F.; Santiago, M.; Muinelo-Romay, L.; Blanco, M.J.; Mera, P.; Capeans, C.; Pardo, M.; Pineiro, A. Detection of circulating melanoma cells in choroidal melanocytic lesions. BMC Res. Notes 2015, 8, 452. [Google Scholar] [CrossRef] [Green Version]
  26. Frank, N.Y.; Margaryan, A.; Huang, Y.; Schatton, T.; Waaga-Gasser, A.M.; Gasser, M.; Sayegh, M.H.; Sadee, W.; Frank, M.H. ABCB5-mediated doxorubicin transport and chemoresistance in human malignant melanoma. Cancer Res. 2005, 65, 4320–4333. [Google Scholar] [CrossRef] [Green Version]
  27. Hoashi, T.; Watabe, H.; Muller, J.; Yamaguchi, Y.; Vieira, W.D.; Hearing, V.J. MART-1 is required for the function of the melanosomal matrix protein PMEL17/GP100 and the maturation of melanosomes. J. Biol. Chem. 2005, 280, 14006–14016. [Google Scholar] [CrossRef] [Green Version]
  28. Wang, Z.; Xu, Q.; Zhang, N.; Du, X.; Xu, G.; Yan, X. CD146, from a melanoma cell adhesion molecule to a signaling receptor. Signal Transduct. Target. Ther. 2020, 5, 148. [Google Scholar] [CrossRef]
  29. Eisenstein, A.; Gonzalez, E.C.; Raghunathan, R.; Xu, X.; Wu, M.; McLean, E.O.; McGee, J.; Ryu, B.; Alani, R.M. Emerging Biomarkers in Cutaneous Melanoma. Mol. Diagn. Ther. 2018, 22, 203–218. [Google Scholar] [CrossRef]
  30. Lutz, N.W.; Banerjee, P.; Wilson, B.J.; Ma, J.; Cozzone, P.J.; Frank, M.H. Expression of Cell-Surface Marker ABCB5 Causes Characteristic Modifications of Glucose, Amino Acid and Phospholipid Metabolism in the G3361 Melanoma-Initiating Cell Line. PLoS ONE 2016, 11, e0161803. [Google Scholar] [CrossRef] [PubMed] [Green Version]
  31. Cools-Lartigue, J.J.; McCauley, C.S.; Marshall, J.-C.A.; Di Cesare, S.; Gregoire, F.; Antecka, E.; Logan, P.; Burnier, M.N. Immunomagnetic isolation and in vitro expansion of human uveal melanoma cell lines. Mol. Vis. 2008, 14, 50–55. [Google Scholar] [PubMed]
  32. Li, Y.; Madigan, M.C.; Lai, K.; Conway, R.M.; Billson, F.A.; Crouch, R.; Allen, B.J. Human uveal melanoma expresses NG2 immunoreactivity. Br. J. Ophthalmol. 2003, 87, 629–632. [Google Scholar] [CrossRef] [PubMed]
  33. Campoli, M.R.; Chang, C.C.; Kageshita, T.; Wang, X.; McCarthy, J.B.; Ferrone, S. Human high molecular weight-melanoma-associated antigen (HMW-MAA): A melanoma cell surface chondroitin sulfate proteoglycan (MSCP) with biological and clinical significance. Crit. Rev. Immunol. 2004, 24, 267–296. [Google Scholar] [CrossRef] [PubMed]
  34. Xie, R.; Chung, J.Y.; Ylaya, K.; Williams, R.L.; Guerrero, N.; Nakatsuka, N.; Badie, C.; Hewitt, S.M. Factors influencing the degradation of archival formalin-fixed paraffin-embedded tissue sections. J. Histochem. Cytochem. 2011, 59, 356–365. [Google Scholar] [CrossRef] [PubMed] [Green Version]
  35. Ramos-Vara, J.A.; Webster, J.D.; DuSold, D.; Miller, M.A. Immunohistochemical evaluation of the effects of paraffin section storage on biomarker stability. Vet. Pathol. 2014, 51, 102–109. [Google Scholar] [CrossRef] [PubMed] [Green Version]
  36. De Vries, T.J.; Trancikova, D.; Ruiter, D.J.; van Muijen, G.N. High expression of immunotherapy candidate proteins gp100, MART-1, tyrosinase and TRP-1 in uveal melanoma. Br. J. Cancer 1998, 78, 1156–1161. [Google Scholar] [CrossRef] [PubMed] [Green Version]
  37. Beutel, J.; Wegner, J.; Wegner, R.; Ziemssen, F.; Nassar, K.; Rohrbach, J.M.; Hilgers, R.D.; Luke, M.; Grisanti, S. Possible implications of MCAM expression in metastasis and non-metastatic of primary uveal melanoma patients. Curr. Eye Res. 2009, 34, 1004–1009. [Google Scholar] [CrossRef]
  38. Gray, E.S.; Reid, A.L.; Bowyer, S.; Calapre, L.; Siew, K.; Pearce, R.; Cowell, L.; Frank, M.H.; Millward, M.; Ziman, M. Circulating Melanoma Cell Subpopulations: Their Heterogeneity and Differential Responses to Treatment. J. Investig. Dermatol. 2015, 135, 2040–2048. [Google Scholar] [CrossRef] [Green Version]
  39. Schatton, T.; Murphy, G.F.; Frank, N.Y.; Yamaura, K.; Waaga-Gasser, A.M.; Gasser, M.; Zhan, Q.; Jordan, S.; Duncan, L.M.; Weishaupt, C.; et al. Identification of cells initiating human melanomas. Nature 2008, 451, 345–349. [Google Scholar] [CrossRef] [PubMed] [Green Version]
  40. Ma, J.; Lin, J.Y.; Alloo, A.; Wilson, B.J.; Schatton, T.; Zhan, Q.; Murphy, G.F.; Waaga-Gasser, A.M.; Gasser, M.; Stephen Hodi, F.; et al. Isolation of tumorigenic circulating melanoma cells. Biochem. Biophys. Res. Commun. 2010, 402, 711–717. [Google Scholar] [CrossRef] [Green Version]
  41. Aalto, Y.; Eriksson, L.; Seregard, S.; Larsson, O.; Knuutila, S. Concomitant loss of chromosome 3 and whole arm losses and gains of chromosome 1, 6, or 8 in metastasizing primary uveal melanoma. Investig. Ophthalmol. Vis. Sci. 2001, 42, 313–317. [Google Scholar]
  42. Damato, B.; Dopierala, J.A.; Coupland, S.E. Genotypic profiling of 452 choroidal melanomas with multiplex ligation-dependent probe amplification. Clin. Cancer Res. 2010, 16, 6083–6092. [Google Scholar] [CrossRef] [Green Version]
  43. Kamalidehghan, B.; Houshmand, M.; Kamalidehghan, F.; Jafarzadeh, N.; Azari, S.; Akmal, S.N.; Rosli, R. Establishment and characterization of two human breast carcinoma cell lines by spontaneous immortalization: Discordance between Estrogen, Progesterone and HER2/neu receptors of breast carcinoma tissues with derived cell lines. Cancer Cell Int. 2012, 12, 43. [Google Scholar] [CrossRef] [Green Version]
  44. Warkiani, M.E.; Khoo, B.L.; Wu, L.; Tay, A.K.; Bhagat, A.A.; Han, J.; Lim, C.T. Ultra-fast, label-free isolation of circulating tumor cells from blood using spiral microfluidics. Nat. Protoc. 2016, 11, 134–148. [Google Scholar] [CrossRef]
  45. Sarioglu, A.F.; Aceto, N.; Kojic, N.; Donaldson, M.C.; Zeinali, M.; Hamza, B.; Engstrom, A.; Zhu, H.; Sundaresan, T.K.; Miyamoto, D.T.; et al. A microfluidic device for label-free, physical capture of circulating tumor cell clusters. Nat. Methods 2015, 12, 685–691. [Google Scholar] [CrossRef]
  46. Yeo, T.; Tan, S.J.; Lim, C.L.; Lau, D.P.; Chua, Y.W.; Krisna, S.S.; Iyer, G.; Tan, G.S.; Lim, T.K.; Tan, D.S.; et al. Microfluidic enrichment for the single cell analysis of circulating tumor cells. Sci. Rep. 2016, 6, 22076. [Google Scholar] [CrossRef] [Green Version]
  47. Khoja, L.; Shenjere, P.; Hodgson, C.; Hodgetts, J.; Clack, G.; Hughes, A.; Lorigan, P.; Dive, C. Prevalence and heterogeneity of circulating tumour cells in metastatic cutaneous melanoma. Melanoma Res. 2014, 24, 40–46. [Google Scholar] [CrossRef]
  48. De Giorgi, V.; Pinzani, P.; Salvianti, F.; Panelos, J.; Paglierani, M.; Janowska, A.; Grazzini, M.; Wechsler, J.; Orlando, C.; Santucci, M.; et al. Application of a filtration- and isolation-by-size technique for the detection of circulating tumor cells in cutaneous melanoma. J. Investig. Dermatol. 2010, 130, 2440–2447. [Google Scholar] [CrossRef]
  49. Aya-Bonilla, C.; Marsavela, G.; Freeman, J.B.; Lomma, C.; Frank, M.H.; Khattak, M.A.; Meniawy, T.M.; Millward, M.; Warkiani, M.E.; Gray, E.S.; et al. Isolation and detection of circulating tumour cells from metastatic melanoma patients using a slanted spiral microfluidic device. Oncotarget 2017, 8, 67355–67368. [Google Scholar] [CrossRef] [Green Version]
  50. Aya-Bonilla, C.A.; Morici, M.; Hong, X.; McEvoy, A.C.; Sullivan, R.J.; Freeman, J.; Calapre, L.; Khattak, M.A.; Meniawy, T.; Millward, M.; et al. Detection and prognostic role of heterogeneous populations of melanoma circulating tumour cells. Br. J. Cancer 2020, 122, 1059–1067. [Google Scholar] [CrossRef] [PubMed]
  51. Mazzini, C.; Pinzani, P.; Salvianti, F.; Scatena, C.; Paglierani, M.; Ucci, F.; Pazzagli, M.; Massi, D. Circulating tumor cells detection and counting in uveal melanomas by a filtration-based method. Cancers 2014, 6, 323–332. [Google Scholar] [CrossRef] [Green Version]
  52. Anand, K.; Roszik, J.; Gombos, D.; Upshaw, J.; Sarli, V.; Meas, S.; Lucci, A.; Hall, C.; Patel, S. Pilot Study of Circulating Tumor Cells in Early-Stage and Metastatic Uveal Melanoma. Cancers 2019, 11, 856. [Google Scholar] [CrossRef] [Green Version]
  53. Chew, A.L.; Spilsbury, K.; Isaacs, T.W. Survival from uveal melanoma in Western Australia 1981–2005. Clin. Exp. Ophthalmol. 2015, 43, 422–428. [Google Scholar] [CrossRef] [PubMed] [Green Version]
  54. Diener-West, M.; Reynolds, S.M.; Agugliaro, D.J.; Caldwell, R.; Cumming, K.; Earle, J.D.; Green, D.L.; Hawkins, B.S.; Hayman, J.; Jaiyesimi, I.; et al. Screening for Metastasis From Choroidal Melanoma: The Collaborative Ocular Melanoma Study Group Report 23. J. Clin. Oncol. 2004, 22, 2438–2444. [Google Scholar] [CrossRef]
  55. Gragoudas, E.S.; Egan, K.M.; Seddon, J.M.; Glynn, R.J.; Walsh, S.M.; Finn, S.M.; Munzenrider, J.E.; Spar, M.D. Survival of patients with metastases from uveal melanoma. Ophthalmology 1991, 98, 383–389. [Google Scholar] [CrossRef]
  56. Rietschel, P.; Panageas, K.S.; Hanlon, C.; Patel, A.; Abramson, D.H.; Chapman, P.B. Variates of Survival in Metastatic Uveal Melanoma. J. Clin. Oncol. 2005, 23, 8076–8080. [Google Scholar] [CrossRef] [PubMed]
  57. Heitzer, E.; Auer, M.; Gasch, C.; Pichler, M.; Ulz, P.; Hoffmann, E.M.; Lax, S.; Waldispuehl-Geigl, J.; Mauermann, O.; Lackner, C.; et al. Complex tumor genomes inferred from single circulating tumor cells by array-CGH and next-generation sequencing. Cancer Res. 2013, 73, 2965–2975. [Google Scholar] [CrossRef] [Green Version]
  58. Tura, A.; Merz, H.; Reinsberg, M.; Luke, M.; Jager, M.J.; Grisanti, S.; Luke, J. Analysis of monosomy-3 in immunomagnetically isolated circulating melanoma cells in uveal melanoma patients. Pigment Cell Melanoma Res. 2016, 29, 583–589. [Google Scholar] [CrossRef] [PubMed]
  59. Filshie, R.J.; Zannettino, A.C.; Makrynikola, V.; Gronthos, S.; Henniker, A.J.; Bendall, L.J.; Gottlieb, D.J.; Simmons, P.J.; Bradstock, K.F. MUC18, a member of the immunoglobulin superfamily, is expressed on bone marrow fibroblasts and a subset of hematological malignancies. Leukemia 1998, 12, 414–421. [Google Scholar] [CrossRef] [Green Version]
  60. Dye, D.E.; Karlen, S.; Rohrbach, B.; Staub, O.; Braathen, L.R.; Eidne, K.A.; Coombe, D.R. hShroom1 links a membrane bound protein to the actin cytoskeleton. Cell. Mol. Life Sci. 2009, 66, 681–696. [Google Scholar] [CrossRef] [PubMed]
Figure 1. Immunohistochemistry of uveal melanoma. TMA staining demonstrating (a) Examples of how tumours were scored for protein localisation. Left shows strong membranous staining and right shows strong cytoplasmic staining. Representative image of positive MCSP membranous staining (left). (b) Examples of the criteria used to measure staining intensity, from 1 indicating weak staining to 3, the most intense staining. A tissue staining negatively by immunohistochemistry (0), is also shown (left), with intrinsic melanin pigment. (c) Shows a typical positive staining pattern for each of the markers analysed. Dark granular black spots are melanin deposits, and were not counted toward positive marker expression. All images taken at 200× magnification. Scale Bar = 50 μm.
Cancers 13 05990 g001
Figure 2. Immunocytochemical analysis of uveal melanoma cell lines. Intracellular markers and isotype controls. All images taken at 400× magnification. Scale bar denoting 100 µm. rISO—rabbit isotype control; mISO—mouse isotype control.
Cancers 13 05990 g002
Figure 3. Expression of markers in cell lines by flow cytometry. Flow cytometric analysis of primary (MP38, MP41, MP46, and MP65) and metastatic (MM28) cell lines. Grey profiles represent negative controls using either rabbit or mouse IgGs depending on the primary antibody host.
Cancers 13 05990 g003
Figure 4. Example images of cells found in patient blood samples. Top to bottom: circulating tumour cell (CTC), double positive peripheral blood mononuclear cell (PBMC), and standard PBMC. CTCs were defined as melanoma (MEL: MART1, gp100, and S100β, green) and Hoechst (DNA, blue) positive, PBMC marker (CD45/CD16, purple) negative. Double positive PBMCs were not counted as CTCs, but were PBMCs (PBMC, purple) that strongly expressed melanoma (MEL, green) markers, and PBMCs were classified by the presence of CD45/CD16 (PBMC, purple).
Cancers 13 05990 g004
Figure 5. Correlation between circulating tumour cell numbers and patient and tumour features. Graphs illustrate Circulating Tumour Cell (CTC) counts between (a) apical tumour height (ρ = 0.1, p = 0.52), (b) largest basal diameter (ρ = 0.22, p = 0.18), (c) anatomical location (n = 43, p = 0.75), (d) age (ρ = −0.28, p = 0.066), (e) risk groups (n = 17, p = 0.3), and (f) the MCSP and multi-marker cohort (n = 69, Wilcoxon p = 0.14, χ2 p = 0.1694). Ρ in A, B, and D refers to Rho.
Cancers 13 05990 g005
Figure 6. Overall and progression free survival of the MCSP and multi-marker cohorts. Kaplan-Meier estimates of (a) MCSP CTC OS, (b) MCSP CTC PFS, (c) multi-marker OS, and (d) multi-marker PFS grouped into <3 CTCs or ≥3 CTCs. OS—overall survival, PFS—progression free survival, MM—multi-marker. Log-rank p values are displayed on the graph.
Cancers 13 05990 g006
Table 1. Clinical, Genotypic, and Histological Characteristics of Patient Tissue Samples Used on the Tissue Micro Array.
IDAge *Cell Morphology (Callender)TMA Cell Morphology (Callender)Tumour Size
Basal × Height (mm)
LocationMetastatic Disease: Interval Time (Months)MLPA
PUM138M (Predominantly S)M12 × 9Left choroidalNo: 51NC **
PUM251MS/M12 × 8Right choroidalYes: 18L3p, L3q, G8q
PUM365ME/M10 × 6Left choroidalYes: 33L3p, G8q
PUM447ME/M11 × 12Right choroidalYes: −3L3p, L3q, G8q
PUM559MS/M9 × 4Right choroidalNo: 42G8q
PUM631M (E < 10%)E/M15 × 12Left choroidalYes: 12G8q, some evidence of 3p loss, but not strong
PUM742SS16 × 9Left choroidalUnknownNC
PUM880MS11 × 12Left choroidalUnknownloss 1p, 3p, 3q, gain 8q
PUM959ME/M14 × 8Right choroidalYes: 3loss 3p, 3q, gain 8q
PUM1079ME20 × 15Right choroidalNo: 19NC **
* Age at enucleation, ** Poorer quality DNA, M—mixed, S—Spindle, E—epithelioid, NC—no change, L—loss, G—gain.
Table 2. Average Marker Intensity Score.
Average Marker Intensity Score
IDABCB5MART1gp100S100βNestin5HT2BMCAMRANKMCSP
PUM53312211.500
PUM63121.501100
PUM10231221220
PUM9221021.5210
PUM232.8121.51000
PUM332.52120010
PUM422.61.300101.30
PUM8331.5000010
PUM7331100000
PUM1022100000
0—no, 1—low, 2—moderate or 3—high antigen expression.
Table 3. Clinical characteristics of the multi-marker CTC cohort.
PIDAgeSexEyeAnatomical LocationApical Height (mm)Largest Basal Diameter (mm)Volume (mm3)Callendar ClassificationBAP1 StatusTissue MutationGenetic FeaturesCTCsFU (Weeks)PFS (Weeks)COD
55659FLeftChoroid4.69.8462Mixed---472
56572MLeftChoroid48.3288---NC2221
58080FLeftChoroid4.610481 2225
64633FRightChoroid2552 0210
69468MLeftChoroid4.310450 1141
69580FLeftChoroid7.917.42503 43732UM
70396FLeftChoroid10152355MixedLGNAQ Q209PL1p, L3, L6q, G8766
71257FRightChoroid1.710178 2413
71672FLeftIris---Spindle-GNAQ Q209LNC1166
72149FLeftChoroid215471MixedPGNA11 Q209LL1p, L3, L8p, G8q312770UM
76363MRightCiliary2.86106 2105
80582MLeftChoroid29170Mixed 2181
84081MRightChoroid11.3163028MixedL-L3, G8q2510467UM
87274MRightChoroid7.617.72492Mixed-GNA11 Q209L-1125
87935FRightCiliary12.613.52404Epithelioid-GNAQ Q209PpL3, G8q10145
99576MLeftChoroid910942 -GNAQ Q209L-20
102271FRightIris--- 583
104126MRightChoroid4.812723MixedLGNAQ R183QL3, L6q, L8p, G8q31115
105969MRightChoroid9203768Mixed-GNAQ Q209P-3112
116062FLeftIris1.6372293MixedP pG6p258
116348MLeftChoroid2.210230---NC2102
118053MLeftChoroid5171512MixedPGNAQ Q209PNC683
121770FRightChoroid4.615.71187 251
121863FLeftChoroid7.412.71249SpindleP--451
122740FLeftCiliary7.510785 488
123131FRightChoroid2.79229 295
123762FRightChoroid3.315777--GNAQ Q209PL1p, pLBAP1, pL6p580
123880MRightChoroid2.212332 621
125854MRightChoroid10183391MixedPGNAQ Q209LG6p, G8q581
128454FRightChoroid210209Mixed--L1p, G6p231
128570FLeftChoroid9141846MixedLGNAQ R183QL1p, L3, G8q058
128652MRightChoroid3.412.5556EpithelioidL--037
128730MRightChoroid4.310.9535EpithelioidP--8937
129769FLeftChoroid6.514.11353 98
129875MLeftChoroid612904--GNA11 Q209LG6p080
130756MLeftIris--- 169448
130873MRightCiliary148938--GNAQ Q209LL1p, L3, G8150
133872MRightChoroid6.513.51240---L1p, L3, G805
137060MLeftChoroid2.710283SpindlePGNAQ Q209PG6p20
138755MRightChoroid11.4204773MixedL-L3, G6p, L6q, G8q135
140153FRightChoroid4.812723 210
140560FRightChoroid1.27.673 30
140886MLeftCiliary15206280Mixed-GNAQ Q209LL1p, L3, pL6p, G8q037
F—female; M—male; L—loss; P—present; NC—no change; FU—follow-up time; p—partial; G—gain; L—loss. UM—uveal melanoma; -—unknown. COD—cause of death.
Publisher’s Note: MDPI stays neutral with regard to jurisdictional claims in published maps and institutional affiliations.

