
Multicenter DSC–MRI-Based Radiomics Predict IDH Mutation in Gliomas

 ,
,  , ,
, , 
Abstract
:Simple Summary
Abstract
1. Introduction
2. Materials and Methods
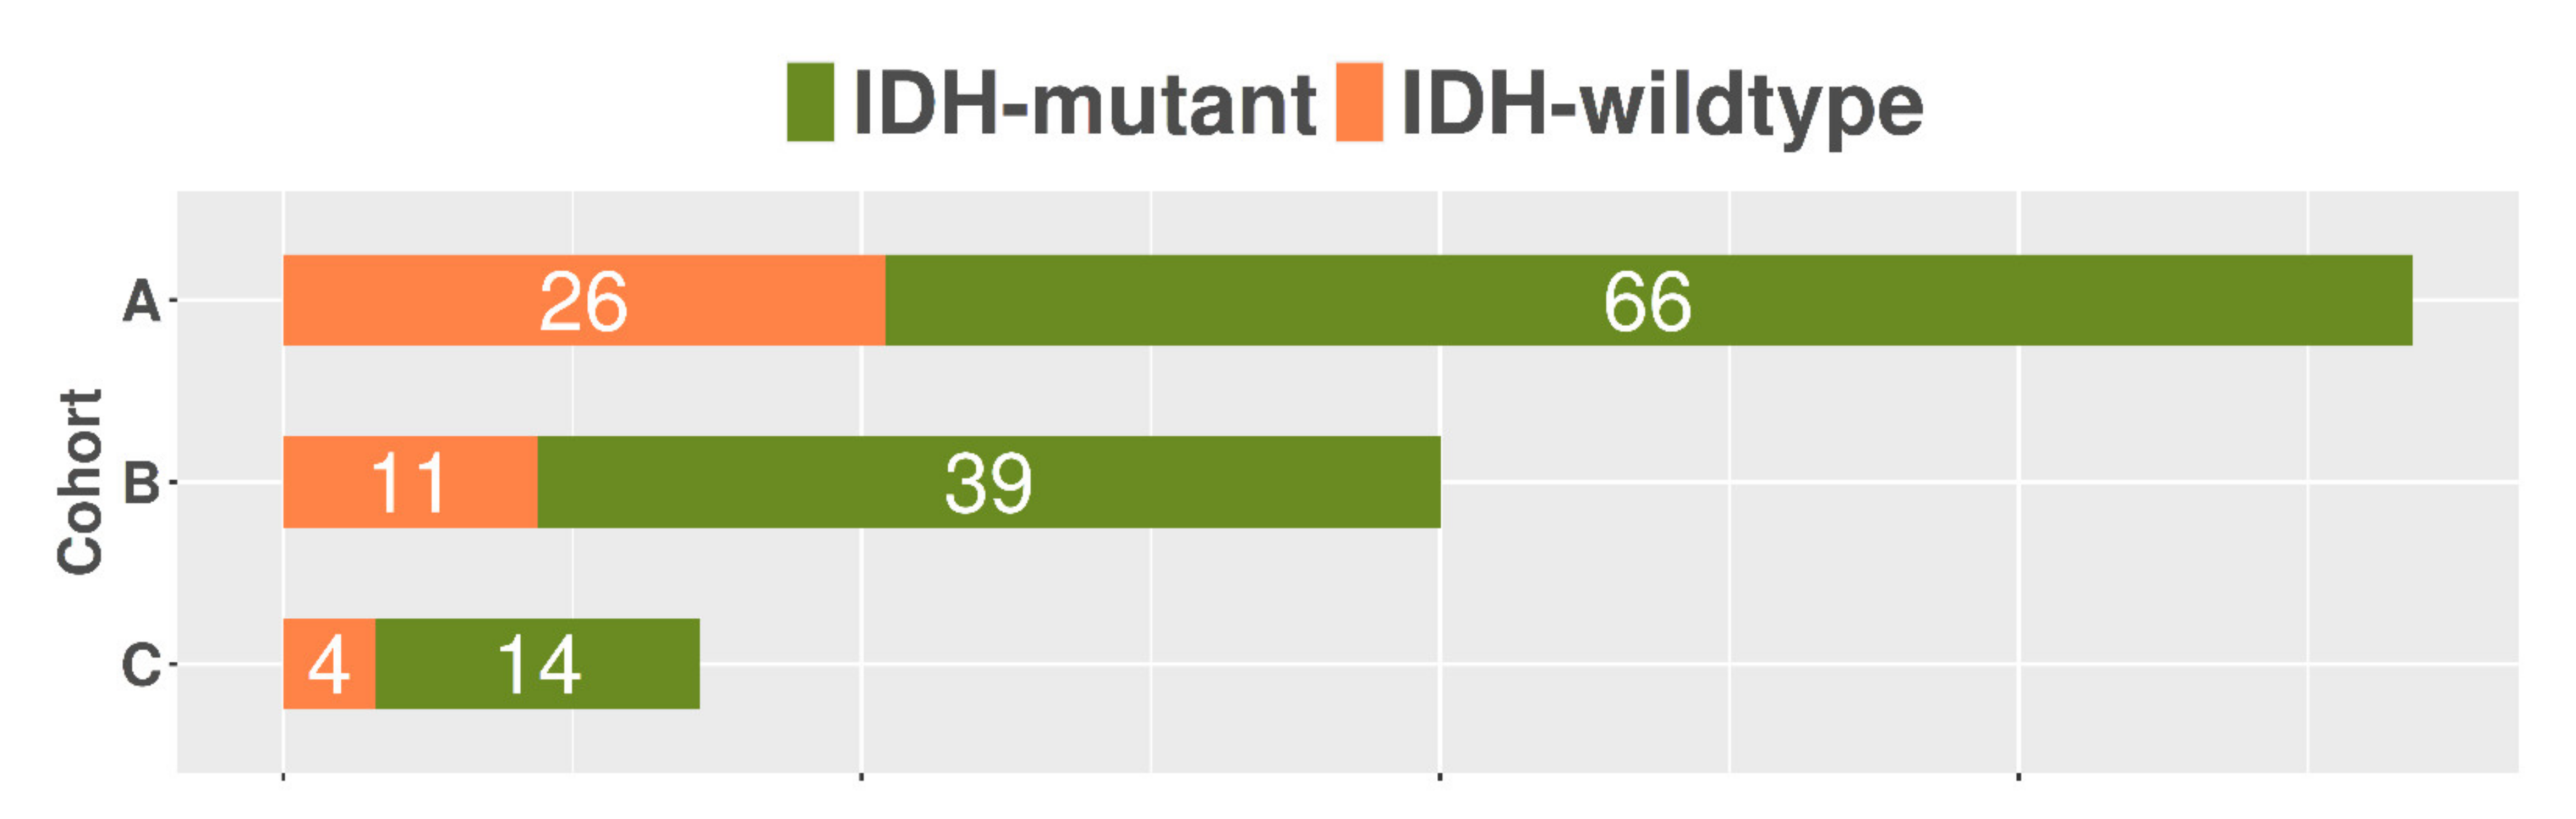
2.1. Patient Population
2.2. MRI Protocol
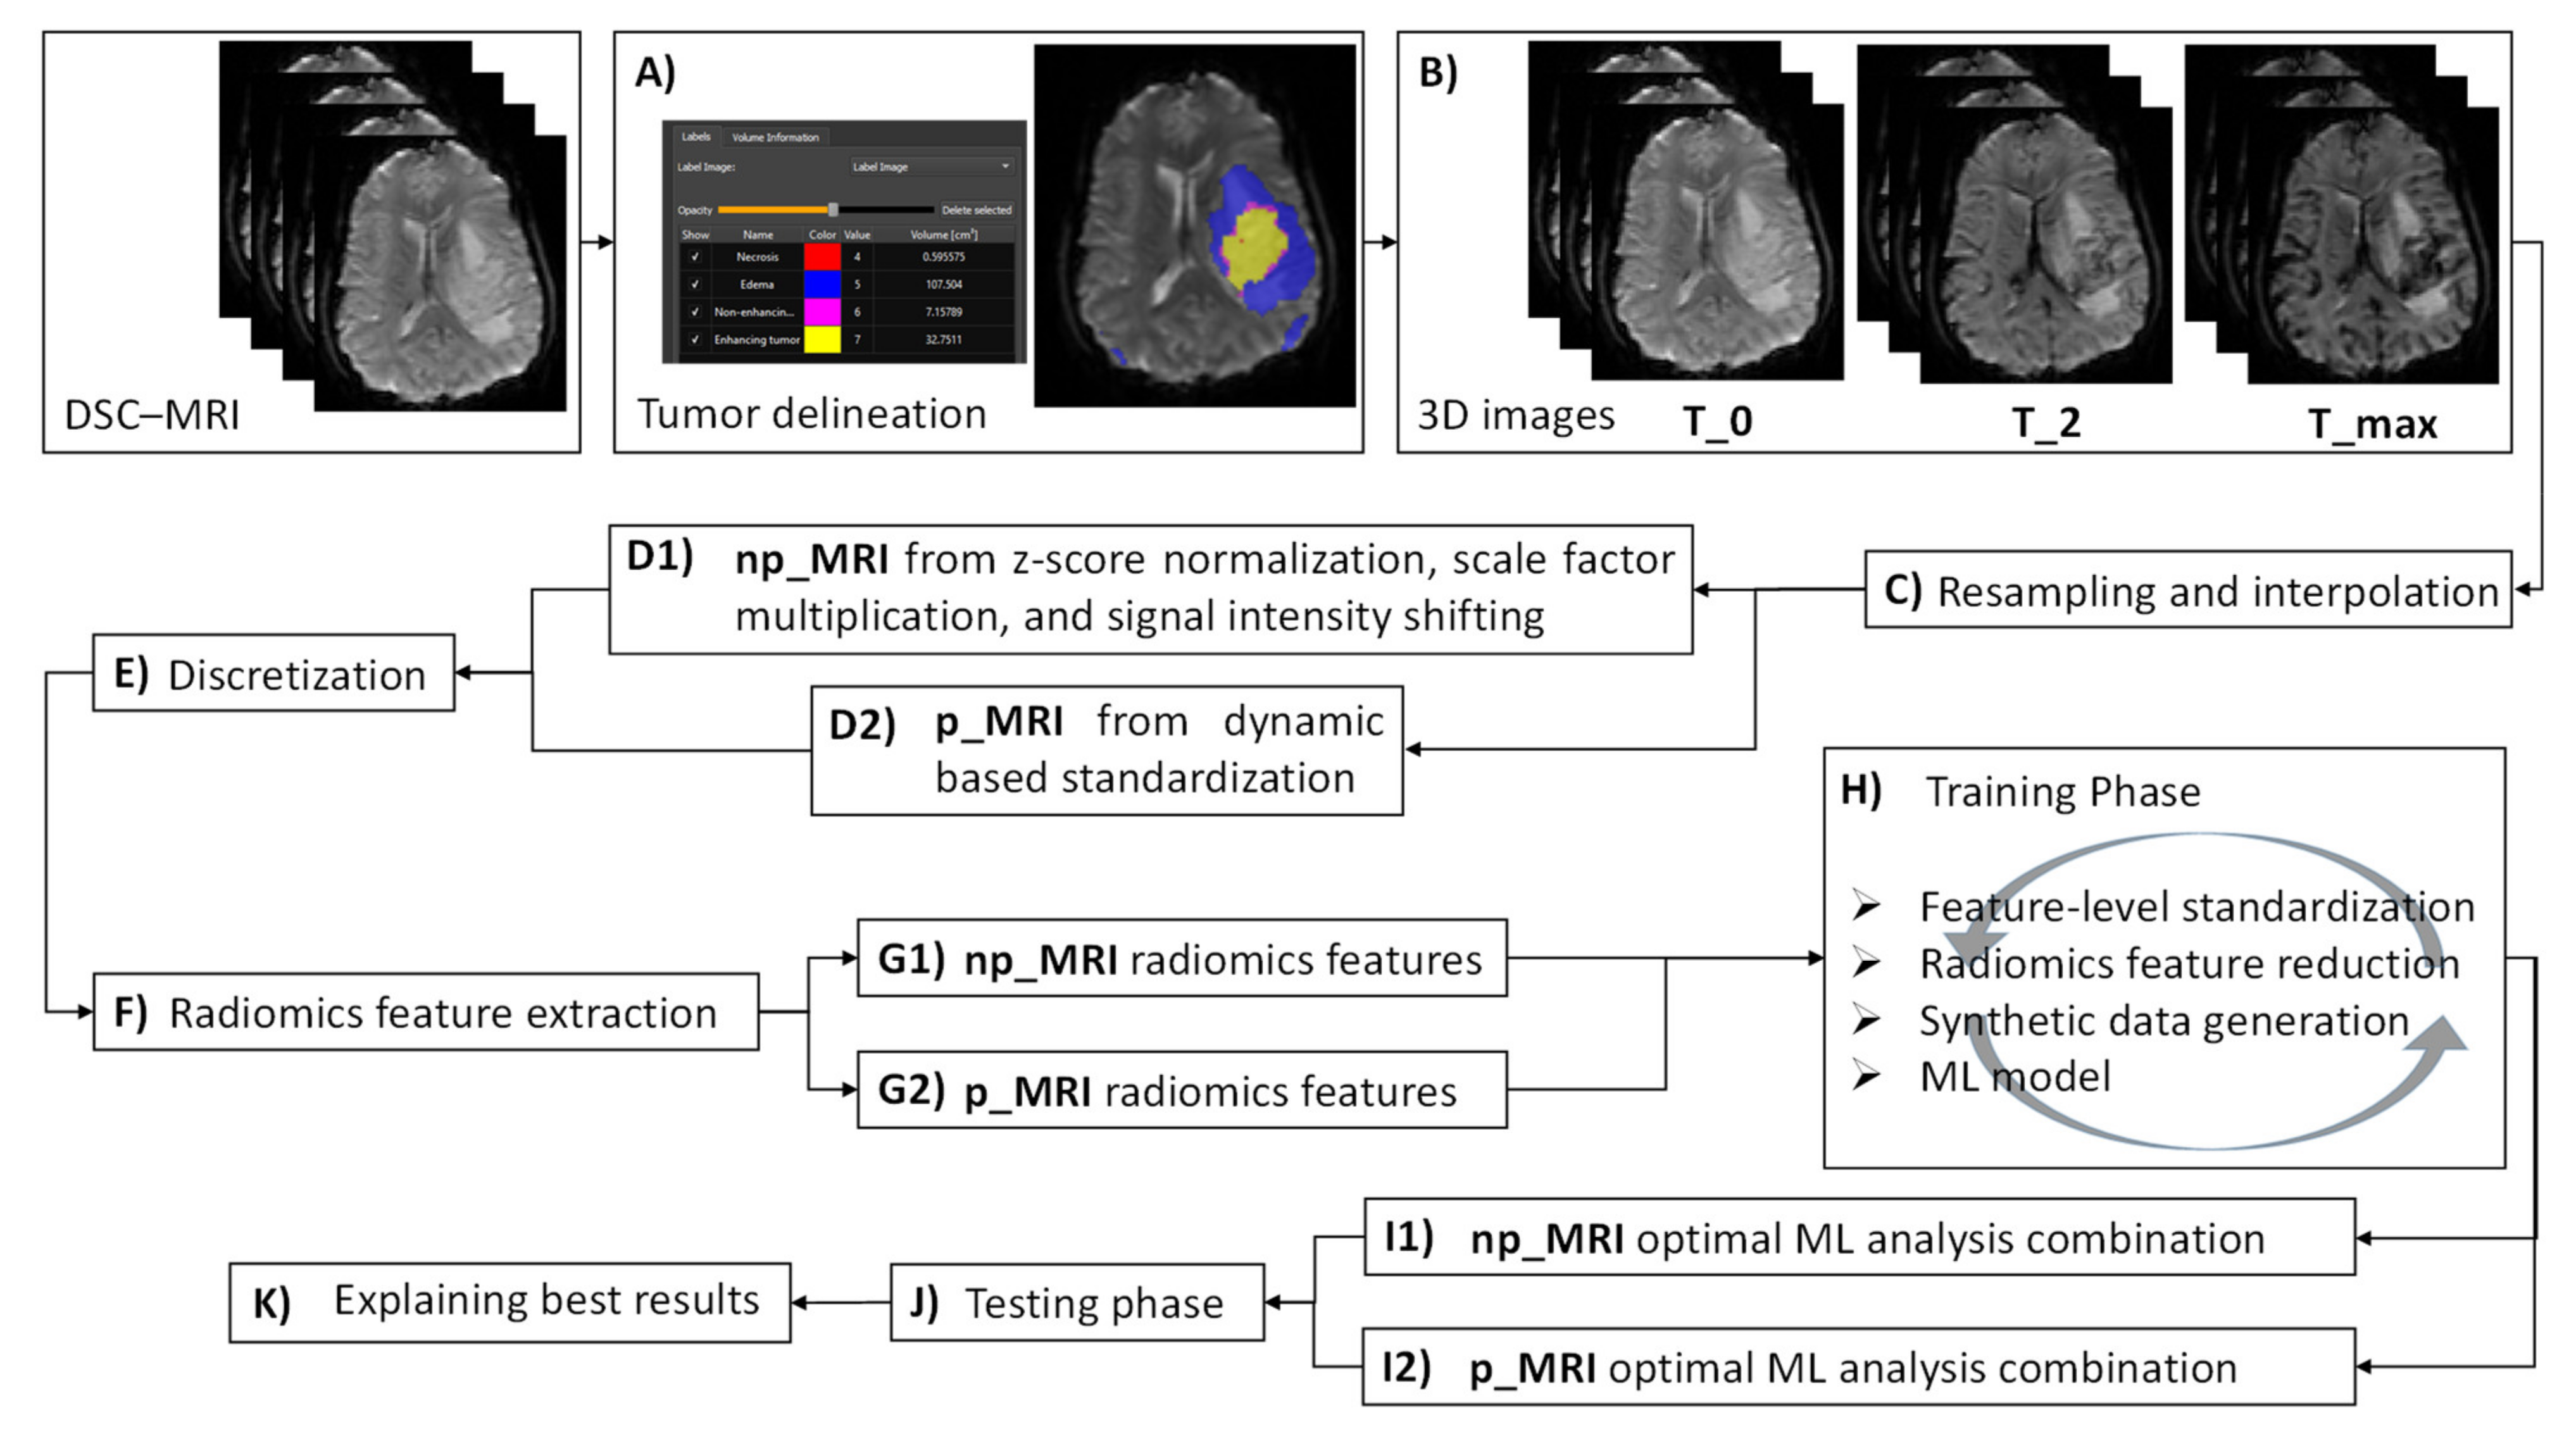
2.3. Tumor Delineation
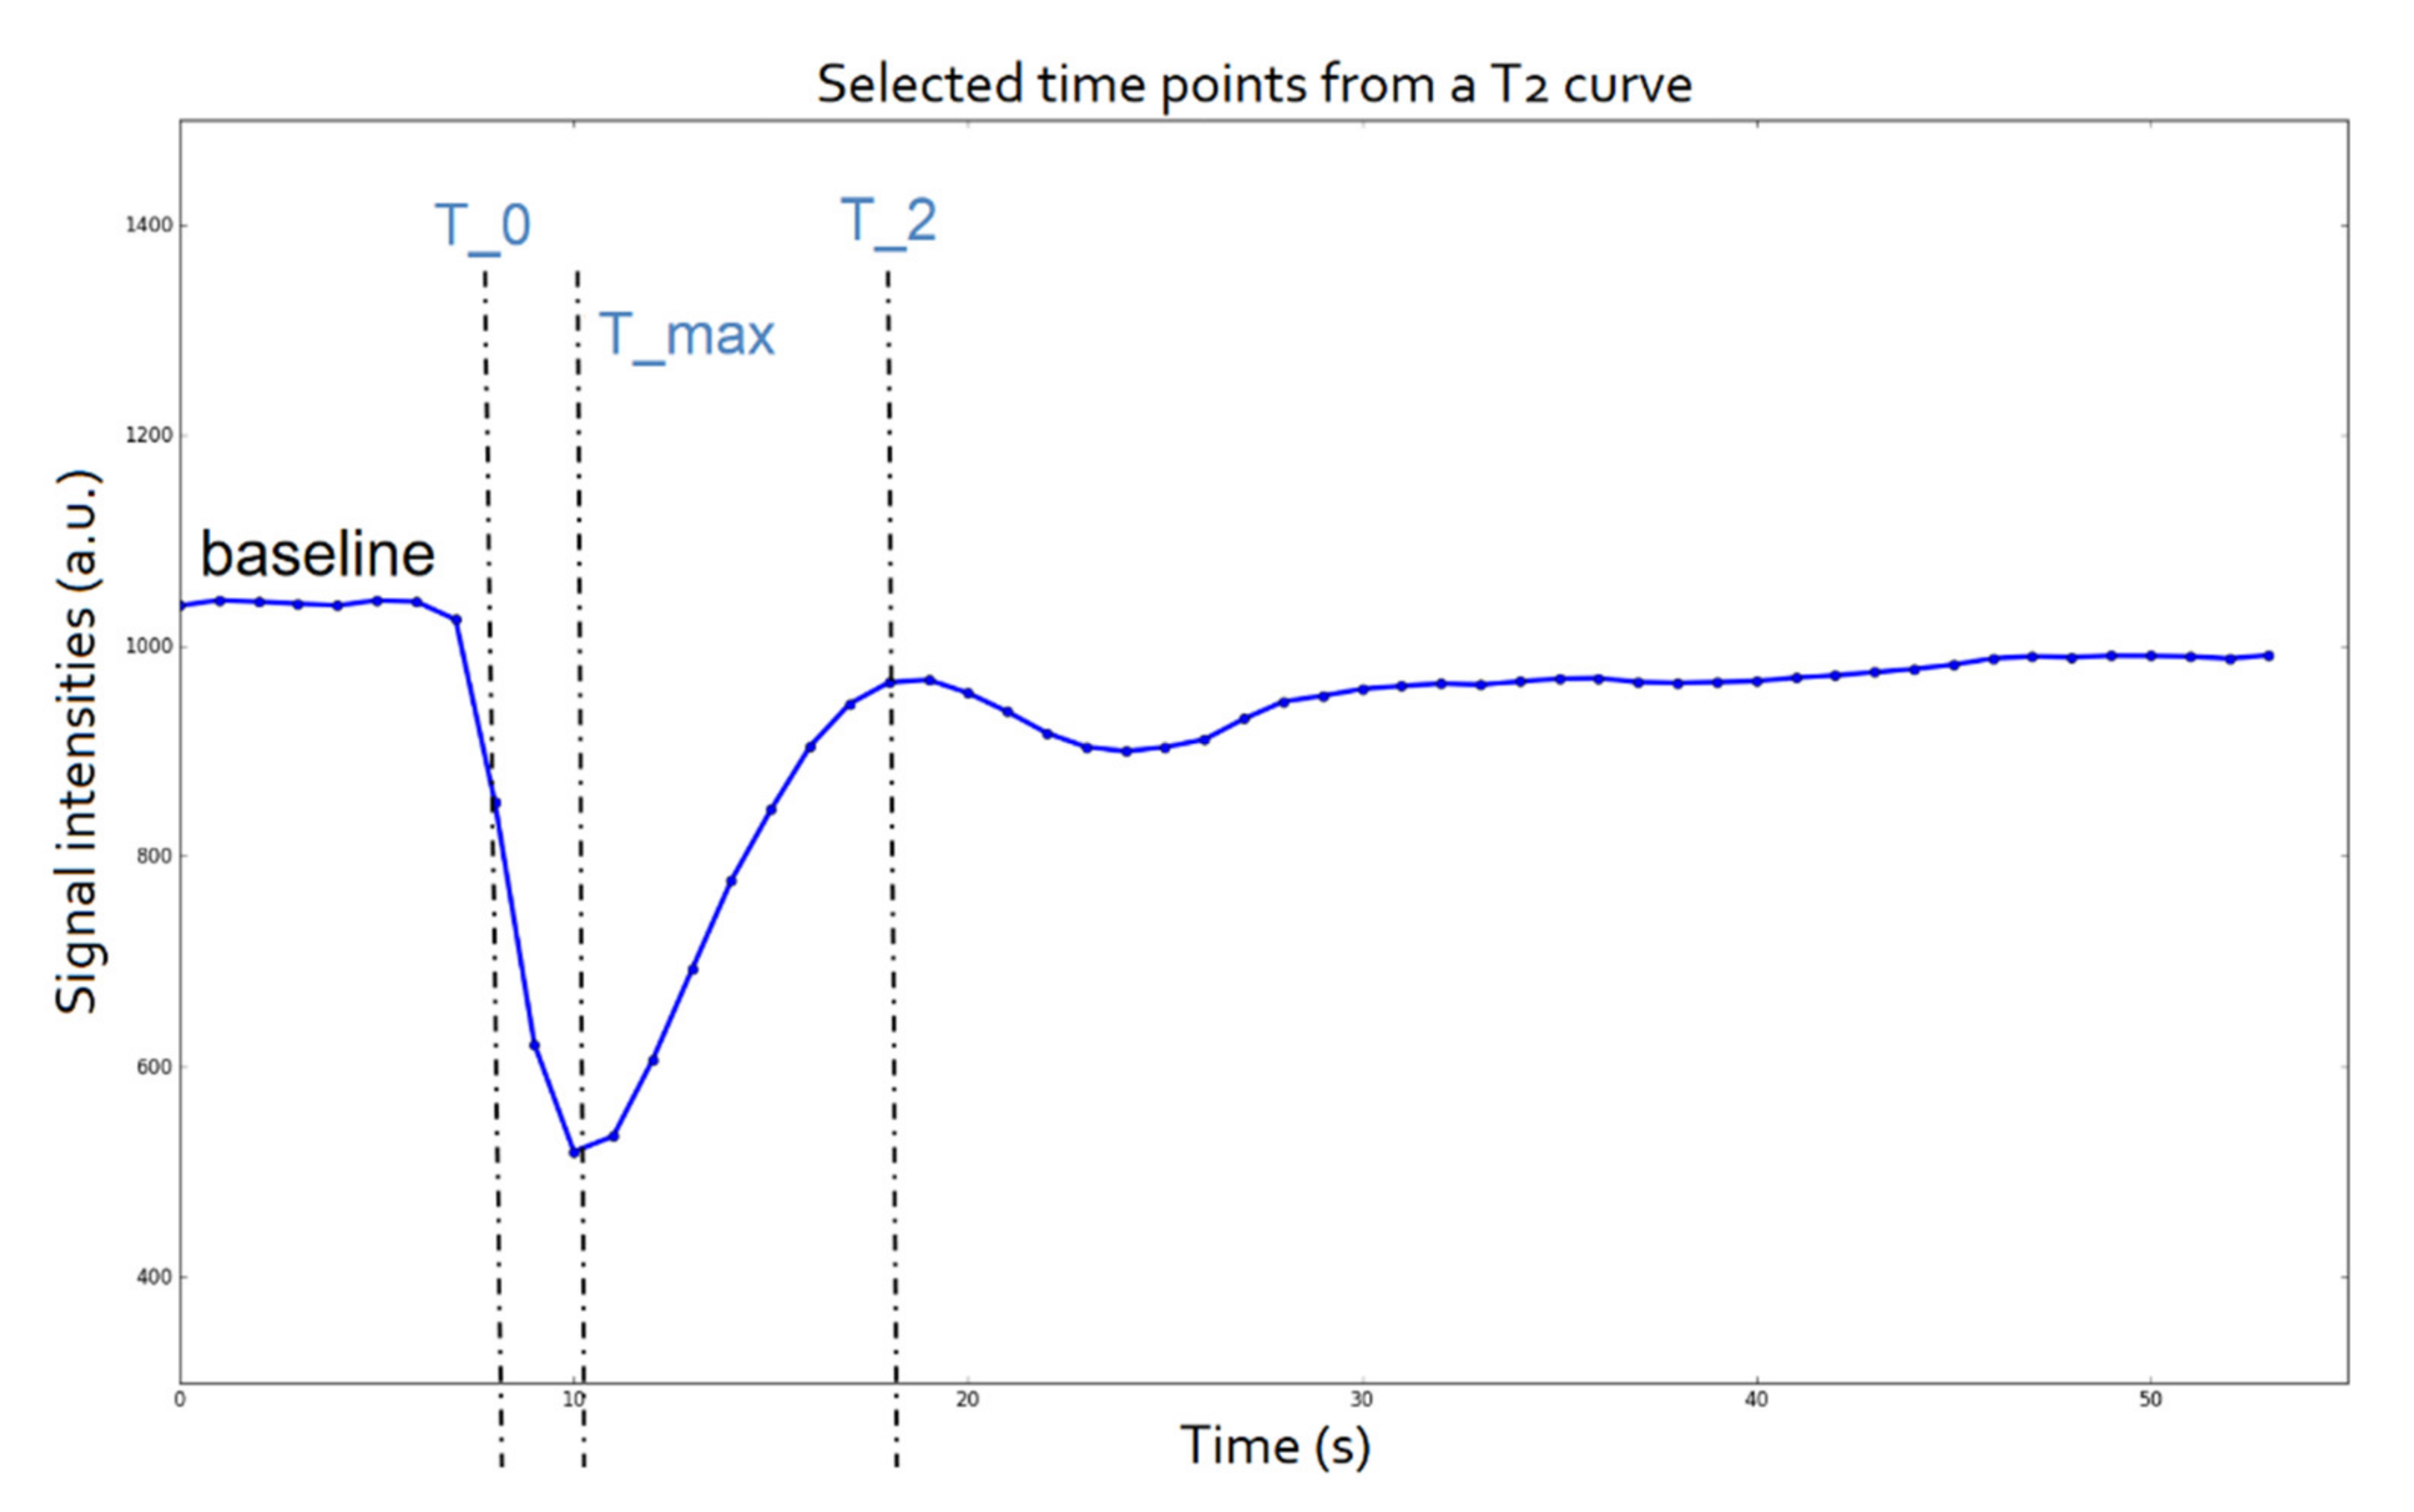
2.4. Time Point Selection
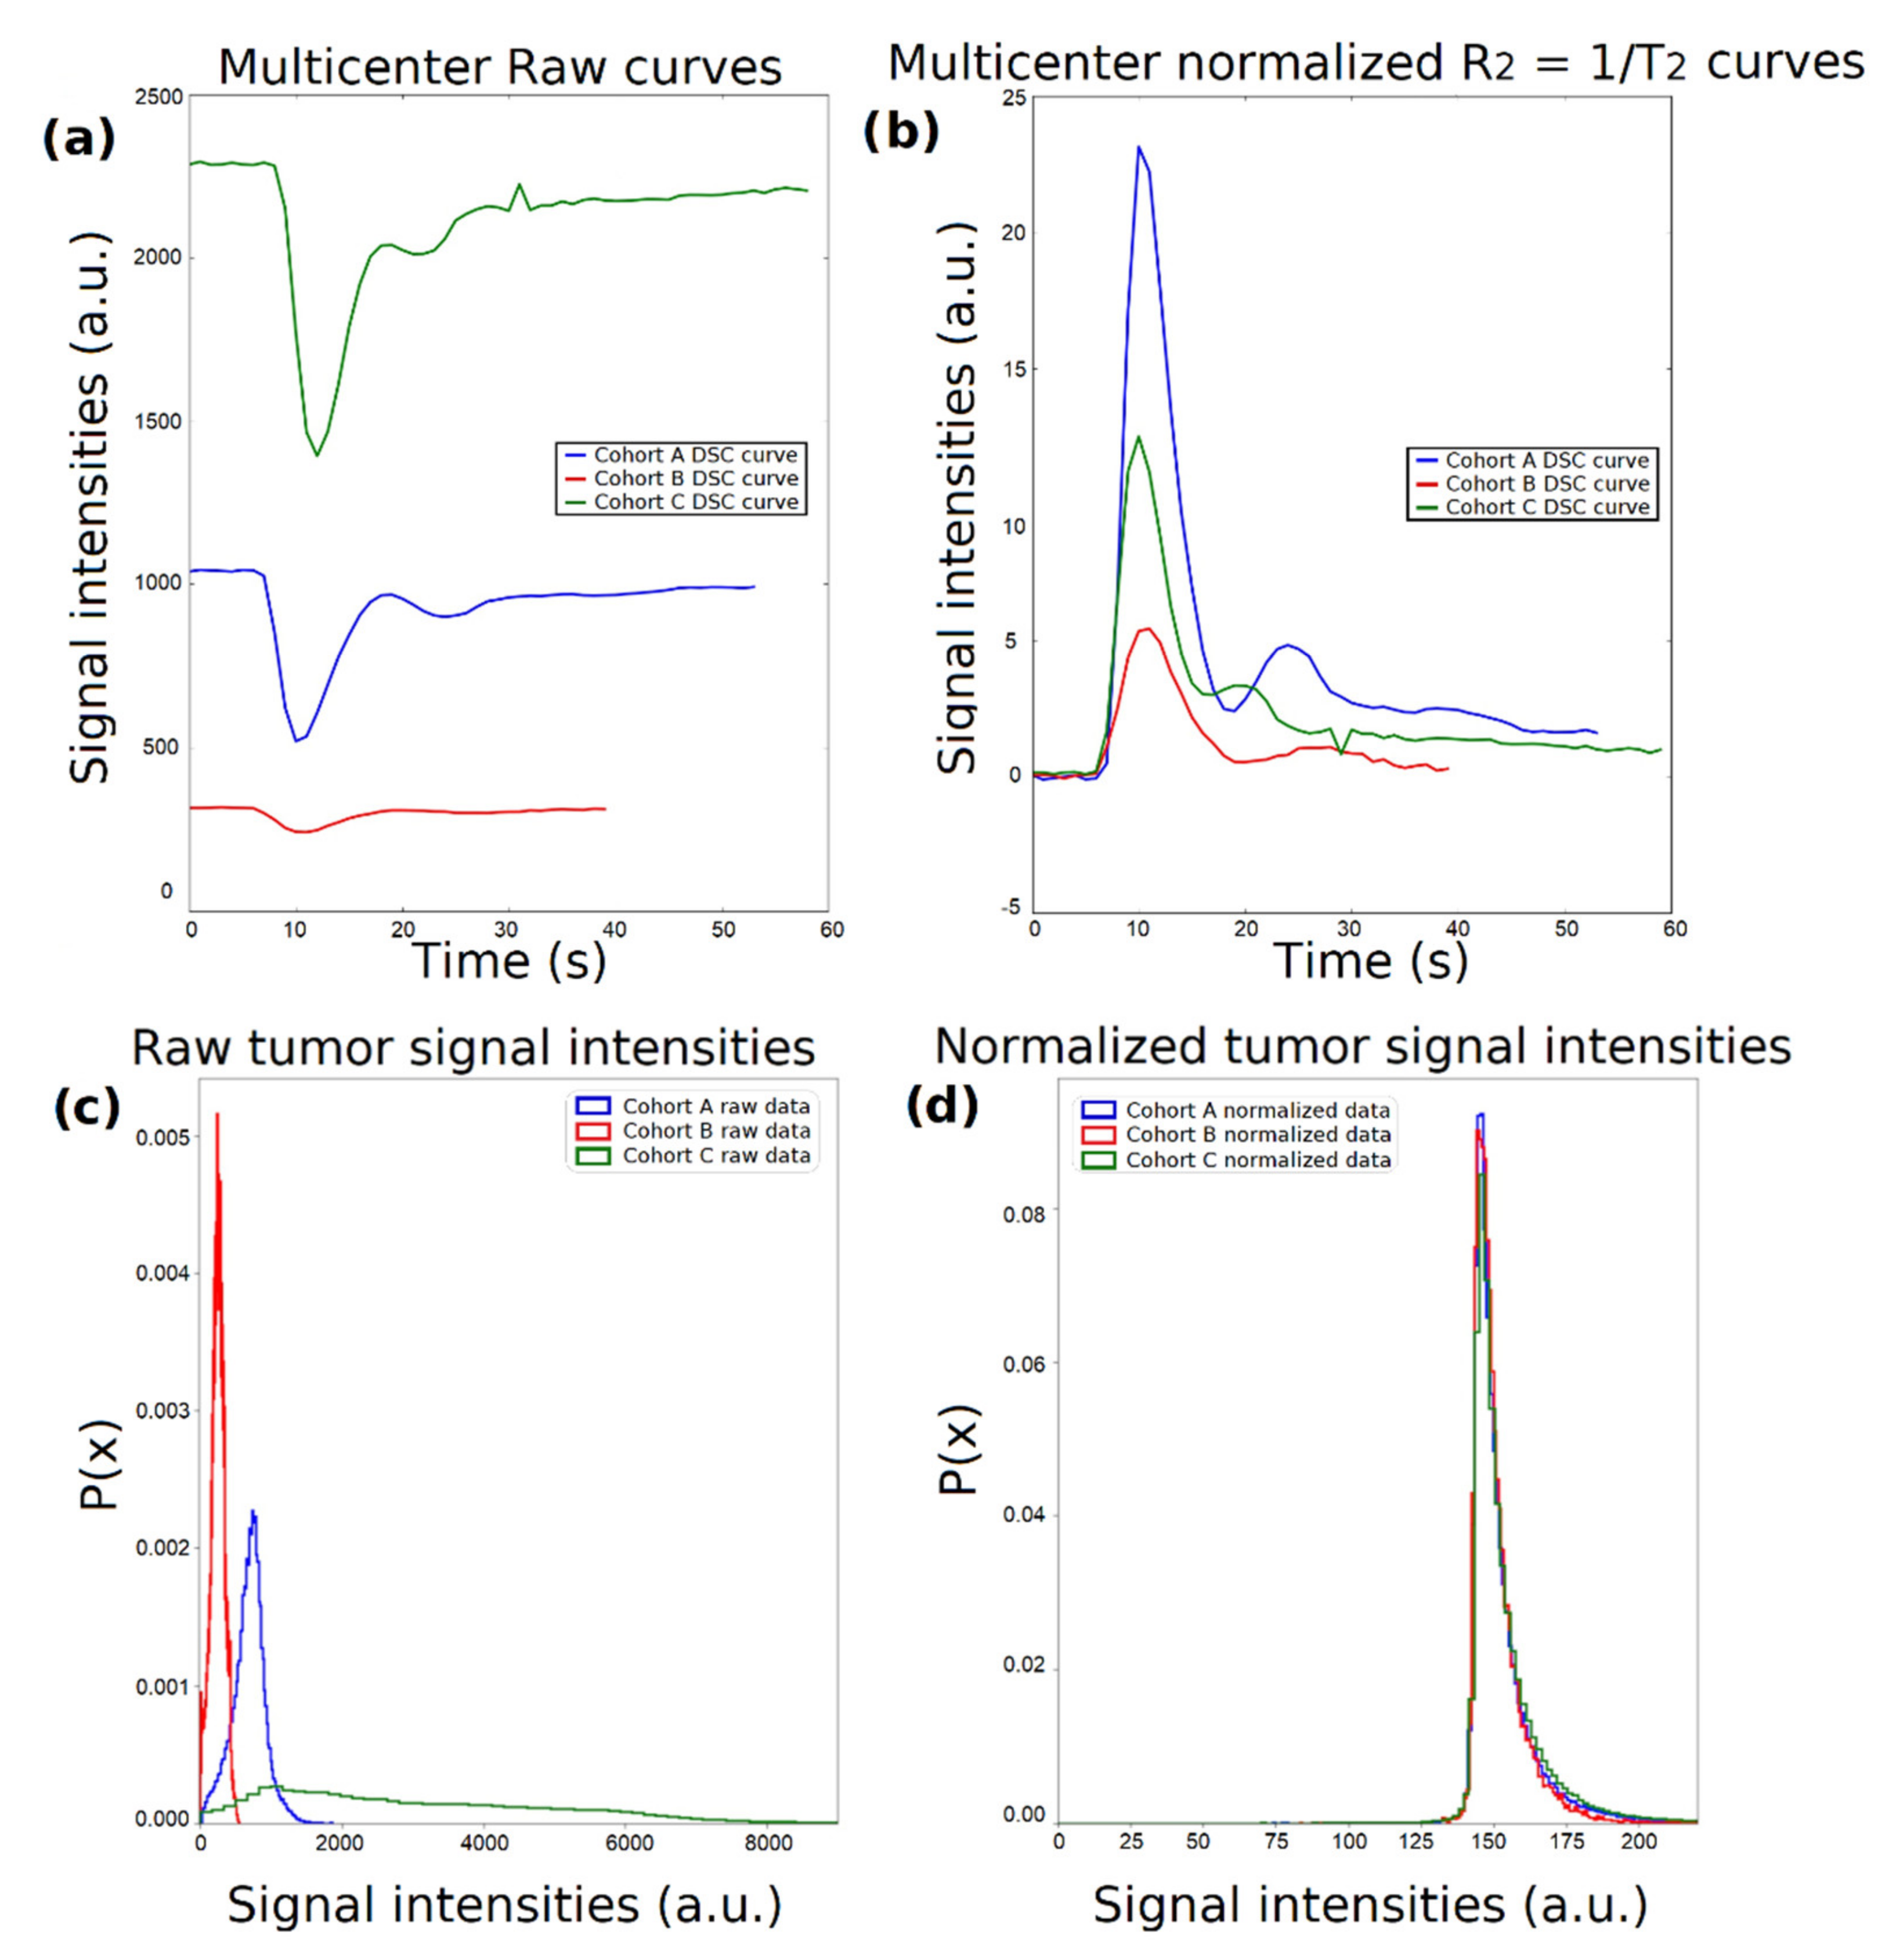
2.5. Dynamic-Based Standardization of the MRI Data
2.6. Radiomics Analysis Workflow
2.6.1. Image Postprocessing
2.6.2. Radiomics Feature Extraction
2.6.3. Machine Learning Analysis Framework
2.6.4. Performance Validation and Explainability of the Predictions
3. Results
- Normalized with “RobustScaler”;
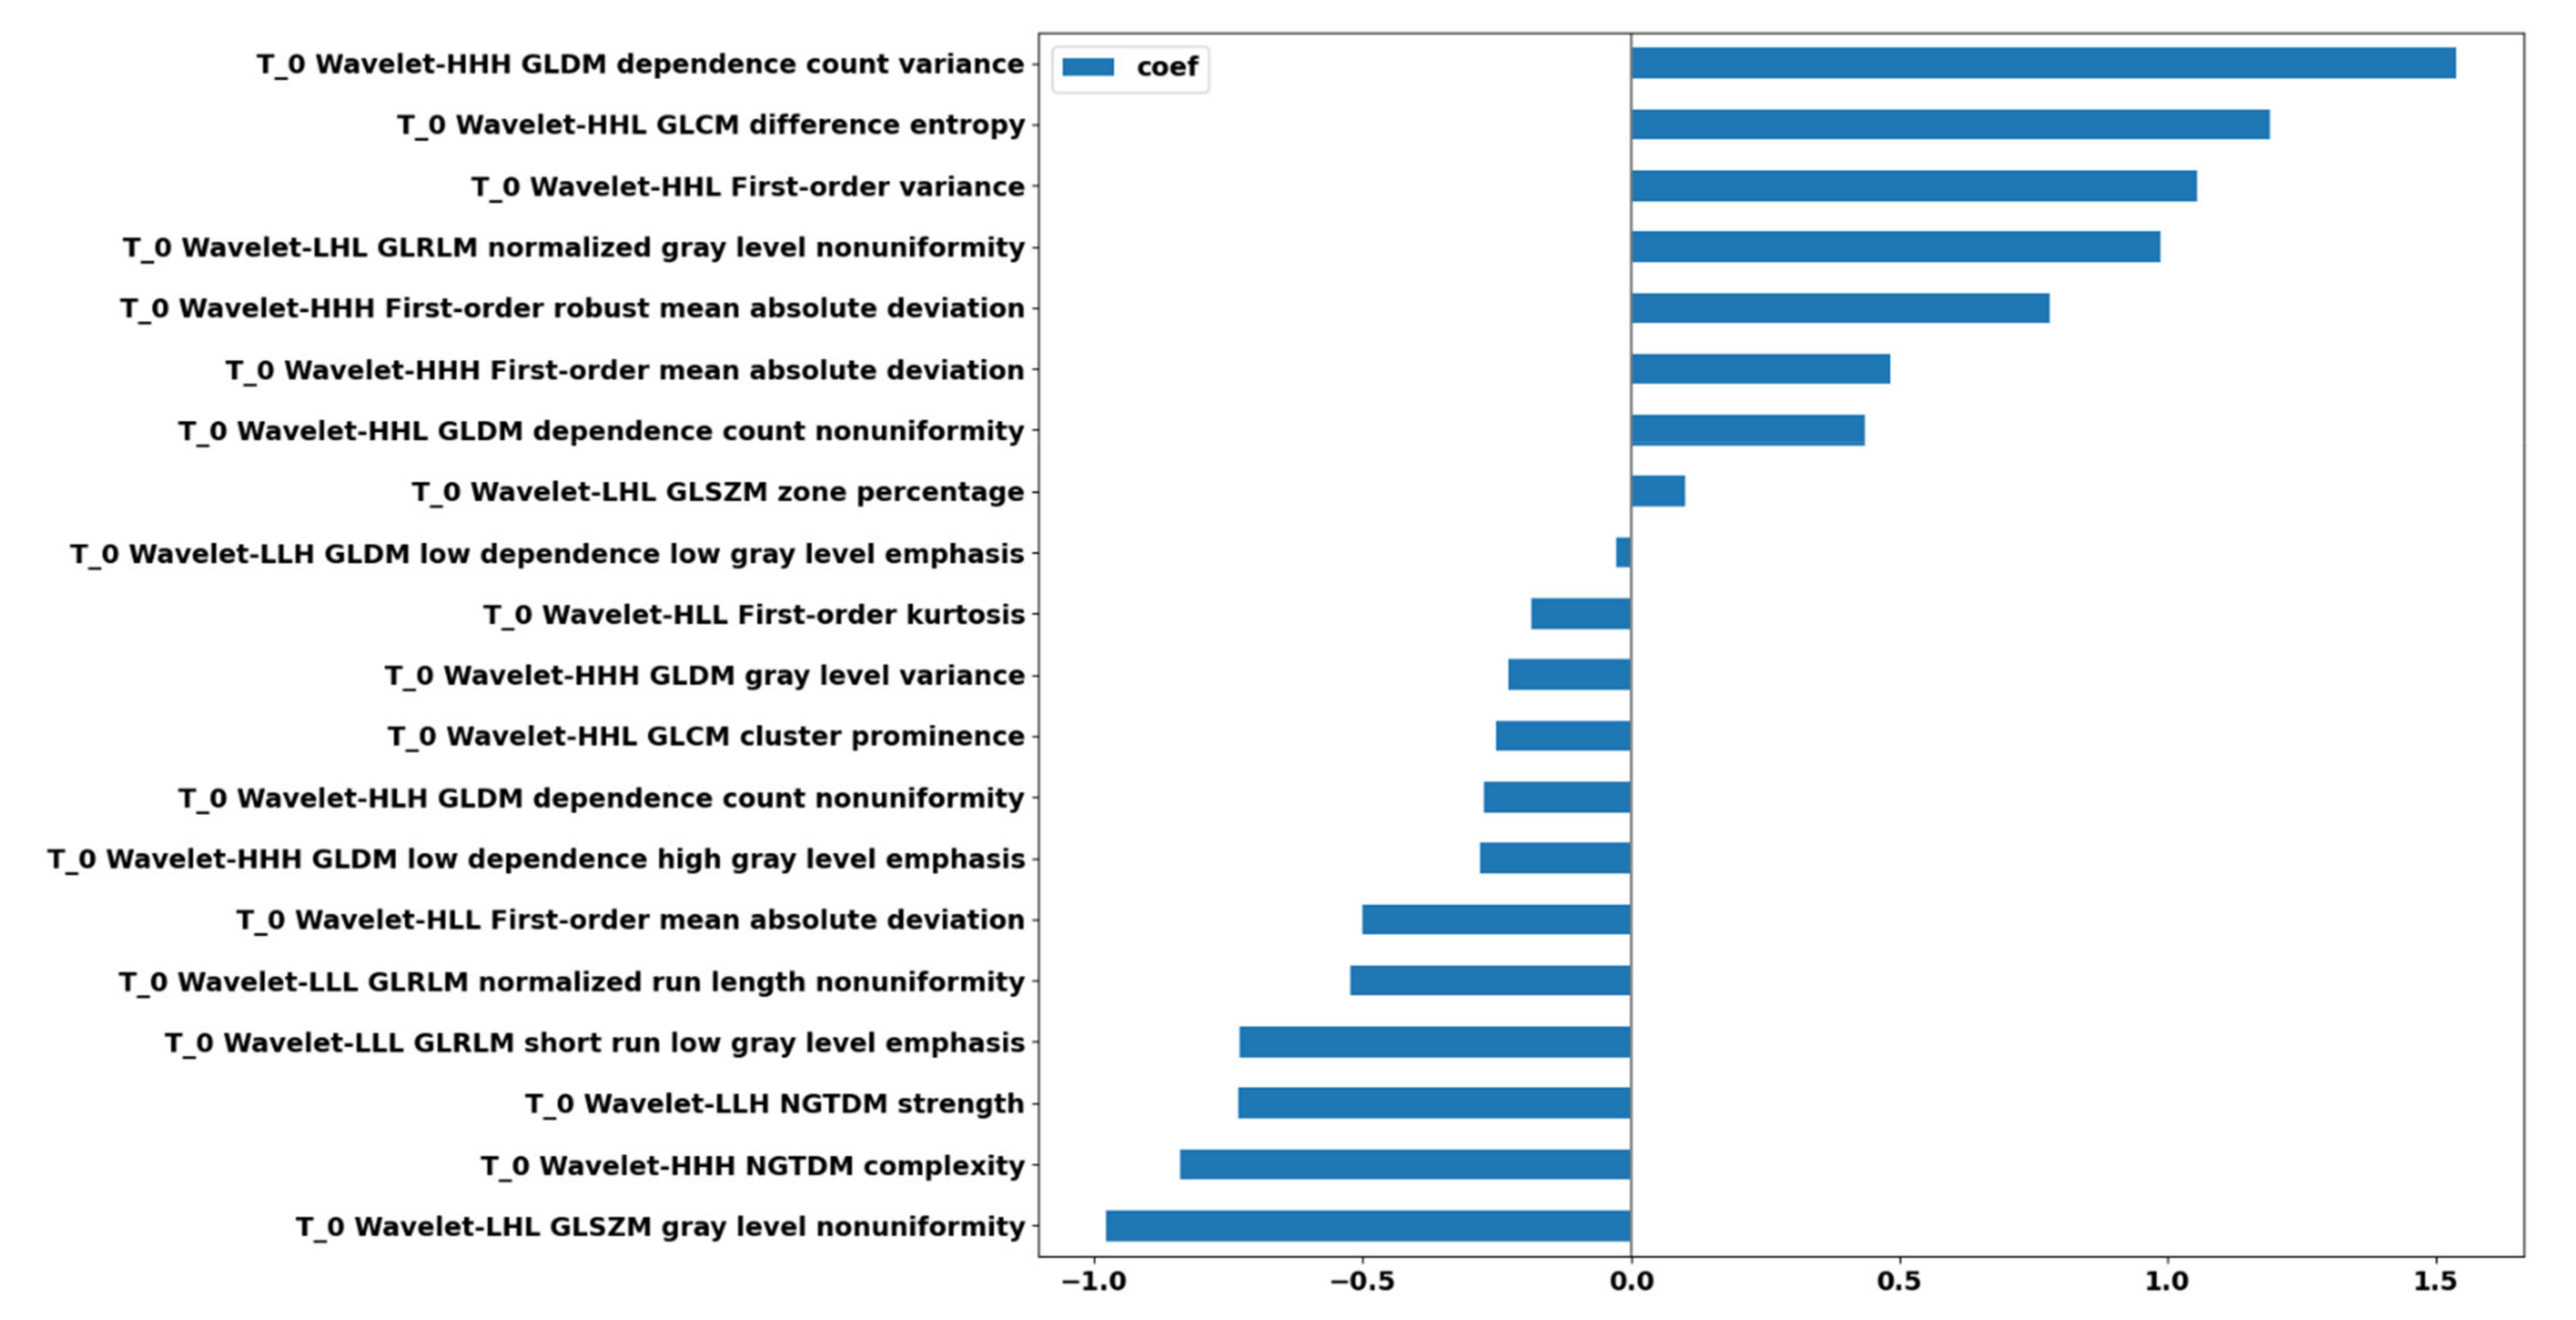
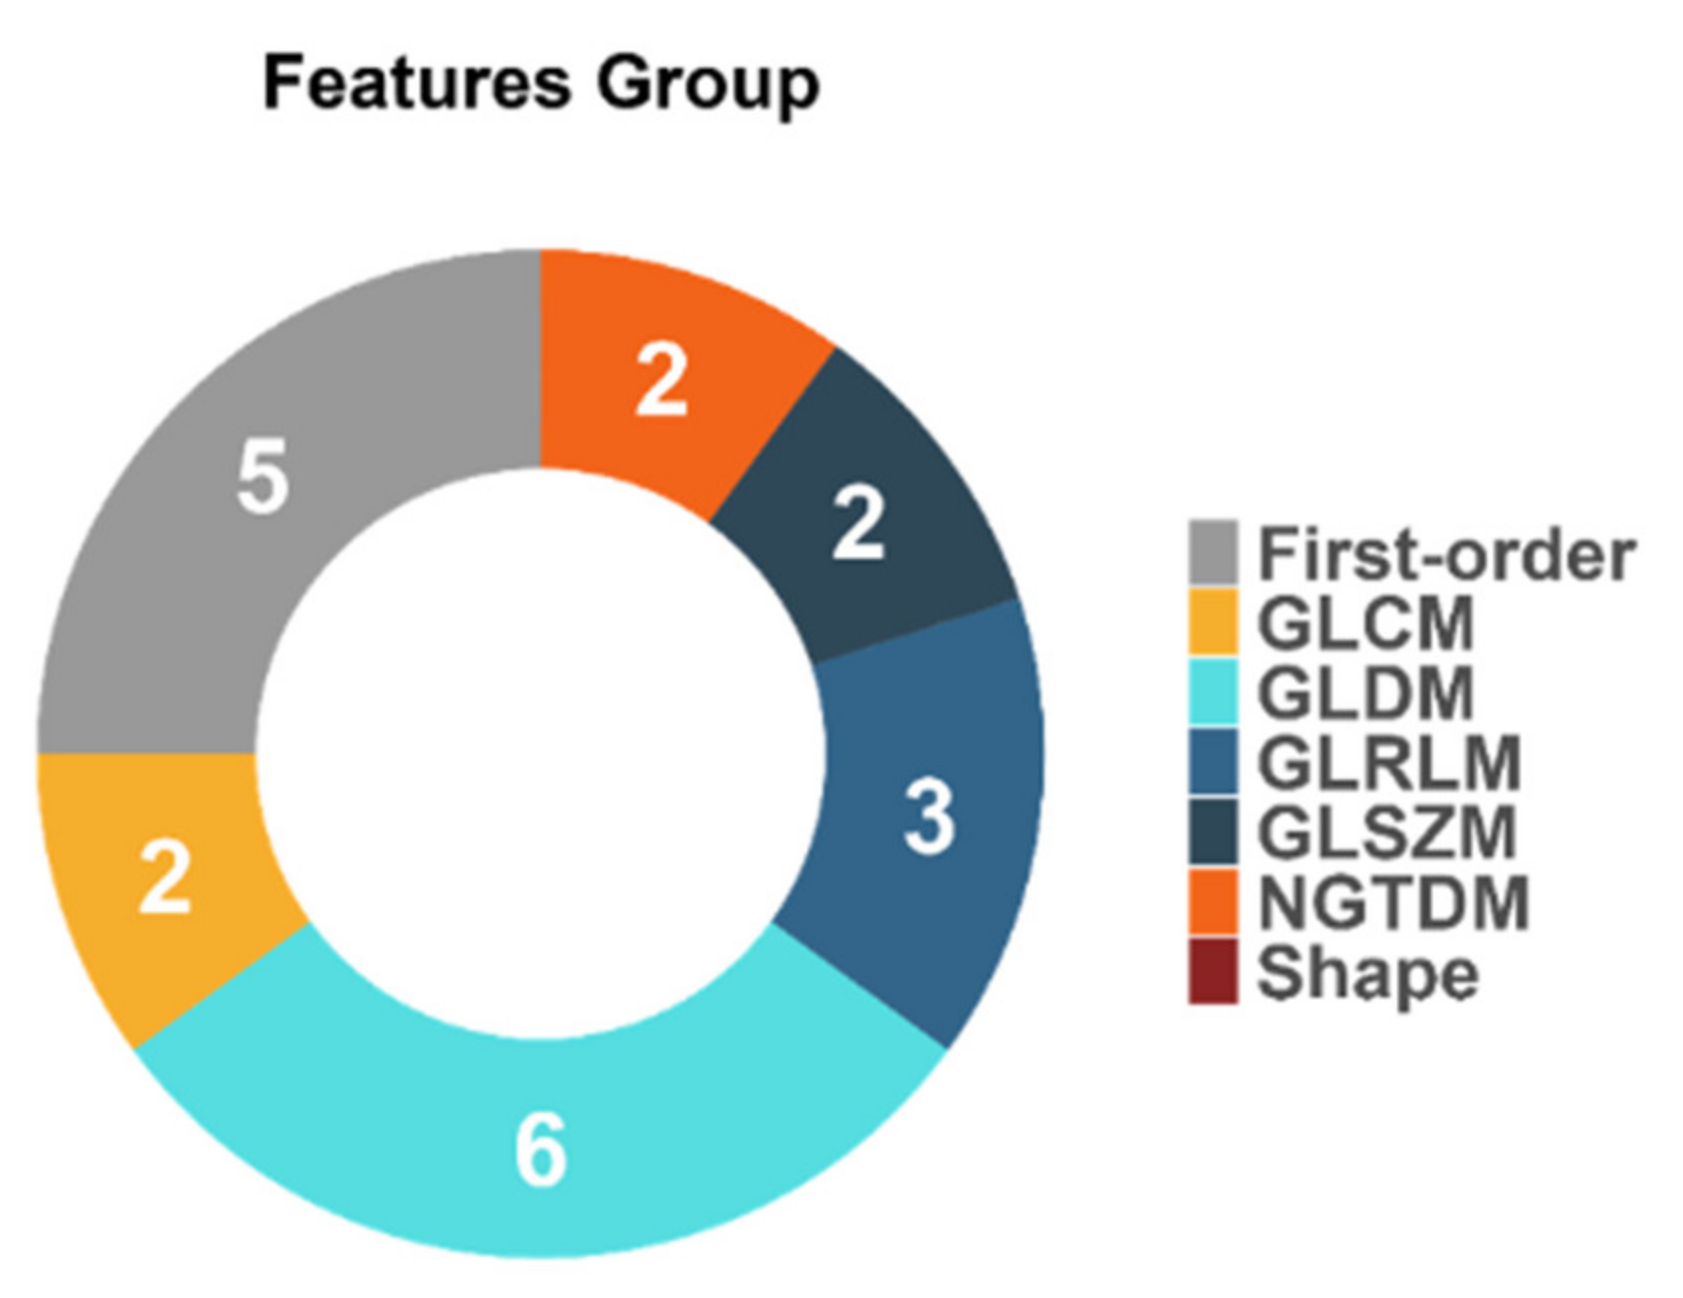
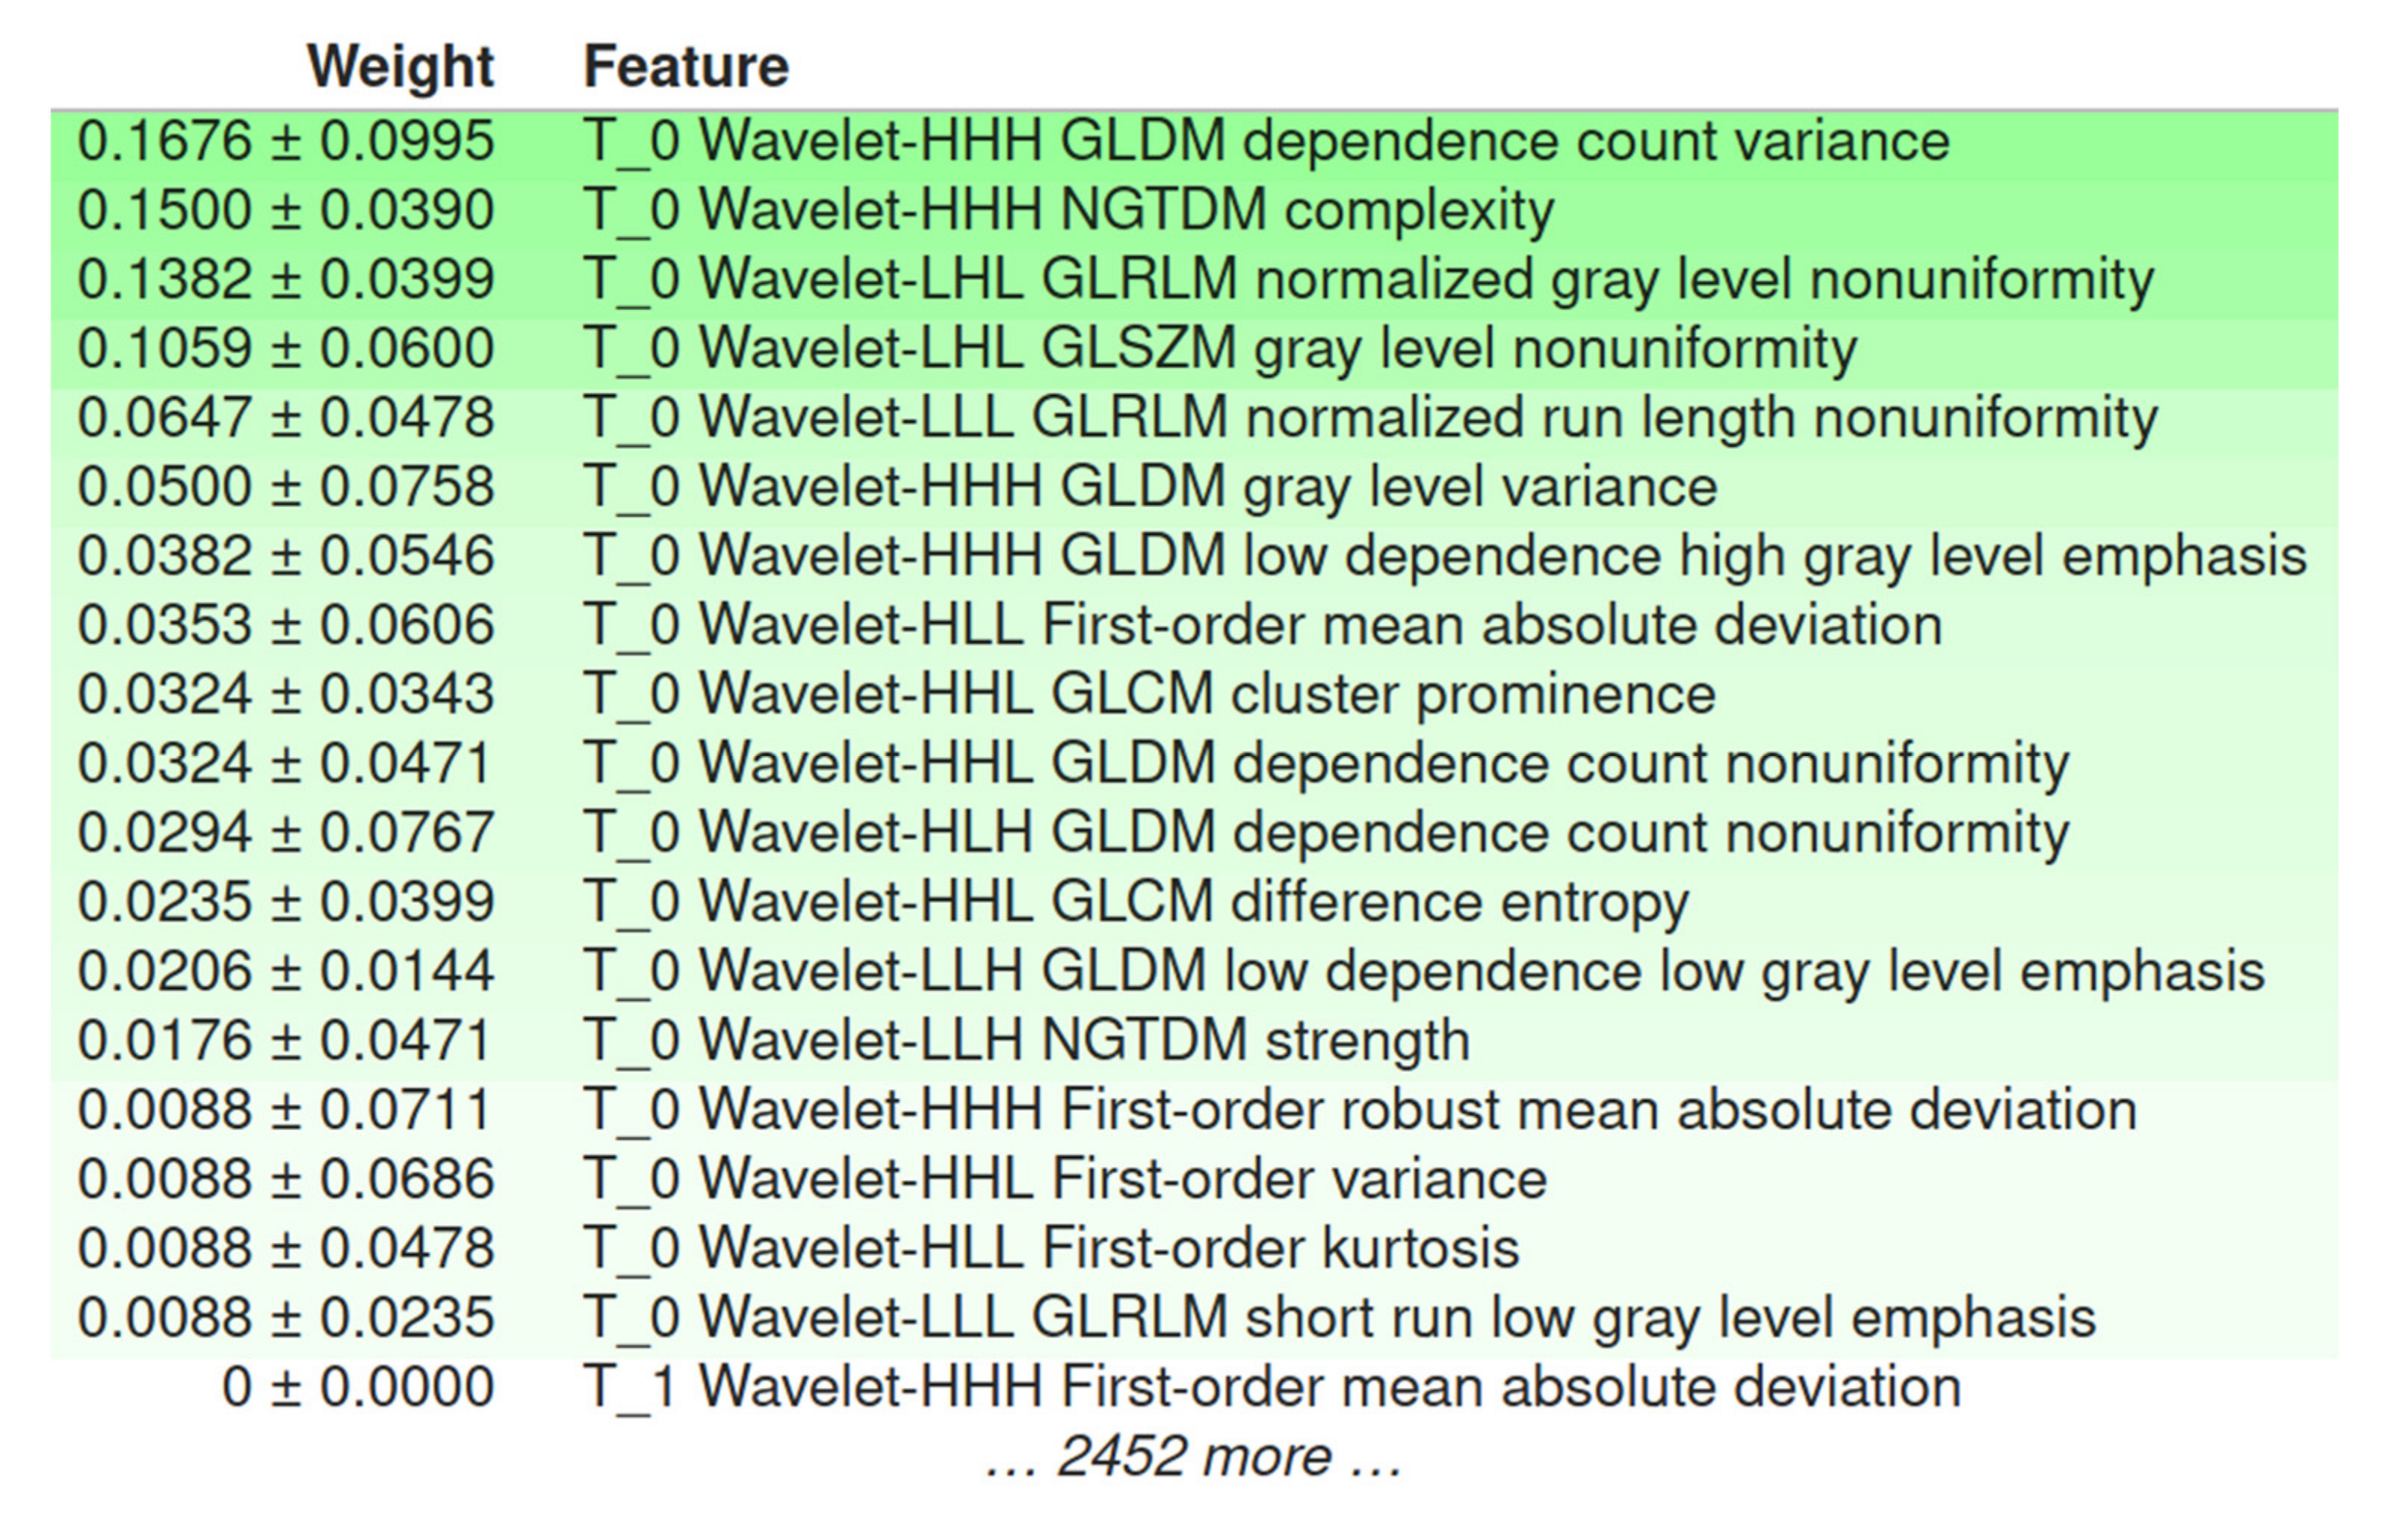
- Reduced to the 15 most significant features using univariate filtering according to the Gini Index;
- Subjected to synthetic minority oversampling based on the ADASYN;
- Providing input to an elastic net logistic regression model, yielding a mean Cohen’s kappa of 0.193 (SD: 0.096) using the exploratory set and 0.145 when validated externally.
4. Discussion
4.1. The Role of DSC–MRI Standardization
4.2. Performance of IDH Status Prediction and Informative Radiomics Features
4.3. Radiomics-Based ML Models’ Explainability
4.4. Limitations and Future Work
5. Conclusions
Supplementary Materials
Author Contributions
Funding
Institutional Review Board Statement
Informed Consent Statement
Data Availability Statement
Conflicts of Interest
References
- Ostrom, Q.T.; Cioffi, G.; Gittleman, H.; Patil, N.; Waite, K.; Kruchko, C.; Barnholtz-Sloan, J.S. CBTRUS Statistical Report: Primary Brain and Other Central Nervous System Tumors Diagnosed in the United States in 2012–2016. Neuro. Oncol. 2019, 21, v1–v100. [Google Scholar] [CrossRef]
- The Cancer Genome Atlas Research Network. Comprehensive, Integrative Genomic Analysis of Diffuse Lower-Grade Gliomas. New Engl. J. Med. 2015, 372, 2481–2498. [Google Scholar] [CrossRef] [PubMed] [Green Version]
- Louis, D.N.; Perry, A.; Reifenberger, G.; von Deimling, A.; Figarella-Branger, D.; Cavenee, W.K.; Ohgaki, H.; Wiestler, O.D.; Kleihues, P.; Ellison, D.W. The 2016 World Health Organization Classification of Tumors of the Central Nervous System: A summary. Acta Neuropathol. 2016, 131, 803–820. [Google Scholar] [CrossRef] [Green Version]
- Stupp, R.; Mason, W.P.; van den Bent, M.J.; Weller, M.; Fisher, B.; Taphoorn, M.J.B.; Belanger, K.; Brandes, A.A.; Marosi, C.; Bogdahn, U.; et al. Radiotherapy plus Concomitant and Adjuvant Temozolomide for Glioblastoma. New Engl. J. Med. 2005, 352, 987–996. [Google Scholar] [CrossRef] [PubMed]
- Lu, V.M.; O’Connor, K.P.; Shah, A.H.; Eichberg, D.G.; Luther, E.M.; Komotar, R.J.; Ivan, M.E. The prognostic significance of CDKN2A homozygous deletion in IDH-mutant lower-grade glioma and glioblastoma: A systematic review of the contemporary literature. J. Neurooncol. 2020, 148, 221–229. [Google Scholar] [CrossRef] [PubMed]
- Leeper, H.E.; Caron, A.A.; Decker, P.A.; Jenkins, R.B.; Lachance, D.H.; Giannini, C. IDH mutation, 1p19q codeletion and ATRX loss in WHO grade II gliomas. Oncotarget 2015, 6, 30295–30305. [Google Scholar] [CrossRef] [Green Version]
- Yan, H.; Parsons, D.W.; Jin, G.; McLendon, R.; Rasheed, B.A.; Yuan, W.; Kos, I.; Batinic-Haberle, I.; Jones, S.; Riggins, G.J.; et al. IDH1 and IDH2 Mutations in Gliomas. New Engl. J. Med. 2009, 360, 765–773. [Google Scholar] [CrossRef] [PubMed]
- Weller, M.; van den Bent, M.; Preusser, M.; Le Rhun, E.; Tonn, J.C.; Minniti, G.; Bendszus, M.; Balana, C.; Chinot, O.; Dirven, L.; et al. EANO guidelines on the diagnosis and treatment of diffuse gliomas of adulthood. Nat. Rev. Clin. Oncol. 2021, 18, 170–186. [Google Scholar] [CrossRef]
- Taweesomboonyat, C.; Tunthanathip, T.; Sae-Heng, S.; Oearsakul, T. Diagnostic Yield and Complication of Frameless Stereotactic Brain Biopsy. J. Neurosci. Rural Pract. 2019, 10, 78–84. [Google Scholar] [CrossRef] [Green Version]
- Park, S.I.; Suh, C.H.; Guenette, J.P.; Huang, R.Y.; Kim, H.S. The T2-FLAIR mismatch sign as a predictor of IDH-mutant, 1p/19q-noncodeleted lower-grade gliomas: A systematic review and diagnostic meta-analysis. Eur. Radiol. 2021, 31, 5289–5299. [Google Scholar] [CrossRef]
- Patel, S.H.; Poisson, L.M.; Brat, D.J.; Zhou, Y.; Cooper, L.; Snuderl, M.; Thomas, C.; Franceschi, A.M.; Griffith, B.; Flanders, A.E.; et al. T2–FLAIR Mismatch, an Imaging Biomarker for IDH and 1p/19q Status in Lower-grade Gliomas: A TCGA/TCIA Project. Clin. Cancer Res. 2017, 23, 6078–6085. [Google Scholar] [CrossRef] [Green Version]
- Bhandari, A.P.; Liong, R.; Koppen, J.; Murthy, S.V.; Lasocki, A. Noninvasive determination of IDH and 1p19q status of lower-grade gliomas using MRI radiomics: A systematic review. Am. J. Neuroradiol. 2021, 42, 94–101. [Google Scholar] [CrossRef] [PubMed]
- Peng, H.; Huo, J.; Li, B.; Cui, Y.; Zhang, H.; Zhang, L.; Ma, L. Predicting Isocitrate Dehydrogenase (IDH) Mutation Status in Gliomas Using Multiparameter MRI Radiomics Features. J. Magn. Reson. Imaging 2021, 53, 1399–1407. [Google Scholar] [CrossRef] [PubMed]
- Habib, A.; Jovanovich, N.; Hoppe, M.; Ak, M.; Mamindla, P.; Colen, R.R.; Zinn, P.O. MRI-Based Radiomics and Radiogenomics in the Management of Low-Grade Gliomas: Evaluating the Evidence for a Paradigm Shift. J. Clin. Med. 2021, 10, 1411. [Google Scholar] [CrossRef] [PubMed]
- Arita, H.; Kinoshita, M.; Kawaguchi, A.; Takahashi, M.; Narita, Y.; Terakawa, Y.; Tsuyuguchi, N.; Okita, Y.; Nonaka, M.; Moriuchi, S.; et al. Lesion location implemented magnetic resonance imaging radiomics for predicting IDH and TERT promoter mutations in grade II/III gliomas. Sci. Rep. 2018, 8, 11773. [Google Scholar] [CrossRef] [PubMed] [Green Version]
- Liu, X.; Li, Y.; Li, S.; Fan, X.; Sun, Z.; Yang, Z.; Wang, K.; Zhang, Z.; Jiang, T.; Liu, Y.; et al. IDH mutation-specific radiomic signature in lower-grade gliomas. Aging 2019, 11, 673–696. [Google Scholar] [CrossRef] [PubMed]
- Lu, C.-F.; Hsu, F.-T.; Hsieh, K.L.-C.; Kao, Y.-C.J.; Cheng, S.-J.; Hsu, J.B.-K.; Tsai, P.-H.; Chen, R.-J.; Huang, C.-C.; Yen, Y.; et al. Machine Learning–Based Radiomics for Molecular Subtyping of Gliomas. Clin. Cancer Res. 2018, 24, 4429–4436. [Google Scholar] [CrossRef] [Green Version]
- Wu, S.; Meng, J.; Yu, Q.; Li, P.; Fu, S. Radiomics-based machine learning methods for isocitrate dehydrogenase genotype prediction of diffuse gliomas. J. Cancer Res. Clin. Oncol. 2019, 145, 543–550. [Google Scholar] [CrossRef] [Green Version]
- Lambin, P.; Leijenaar, R.T.H.; Deist, T.M.; Peerlings, J.; De Jong, E.E.C.; Van Timmeren, J.; Sanduleanu, S.; Larue, R.T.H.M.; Even, A.J.G.; Jochems, A.; et al. Radiomics: The bridge between medical imaging and personalized medicine. Nat. Rev. Clin. Oncol. 2017, 14, 749–762. [Google Scholar] [CrossRef]
- Park, J.E.; Kim, H.S.; Kim, D.; Park, S.Y.; Kim, J.Y.; Cho, S.J.; Kim, J.H. A systematic review reporting quality of radiomics research in neuro-oncology: Toward clinical utility and quality improvement using high-dimensional imaging features. BMC Cancer 2020, 20, 1–11. [Google Scholar] [CrossRef] [PubMed]
- Wesseling, P.; Ruiter, D.J.; Burger, P.C. Angiogenesis in brain tumors; pathobiological and clinical aspects. J. Neurooncol. 1997, 32, 253–265. [Google Scholar] [CrossRef] [PubMed]
- Kickingereder, P.; Sahm, F.; Radbruch, A.; Wick, W.; Heiland, S.; Von Deimling, A.; Bendszus, M.; Wiestler, B. IDH mutation status is associated with a distinct hypoxia/angiogenesis transcriptome signature which is non-invasively predictable with rCBV imaging in human glioma. Sci. Rep. 2015, 5. [Google Scholar] [CrossRef]
- Sudre, C.H.; Panovska-Griffiths, J.; Sanverdi, E.; Brandner, S.; Katsaros, V.K.; Stranjalis, G.; Pizzini, F.B.; Ghimenton, C.; Surlan-Popovic, K.; Avsenik, J.; et al. Machine learning assisted DSC-MRI radiomics as a tool for glioma classification by grade and mutation status. BMC Med. Inform. Decis. Mak. 2020, 20, 149. [Google Scholar] [CrossRef]
- Conte, G.M.; Castellano, A.; Altabella, L.; Iadanza, A.; Cadioli, M.; Falini, A.; Anzalone, N. Reproducibility of dynamic contrast-enhanced MRI and dynamic susceptibility contrast MRI in the study of brain gliomas: A comparison of data obtained using different commercial software. Radiol. Med. 2017, 122, 294–302. [Google Scholar] [CrossRef]
- Porz, N.; Bauer, S.; Pica, A.; Schucht, P.; Beck, J.; Verma, R.K.; Slotboom, J.; Reyes, M.; Wiest, R. Multi-Modal Glioblastoma Segmentation: Man versus Machine. PLoS ONE 2014, 9, e96873. [Google Scholar] [CrossRef] [PubMed] [Green Version]
- Barker, P.B.; Golay, X.; Zaharchuk, G. (Eds.) Clinical Perfusion MRI; Cambridge University Press: Cambridge, UK, 2013; ISBN 9781139004053. [Google Scholar]
- Carré, A.; Klausner, G.; Edjlali, M.; Lerousseau, M.; Briend-Diop, J.; Sun, R.; Ammari, S.; Reuzé, S.; Alvarez Andres, E.; Estienne, T.; et al. Standardization of brain MR images across machines and protocols: Bridging the gap for MRI-based radiomics. Sci. Rep. 2020, 10, 12340. [Google Scholar] [CrossRef] [PubMed]
- Van Griethuysen, J.J.M.; Fedorov, A.; Parmar, C.; Hosny, A.; Aucoin, N.; Narayan, V.; Beets-Tan, R.G.H.; Fillion-Robin, J.C.; Pieper, S.; Aerts, H.J.W.L. Computational radiomics system to decode the radiographic phenotype. Cancer Res. 2017, 77, e104–e107. [Google Scholar] [CrossRef] [PubMed] [Green Version]
- Pedregosa, F.; Varoquaux, G.; Gramfort, A.; Michel, V.; Thirion, B.; Grisel, O.; Blondel, M.; Müller, A.; Nothman, J.; Louppe, G.; et al. Scikit-learn: Machine Learning in Python. J. Mach. Learn. Res. 2012, 12, 2825–2830. [Google Scholar]
- Lemaître, G.; Nogueira, F.; Aridas, C.K. Imbalanced-Learn: A Python Toolbox to Tackle the Curse of Imbalanced Datasets in Machine Learning. J. Mach. Learn. Res. 2017, 18, 559–563. [Google Scholar]
- Lundberg, S.M.; Lee, S.-I. A Unified Approach to Interpreting Model Predictions. In Proceedings of the Advances in Neural Information Processing Systems; Guyon, I., Luxburg, U.V., Bengio, S., Wallach, H., Fergus, R., Vishwanathan, S., Garnett, R., Eds.; Curran Associates, Inc.: Long Beach, CA, USA, 2017; Volume 30. [Google Scholar]
- Ribeiro, M.T.; Singh, S.; Guestrin, C. “Why Should {I} Trust You?”: Explaining the Predictions of Any Classifier. In Proceedings of the 22nd {ACM} {SIGKDD} International Conference on Knowledge Discovery and Data Mining, San Francisco, CA, USA, 13–17 August 2016; pp. 1135–1144. [Google Scholar]
- Keenan, K.E.; Ainslie, M.; Barker, A.J.; Boss, M.A.; Cecil, K.M.; Charles, C.; Chenevert, T.L.; Clarke, L.; Evelhoch, J.L.; Finn, P.; et al. Quantitative magnetic resonance imaging phantoms: A review and the need for a system phantom. Magn. Reson. Med. 2018, 79, 48–61. [Google Scholar] [CrossRef]
- Choi, K.S.; Choi, S.H.; Jeong, B. Prediction of IDH genotype in gliomas with dynamic susceptibility contrast perfusion MR imaging using an explainable recurrent neural network. Neuro. Oncol. 2019, 21, 1197–1209. [Google Scholar] [CrossRef] [PubMed]
- Li, Z.; Zhao, W.; He, B.; Koh, T.S.; Li, Y.; Zeng, Y.; Zhang, Z.; Zhang, J.; Hou, Z. Application of distributed parameter model to assessment of glioma IDH mutation status by dynamic contrast-enhanced magnetic resonance imaging. Contrast Media Mol. Imaging 2020, 2020, 8843084. [Google Scholar] [CrossRef] [PubMed]
- Zhang, L.; He, L.; Lugano, R.; Roodakker, K.; Bergqvist, M.; Smits, A.; Dimberg, A. IDH mutation status is associated with distinct vascular gene expression signatures in lower-grade gliomas. Neuro. Oncol. 2018, 20, 1505–1516. [Google Scholar] [CrossRef]
- Da-ano, R.; Masson, I.; Lucia, F.; Doré, M.; Robin, P.; Alfieri, J.; Rousseau, C.; Mervoyer, A.; Reinhold, C.; Castelli, J.; et al. Performance comparison of modified ComBat for harmonization of radiomic features for multicenter studies. Sci. Rep. 2020, 10, 10248. [Google Scholar] [CrossRef] [PubMed]


| Cohort A | Cohort B | Cohort C | ||
|---|---|---|---|---|
| Scanner Type | 3T Discovery MR750 (GE Healthcare, Chicago, Illinois, United States) | 3T Siemens Skyra (Siemens Healthineers, Erlangen, Germany) | 1.5T Magnetom Avanto (Siemens Healthineers, Erlangen, Germany) | 1.5.T Philips Achieva (Philips Medical Systems, Eindhoven, Netherlands) |
| Acquisition type | 2D Echo-Planar Imaging (EPI) with fat suppression (FS) | |||
| Magnetic field strength | 3T | 3T | 1.5T | 1.5T |
| Repetition time (ms) | 1800 | 1870 | 1850 | 1525 |
| Echo time (ms) | 40 | 30 | 30 | 40 |
| Echo train length | 1 | 63 | 1 | 47 |
| Flip angle (deg) | 60 | 90 | 90 | 75 |
| In-plane resolution (mm2) | 1.718 × 1.718 | 1.719 × 1.719 | 1.796 × 1.796 | 1.75 × 1.75 |
| Number of averages | 1 | 1 | 1 | 1 |
| Image slice thickness (mm) | 5 | 5 | 5 | 5 |
| Image slice spacing (mm) | 5 | 5 | 5 | 5 |
| Temporal resolution | 60 × 1.87 s | 60 × 2.07 s | 40 × 1.53 s | 60 × 1.8 s |
| Matrix size | 128 × 128 | 128 × 128 | 128 × 128 | 128 × 128 |
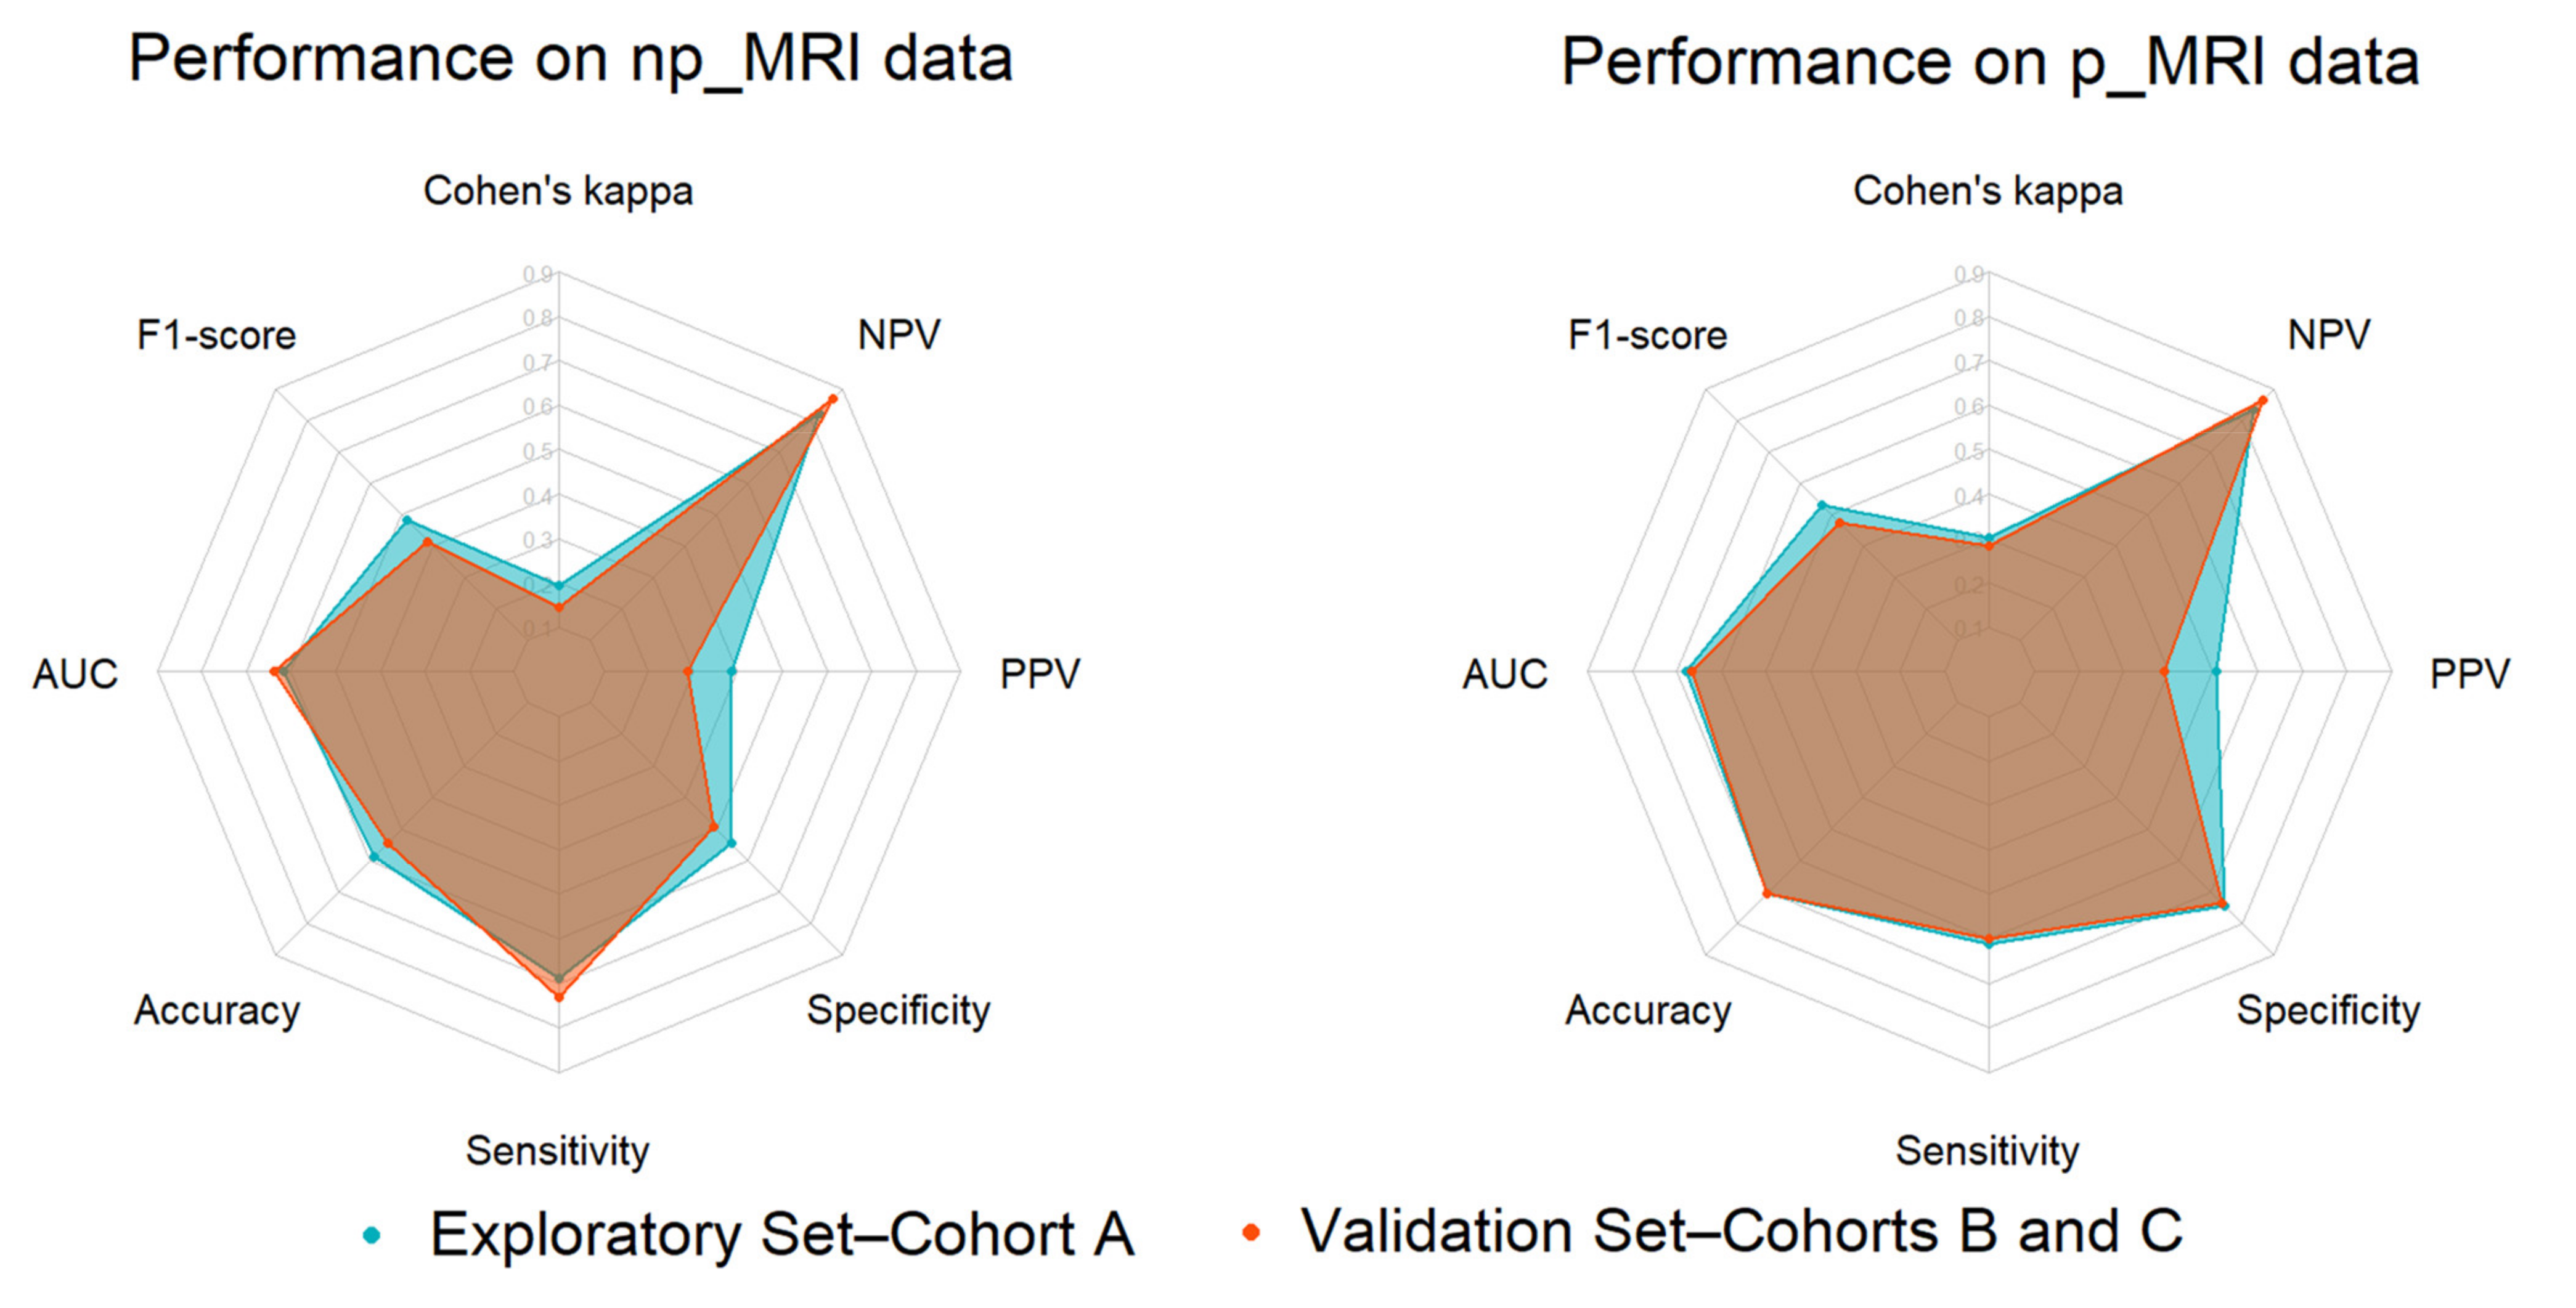
| Performance Metrics | Exploratory Set | Validation Set | ||
|---|---|---|---|---|
| np_MRI | p_MRI | np_MRI | p_MRI | |
| Cohen’s kappa | 0.193 ± 0.096 | 0.303 ± 0.125 | 0.145 | 0.282 |
| F1-score | 0.482 ± 0.163 | 0.533 ± 0.164 | 0.415 | 0.474 |
| AUC | 0.618 ± 0.148 | 0.678 ± 0.103 | 0.639 | 0.667 |
| Accuracy | 0.587 ± 0.144 | 0.707 ± 0.108 | 0.544 | 0.706 |
| Sensitivity | 0.689 ± 0.208 | 0.611 ± 0.183 | 0.733 | 0.600 |
| Specificity | 0.547 ± 0.189 | 0.745 ± 0.146 | 0.491 | 0.736 |
| PPV | 0.388 ± 0.150 | 0.508 ± 0.196 | 0.290 | 0.391 |
| NPV | 0.823 ± 0.158 | 0.834 ± 0.095 | 0.868 | 0.868 |
Publisher’s Note: MDPI stays neutral with regard to jurisdictional claims in published maps and institutional affiliations. |
© 2021 by the authors. Licensee MDPI, Basel, Switzerland. This article is an open access article distributed under the terms and conditions of the Creative Commons Attribution (CC BY) license (https://creativecommons.org/licenses/by/4.0/).
Share and Cite
Manikis, G.C.; Ioannidis, G.S.; Siakallis, L.; Nikiforaki, K.; Iv, M.; Vozlic, D.; Surlan-Popovic, K.; Wintermark, M.; Bisdas, S.; Marias, K. Multicenter DSC–MRI-Based Radiomics Predict IDH Mutation in Gliomas. Cancers 2021, 13, 3965. https://doi.org/10.3390/cancers13163965
Manikis GC, Ioannidis GS, Siakallis L, Nikiforaki K, Iv M, Vozlic D, Surlan-Popovic K, Wintermark M, Bisdas S, Marias K. Multicenter DSC–MRI-Based Radiomics Predict IDH Mutation in Gliomas. Cancers. 2021; 13(16):3965. https://doi.org/10.3390/cancers13163965
Chicago/Turabian StyleManikis, Georgios C., Georgios S. Ioannidis, Loizos Siakallis, Katerina Nikiforaki, Michael Iv, Diana Vozlic, Katarina Surlan-Popovic, Max Wintermark, Sotirios Bisdas, and Kostas Marias. 2021. "Multicenter DSC–MRI-Based Radiomics Predict IDH Mutation in Gliomas" Cancers 13, no. 16: 3965. https://doi.org/10.3390/cancers13163965