Article

Cancer Stem Cell Marker DCLK1 Correlates with Tumorigenic Immune Infiltrates in the Colon and Gastric Adenocarcinoma Microenvironments

1
Department of Medicine, University of Oklahoma Health Sciences Center, Oklahoma City, OK 73104, USA
2
Academy of Integrative Medicine, Fujian University of Traditional Chinese Medicine, Fuzhou 350122, China
3
Department of Veterans Affairs Medical Center, Oklahoma City, OK 73104, USA
4
Peggy and Charles Stephenson Cancer Center, Oklahoma City, OK 73104, USA
5
Fujian Key Laboratory of Integrative Medicine in Geriatrics, Fujian University of Traditional Chinese Medicine, Fuzhou 350122, China
*
Authors to whom correspondence should be addressed.
Equally contributing authors.
Cancers 2020, 12(2), 274; https://doi.org/10.3390/cancers12020274
Submission received: 26 November 2019 / Revised: 15 January 2020 / Accepted: 21 January 2020 / Published: 22 January 2020
(This article belongs to the Collection Mechanism of Immunotherapy in Cancers)

Abstract

:
Immunotherapy that has proven efficacy in several solid cancers plays a partial role in improving clinical outcomes of advanced gastrointestinal (GI) cancers. There is an unmet need to find new immune-related therapeutic targets. Doublecortin-like kinase 1 (DCLK1) marks tuft cells which are recognized as cancer-initiating cells and regulators of the type II immune response, and has been studied for its role in many cancers including colon and gastric cancers, but its role in tumor immunity remains unexplored. In the current study, we analyzed colon and gastric cancer RNA sequencing data from 283 and 415 patients, respectively, from The Cancer Genome Atlas (TCGA). High DCLK1 expression predicted the worse clinical outcomes in colon and gastric cancer patients and correlated with increased immune and stromal components. Further analysis indicated that DCLK1 was strongly linked to infiltration of multiple immune cell types, especially TAMs and Treg, and strongly correlated with increased CD8+ T cell inhibitors TGFB1 and CXCL12 and their receptors, suggesting it may contribute to TAM-mediated inhibition of CD8+ T cells. Interestingly, we found that DCLK1 was a prognostic biomarker in left-sided colon cancer, which has worse outcomes and demonstrates a reduced response to existing immunotherapies. In conclusion, our results demonstrate that DCLK1 is linked with functional regulation of the tumor microenvironment and may have potential as a prognostic biomarker and adjuvant target to promote immunotherapy sensitivity in colon and gastric cancer patients.

1. Introduction

Gastrointestinal (GI) cancers are exceptionally common with colorectal (CRC) and stomach cancer ranking third and fourth, respectively, worldwide [1,2]. CRCs arise from a polyp beginning with an aberrant intestinal crypt [3] and stomach cancers commonly arise in a background of intestinal metaplasia [4]. Similarities include shared somatic mutations (e.g., CTNNB1, KRAS) [5,6,7] and key roles for exposure to pathogens and inflammatory injury in tumor initiation [8,9,10]. In addition, colorectal and stomach epithelium contains LGR5+ stem cells and DCLK1+ tuft cells, both of which have been linked to human GI cancer initiation and progression, and identified as GI cancer cells-of-origin using mouse models [11,12,13,14]. Based on these shared characteristics, it may be possible to identify similar targeting strategies to improve colon and stomach cancer outcomes.
Several treatment strategies are employed in GI cancer including surgery, chemotherapy, radiotherapy, and molecularly targeted therapy. However, the survival of patients with advanced GI cancer remains poor [15,16]. Immune-related mechanisms play an important role in GI cancer, and immunotherapies are emerging as an effective treatment option against several types of cancer, including specific GI cancer subtypes such as those with high microsatellite instability (MSI-H). MSI-H GI cancers have relatively high numbers of mutations, leading to the production of neoantigens which can support extensive immune infiltration and sensitize tumors to immune checkpoint inhibitors [17]. Immunotherapies such as CTLA4, PD-1, and PD-L1 inhibitors show the most promising antitumor effects in malignant melanoma and non-small-cell lung carcinoma [18,19]. However, the current generation of immunotherapies (e.g., CTLA4 mAb) has shown poor clinical efficacy in metastatic colorectal and gastric cancers, while PD-1 and PD-L1 mAbs may result in partial responses in this context [20,21,22]. Therefore, there is an urgent need to identify novel immune-related therapeutic targets in GI cancers.
CD8+ cytotoxic T cells are key players in antitumor immunity. High CD8+ T cell infiltration is significantly correlated with better survival and there is mounting evidence to suggest that defective T cell migration into and within tumors constitutes a resistance mechanism to immunotherapy [23,24,25]. In the tumor microenvironment (TME), stromal cell-like tumor-associated fibroblasts and immune cells communicate with each other to decide the fate of tumor cells. For example, cytokines IL-4 and IL-10 secreted by tumor cells or T cells can polarize macrophages to their M2 state in which they are capable of secreting TGF-B1 and CXCL12 to inhibit CD8+ T cell function in support of tumor cell survival and metastasis [26,27,28]. These macrophages are termed tumor-associated macrophages (TAMs), which are key determinants of prognosis and the efficacy of immunotherapy [29,30]. In a TAM-enriched TME, CD8+ T cell-dependent immunotherapies (e.g., anti-PD-1) are likely to have little effect against progression [30,31]. Understanding the functional role of TME components in T cell exhaustion and reversing this state are keys to improving immunotherapy. However, the precise mechanisms involved in TAM-mediated inhibition of CD8+ T cells remain unclear.
Doublecortin-like kinase 1 (DCLK1) is a marker of GI tuft cells and has been reported to play an important role in cancer initiation and development in various cancers [14,32,33]. Previous studies show that DCLK1 is overexpressed in gastric, pancreatic, colon, renal, and other cancers [34,35], and plays a functional role in tumor initiation, growth, metastasis, epithelial-mesenchymal transition (EMT), and cancer stemness. A recent study from Westphalen et al. demonstrated that long-lived DCLK1+ tuft cells serve as colon-cancer-initiating cells when combing oncogenic mutation such as loss of APC and inflammatory insult [14]. Several studies also indicated that downregulating DCLK1 expression or inhibiting its kinase activity leads to growth arrest of colorectal, pancreatic, and renal cancers [36,37,38] as well as decreases metastasis of colorectal and pancreatic cancers [39,40]. Mechanistically, DCLK1 regulates NOTCH, NF-kB, KRAS, and WNT molecular signaling pathways that promote cancer growth and progression as well as support EMT and stemness of cancer cells [41,42,43,44]. In addition, DCLK1 regulates several miRNAs such as miR-let-7a and miR-200a which are known to be involved in tumor growth and EMT [36,38]. Most importantly, recent results of cell lineage-tracking analysis in mice suggested that DCLK1 is specific to intestinal CSCs and not expressed in normal stem cells, making targeting DCLK1 with novel therapeutic strategies a promising approach [45]. Recent findings unequivocally show that DCLK1+ tuft cells regulate the type II immune response in a variety of infection and inflammation models [46,47,48,49,50,51,52,53,54]. In the small intestine, taste receptors on DCLK1+ tuft cells detect threats and secrete IL-25, which binds its receptors (IL-17Rb) on type 2 innate lymphoid cells (ILC2s), inducing IL-4/13 secretion, which activates IL-4 receptors and induces tuft and goblet cell hyperplasia, which can initiate tumors and support progression and metastasis when harboring mutations [14,46,47,48,55], but few studies have assessed DCLK1′s role in tumor immunity. In this study, we assessed DCLK1 for its role in the TME and as a prognostic marker in colon and gastric cancer using RNA-Seq data from 283 and 415 patients, respectively. We found that DCLK1 expression correlated with increased stromal and immune components in the TME. Further analysis indicated that DCLK1 was strongly linked to infiltration of multiple immune cell types, especially TAMs and Treg, and strongly correlated with increased CD8+ T cell inhibitors TGFB1 and CXCL12 and their receptors, suggesting it may be a contributor to TAM-mediated inhibition of CD8+ T cells. Finally, analysis of patient outcomes demonstrates its potential as a prognostic biomarker and therapeutic target for gastric and left-sided colon cancers.

2. Results

2.1. High Expression of DCLK1 is an Independent Prognostic Factor in Colon and Gastric Adenocarcinoma

Previous reports indicate that DCLK1 is overexpressed in pancreatic, colorectal, and kidney cancers [41]. To explore the potential of using DCLK1 as a prognostic biomarker in GI cancers, we performed Kaplan–Meier and Cox regression analysis using the TCGA RNA-seq datasets [56,57]. High DCLK1 expression in tumor tissues predicted poor disease-specific survival (DSS) in both colon and stomach cancer patients (p < 0.006) (Figure 1A,B). In addition, high DCLK1 expression in the tumor tissues also predicted poor overall survival (OS; p = 0.021 for colon adenocarcinoma (COAD) and p = 0.0002 for stomach adenocarcinoma (STAD)), and progression-free survival (PFI) (p = 0.0086 for COAD and p < 0.0001 for STAD) (Figure S1A–D). By performing multivariate analysis to control for relevant clinical factors including age, gender, stage, T, N, M, and tumor location, we found that DCLK1 is an independent factor which can be used to predict poor DSS (p = 0.009, Figure 1C and Table S3) and PFI (p = 0.024, Table S4), but not OS (p = 0.18, Table S4) in CRC. In STAD, DCLK1 expression can be used as an independent factor to predict poor DSS (p = 0.002, Figure 1D and Table S3), OS (p = 0.008, Table S5), and PFI (p < 0.001, Table S5). These findings expand on previous findings demonstrating that tumor DCLK1 predicts survival in colon and stomach cancer [34,58,59] and suggest its independence as a prognostic biomarker.

2.2. DCLK1 Expression Levels Significantly Correlate with TME Immune and Stromal Scores

The tumor microenvironment and its interactions with the tumor epithelium are essential to cancer progression and metastasis. We used the well-established ESTIMATE algorithm to calculate immune and stromal proportions of COAD and STAD tumors (Figure S2A,B). Using Kaplan–Meier and Cox regression, we found that high immune score correlates with poor DSS in COAD (Figure S3A) and STAD (Figure S3B), in agreement with previous reports [60]. These results indicate that immune and stromal scores may be a useful indicator of colon and stomach cancer prognosis, but the underlying mechanisms need further study.
We found that tumor DCLK1 expression correlated with immune score in COAD and STAD (Pearson r = 0.63, p < 0.0001 and Pearson r = 0.4, p < 0.0001, respectively), and stromal score (Pearson r = 0.85, p < 0.0001 and Pearson r = 0.76, p < 0.0001, respectively) (Figure 2). Further analysis demonstrates that this correlation exists in a stage-independent fashion (Figure S4A) and STAD (Figure S4B). Together, this data suggests that the independent prognostic prediction potential of DCLK1 in colon and stomach cancer patients may be related to alterations in the TME.

2.3. DCLK1 Expression Level is Correlated with Various Immune Cell Subtypes in Both Colon and Stomach Cancer

To further study the relationship of DCLK1 to immune cell subtypes in the TME, we fragmented the composition of immune cells in tumor tissues of COAD and STAD using quanTIseq. Among immune cell types, macrophages (M1 + M2) accounted for about 32% and 31%, neutrophils accounted for approximately 24% and 35%, Treg accounted for 15% and 12%, and B cells accounted for 10% and 5% in COAD and STAD, respectively (Figure 3A,B). DCLK1 expression level in colon tumor tissues was positively correlated with infiltrating CD8+ T cells (r = 0.28, p < 0.0001), M2 macrophages (r = 0.45, p < 0.0001), Treg (r = 0.45, p < 0.0001) (Figure 3C–E), B cells (r = 0.42, p < 0.0001), and M1 macrophages (r = 0.24, p < 0.0001) (Figure S5A,D) in COAD. No significant correlation was found between DCLK1 expression and neutrophils, CD4+ T, dendritic, and NK cells (Figure S5B,C,E,F) in COAD. Similarly, it positively correlated with M2 macrophages (r = 0.55, p < 0.0001), Treg (r = 0.25, p < 0.0001) (Figure 3G,H), B cells (r = 0.3, p < 0.0001), CD4+ T cells (r = 0.33, p < 0.0001), and dendritic cells (r = 0.29, p < 0.0001) (Figure S5G,I,K) in STAD. No significant correlation was found between DCLK1 expression and CD8+ T cells (Figure 3F), neutrophils, M1 macrophages, and NK cells (Figure S5H,J,L). Among these immune cell types, DCLK1 expression had the strongest correlation with the M2 macrophage population (r = 0.45 and 0.55 for COAD and STAD, respectively). These findings suggest that DCLK1 may play a role in regulating TME composition, especially as it relates to immune infiltration in colon and gastric cancers.

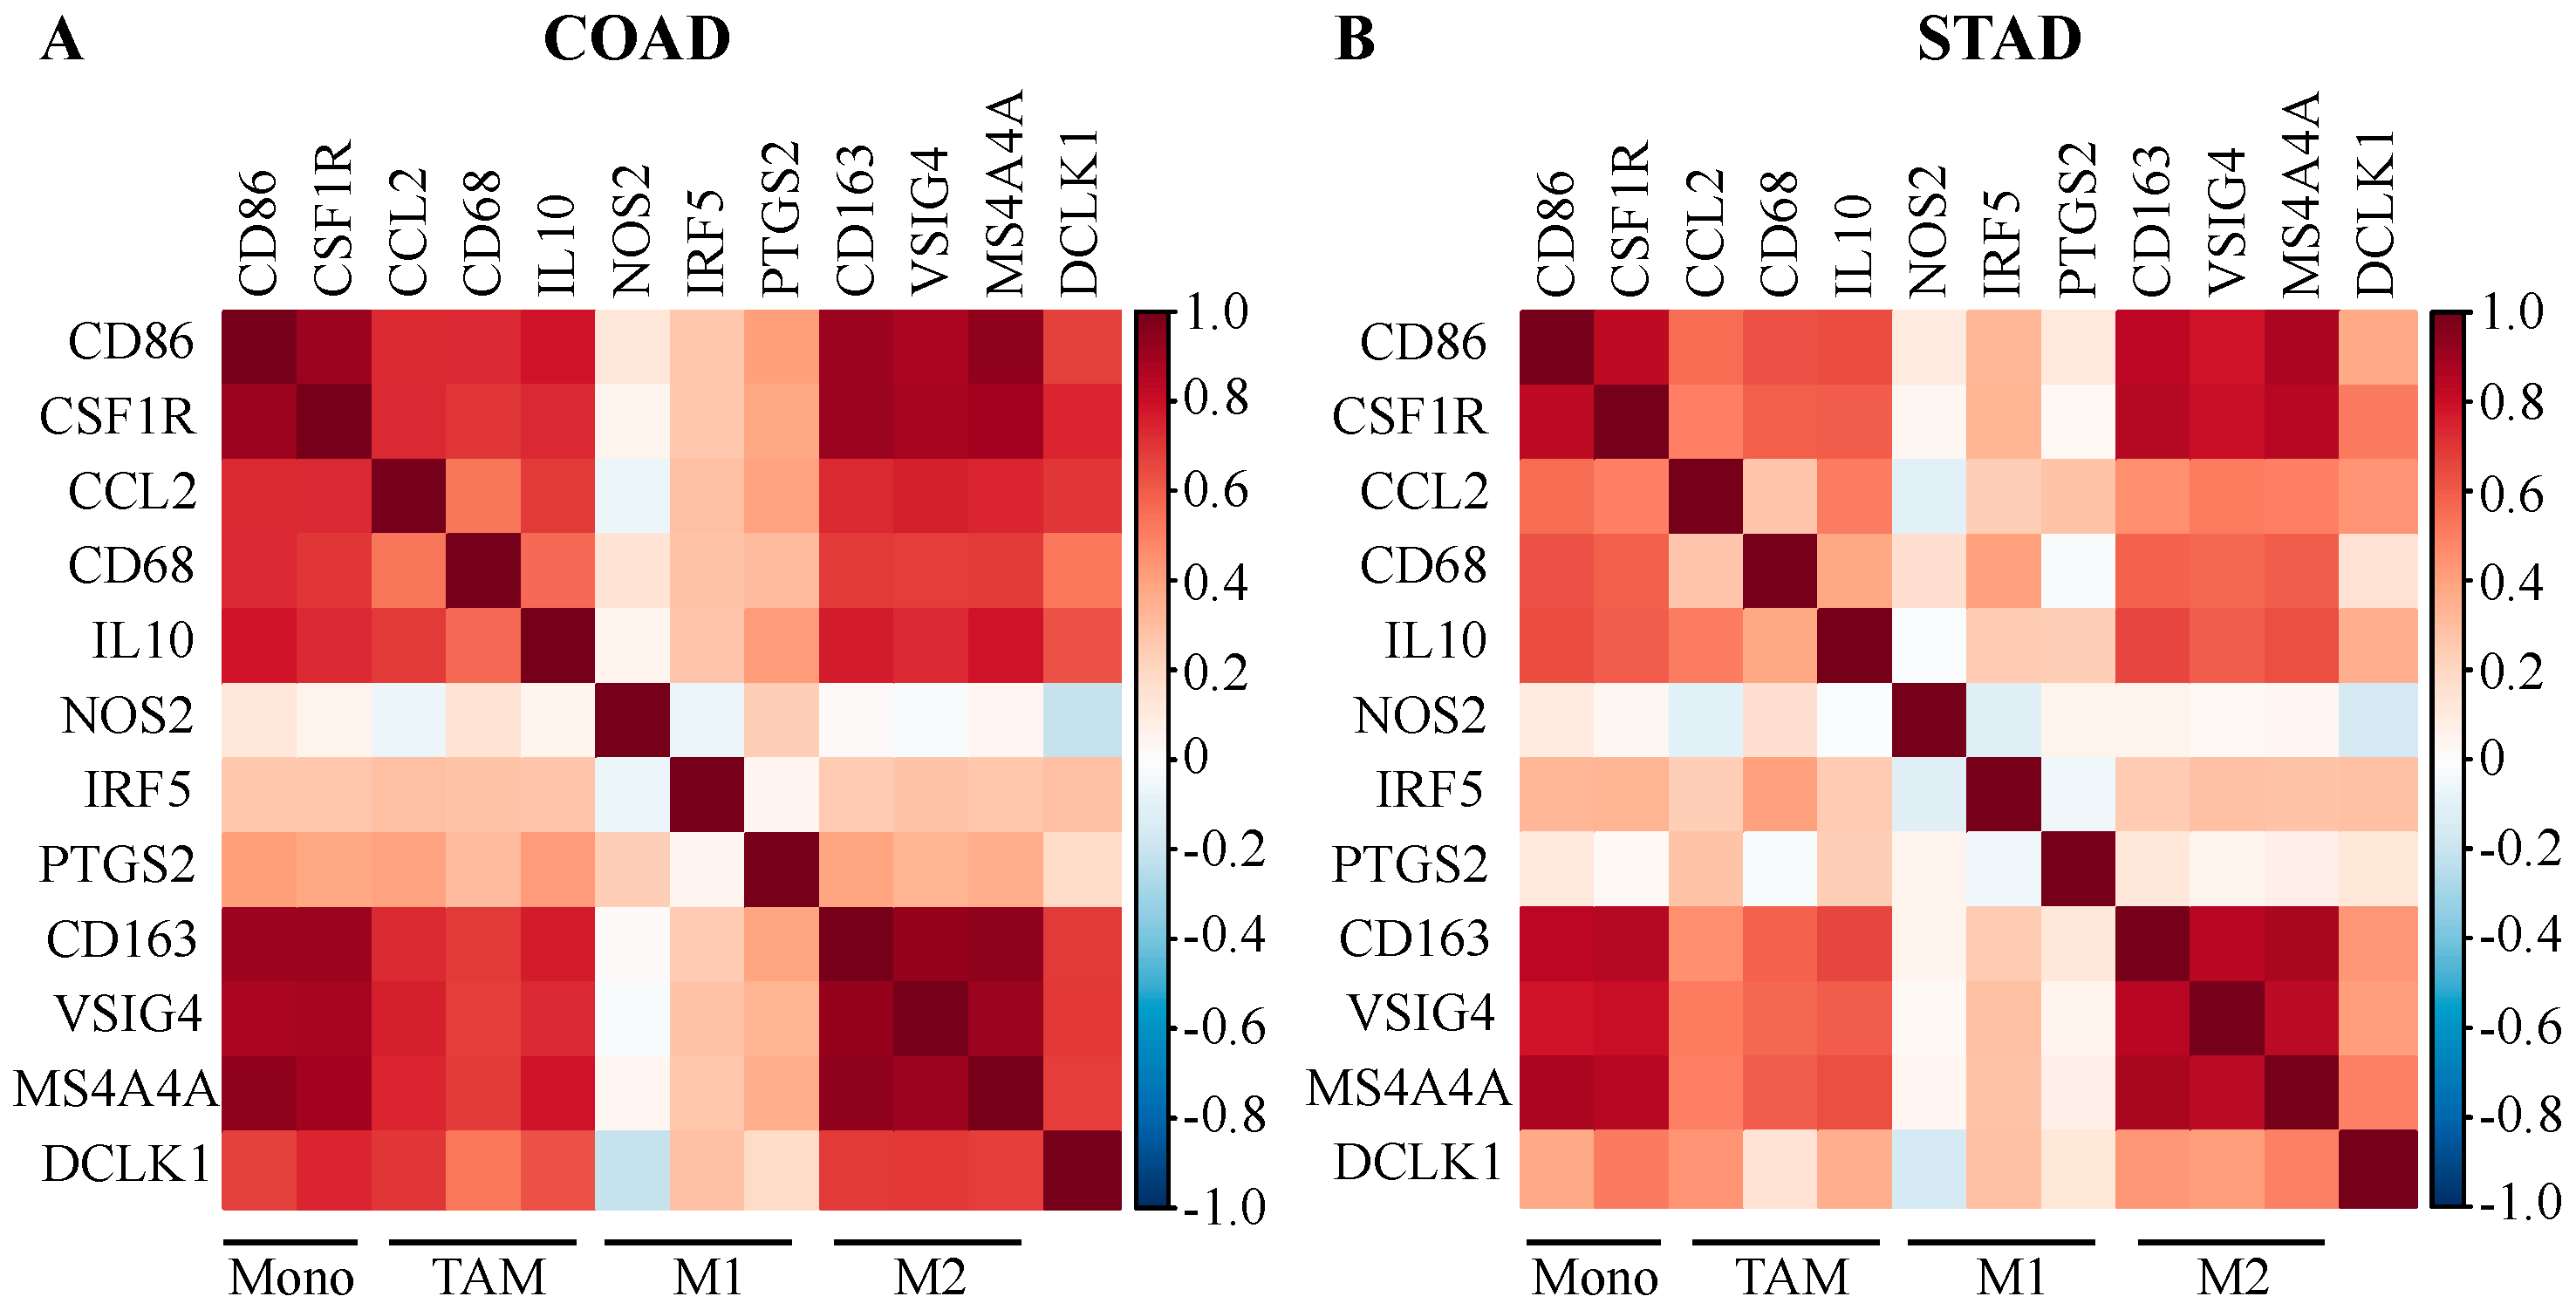
2.4. DCLK1 Expression Level is Associated with TAM and M2 Macrophage Markers

To further understand the relationship between DCLK1 and diverse infiltrating immune cell types, we analyzed the correlation between DCLK1 and signature genes for each immune cell type. We also analyzed the correlation with various functional T cell subtypes including Th1, Th2, Tfh, Th17, and Treg cells as well as T cell exhaustion. DCLK1 expression level was significantly correlated with CD8+ T cells, general T cells, B cells, monocytes, M2 macrophages, dendritic cells, neutrophils, Tfh, Treg, and T cell exhaustion in COAD and STAD (Table 1). The strongest correlations were with immune cell markers for Treg (FOXP3, CCR8, STAT5B, CD4, CD25, and TGFB1), M2 (CD163, VSIG4, and MS4A4A), and T cell exhaustion (PD-L1, CTLA4, LAG3, TIM-3, TIGIT, and BTLA), which suggests that high DCLK1 expression in an M2-enriched TME may restrict antitumor immunity [31,61]. We also found that the DCLK1 expression level has strong positive correlations with markers of monocytes, TAMs, and M2 macrophages in COAD (Figure 4A) and STAD (Figure 4B). These findings suggest that DCLK1 may regulate macrophage polarization in COAD and STAD.

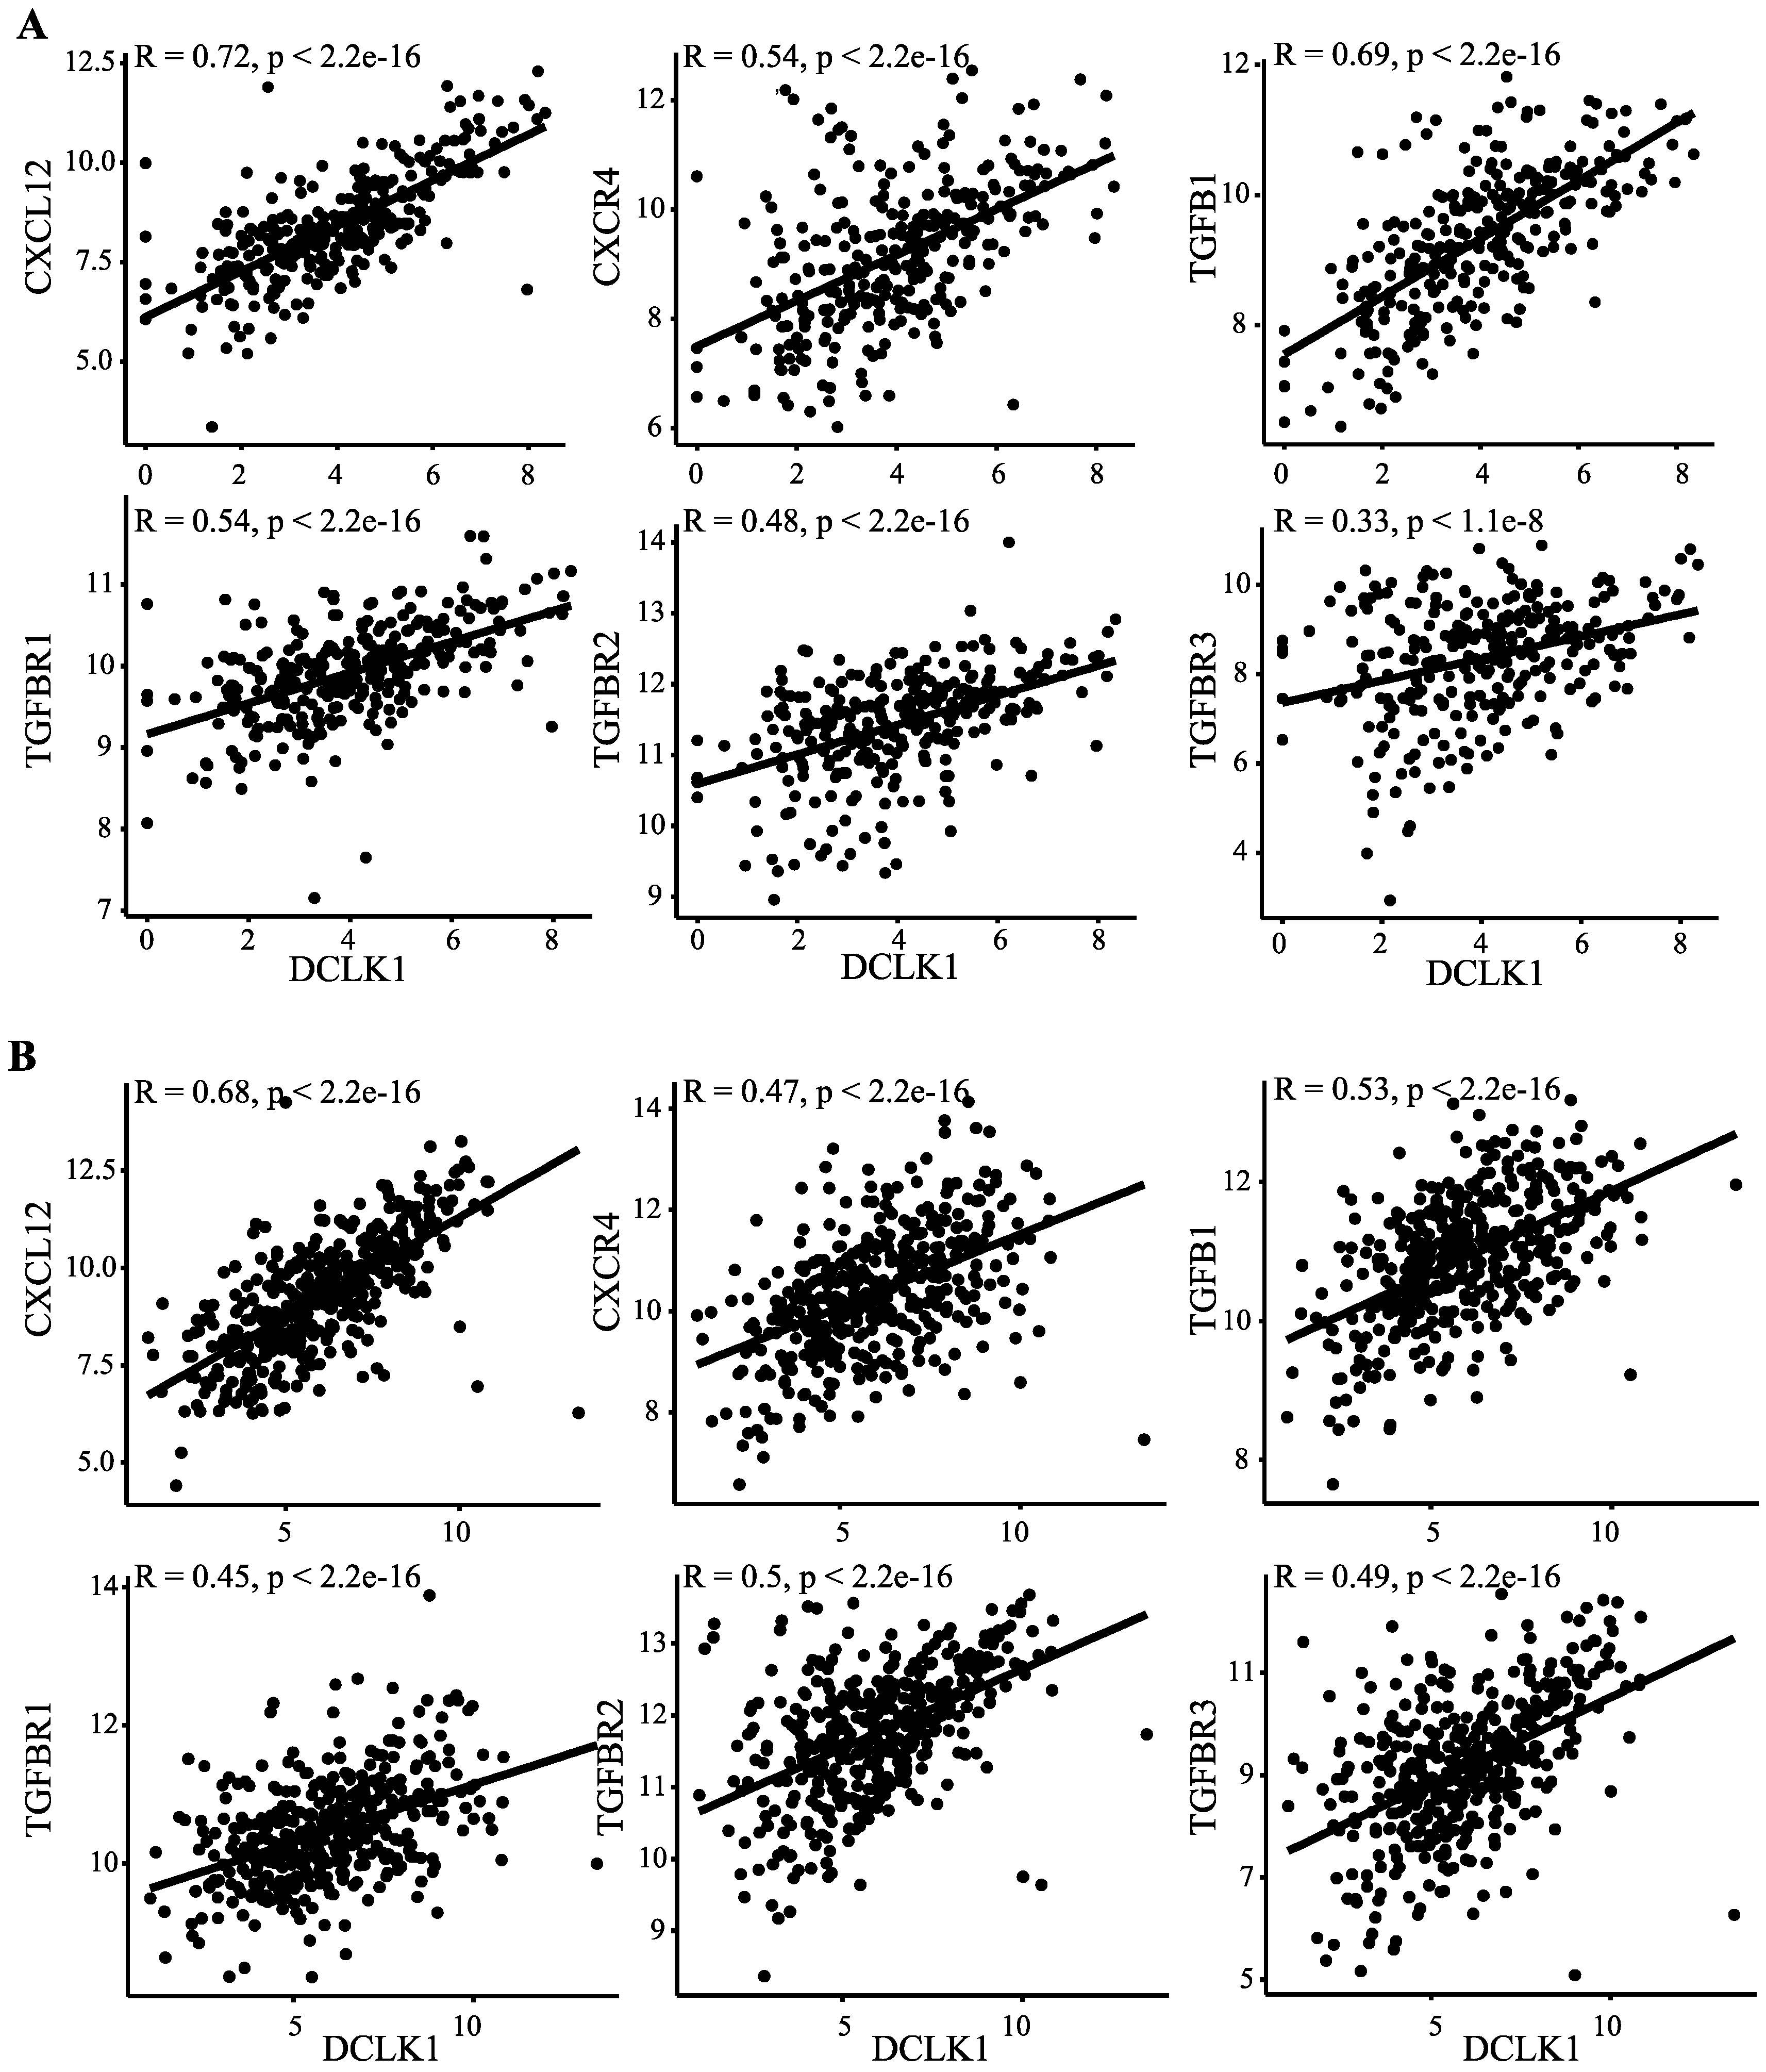
2.5. DCLK1 Correlates with Evasion of Antitumor Immunity, TAM Activation, and Inhibition of CD8+ T Cells

Recent studies show that M2-like TAMs inhibit CD8+ T cell infiltration through inducing TGFB1 and CXCL12 [25,26,62]. We found that DCLK1 expression significantly correlates with both TGFB1 and CXCL12 and their receptors TGFBR1, TGFBR2, and TGFBR3, and CXCR4, respectively, in colon and stomach cancer patients (Figure 5A,B). These results indicate that DCLK1 may contribute to TAM development by preventing CD8+ T cell infiltration. To assess the impact of this activity on patient outcomes, we divided COAD and STAD patients into four groups: DCLK1Hi/CD8+Hi, DCLK1Hi/CD8+Lo, DCLK1Lo/CD8+Hi, and DCLK1Lo/CD8+Lo and performed Kaplan–Meier analysis. DCLK1Lo/CD8+Lo tumors (green line) indicated better DSS compared to DCLK1Hi/CD8+Lo tumors (blue line), and DCLK1Lo/CD8+Hi tumors (yellow line) indicated better DSS than DCLK1Hi/CD8+Hi tumors (red line) in COAD (Figure 6A) and STAD (Figure 6B). Controlling for relevant clinical factors including age, gender, stage, T, N, M, and tumor location demonstrated that DCLK1Hi/CD8+Hi status is an independent factor predictor of DSS in COAD and STAD (p = 0.028 for COAD and p = 0.045 for STAD, Figure 6C,D). These results suggest that further studies should be performed to determine DCLK1’s role in activating TAMs and inducing stromal cell secretion of CD8+ T cell inhibitors TGFB1 and CXCL12 to reduce the CD8+ T cell infiltration in the TME.

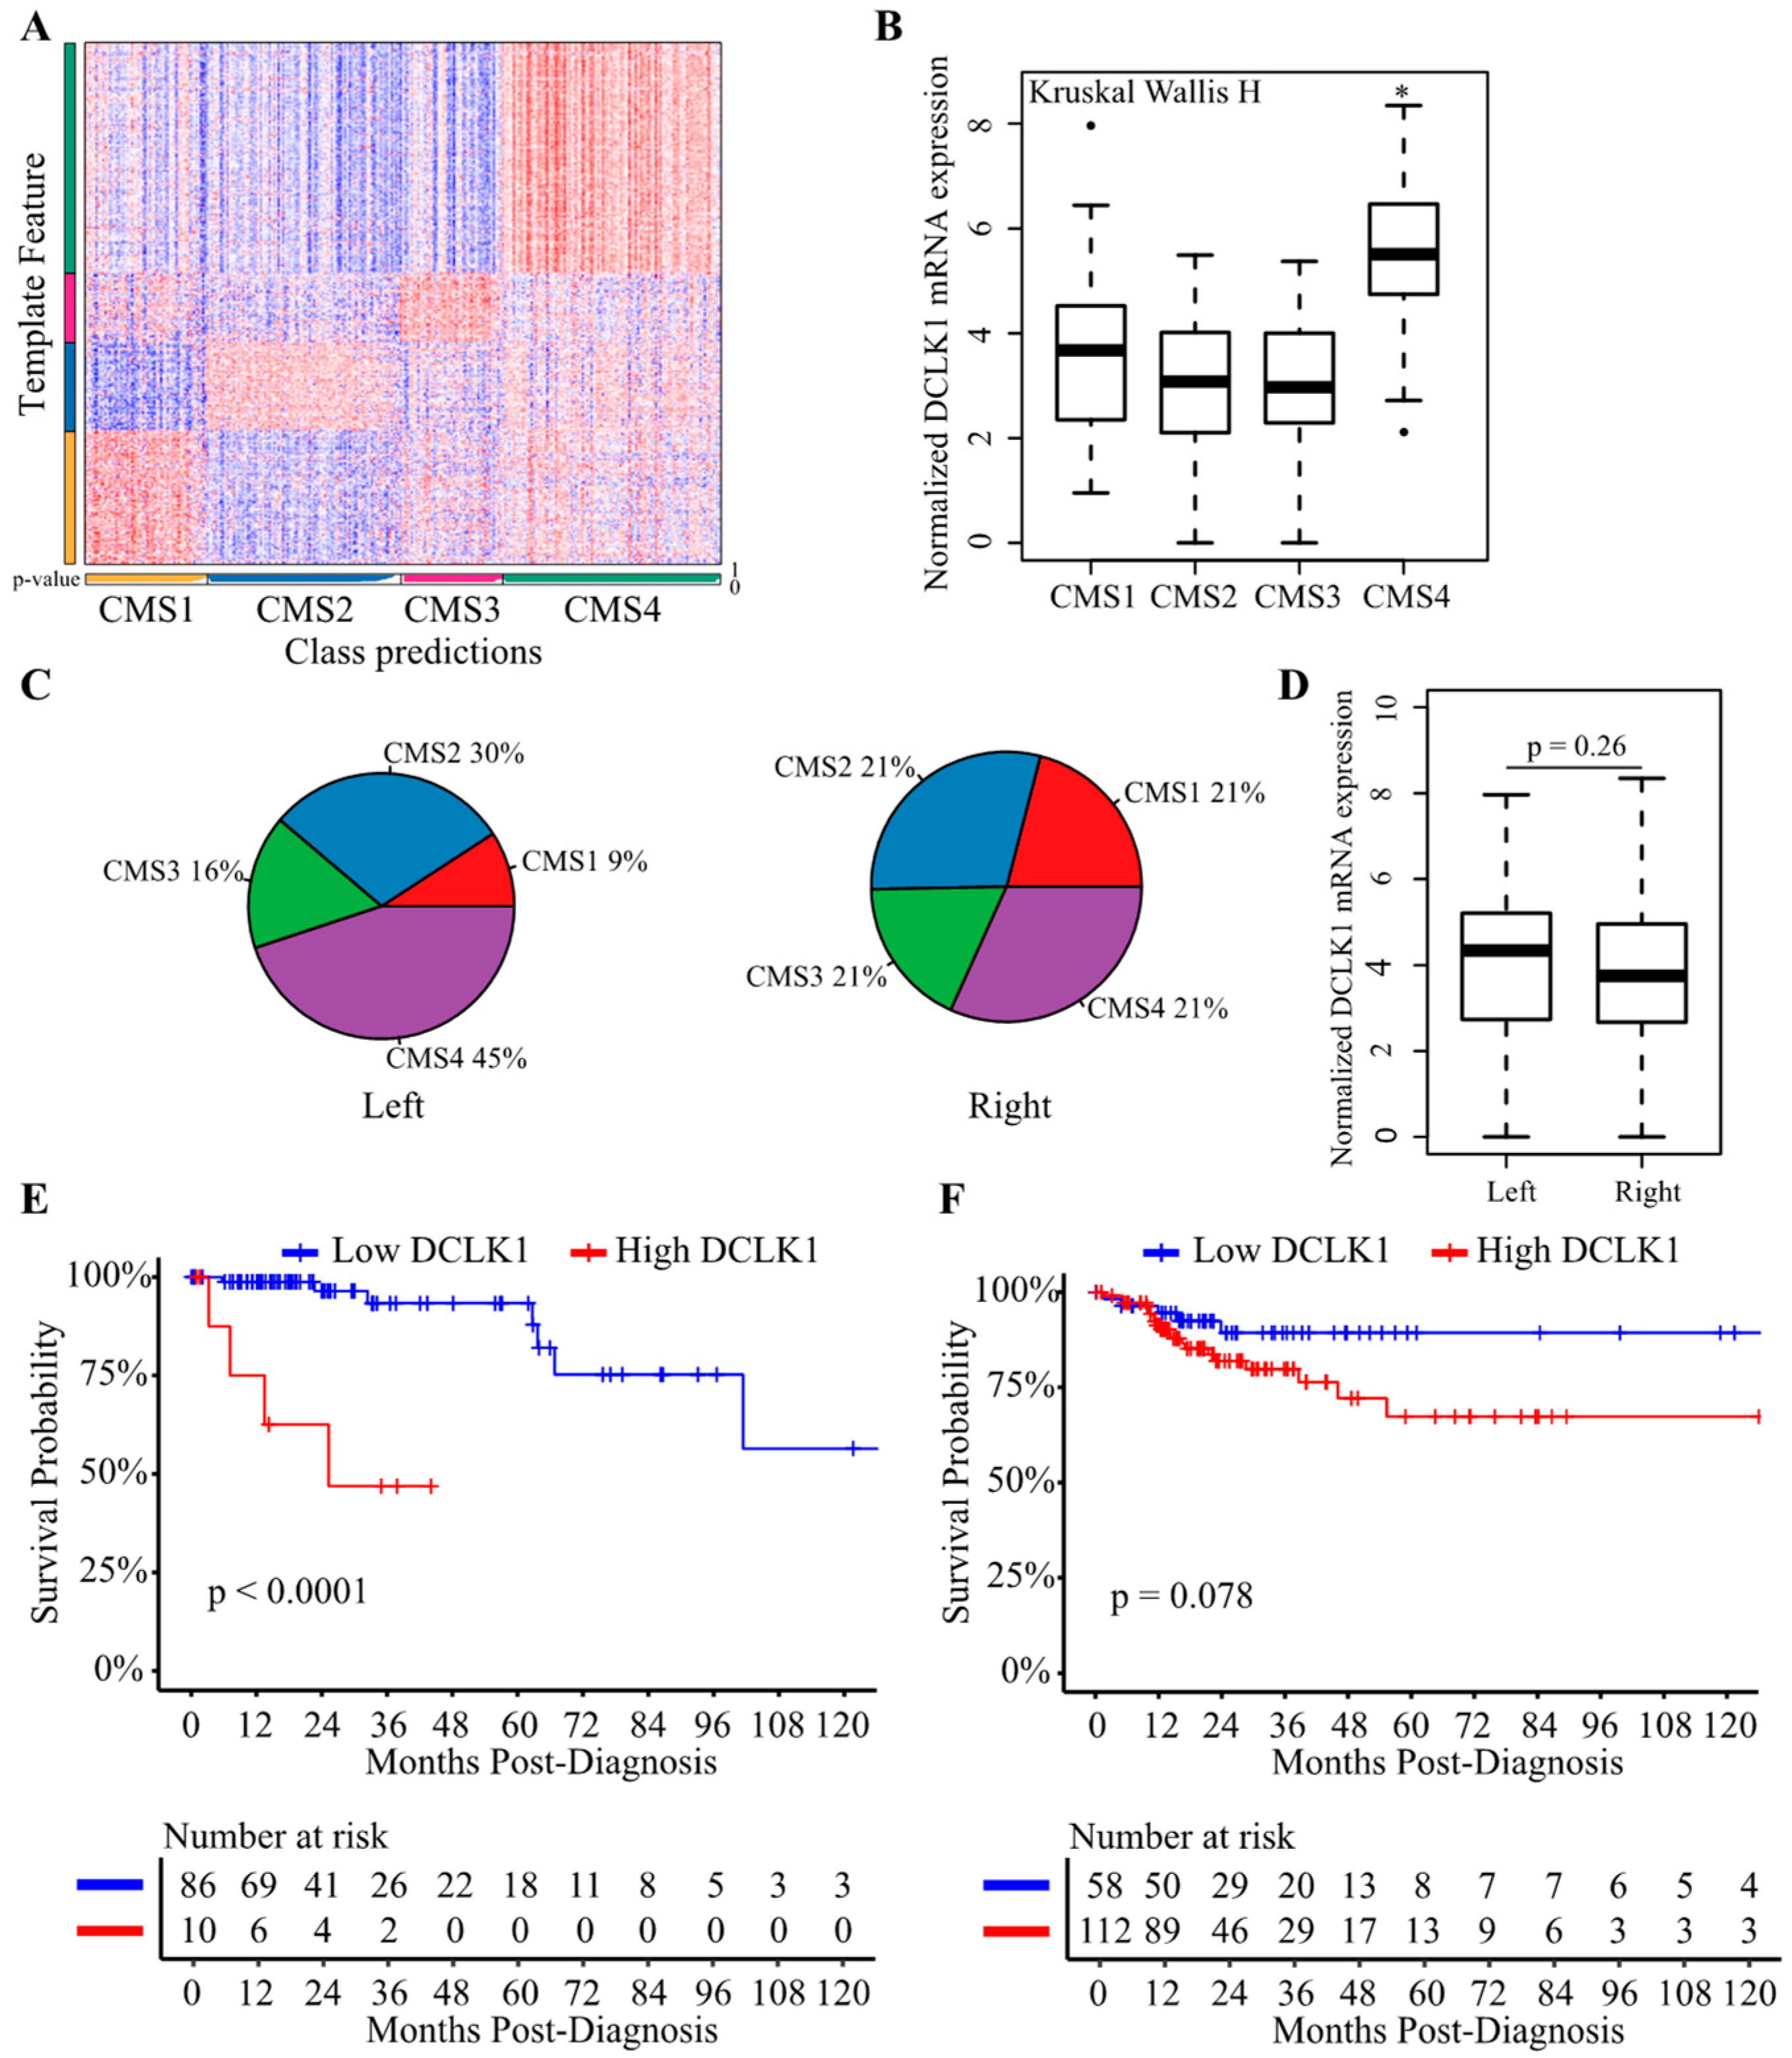
2.6. DCLK1 Predicts the Survival of Patients with Left-Sided Colon Cancer

Consensus molecular subtypes (CMS) can be used to divide CRCs into four biologically distinct and clinically relevant subtypes: CMS1 (MSI-like), CMS2 (canonical), CMS3 (metabolic), and CMS4 (mesenchymal) [63,64]. Recent studies also highlight left-sided (descending colon, sigmoid colon, and rectum) and right-sided (caecum, ascending colon, and transverse colon) colon cancers as having distinct molecular features which result in different outcomes and drug responses [65]. To determine the DCLK1 expression in these contexts, we performed the CMS analysis of COAD dataset (Figure 7A). DCLK1 expression was upregulated specifically in the CMS4 which has the worst outcomes among the four subtypes (Figure 7B) [66]. In addition, we analyzed the CMS subtypes of left-sided and right-sided colon cancers, and found that left-sided colon cancer was more likely to be CMS4 (Figure 7C). DCLK1 expression was similar in left-sided and right-sided colon cancer (Figure 7D). To assess the specificity of DCLK1 as a prognostic marker in these contexts, Kaplan–Meier analysis was performed and showed that higher DCLK1 expression predicted worse DSS in left- but not right-sided colon cancer (Figure 7E,F). These results further extended our knowledge about the functional role of DCLK1 in colon cancer prognosis and may contribute to developing a specific treatment strategy to treat left-sided colon cancers.
Stomach cancer can be classified as cardia, fundus/body, and antrum based on tumor location and MSS, MSI-Low, and MSI-High according to molecular features [67,68]. DCLK1 mRNA expression was upregulated in tumors originating anatomically in the area of the antrum compared with cardia and fundus/body (Figure S6A) and in MSS subtype compared with MSI-Low and MSI-High subtype (Figure S6B). In addition, Kaplan–Meier analyses were performed and showed that higher DCLK1 expression predicted worse DSS in every subtype stomach cancer except the MSI-Low subtype (Figure S6C–H).

3. Discussion

Despite advances in the understanding of GI cancer biology and in surgery and immunotherapy in recent years, little impact has been made on the mortality associated with advanced GI cancers [15,16,66]. Therefore, there is an unmet need to find new immune-related therapeutic approaches against GI cancer. Previous studies reported that DCLK1 level in colorectal, gastric, pancreatic, breast, and esophageal cancers and clear renal cell carcinoma is higher in tumor tissues compared with adjacent tissues [37,39,69,70,71,72], and it can predict poor survival in kidney and pancreatic cancers [35,41]. Our findings again confirm that DCLK1 can be used as a prognostic biomarker for colon and gastric cancer, and extend understanding of this potential to clinically relevant subtypes.
The TME, consisting of numerous cell types including blood, immune, and stromal cells and extracellular matrix, is essential to tumor initiation and progression as well as the development of immune escape mechanisms [25]. Stromal and immune infiltration have previously been associated with clinical outcomes of patients and chemotherapy resistance using multiple cohorts [60]. Similarly, our results show that stromal and immune infiltration are associated with clinical outcomes in colon and stomach cancer (Figure S3A,B). In addition, we identified DCLK1 mRNA expression as positively correlated with stromal and immune scoring. DCLK1 is a marker of gastrointestinal tuft cells which drive the type II immune response to inflammatory injury and have been reported to play an important role in cancer initiation and development in various cancers [14,33]. These correlations suggest that DCLK1-based prediction of outcome in colon and stomach cancers may be associated with stromal and immune cells in the TME.
Immune cell infiltration in the TME may affect tumor cell survival, metastasis, and therapy resistance [25,30,31,73]. Our current results demonstrate that DCLK1 expression is correlated with infiltration of multiple immune cell types in colon and gastric cancer. Notably, there is a weak positive relationship between DCLK1 expression levels and infiltration levels of CD8+ T cells, and significant positive correlations between infiltration levels of M2 macrophages and Treg (Figure 3C,D and Figure 4). Correlation between DCLK1 expression and the markers of immune cells implicates DCLK1 in regulating antitumor immunity in COAD and STAD. Markers of M1 macrophages such as NOS2 and PTGS2 showed no correlation and IRF5 showed weak correlation with DCLK1, whereas M2 macrophages markers such as CD163, VSIG4, and MS4A4A showed strong correlation. Therefore, it is tempting to speculate that DCLK1 or the DCLK1+ cell may regulate polarization of tumor-associated macrophages (TAMs). Furthermore, our results indicate a relationship between DCLK1 and activation of Treg and T cell exhaustion. Specifically, higher DCLK1 expression is associated with increased Treg (FOXP3, CCR8, STAT5B, TGF-B1, CD25, and CD4) and T cell exhaustion markers (PD-1, CTLA4, LAG3, TIM-3, TIGIT, and BTLA) in COAD and STAD (Table 1). Among these markers, TGF-B1, CXCL12, and TIM-3 are crucial to the induction of T cell exhaustion and show the strongest correlation with DCLK1 [73]. Additional significant associations can be found between DCLK1 expression and B cell and DC (Figure S5A,G,K) and several markers of B cell, DC, and T helper cells (Th1, Th2, Tfh, and Th17) in both COAD and STAD. Despite DCLK1 expression showing moderate correlation with Th1-specific transcription factors (T-bet and STAT4), which are known to support Th1 cell cytokine secretion to restrict cancers [74,75,76,77,78], DCLK1 showed little correlation with direct tumor-inhibiting factors such as IFN-gamma, TNF-alpha, and IL12 in COAD and STAD (Table 1) [79,80]. Similarly, for DC and B cell markers, DCLK1 expression indeed positively correlated with CD19, CD79A (B cell markers), and activated DC cell markers (HLA+ class II, CD1b, and CD1c), but several studies indicate that B cells play a negative role in tumor immunity through cytokines IL10 and IL35, which showed positive correlation with DCLK1 expression [81,82]. Moreover, the effectors of DC cells, IL12 and IL1, showed a lack of or negative correlation with DCLK1 expression [83,84,85]. Together, these findings suggest that DCLK1 may play an important role in recruitment and regulation of immune infiltrating cells in COAD and STAD and mechanistic studies are warranted.
CD8+ cytotoxic T cells are a key effector in tumor cell eradication. Higher CD8+ T cell infiltration has been correlated with better clinical outcomes in many cancers [25,73]. Our findings show that low DCLK1 expression correlated with high or low CD8 + T cells predicts better survival in colon and stomach cancer patients, suggesting DCLK1 has the potential to be an adjuvant target to promote sensitivity in immunotherapy-resistant patients. Additionally, it is widely reported that exhausted CD8+ T cells also express CD8A but lose the ability to eradicate the tumor cell [86,87]. This is hypothesized to be one significant reason why immune blockade increases the function of exhausted CD8+ T cells [88,89]. Taken together, our findings that DCLK1 is positively correlated with CD8+ T cells, combined with our findings that DSS in patients with low DCLK1 expression and high CD8+ T cells showed no significant difference compared with low DCLK1 expression and low CD8+ T cells, might indicate that DCLK1 can be used to predict the effect of immunotherapies aimed at restoring function in exhausted CD8 T cells.
Colon cancer is a frequently lethal disease with heterogenous outcomes and drug responses resulting from varying molecular characteristics [64]. Important findings show that left-sided colon cancer has worse clinical outcomes than right-sided colon cancer [65]. Our study demonstrated significant overlap between left-sided cancer and the CMS4 population which has the worst clinical outcomes among the four CMS molecular subtypes of colon cancer. Though DCLK1 mRNA expression showed no significant difference between left-sided cancer and right-sided cancer, higher DCLK1 expression predicted poor outcomes in left-sided cancer patients (Figure 7). These results extend our knowledge about left-sided colon cancer resistance and further suggest that DCLK1 has potential as a specific target in left-sided colon cancers. Additionally, stomach cancer can be classified based on anatomic location and molecular features. Our findings demonstrated that DCLK1 can almost predict the survival of all the specific subtypes for the first time (Figure S6), suggesting DCLK1 plays an important role in stomach cancer and more sophisticated classification to predict different prognoses deserves further study.

4. Materials and Methods

4.1. TCGA Colon and Stomach Cancer Dataset

The RNA-seq datasets from the February 2015 data runs for colon adenocarcinoma (COAD) and stomach adenocarcinoma (STAD) were downloaded from the University of California, Santa Cruz (UCSC) Cancer Genome Browser.

4.2. Clinical Patient Characteristics

Only publicly available, deidentified data were accessed from TCGA for the analyses reported here. Basic characteristics for the patients used in the survival analyses are provided in Table S1.

4.3. Estimation of Tumor Cellular Components and CRC Subtypes

The stromal and immune scores were calculated using the ESTIMATE packages in R [90,91]. The expression profiles of 141 stroma-related genes and 141 immune-related genes (provided in Table S2) were analyzed to obtain stromal score and immune score, respectively. By running ESTIMATE on TCGA RNA-seq data, the stromal and immune score of each sample can be estimated as previously described [90,91,92]. We quantified the proportion of cells that belonged to each of 10 immune cell types (B cells, M1 macrophages, M2 macrophages, monocytes, neutrophils, NK cells, CD4+ T cells, CD8+ T cells, regulatory T cells, and dendritic cells) using the quanTIseq package in R [93]. CMS classifications of COAD were performed using the CMSCaller package in R [64].

4.4. Visualization of RNA Sequencing Dataset

All the figures in the current study were generated in R v3.6.0. The ggsurvplot and ggforest functions from the “survminer” package were used to generate Kaplan–Meier and forest plots, respectively. The base pie function was used to display estimated fraction of immune cells in tumor tissues. The ggscatter function from the “ggpubr” package was used to visualize binary correlations. The corrplot function from the “corrplot” package was used to determine correlations between DCLK1 mRNA expression and gene markers of macrophages. The base boxplot function was used to generate mRNA expression plots of DCLK1 in various conditions.

4.5. Statistical Analysis

Basic statistical analyses were performed in R v3.6.0 and IBM SPSS 25.0. The Wilcox test and Kruskal–Wallis H test were used to determine significance for nonparametric data; p value < 0.05 was considered statistically significant except for correlation analysis. Pearson correlations were calculated with the cor.test package in R and correlation plots were prepared with ggpubr and corrplot packages in R. For correlations only p values < 0.0001 were considered statistically significant, and the strength of the correlation was described as follows: 0.00–0.19 “very weak”, 0.20–0.39 “weak”, 0.40–0.59 “moderate”, 0.60–0.79 “strong”, 0.80–1.0 “very strong” [94]. Kaplan–Meier and Cox regression analyses were performed and visualized using the survival and survminer packages in R. The optimal cutpoint for these analyses was generated by the function “surv_cutpoint” which originates in the “maxstat” R package [95,96].

5. Conclusions

In summary, in colon and gastric cancers, increased DCLK1 expression correlates with poor prognosis and increased infiltration of M2 macrophages and Treg. DCLK1 expression potentially contributes to regulation of tumor-associated macrophages (TAMs) and Treg, and may thereby increase CD8+ T cell inhibition and induce T cell exhaustion. These functional roles in the TME may be specific to left-sided subtypes in colon cancer and DCLK1 may have potential as a prognostic biomarker and adjuvant target to promote immunotherapy sensitivity to improve outcomes in colon and gastric cancer patients.

Supplementary Materials

The following are available online at https://www.mdpi.com/2072-6694/12/2/274/s1, Figure S1: DCLK1 expression predicts clinical outcome of COAD and STAD. Figure S2: Histogram presentation of immune and stromal scores for COAD (A) and STAD (B). Figure S3: Immune score and stromal score predict DSS of COAD and STAD. Figure S4: DCLK1 expression correlates with immune and stromal score in a stage-independent fashion in COAD and STAD. Figure S5: DCLK1 mRNA expression in tumor tissues is significantly correlated with immune infiltration. Figure S6: DCLK1 mRNA expression predicts DSS in the patients of every subtype of STAD. Table S1: Clinical patient characteristics for the colon and stomach cancer. Table S2: Gene list of immune and stromal signatures. Table S3: Fisher test of DCLK1 expression in COAD and STAD. Table S4: Univariate analysis and multivariate analysis of OS and PFI among COAD according to clinical characteristic and DCLK1 expression. Table S5: Univariate analyses and multivariate analyses of OS and PFI among STAD according to clinical characteristic and DCLK1 expression.

Author Contributions

Study conception and design: X.W., D.Q., J.P., and C.W.H.; TCGA data download and analysis: X.W. and N.W.; Data curation: X.W. and N.W.; Writing—original draft preparation: X.W. and D.Q.; Writing—review and editing: N.W., J.P., and C.W.H., Supervision: C.W.H. and J.P.; Project administration: J.P. and C.W.H.; Funding acquisition: C.W.H. All authors have read and agreed to the published version of the manuscript.

Funding

This research was funded by an NIH R01 grant to C.W.H. (5R01CA21401-7) and an NIH R50 grant to D.Q. (R50CA233186).

Acknowledgments

We thank Jiannan Yao from Beijing Chaoyang Hospital and Parthasarathy Chandrakesan from University of Oklahoma Health Sciences Center for helpful advice and discussions.

Conflicts of Interest

C.W.H. is a cofounder of COARE Biotechnology, Inc. D. Qu has ownership interests in COARE Biotechnology, Inc. The other authors have declared that no conflict of interest exists.

References

  1. Bray, F.; Ferlay, J.; Soerjomataram, I.; Siegel, R.L.; Torre, L.A.; Jemal, A. Global cancer statistics 2018: GLOBOCAN estimates of incidence and mortality worldwide for 36 cancers in 185 countries. CA Cancer J. Clin. 2018, 68, 394–424. [Google Scholar] [CrossRef] [Green Version]
  2. Siegel, R.L.; Miller, K.D.; Jemal, A. Cancer statistics, 2019. CA Cancer J. Clin. 2019, 69, 7–34. [Google Scholar] [CrossRef] [Green Version]
  3. Jones, S.; Chen, W.D.; Parmigiani, G.; Diehl, F.; Beerenwinkel, N.; Antal, T.; Traulsen, A.; Nowak, M.A.; Siegel, C.; Velculescu, V.E.; et al. Comparative lesion sequencing provides insights into tumor evolution. Proc. Natl. Acad. Sci. USA 2008, 105, 4283–4288. [Google Scholar] [CrossRef] [PubMed] [Green Version]
  4. Maconi, G.; Manes, G.; Porro, G.B. Role of symptoms in diagnosis and outcome of gastric cancer. World J. Gastroenterol. 2008, 14, 1149–1155. [Google Scholar] [CrossRef] [PubMed]
  5. Grady, W.M.; Pritchard, C.C. Molecular alterations and biomarkers in colorectal cancer. Toxicol. Pathol. 2014, 42, 124–139. [Google Scholar] [CrossRef] [PubMed] [Green Version]
  6. Tan, P.; Yeoh, K.G. Genetics and molecular pathogenesis of gastric adenocarcinoma. Gastroenterology 2015, 149, 1153–1162.e3. [Google Scholar] [CrossRef] [PubMed] [Green Version]
  7. Kim, J.G.; Takeshima, H.; Niwa, T.; Rehnberg, E.; Shigematsu, Y.; Yoda, Y.; Yamashita, S.; Kushima, R.; Maekita, T.; Ichinose, M.; et al. Comprehensive DNA methylation and extensive mutation analyses reveal an association between the CpG island methylator phenotype and oncogenic mutations in gastric cancers. Cancer Lett. 2013, 330, 33–40. [Google Scholar] [CrossRef] [PubMed] [Green Version]
  8. Herrinton, L.J.; Liu, L.; Levin, T.R.; Allison, J.E.; Lewis, J.D.; Velayos, F. Incidence and mortality of colorectal adenocarcinoma in persons with inflammatory bowel disease from 1998 to 2010. Gastroenterology 2012, 143, 382–389. [Google Scholar] [CrossRef]
  9. Kamangar, F.; Dawsey, S.M.; Blaser, M.J.; Perez-Perez, G.I.; Pietinen, P.; Newschaffer, C.J.; Abnet, C.C.; Albanes, D.; Virtamo, J.; Taylor, P.R. Opposing risks of gastric cardia and noncardia gastric adenocarcinomas associated with Helicobacter pylori seropositivity. J. Natl. Cancer Inst. 2006, 98, 1445–1452. [Google Scholar] [CrossRef] [Green Version]
  10. Zhao, J.; Liang, Q.; Cheung, K.F.; Kang, W.; Lung, R.W.; Tong, J.H.; To, K.F.; Sung, J.J.; Yu, J. Genome-wide identification of Epstein-Barr virus-driven promoter methylation profiles of human genes in gastric cancer cells. Cancer 2013, 119, 304–312. [Google Scholar] [CrossRef]
  11. Li, X.B.; Yang, G.; Zhu, L.; Tang, Y.L.; Zhang, C.; Ju, Z.; Yang, X.; Teng, Y. Gastric LGR5+ stem cells are the cellular origin of invasive intestinal-type gastric cancer in mice. Cell Res. 2016, 26, 838–849. [Google Scholar] [CrossRef] [PubMed]
  12. Barker, N.; Tan, S.; Clevers, H. LGR proteins in epithelial stem cell biology. Development 2013, 140, 2484–2494. [Google Scholar] [CrossRef] [PubMed] [Green Version]
  13. Morgan, R.G.; Mortensson, E.; Williams, A.C. Targeting LGR5 in colorectal cancer: Therapeutic gold or too plastic? Br. J. Cancer 2018, 118, 1410–1418. [Google Scholar] [CrossRef]
  14. Westphalen, C.B.; Asfaha, S.; Hayakawa, Y.; Takemoto, Y.; Lukin, D.J.; Nuber, A.H.; Brandtner, A.; Setlik, W.; Remotti, H.; Muley, A.; et al. Long-lived intestinal tuft cells serve as colon cancer-initiating cells. J. Clin. Investig. 2014, 124, 1283–1295. [Google Scholar] [CrossRef] [PubMed] [Green Version]
  15. Coutzac, C.; Pernot, S.; Chaput, N.; Zaanan, A. Immunotherapy in advanced gastric cancer, is it the future? Crit. Rev. Oncol. Hematol. 2019, 133, 25–32. [Google Scholar] [CrossRef] [PubMed]
  16. Ganesh, K.; Stadler, Z.K.; Cercek, A.; Mendelsohn, R.B.; Shia, J.; Segal, N.H.; Diaz, L.A., Jr. Immunotherapy in colorectal cancer: Rationale, challenges and potential. Nat. Rev. Gastroenterol. Hepatol. 2019, 16, 361–375. [Google Scholar] [CrossRef] [PubMed]
  17. Procaccio, L.; Schirripa, M.; Fassan, M.; Vecchione, L.; Bergamo, F.; Prete, A.A.; Intini, R.; Manai, C.; Dadduzio, V.; Boscolo, A.; et al. Immunotherapy in gastrointestinal cancers. Biomed. Res. Int. 2017, 2017, 4346576. [Google Scholar] [CrossRef]
  18. Barbee, M.S.; Ogunniyi, A.; Horvat, T.Z.; Dang, T.O. Current status and future directions of the immune checkpoint inhibitors ipilimumab, pembrolizumab, and nivolumab in oncology. Ann. Pharmacother. 2015, 49, 907–937. [Google Scholar] [CrossRef]
  19. Garon, E.B.; Rizvi, N.A.; Hui, R.; Leighl, N.; Balmanoukian, A.S.; Eder, J.P.; Patnaik, A.; Aggarwal, C.; Gubens, M.; Horn, L.; et al. Pembrolizumab for the treatment of non-small-cell lung cancer. N. Engl. J. Med. 2015, 372, 2018–2028. [Google Scholar] [CrossRef]
  20. Muro, K.; Chung, H.C.; Shankaran, V.; Geva, R.; Catenacci, D.; Gupta, S.; Eder, J.P.; Golan, T.; Le, D.T.; Burtness, B.; et al. Pembrolizumab for patients with PD-L1-positive advanced gastric cancer (KEYNOTE-012): A multicentre, open-label, phase 1b trial. Lancet Oncol. 2016, 17, 717–726. [Google Scholar] [CrossRef]
  21. Le, D.T.; Uram, J.N.; Wang, H.; Bartlett, B.R.; Kemberling, H.; Eyring, A.D.; Skora, A.D.; Luber, B.S.; Azad, N.S.; Laheru, D.; et al. PD-1 blockade in tumors with mismatch-repair deficiency. N. Engl. J. Med. 2015, 372, 2509–2520. [Google Scholar] [CrossRef] [PubMed]
  22. Overman, M.J.; McDermott, R.; Leach, J.L.; Lonardi, S.; Lenz, H.-J.; Morse, M.A.; Desai, J.; Hill, A.; Axelson, M.; Moss, R.A.; et al. Nivolumab in patients with metastatic DNA mismatch repair-deficient or microsatellite instability-high colorectal cancer (CheckMate 142): An open-label, multicentre, phase 2 study. Lancet Oncol. 2017, 18, 1182–1191. [Google Scholar] [CrossRef]
  23. Anderson, K.G.; Stromnes, I.M.; Greenberg, P.D. Obstacles posed by the tumor microenvironment to T cell activity: A case for synergistic therapies. Cancer Cell 2017, 31, 311–325. [Google Scholar] [CrossRef] [PubMed] [Green Version]
  24. Chen, D.S.; Mellman, I. Elements of cancer immunity and the cancer-immune set point. Nature 2017, 541, 321–330. [Google Scholar] [CrossRef]
  25. Joyce, J.A.; Fearon, D.T. T cell exclusion, immune privilege, and the tumor microenvironment. Science 2015, 348, 74–80. [Google Scholar] [CrossRef] [Green Version]
  26. Oh, S.A.; Li, M.O. TGF-β: Guardian of T cell function. J. Immunol. 2013, 191, 3973–3979. [Google Scholar] [CrossRef]
  27. Gocheva, V.; Wang, H.W.; Gadea, B.B.; Shree, T.; Hunter, K.E.; Garfall, A.L.; Berman, T.; Joyce, J.A. IL-4 induces cathepsin protease activity in tumor-associated macrophages to promote cancer growth and invasion. Genes Dev. 2010, 24, 241–255. [Google Scholar] [CrossRef] [Green Version]
  28. Coussens, L.M.; Zitvogel, L.; Palucka, A.K. Neutralizing tumor-promoting chronic inflammation: A magic bullet? Science 2013, 339, 286–291. [Google Scholar] [CrossRef] [Green Version]
  29. Zhang, H.; Liu, H.; Shen, Z.; Lin, C.; Wang, X.; Qin, J.; Qin, X.; Xu, J.; Sun, Y. Tumor-infiltrating neutrophils is prognostic and predictive for postoperative adjuvant chemotherapy benefit in patients with gastric cancer. Ann. Surg. 2018, 267, 311–318. [Google Scholar] [CrossRef]
  30. Waniczek, D.; Lorenc, Z.; Snietura, M.; Wesecki, M.; Kopec, A.; Muc-Wierzgon, M. Tumor-associated macrophages and regulatory T cells infiltration and the clinical outcome in colorectal cancer. Arch. Immunol. Ther. Exp. 2017, 65, 445–454. [Google Scholar] [CrossRef] [Green Version]
  31. Noy, R.; Pollard, J.W. Tumor-associated macrophages: From mechanisms to therapy. Immunity 2014, 41, 49–61. [Google Scholar] [CrossRef] [PubMed] [Green Version]
  32. May, R.; Riehl, T.E.; Hunt, C.; Sureban, S.M.; Anant, S.; Houchen, C.W. Identification of a novel putative gastrointestinal stem cell and adenoma stem cell marker, doublecortin and CaM kinase-like-1, following radiation injury and in adenomatous polyposis coli/multiple intestinal neoplasia mice. Stem Cells 2008, 26, 630–637. [Google Scholar] [CrossRef] [PubMed]
  33. Westphalen, C.B.; Takemoto, Y.; Tanaka, T.; Macchini, M.; Jiang, Z.; Renz, B.W.; Chen, X.; Ormanns, S.; Nagar, K.; Tailor, Y.; et al. Dclk1 defines quiescent pancreatic progenitors that promote injury-induced regeneration and tumorigenesis. Cell Stem Cell 2016, 18, 441–455. [Google Scholar] [CrossRef] [PubMed] [Green Version]
  34. Weygant, N.; Ge, Y.; Qu, D.; Kaddis, J.S.; Berry, W.L.; May, R.; Chandrakesan, P.; Bannerman-Menson, E.; Vega, K.J.; Tomasek, J.J.; et al. Survival of patients with gastrointestinal cancers can be predicted by a surrogate microRNA signature for cancer stem-like cells marked by DCLK1 kinase. Cancer Res. 2016, 76, 4090–4099. [Google Scholar] [CrossRef] [Green Version]
  35. Ge, Y.; Weygant, N.; Qu, D.; May, R.; Berry, W.L.; Yao, J.; Chandrakesan, P.; Zheng, W.; Zhao, L.; Zhao, K.L.; et al. Alternative splice variants of DCLK1 mark cancer stem cells, promote self-renewal and drug-resistance, and can be targeted to inhibit tumorigenesis in kidney cancer. Int. J. Cancer 2018, 143, 1162–1175. [Google Scholar] [CrossRef]
  36. Sureban, S.M.; May, R.; Ramalingam, S.; Subramaniam, D.; Natarajan, G.; Anant, S.; Houchen, C.W. Selective blockade of DCAMKL-1 results in tumor growth arrest by a Let-7a microRNA-dependent mechanism. Gastroenterology 2009, 137, 649–659.e2. [Google Scholar] [CrossRef] [Green Version]
  37. Weygant, N.; Qu, D.; May, R.; Tierney, R.M.; Berry, W.L.; Zhao, L.; Agarwal, S.; Chandrakesan, P.; Chinthalapally, H.R.; Murphy, N.T.; et al. DCLK1 is a broadly dysregulated target against epithelial-mesenchymal transition, focal adhesion, and stemness in clear cell renal carcinoma. Oncotarget 2015, 6, 2193–2205. [Google Scholar] [CrossRef] [Green Version]
  38. Sureban, S.M.; May, R.; Lightfoot, S.A.; Hoskins, A.B.; Lerner, M.; Brackett, D.J.; Postier, R.G.; Ramanujam, R.; Mohammed, A.; Rao, C.V.; et al. DCAMKL-1 regulates epithelial-mesenchymal transition in human pancreatic cells through a miR-200a-dependent mechanism. Cancer Res. 2011, 71, 2328–2338. [Google Scholar] [CrossRef] [Green Version]
  39. Gao, T.; Wang, M.; Xu, L.; Wen, T.; Liu, J.; An, G. DCLK1 is up-regulated and associated with metastasis and prognosis in colorectal cancer. J. Cancer Res. Clin. Oncol. 2016, 142, 2131–2140. [Google Scholar] [CrossRef]
  40. Li, J.; Wang, Y.; Ge, J.; Li, W.; Yin, L.; Zhao, Z.; Liu, S.; Qin, H.; Yang, J.; Wang, L.; et al. Doublecortin-like kinase 1 (DCLK1) regulates B cell-specific moloney murine leukemia virus insertion site 1 (Bmi-1) and is associated with metastasis and prognosis in pancreatic cancer. Cell Physiol. Biochem. 2018, 51, 262–277. [Google Scholar] [CrossRef]
  41. Qu, D.; Weygant, N.; Yao, J.; Chandrakesan, P.; Berry, W.L.; May, R.; Pitts, K.; Husain, S.; Lightfoot, S.; Li, M.; et al. Overexpression of DCLK1-AL increases tumor cell invasion, drug resistance, and KRAS activation and can be targeted to inhibit tumorigenesis in pancreatic cancer. J. Oncol. 2019, 2019, 6402925. [Google Scholar] [CrossRef] [PubMed] [Green Version]
  42. Chandrakesan, P.; Panneerselvam, J.; Qu, D.; Weygant, N.; May, R.; Bronze, M.S.; Houchen, C.W. Regulatory roles of DCLK1 in epithelial mesenchymal transition and cancer stem cells. J. Carcinog. Mutagen. 2016, 7, 257. [Google Scholar] [CrossRef] [PubMed] [Green Version]
  43. Chandrakesan, P.; Weygant, N.; May, R.; Qu, D.; Chinthalapally, H.R.; Sureban, S.M.; Ali, N.; Lightfoot, S.A.; Umar, S.; Houchen, C.W. DCLK1 facilitates intestinal tumor growth via enhancing pluripotency and epithelial mesenchymal transition. Oncotarget 2014, 5, 9269–9280. [Google Scholar] [CrossRef] [Green Version]
  44. Bailey, J.M.; Alsina, J.; Rasheed, Z.A.; McAllister, F.M.; Fu, Y.Y.; Plentz, R.; Zhang, H.; Pasricha, P.J.; Bardeesy, N.; Matsui, W.; et al. DCLK1 marks a morphologically distinct subpopulation of cells with stem cell properties in preinvasive pancreatic cancer. Gastroenterology 2014, 146, 245–256. [Google Scholar] [CrossRef] [PubMed] [Green Version]
  45. Nakanishi, Y.; Seno, H.; Fukuoka, A.; Ueo, T.; Yamaga, Y.; Maruno, T.; Nakanishi, N.; Kanda, K.; Komekado, H.; Kawada, M.; et al. DCLK1 distinguishes between tumor and normal stem cells in the intestine. Nat. Genet. 2013, 45, 98–103. [Google Scholar] [CrossRef] [Green Version]
  46. Howitt, M.R.; Lavoie, S.; Michaud, M.; Blum, A.M.; Tran, S.V.; Weinstock, J.V.; Gallini, C.A.; Redding, K.; Margolskee, R.F.; Osborne, L.C.; et al. Tuft cells, taste-chemosensory cells, orchestrate parasite type 2 immunity in the gut. Science 2016, 351, 1329–1333. [Google Scholar] [CrossRef] [Green Version]
  47. Von Moltke, J.; Ji, M.; Liang, H.E.; Locksley, R.M. Tuft-cell-derived IL-25 regulates an intestinal ILC2-epithelial response circuit. Nature 2016, 529, 221–225. [Google Scholar] [CrossRef] [Green Version]
  48. Gerbe, F.; Sidot, E.; Smyth, D.J.; Ohmoto, M.; Matsumoto, I.; Dardalhon, V.; Cesses, P.; Garnier, L.; Pouzolles, M.; Brulin, B.; et al. Intestinal epithelial tuft cells initiate type 2 mucosal immunity to helminth parasites. Nature 2016, 529, 226–230. [Google Scholar] [CrossRef] [Green Version]
  49. Schneider, C.; O’Leary, C.E.; Locksley, R.M. Regulation of immune responses by tuft cells. Nat. Rev. Immunol. 2019, 19, 584–593. [Google Scholar] [CrossRef]
  50. Schneider, C.; O’Leary, C.E.; von Moltke, J.; Liang, H.E.; Ang, Q.Y.; Turnbaugh, P.J.; Radhakrishnan, S.; Pellizzon, M.; Ma, A.; Locksley, R.M. A metabolite-triggered tuft cell-ILC2 circuit drives small intestinal remodeling. Cell 2018, 174, 271–284.e214. [Google Scholar] [CrossRef] [Green Version]
  51. Lei, W.; Ren, W.; Ohmoto, M.; Urban, J.F., Jr.; Matsumoto, I.; Margolskee, R.F.; Jiang, P. Activation of intestinal tuft cell-expressed SUCNR1 triggers type 2 immunity in the mouse small intestine. Proc. Natl. Acad. Sci. USA 2018, 115, 5552–5557. [Google Scholar] [CrossRef] [PubMed] [Green Version]
  52. Nadjsombati, M.S.; McGinty, J.W.; Lyons-Cohen, M.R.; Jaffe, J.B.; DiPeso, L.; Schneider, C.; Miller, C.N.; Pollack, J.L.; Nagana Gowda, G.A.; Fontana, M.F.; et al. Detection of succinate by intestinal tuft cells triggers a type 2 innate immune circuit. Immunity 2018, 49, 33–41.e37. [Google Scholar] [CrossRef] [PubMed] [Green Version]
  53. Ting, H.A.; von Moltke, J. The immune function of tuft cells at gut mucosal surfaces and beyond. J. Immunol. 2019, 202, 1321–1329. [Google Scholar] [CrossRef] [PubMed] [Green Version]
  54. Middelhoff, M.; Westphalen, C.B.; Hayakawa, Y.; Yan, K.S.; Gershon, M.D.; Wang, T.C.; Quante, M. DCLK1-expressing tuft cells: Critical modulators of the intestinal niche? Am. J. Physiol. Gastrointest. Liver Physiol. 2017, 313, G285–G299. [Google Scholar] [CrossRef] [Green Version]
  55. Luo, X.C.; Chen, Z.H.; Xue, J.B.; Zhao, D.X.; Lu, C.; Li, Y.H.; Li, S.M.; Du, Y.W.; Liu, Q.; Wang, P.; et al. Infection by the parasitic helminth Trichinella spiralis activates a TAS2R-mediated signaling pathway in intestinal tuft cells. Proc. Natl. Acad. Sci. USA 2019, 116, 5564–5569. [Google Scholar] [CrossRef] [Green Version]
  56. The Cancer Genome Atlas Network. Comprehensive molecular characterization of human colon and rectal cancer. Nature 2012, 487, 330–337. [Google Scholar] [CrossRef] [Green Version]
  57. The Cancer Genome Atlas Network. Comprehensive molecular characterization of gastric adenocarcinoma. Nature 2014, 513, 202–209. [Google Scholar] [CrossRef] [Green Version]
  58. Dai, T.; Hu, Y.; Lv, F.; Ozawa, T.; Sun, X.; Huang, J.; Han, X.; Kishi, H.; Muraguchi, A.; Jin, A. Analysis of the clinical significance of DCLK1+ colorectal cancer using novel monoclonal antibodies against DCLK1. OncoTargets Ther. 2018, 11, 5047–5057. [Google Scholar] [CrossRef] [Green Version]
  59. Meng, Q.B.; Yu, J.C.; Kang, W.M.; Ma, Z.Q.; Zhou, W.X.; Li, J.; Zhou, L.; Cao, Z.J.; Tian, S.B. Expression of doublecortin-like kinase 1 in human gastric cancer and its correlation with prognosis. Zhongguo Yi Xue Ke Xue Yuan Xue Bao Acta Acad. Med. Sin. 2013, 35, 639–644. [Google Scholar] [CrossRef]
  60. Liu, W.; Ye, H.; Liu, Y.F.; Xu, C.Q.; Zhong, Y.X.; Tian, T.; Ma, S.W.; Tao, H.; Li, L.; Xue, L.C.; et al. Transcriptome-derived stromal and immune scores infer clinical outcomes of patients with cancer. Oncol. Lett. 2018, 15, 4351–4357. [Google Scholar] [CrossRef] [Green Version]
  61. Arnold, T.; Betsholtz, C. The importance of microglia in the development of the vasculature in the central nervous system. Vasc. Cell 2013, 5, 4. [Google Scholar] [CrossRef] [PubMed] [Green Version]
  62. Savage, N.D.; de Boer, T.; Walburg, K.V.; Joosten, S.A.; van Meijgaarden, K.; Geluk, A.; Ottenhoff, T.H. Human anti-inflammatory macrophages induce FOXP3+ GITR+ CD25+ regulatory T cells, which suppress via membrane-bound TGFβ-1. J. Immunol. 2008, 181, 2220–2226. [Google Scholar] [CrossRef] [PubMed] [Green Version]
  63. Guinney, J.; Dienstmann, R.; Wang, X.; de Reynies, A.; Schlicker, A.; Soneson, C.; Marisa, L.; Roepman, P.; Nyamundanda, G.; Angelino, P.; et al. The consensus molecular subtypes of colorectal cancer. Nat. Med. 2015, 21, 1350–1356. [Google Scholar] [CrossRef] [PubMed]
  64. Eide, P.W.; Bruun, J.; Lothe, R.A.; Sveen, A. CMScaller: An R package for consensus molecular subtyping of colorectal cancer pre-clinical models. Sci. Rep. 2017, 7, 16618. [Google Scholar] [CrossRef] [PubMed] [Green Version]
  65. Wang, Y.; Yang, L.; Zhou, M.; Shen, L.; Zhang, J.; Deng, W.; Liang, L.; Hu, R.; Yang, W.; Yao, Y.; et al. Disparities in survival for right-sided vs. left-sided colon cancers in young patients: A study based on the Surveillance, Epidemiology, and End Results database (1990–2014). Cancer Manag. Res. 2018, 10, 1735–1747. [Google Scholar] [CrossRef] [Green Version]
  66. Franke, A.J.; Skelton, W.P.; Starr, J.S.; Parekh, H.; Lee, J.J.; Overman, M.J.; Allegra, C.; George, T.J. Immunotherapy for colorectal cancer: A review of current and novel therapeutic approaches. J. Natl. Cancer Inst. 2019, 111, 1131–1141. [Google Scholar] [CrossRef] [Green Version]
  67. Hu, B.; El Hajj, N.; Sittler, S.; Lammert, N.; Barnes, R.; Meloni-Ehrig, A. Gastric cancer: Classification, histology and application of molecular pathology. J. Gastrointest. Oncol. 2012, 3, 251–261. [Google Scholar] [CrossRef]
  68. Ajani, J.A.; Lee, J.; Sano, T.; Janjigian, Y.Y.; Fan, D.; Song, S. Gastric adenocarcinoma. Nat. Rev. Dis. Primers 2017, 3, 17036. [Google Scholar] [CrossRef]
  69. Zhou, B.; Sun, C.; Hu, X.; Zhan, H.; Zou, H.; Feng, Y.; Qiu, F.; Zhang, S.; Wu, L.; Zhang, B. MicroRNA-195 suppresses the progression of pancreatic cancer by targeting DCLK1. Cell Physiol. Biochem. 2017, 44, 1867–1881. [Google Scholar] [CrossRef]
  70. Whorton, J.; Sureban, S.M.; May, R.; Qu, D.; Lightfoot, S.A.; Madhoun, M.; Johnson, M.; Tierney, W.M.; Maple, J.T.; Vega, K.J.; et al. DCLK1 is detectable in plasma of patients with Barrett’s esophagus and esophageal adenocarcinoma. Dig. Dis. Sci. 2015, 60, 509–513. [Google Scholar] [CrossRef]
  71. Lv, Y.; Song, G.; Wang, R.; Di, L.; Wang, J. Doublecortin-like kinase 1 is a novel biomarker for prognosis and regulates growth and metastasis in basal-like breast cancer. Biomed. Pharmacother. 2017, 88, 1198–1205. [Google Scholar] [CrossRef]
  72. Kalantari, E.; Asadi Lari, M.H.; Roudi, R.; Korourian, A.; Madjd, Z. LGR5High/DCLK1High phenotype is more common in early stage and intestinal subtypes of gastric carcinomas. Cancer Biomark. 2017, 20, 563–573. [Google Scholar] [CrossRef] [PubMed]
  73. Sato, E.; Olson, S.H.; Ahn, J.; Bundy, B.; Nishikawa, H.; Qian, F.; Jungbluth, A.A.; Frosina, D.; Gnjatic, S.; Ambrosone, C.; et al. Intraepithelial CD8+ tumor-infiltrating lymphocytes and a high CD8+/regulatory T cell ratio are associated with favorable prognosis in ovarian cancer. Proc. Natl. Acad. Sci. USA 2005, 102, 18538–18543. [Google Scholar] [CrossRef] [PubMed] [Green Version]
  74. Szabo, S.J.; Kim, S.T.; Costa, G.L.; Zhang, X.; Fathman, C.G.; Glimcher, L.H. A novel transcription factor, T-bet, directs Th1 lineage commitment. Cell 2000, 100, 655–669. [Google Scholar] [CrossRef] [Green Version]
  75. Kanhere, A.; Hertweck, A.; Bhatia, U.; Gokmen, M.R.; Perucha, E.; Jackson, I.; Lord, G.M.; Jenner, R.G. T-bet and GATA3 orchestrate Th1 and Th2 differentiation through lineage-specific targeting of distal regulatory elements. Nat. Commun. 2012, 3, 1268. [Google Scholar] [CrossRef] [PubMed] [Green Version]
  76. Hertweck, A.; Evans, C.M.; Eskandarpour, M.; Lau, J.C.; Oleinika, K.; Jackson, I.; Kelly, A.; Ambrose, J.; Adamson, P.; Cousins, D.J.; et al. T-bet activates Th1 genes through mediator and the super elongation complex. Cell Rep. 2016, 15, 2756–2770. [Google Scholar] [CrossRef] [Green Version]
  77. Nishikomori, R.; Usui, T.; Wu, C.Y.; Morinobu, A.; O’Shea, J.J.; Strober, W. Activated STAT4 has an essential role in Th1 differentiation and proliferation that is independent of its role in the maintenance of IL-12Rβ2 chain expression and signaling. J. Immunol. 2002, 169, 4388–4398. [Google Scholar] [CrossRef]
  78. Thieu, V.T.; Yu, Q.; Chang, H.C.; Yeh, N.; Nguyen, E.T.; Sehra, S.; Kaplan, M.H. Signal transducer and activator of transcription 4 is required for the transcription factor T-bet to promote T helper 1 cell-fate determination. Immunity 2008, 29, 679–690. [Google Scholar] [CrossRef] [Green Version]
  79. Mandai, M.; Hamanishi, J.; Abiko, K.; Matsumura, N.; Baba, T.; Konishi, I. Dual faces of IFNγ in cancer progression: A role of PD-L1 induction in the determination of pro- and antitumor immunity. Clin. Cancer Res. 2016, 22, 2329–2334. [Google Scholar] [CrossRef] [Green Version]
  80. Decker, T.; Lohmann-Matthes, M.L.; Gifford, G.E. Cell-associated tumor necrosis factor (TNF) as a killing mechanism of activated cytotoxic macrophages. J. Immunol. 1987, 138, 957–962. [Google Scholar]
  81. Pylayeva-Gupta, Y.; Das, S.; Handler, J.S.; Hajdu, C.H.; Coffre, M.; Koralov, S.B.; Bar-Sagi, D. IL35-producing B cells promote the development of pancreatic neoplasia. Cancer Discov. 2016, 6, 247–255. [Google Scholar] [CrossRef] [PubMed] [Green Version]
  82. Sarvaria, A.; Madrigal, J.A.; Saudemont, A. B cell regulation in cancer and anti-tumor immunity. Cell Mol. Immunol. 2017, 14, 662–674. [Google Scholar] [CrossRef] [PubMed] [Green Version]
  83. Wesa, A.K.; Galy, A. IL-1β induces dendritic cells to produce IL-12. Int. Immunol. 2001, 13, 1053–1061. [Google Scholar] [CrossRef] [PubMed] [Green Version]
  84. Dinarello, C.A. Interleukin-1 in the pathogenesis and treatment of inflammatory diseases. Blood 2011, 117, 3720–3732. [Google Scholar] [CrossRef] [Green Version]
  85. Wesa, A.; Galy, A. Increased production of pro-inflammatory cytokines and enhanced T cell responses after activation of human dendritic cells with IL-1 and CD40 ligand. BMC Immunol. 2002, 3, 14. [Google Scholar] [CrossRef]
  86. Myers, L.M.; Tal, M.C.; Torrez Dulgeroff, L.B.; Carmody, A.B.; Messer, R.J.; Gulati, G.; Yiu, Y.Y.; Staron, M.M.; Angel, C.L.; Sinha, R.; et al. A functional subset of CD8+ T cells during chronic exhaustion is defined by SIRPα expression. Nat. Commun. 2019, 10, 794. [Google Scholar] [CrossRef] [Green Version]
  87. Blackburn, S.D.; Shin, H.; Haining, W.N.; Zou, T.; Workman, C.J.; Polley, A.; Betts, M.R.; Freeman, G.J.; Vignali, D.A.; Wherry, E.J. Coregulation of CD8+ T cell exhaustion by multiple inhibitory receptors during chronic viral infection. Nat. Immunol. 2009, 10, 29–37. [Google Scholar] [CrossRef] [Green Version]
  88. Barber, D.L.; Wherry, E.J.; Masopust, D.; Zhu, B.; Allison, J.P.; Sharpe, A.H.; Freeman, G.J.; Ahmed, R. Restoring function in exhausted CD8 T cells during chronic viral infection. Nature 2006, 439, 682–687. [Google Scholar] [CrossRef]
  89. Bae, E.A.; Seo, H.; Kim, B.S.; Choi, J.; Jeon, I.; Shin, K.S.; Koh, C.H.; Song, B.; Kim, I.K.; Min, B.S.; et al. Activation of NKT cells in an anti-PD-1-resistant tumor model enhances antitumor immunity by reinvigorating exhausted CD8 T cells. Cancer Res. 2018, 78, 5315–5326. [Google Scholar] [CrossRef] [Green Version]
  90. Chakraborty, H.; Hossain, A. R package to estimate intracluster correlation coefficient with confidence interval for binary data. Comput. Methods Programs Biomed. 2018, 155, 85–92. [Google Scholar] [CrossRef]
  91. Yoshihara, K.; Shahmoradgoli, M.; Martinez, E.; Vegesna, R.; Kim, H.; Torres-Garcia, W.; Trevino, V.; Shen, H.; Laird, P.W.; Levine, D.A.; et al. Inferring tumour purity and stromal and immune cell admixture from expression data. Nat. Commun. 2013, 4, 2612. [Google Scholar] [CrossRef] [PubMed]
  92. Zhang, C.; Cheng, W.; Ren, X.; Wang, Z.; Liu, X.; Li, G.; Han, S.; Jiang, T.; Wu, A. Tumor purity as an underlying key factor in glioma. Clin. Cancer Res. 2017, 23, 6279–6291. [Google Scholar] [CrossRef] [PubMed] [Green Version]
  93. Finotello, F.; Mayer, C.; Plattner, C.; Laschober, G.; Rieder, D.; Hackl, H.; Krogsdam, A.; Loncova, Z.; Posch, W.; Wilflingseder, D.; et al. Molecular and pharmacological modulators of the tumor immune contexture revealed by deconvolution of RNA-seq data. Genome Med. 2019, 11, 34. [Google Scholar] [CrossRef] [PubMed] [Green Version]
  94. Pan, J.H.; Zhou, H.; Cooper, L.; Huang, J.L.; Zhu, S.B.; Zhao, X.X.; Ding, H.; Pan, Y.L.; Rong, L. LAYN is a prognostic biomarker and correlated with immune infiltrates in gastric and colon cancers. Front. Immunol. 2019, 10, 6. [Google Scholar] [CrossRef] [PubMed] [Green Version]
  95. Lausen, B.; Lerche, R.; Schumacher, M. Maximally selected rank statistics for dose-response problems. Biom. J. 2002, 44, 131–147. [Google Scholar] [CrossRef]
  96. Hillengass, J.; Ritsch, J.; Merz, M.; Wagner, B.; Kunz, C.; Hielscher, T.; Laue, H.; Bauerle, T.; Zechmann, C.M.; Ho, A.D.; et al. Increased microcirculation detected by dynamic contrast-enhanced magnetic resonance imaging is of prognostic significance in asymptomatic myeloma. Br. J. Haematol. 2016, 174, 127–135. [Google Scholar] [CrossRef] [Green Version]
Figure 1. DCLK1 is an independent risk factor to predict disease-specific survival (DSS) of colon and gastric cancer. Lower DCLK1 mRNA expression significantly predicts shorter DSS in COAD (n = 283) (A) and STAD (n = 415) (B) based on Kaplan–Meier analysis. Multivariate Cox regression analysis of patients in COAD (C) and STAD (D) indicating that DCLK1 mRNA expression is an independent indicator of prognosis.
Cancers 12 00274 g001
Figure 2. DCLK1 is correlated with an activated tumor microenvironment (TME) in COAD and STAD. DCLK1 mRNA expression is strongly associated with Immune Score and Stromal Score in COAD (A and C) and STAD (B and D) based on Pearson correlation analysis.
Cancers 12 00274 g002
Figure 3. DCLK1 mRNA expression in tumor tissues is significantly correlated with immune infiltration. Estimated fraction of immune cells in tumor tissues of COAD (A) and STAD (B) was visualized by QuanTIseq analysis. Among all the immune cell types, macrophages (M1 + M2) represented the major population in COAD and STAD. Correlation analysis shows that DCLK1 expression is significantly correlated with CD8+ T cell (C), M2 macrophage (D), and Treg (E) in COAD. DCLK1 expression is also significantly correlated with M2 macrophage (G) and Treg (H) and shows a weak correlation with CD8+ T cells (F) in STAD.
Cancers 12 00274 g003
Figure 4. DCLK1 expression in tumor tissues correlates with macrophage polarization in COAD and STAD. Correlations analysis demonstrates that DCLK1 expression is significantly positively correlated with gene markers of monocytes (CD86 and CSF1R), TAMs (CCL2, CD68, and IL10), and M2 (CD163, VSIG4, and MS4A4A), but is not with gene markers of M1 (NOS2, IRF5, and PTGS2) in COAD (A) and STAD (B).
Cancers 12 00274 g004
Figure 5. DCLK1 expression is positively associated with CD8+ T cell inhibitors induced by TAMs. Correlation analysis suggests that DCLK1 expression is significantly positively correlated with TGF-B1 and CXCL12 and their specific receptors TGF-BR1, TGF-BR2, and TGF-BR3, and CXCR4, respectively, in COAD (A) and STAD (B).
Cancers 12 00274 g005
Figure 6. DCLK1/CD8 status predicts DSS of colon and stomach cancer patients. Kaplan–Meier analysis of composite DCLK1 and CD8 status based on mRNA expression in COAD (A) and STAD (B). DCLK1Lo/CD8Lo (green line) patients presented with better survival times than DCLK1Hi/ CD8Hi (red line) for COAD and STAD. DSS times of COAD and STAD patients with lower DCLK and higher CD8 (yellow line) were better than higher DCLK1 and higher CD8 (red line). Cox regression analysis of patients in COAD (C) and STAD (D) indicated that combined high DCLK1 and high CD8 mRNA expression is an independent indicator of prognosis. DCLK1 Lo/CD8Lo was used as the control group for all statistical comparisons.
Cancers 12 00274 g006
Figure 7. DCLK1 predicts DSS in the patients with left-sided colon cancer. (A) CMScaller performance on the test set of COAD from TCGA (n = 283). Heatmap represents the relative expression levels of subtype marker genes (vertical bar) with classifications indicated below (horizontal bar, white indicates prediction confidence p-values). (B) DCLK1 expression level was significantly increased in CMS4 colon cancers. (C) Colon cancer initiated in the left colon (descending colon, sigmoid colon, and rectum) was more likely to present as CMS4 compared with those initiated in the right colon (caecum, ascending colon, and transverse colon). (D) DCLK1 mRNA level showed no significant difference between left-sided and right-sided colon cancers. Higher DCLK1 expression predicts worse DSS in patients with cancers initiated in the left colon (E) but not in the right colon (F) based on Kaplan–Meier analysis.
Cancers 12 00274 g007
Table 1. Correlation analysis between DCLK1 and related genes and markers of immune cells.
DescriptionGene MarkersCOADSTAD
Cor95%CIpCor95%CIp
CD8+ T cellCD8A0.4120.3110.503***0.3280.2390.411***
CD8B0.2530.1410.358***0.1870.0920.2780.0001
T cell (general)CD3D0.4150.3150.507***0.2580.1660.346***
CD3E0.5120.4210.593***0.3030.2130.388***
CD20.4760.3810.561***0.3200.2310.404***
B cellCD190.4770.3820.562***0.3720.2860.452***
CD79A0.5680.4840.642***0.3960.3120.474***
IL350.5590.4740.634***0.3550.2680.436***
MonocyteCD860.6800.6120.738***0.3790.2930.458***
CD115(CSF1R)0.7480.6920.795***0.5220.4480.589***
CCL20.7040.6400.758***0.4450.3640.519***
CD680.5250.4360.604***0.1600.0640.2520.001
IL100.6330.5580.698***0.3630.2760.444***
M1 MacrophageINOS(NOS2)−0.207−0.315−0.0930.0004−0.147−0.240−0.0520.003
IRF50.2920.1820.395***0.2970.2070.382***
COX2(PTGS2)0.1860.0710.2950.0010.1350.0390.2280.006
M2 MacrophageCD1630.6920.6270.748***0.4370.3560.512***
VSIG40.6950.6300.751***0.4160.3330.492***
MS4A4A0.6900.6240.746***0.5020.4260.570***
NeutrophilCD66b(CEACAM8)−0.129−0.242−0.0130.029−0.008−0.1040.0890.875
CD11b(ITGAM)0.7250.6650.776***0.4750.3970.546***
CCR70.5850.5030.657***0.4730.3950.545***
Natural killer cellKIR2DL10.1960.0820.3050.00080.1810.0860.2720.0002
KIR2DL30.2750.1640.379***0.1050.0090.1990.032
KIR2DL40.105−0.0110.2180.076−0.069−0.1640.0270.160
KIR3DL10.2100.0970.3190.00030.1810.0860.2730.0002
KIR3DL20.2810.1710.385***0.1380.0420.2310.032
KIR3DL30.040−0.0760.1550.500−0.051−0.1460.0460.302
KIR2DS40.1870.0730.2970.00140.076−0.0210.1710.124
Dendritic cellHLA-DPB10.6480.5760.711***0.3110.2220.396***
HLA-DQB10.3860.2830.480***0.1420.0470.2350.004
HLA-DRA0.5060.4140.587***0.2110.1170.301***
HLA-DPA10.5830.5010.655***0.2680.1760.355***
BDCA-1(CD1C)0.6680.5980.728***0.5670.4970.629***
Th1BDCA-1(NRP1)0.7600.7070.805***0.6350.5740.689***
CD11c(ITGAX)0.6350.5600.699***0.4050.3210.482***
CD11b (ITGAM)0.7250.6550.776***0.4750.3970.546***
IL12A0.046−0.070.1610.4370.1920.0980.283***
IL1B−0.228−0.318−0.135***0.068−0.0480.1830.246
T-bet (TBX21)0.4830.3880.567***0.3010.2110.386***
STAT40.5300.4420.609***0.3960.3110.474***
STAT10.3740.2700.470***0.004−0.0920.1000.933
IFN-gamma (IFNG)0.1580.0430.2690.007−0.042−0.1370.0550.398
TNF-alpha (TNF)0.3390.2320.438***0.011−0.0850.1070.820
Th2GATA30.6280.5520.693***0.4240.3420.500***
STAT6−0.010−0.1260.1060.8600.1630.0670.2550.0009
STAT5A0.3930.2900.487***0.4210.3390.497***
IL130.2590.1470.364***0.1460.0500.2390.003
TfhBCL60.5360.4480.614***0.4560.3760.529***
Th17IL210.3190.2110.419***0.1210.0250.2150.013
STAT30.3390.2320.438***0.3210.2320.405***
TregIL17A−0.208−0.316−0.0940.0003−0.308−0.393−0.218***
FOXP30.6150.5370.682***0.2410.1480.329***
T cell exhaustionCCR80.6280.5520.693***0.3530.2660.435***
STAT5B0.4600.3630.547***0.6350.5730.689***
TGFbeta (TGFB1)0.6920.6260.748***0.5300.4570.596***
CD25 (IL2RA)0.5750.4910.648***0.2920.2010.377***
CD40.7080.6460.762***0.4240.3420.500***
PD-1(PDCD1)0.4350.3360.524***0.2010.1070.291***
CTLA40.4780.3830.563***0.1060.0100.2000.031
LAG30.3410.2340.439***0.1400.0450.2330.004
TIM-3(HAVCR2)0.6660.5960.726***0.3620.2750.443***
BTLA0.5560.4710.632***0.4360.3540.511***
TIGIT0.5410.4530.618***0.3440.2560.426***
*** p < 0.0001.

