Identification of the Best 3D Viewpoint within the BIM Model: Application to Visual Tasks Related to Facility Management


1
Geomatics Unit, University of Liège (ULiege), Quartier Agora, Allée du Six-Août, 19, 4000 Liège, Belgium
2
Department of Geomatics Sciences, Université Laval, Pavillon Louis-Jacques-Casault 1055, Avenue du Séminaire, Bureau 1315, Québec, QC G1V 5C8, Canada
*
Author to whom correspondence should be addressed.
Buildings 2019, 9(7), 167; https://doi.org/10.3390/buildings9070167
Submission received: 23 June 2019
/
Revised: 5 July 2019
/
Accepted: 8 July 2019
/
Published: 10 July 2019
(This article belongs to the Special Issue BIM in Building Repair and Maintenance)
Abstract
:Visualizing building assets within building information modeling (BIM) offers significant opportunities in facility management as it can assist the maintenance and the safety of buildings. Nevertheless, taking decisions based on 3D visualization remains a challenge since the high density of spatial information inside the 3D model requires suitable visualization techniques to achieve the visual task. The occlusion is ubiquitous and, whilst solutions already exist such as transparency, none currently solve this issue with an automatic and suitable management of the camera. In this paper, we propose the first RESTful web application implementing a 3D viewpoint management algorithm and we demonstrate its usability in the visualization of assets based on a BIM model for visual counting in facility management. Via an online questionnaire, empirical tests are conducted with architects, the construction industry, engineers, and surveyors. The results show that a 3D viewpoint that maximizes the visibility of 3D geometric objects inside the viewport significantly improves the success rate, the accuracy, and the certainty of a visual counting task compared to the traditional four side points of view (i.e., from the front, back, left, and right viewpoints). Finally, this first validation lays the foundation of future investigations in the 3D viewpoint usability evaluation, both in terms of visual tasks and application domains.
1. Introduction
1.1. Context
Whilst initially employed within the Architecture, Engineering and Construction industry (AEC) as a new way for simplifying the design of a facility and simulating the construction sequencing [1,2], building information modeling (BIM) has recently been extended to facility management (FM) as a powerful tool for improving the building performance and managing its maintenance and safety throughout its lifetime [3]. Defined as the organizational function that encompasses people, place, and process within the built environment (ISO 41011:2017), FM is crucial to maximize the lifespan of the building and its equipment [4], and, if properly managed, it can save significant annual costs [5]. Moreover, its early incorporation in the design phase can also facilitate maintenance during the operational stage of facilities [6].
Within the FM industry, 3D spatial data visualization is fundamental as it enhances the presentation of information, improves communication among stakeholders, enables spatial and spatiotemporal analyses not feasible to realize in 2D, and assists decision-making in assets management [7,8,9]. For instance, it can facilitate the analysis of spatial relationships in work orders (for planning maintenance activities) or failure root cause detection (e.g., temperature control issues) [10,11]. With this in mind, an innovative BIM interactive collaboration system for facility management has been newly proposed in [12]. While this system integrates both a data arrangement and presentation module, the authors point out that it still lacks automation and assistance in data visualization. This is especially true for occlusion management, since the high density and complexity of assets to be displayed make the representativeness of features and their spatial relationships more complex, making the use of the 3D model potentially less effective [13,14].
To date, 3D BIM software (such as Autodesk Revit, Graphisoft Constructor, and Bentley Architecture [15]) already provides tools to manage occlusion by the display of a subset of assets, the application of transparency, the wireframe modeling, and/or through multiple viewports. For instance, the reduction of assets lightens the 3D model, while the application of transparency and the wireframe modeling enhance the visibility of assets that spatially interact with each other. Then, the 3D model is usually visualized through a set of default software viewpoints: Top-down, side, and at 45 degrees. While this occlusion-solving procedure significantly reduces the occlusion, it does not guarantee that all of the assets of interest are simultaneously visible, which is the prerequisite for any visual analysis or decision-making.
1.2. Viewpoint Management Algorihtm
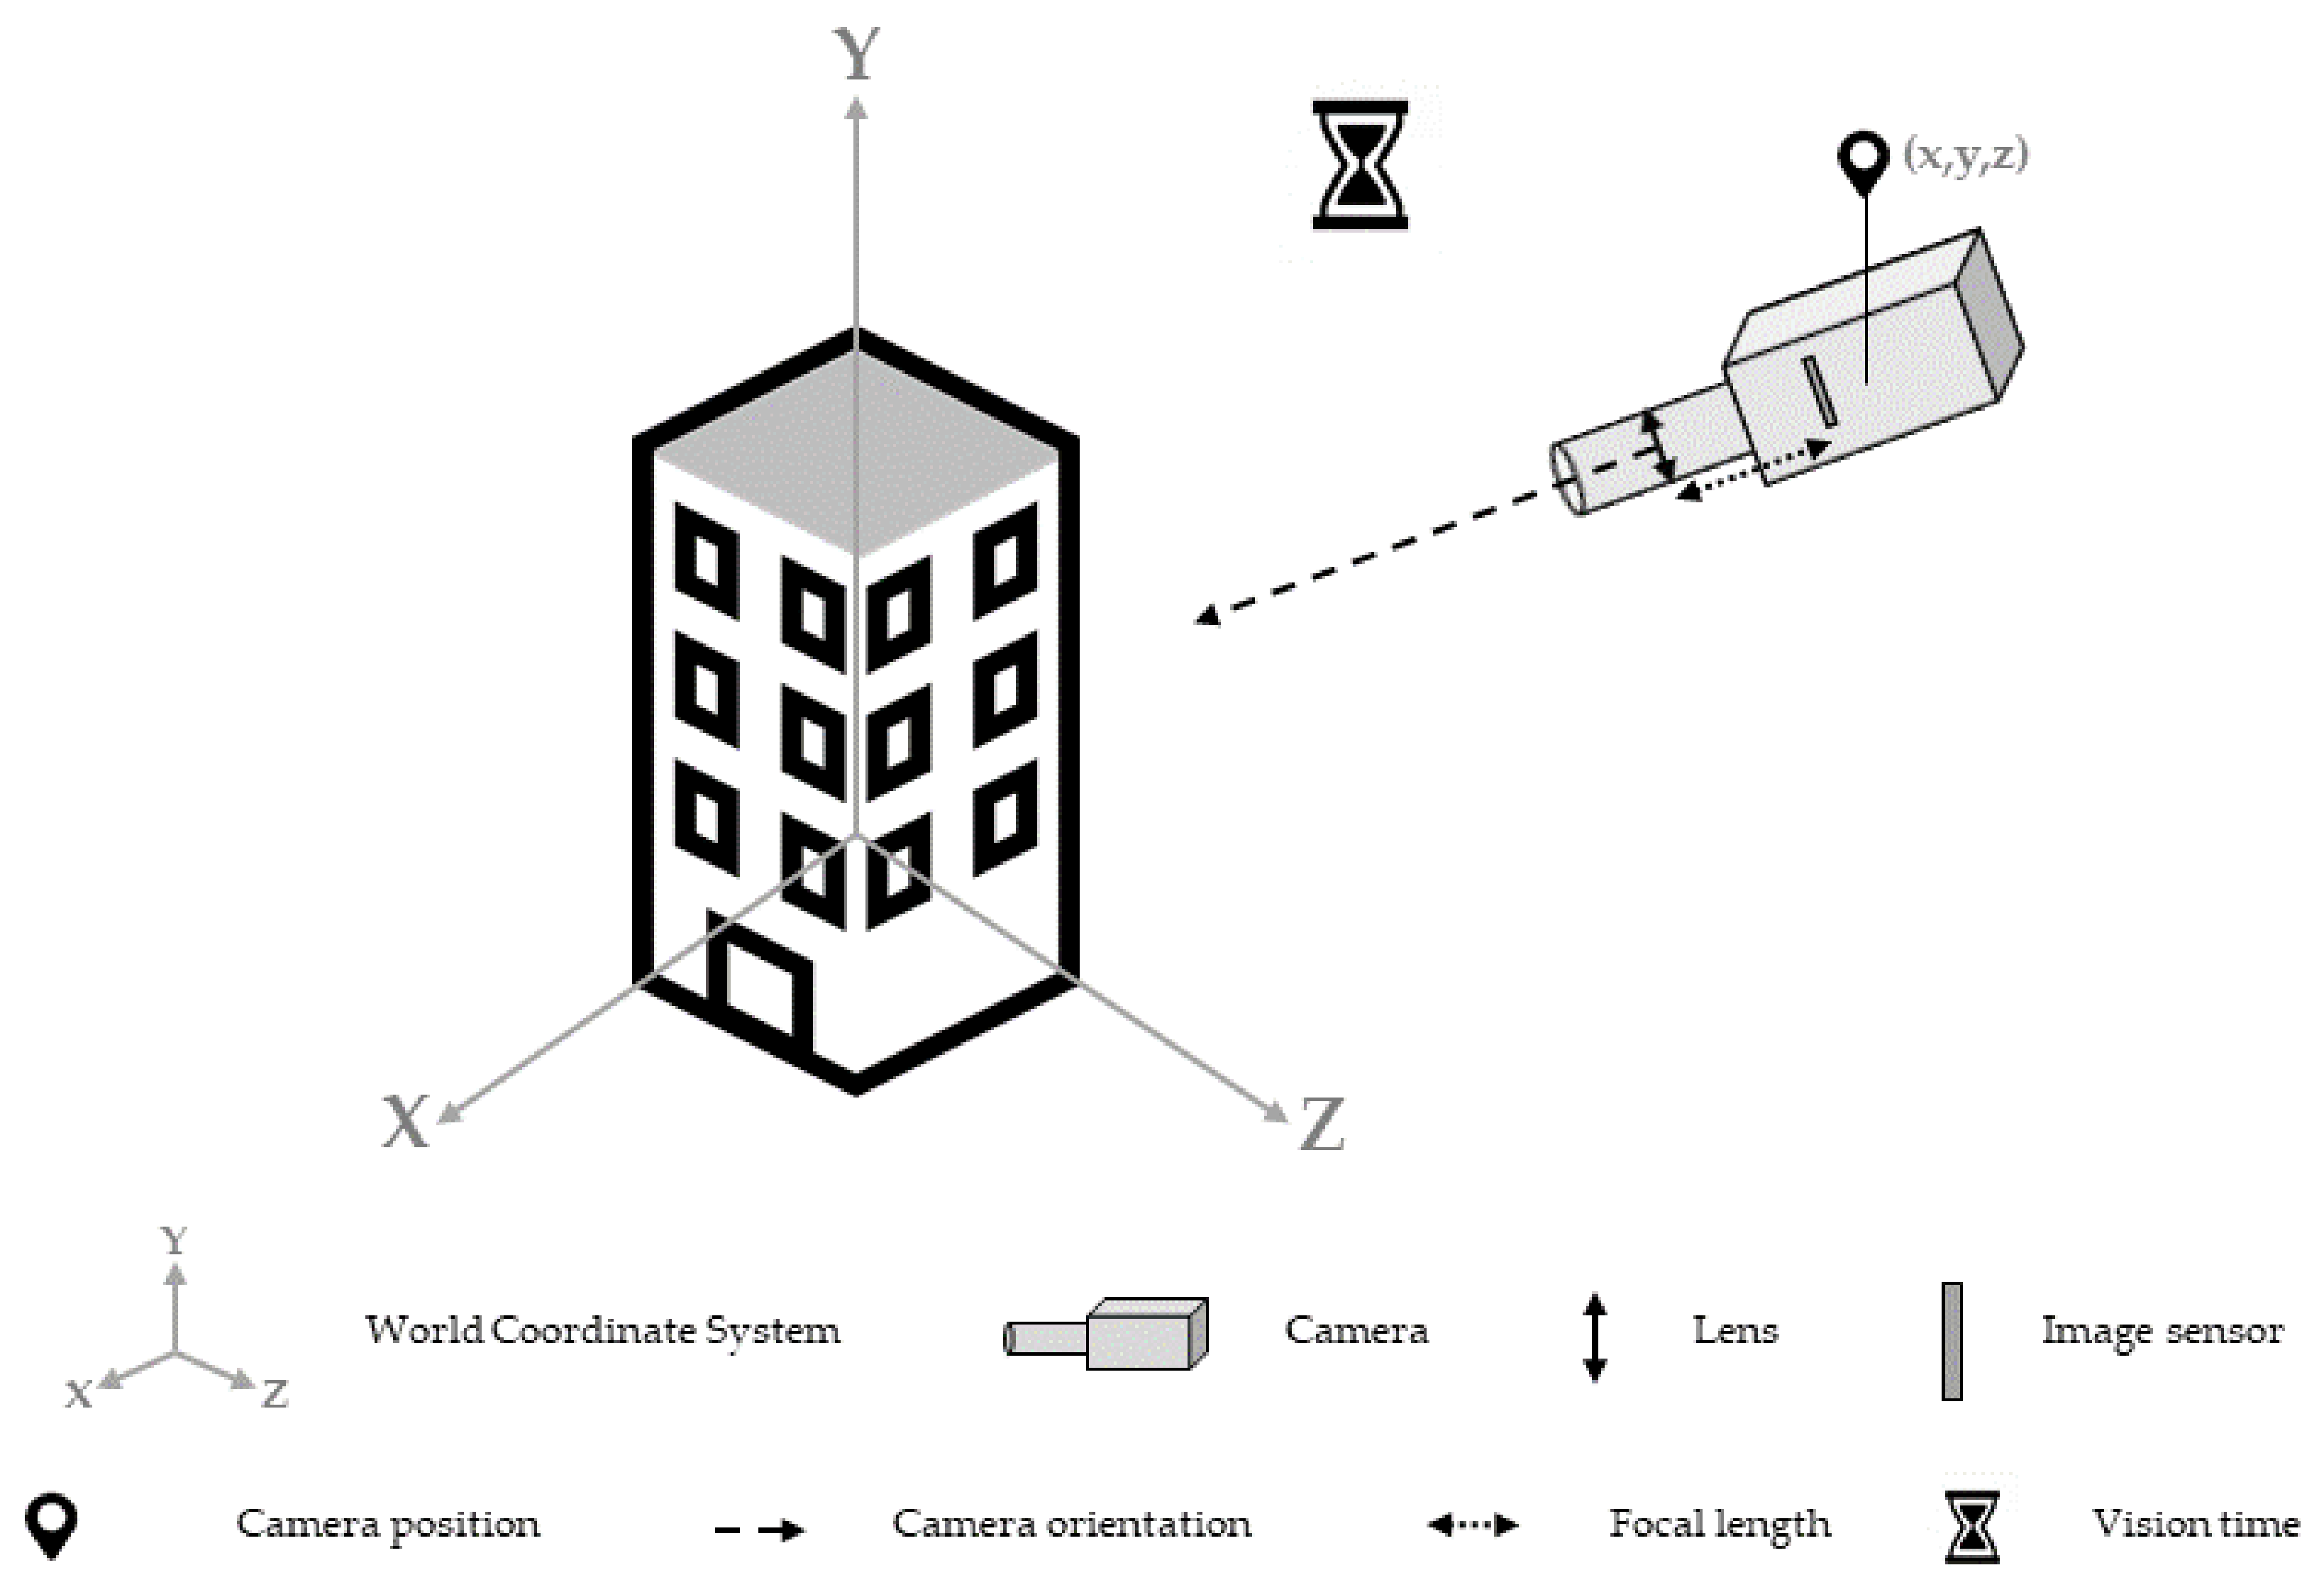
Hence, we have designed and implemented a 3D viewpoint management algorithm in [16,17] which automates and supplies complete visibility of a set of 3D objects (extracted from spatial and/or semantical queries) within a 3D model. As a reminder, visualizing a 3D geometric object, i.e., any object located in a 3D universe (x,y,z) and built from one of the geometric primitives (point, curve, surface, and solid) defined within the spatial schema ISO 19107:2003 [18], requires a virtual camera, which acts as a real camera since it “converts electromagnetic radiation from an object into an image of that object and projects the image onto a surface” [19]. In this research, the 3D geometric object is in three dimensions and the projection surface is plane. Then, a 3D viewpoint of the object can be produced based on the configuration of three parameters [20]: The camera position, orientation, and the focal length. The camera position and orientation are 3D vectors that, respectively, represent a 3D location and a 3D viewing direction into the world coordinate system. The focal length is the distance between the projection center and projection plane, which sets the field of view associated to a camera position and location. In this paper, this parameter is set to infinite as we only deal with parallel projections. Finally, note that, in the case of computer animation combining multiple points of view, a vision time can be given to a 3D viewpoint. Figure 1 illustrates the previous parameters (from [17]).
The specific purpose of the Viewpoint Management Algorithm (VMA) is to provide an automatic 3D viewpoint that completely visualizes a set of 3D geometric objects. Technically, the algorithm computes the most appropriate camera position and orientation that maximize the 3D geometric objects’ view area within the user’s viewport, i.e., the visualization window inside the 2D screen (e.g., desktop computer, laptop, and tablet). To date, the viewport is a visualization window inside a 2D desktop display.
1.3. Case Study and Research Questions
While our algorithm has already been used in archeology for facilitating the knowledge dissemination of an ancient mosaic in France [21], it has not been assessed for achieving visual tasks (e.g., the Bertin’s interpretation tasks of associativity, selectivity, order, and quantitative perceptions [22]) yet, which is the purpose of this article. It aims to validate the algorithm usability within the given context of facility management based on the BIM model, as it might constitute a promising solution to assist assets management. A specific case study has been designed and refers to a selectivity visual task, which is defined according to Bertin [22] as the capacity to visually extract all 3D geometric objects belonging to a given category, and to perceive the image produced by this category. We specifically use color (hue) as the visual variable as it has been shown that it is one of the most promising solutions for supplying a selectivity task [23,24].
In this article, the visual task consists in visually counting bad condition assets within a 3D building model. The proposed case study extends another one presented in [10] where 3D visualization is used to identify potential causes of too-high-temperature incidents in a building. In this case study, 3D visualization aims to assist the company in charge of building safety, in particular in the assessment of an ongoing too-hot incident and the most appropriate response to emergency services. We hypothesize that there exists at least one optimal 3D viewpoint for visualizing a set of 3D geometric objects and that this point of view is a function of the objects’ view area inside the viewport.
Then, we aim to confirm or reject the suitability of this 3D point of view for visual counting of a set of objects within a virtual 3D building model, which is carried out with the use of the usability criterion. Indeed, usability is the most common variable for user-centered evaluation studies [25], and it has already been discussed and employed in the visualization of 3D building models, especially in the 3D cadastre field [26,27]. Recently, this criterion has even been considered in the evaluation of transparency for delimitating property units with their physical counterparts [28]. According to the ISO 9241-11, usability refers to the “extent to which a system, product or service can be used by specific users to achieve specified goals with effectiveness, efficiency, and satisfaction in a specified context of use”. Within the literature, there exists multiple interpretations linked to these three criteria (effectiveness, efficiency, and satisfaction). In this paper, we refer to the definitions proposed in [29]:
- Effectiveness, i.e., how well users accomplish their objectives with the system;
- Efficiency, i.e., the resources used to accomplish the objectives;
- Satisfaction, i.e., users’ feelings about the use of the system.
In this paper, only two quality conditions have been considered: Effectiveness and Satisfaction. Effectiveness is measured by three distinct indicators: The success rate in performing the visual counting, the accuracy with which the visual counting is executed, and the amount of time required to visually detect one 3D geometric object on the condition that the visual counting has been accomplished with success. Finally, satisfaction is measured by the participants’ certainty in achieving the visual task. Note that the participant’s certitude has been preferred to his/her satisfaction for a more visual task-centric appreciation, similar to [28]. To sum up, four quality indicators are considered:
- The success rate in performing the visual task;
- The accuracy with which the visual task is executed;
- The certainty degree with which the user undertakes the visual task;
- The speed in carrying out the visual task.
Ultimately, the usability of the 3D viewpoint maximizing the 3D geometric objects’ view area inside the viewport is also assessed according to the user’s attributes, i.e., his/her background training, his/her decision-making level and his/her experience in 3D visualization.
1.4. Software Architecture
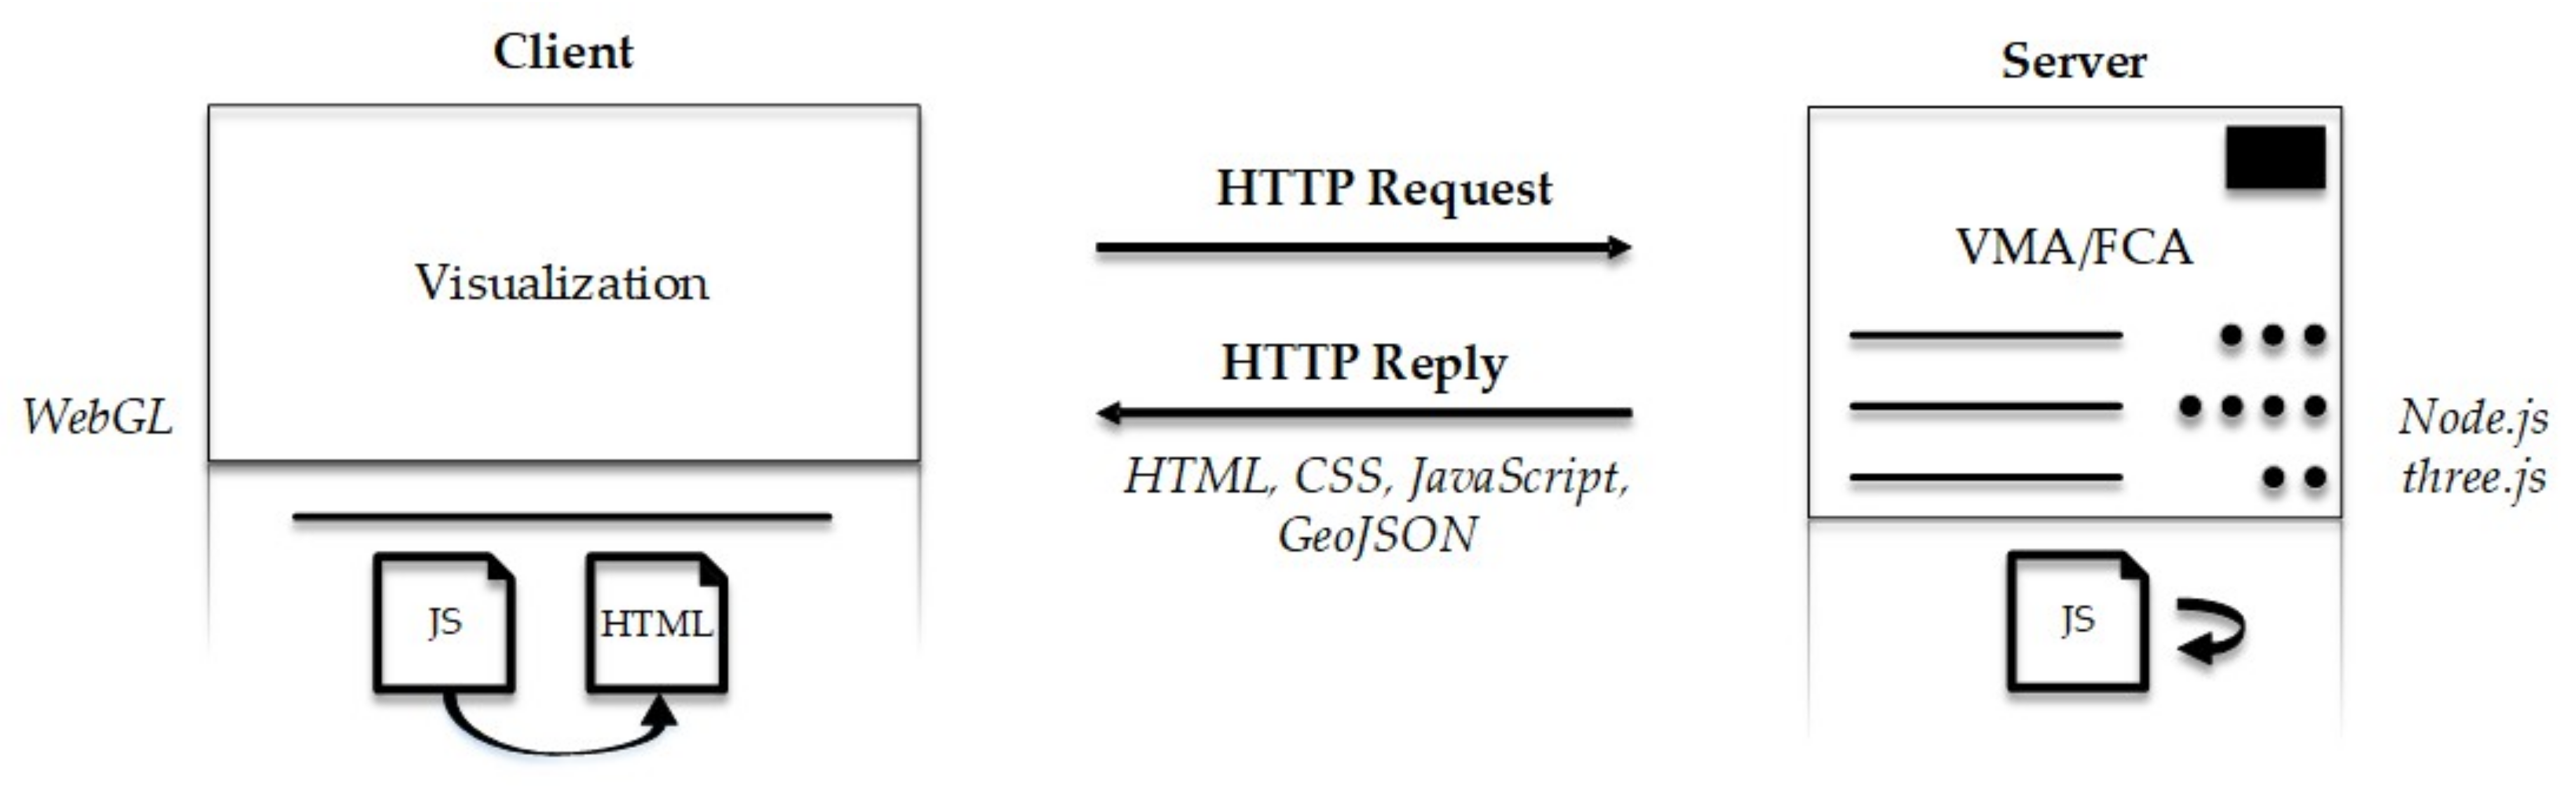
Whilst initially developed into a client-side application, we propose in this paper the first VMA implementation within a complete RESTful web application with the visualization and processing stages divided between the client and the server. This has been made possible by the use of Node.js, a Javascript runtime (built on Chrome’s V8 Javascript engine) that offers a Javascript environment server-side. As seen in Figure 2, the 3D spatial data visualization is performed on any HTML5-compatible browser through the WebGL API, while the best 3D viewpoint computation is supplied remotely by the server. Contrary to a client-side application, this architecture better addresses the end-users’ needs as it does not require powerful visualization tools in terms of computer memories and high-end graphics boards. Moreover, the application tends to be more seamless.
Technically, the client connects to the website of the application, from which he/she can upload a 3D model. Then, he/she is able to filter, map, and render the spatial data as a function of the semantic information that he/she intends to display. Once the latter has been carried out, the client sends the 3D model with its mapping and rendering aspects to the server via the WebSocket API. After that, the server recreates a partial copy of the 3D model based on the client’s visual configuration. The geometric objects of the 3D scene are then divided into two categories: The objects of interest (i.e., the subjects of the study) and the visualization context objects (i.e., the additional surrounding features). The data are then processed and the server sends the results to the client, i.e., two sets of three-dimensional coordinates, which optimally locate and orientate the camera in the 3D scene in order to maximize the visibility of the objects of interest within the viewport.
2. Experimentation design
2.1. Empirical Approach
As it has been reported that the data visualization field requires empirical evidence to support its development [30], an empirical approach is employed in this paper to answer the research questions. Moreover, this scientific method also constitutes the cornerstone of user-centered design in software development [31].
Technically, the empirical study was carried out in the form of interviews with the use of an online questionnaire, which has the advantages of simultaneously dealing with a larger number of participants and automating the data recording. Within this questionnaire, participants have to answer a set of twelve independent tests that always provide the same questions and potential answers. Note that the visualization techniques applied to the 3D model are kept constant throughout the questionnaire, which means that the 3D viewpoint and the set of selected assets are the only parameters that change over time.
We specifically invited several groups of experts to participate in the survey and complementary information was provided to improve the visual task understanding. Whilst this strategy is more restrictive than a real online questionnaire released on the web in terms of participant numbers [32], it guarantees a better comprehension of the task to be undertaken and therefore more reliable results (even with a smaller sample size). Indeed, it has been shown that only five participants already detect 80% of usability issues [33].
2.2. 3D Building Model
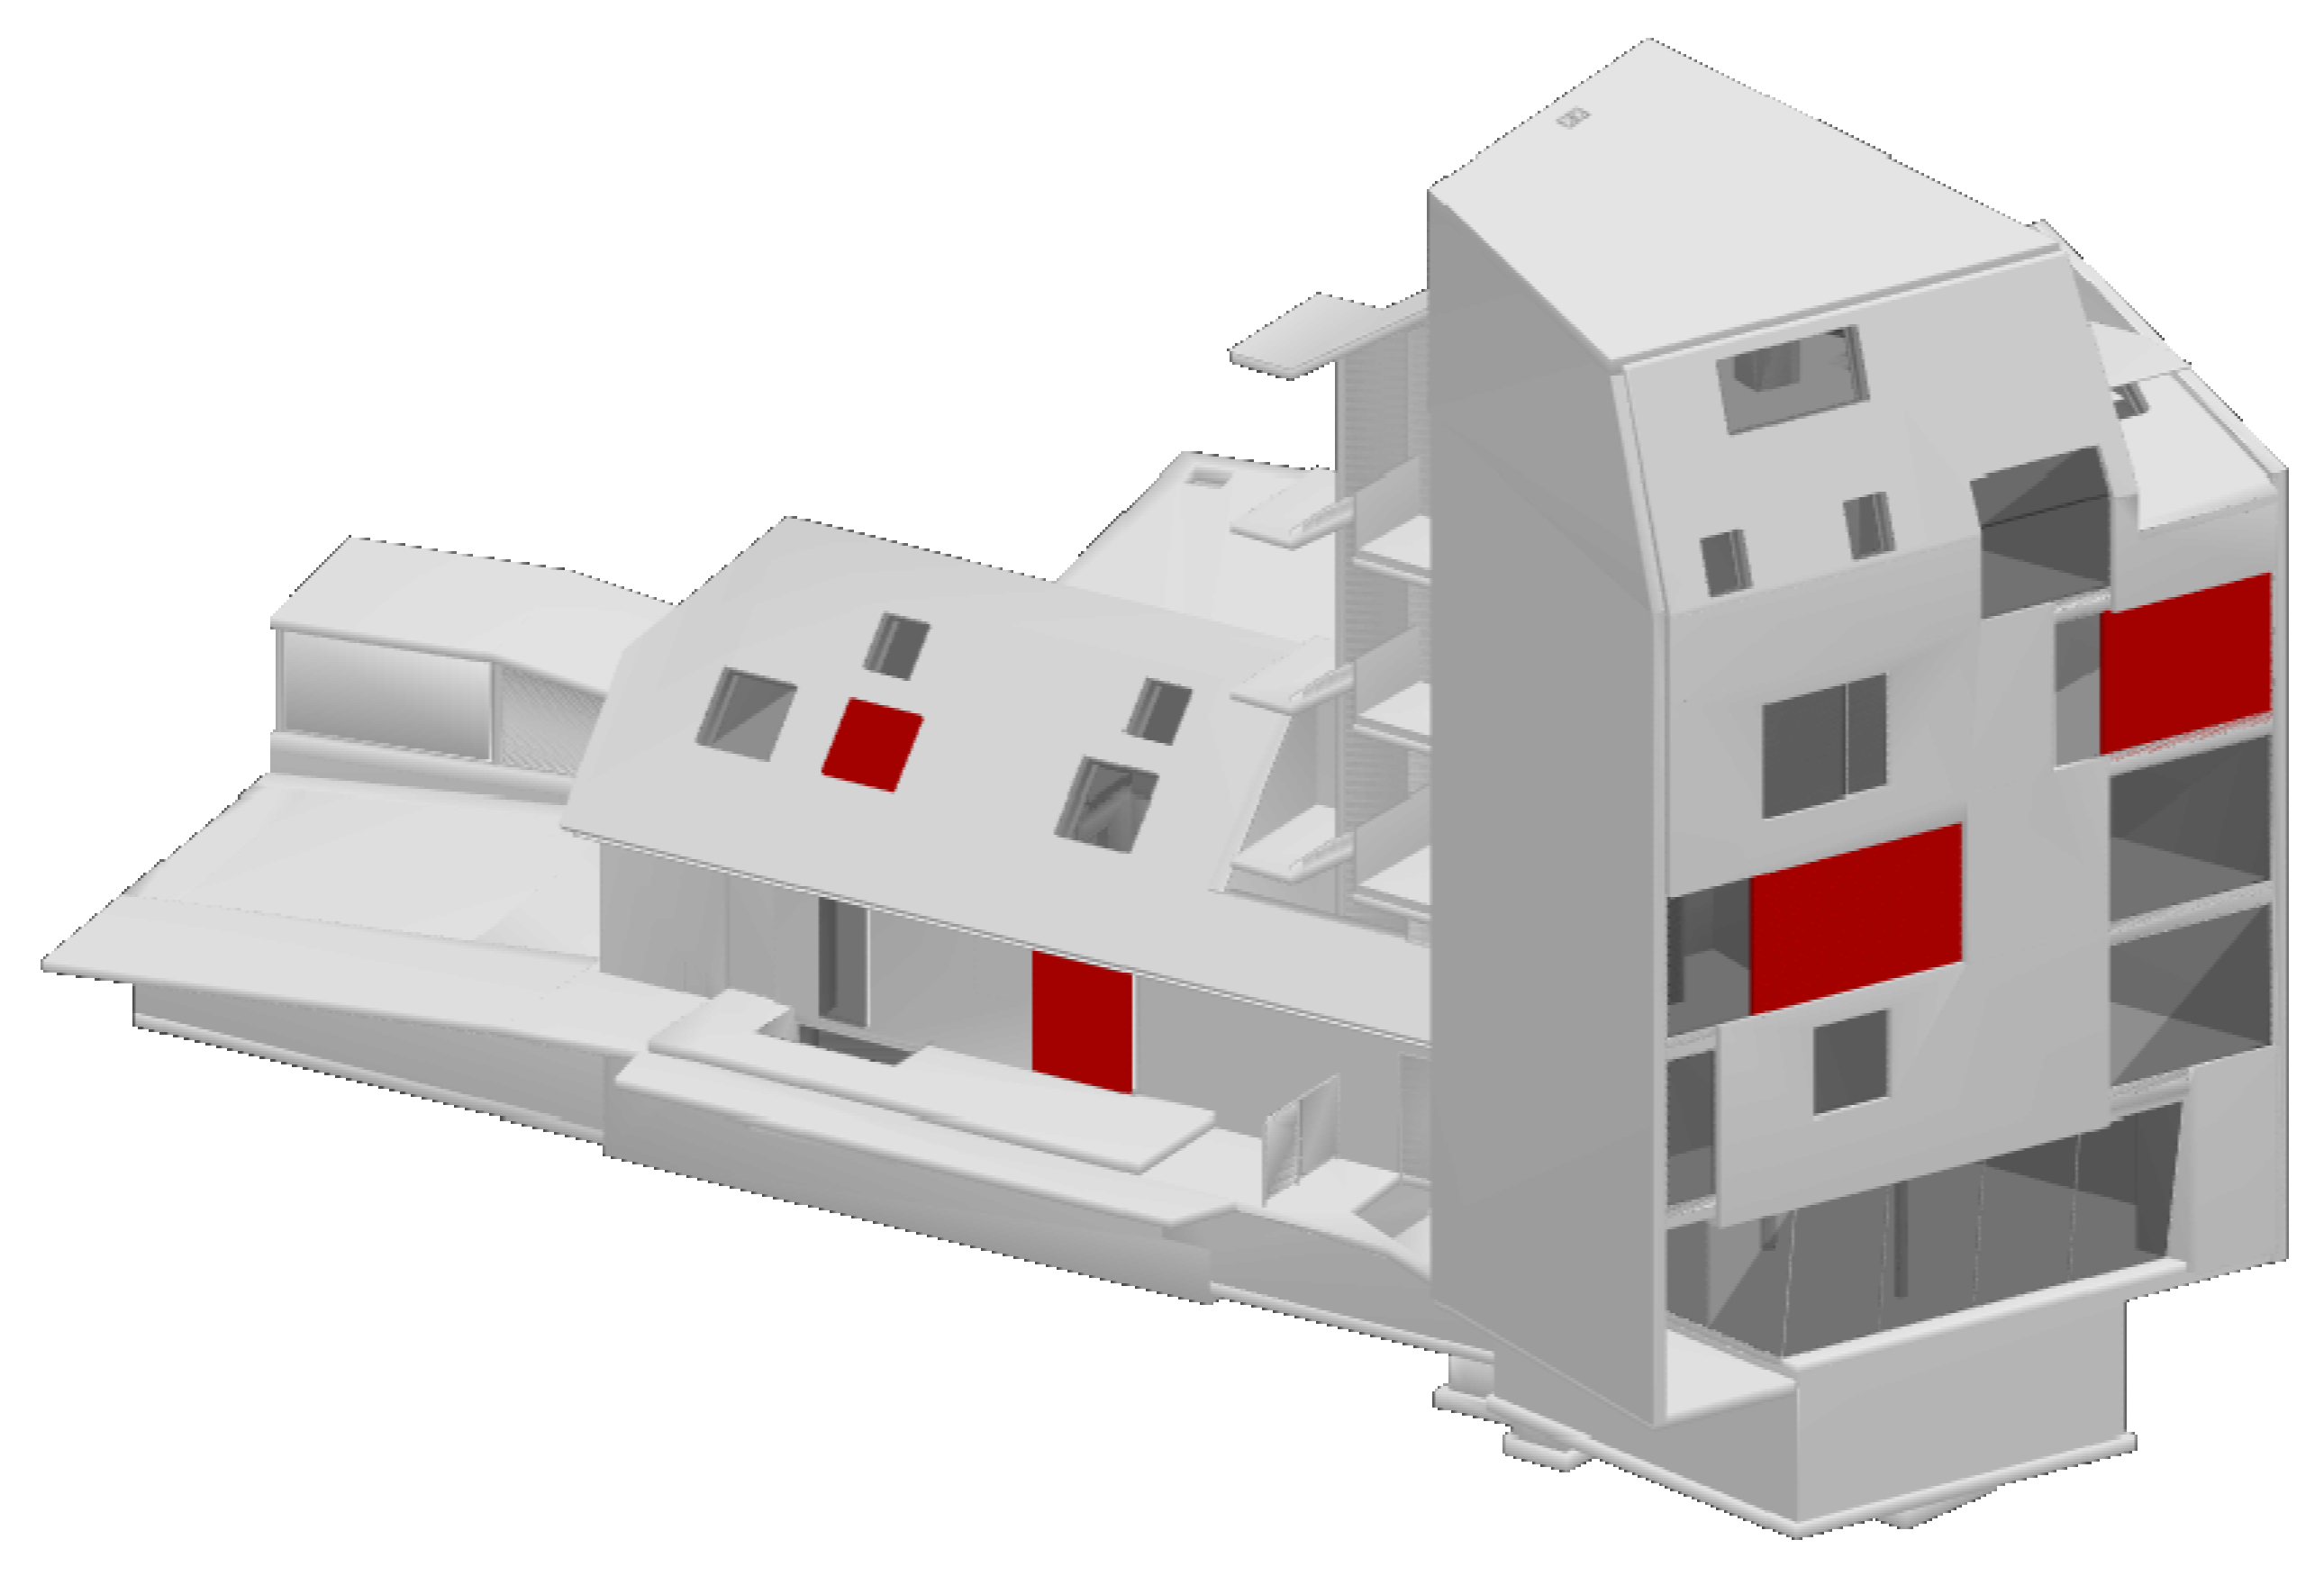
The case study was carried out on an existing architectural and mechanical, electrical and plumbing (MEP) project provided by Autodesk Revit from which a non-textured black and white 3D model was extracted. Then, we hypothesized that a computer maintenance management system (CMMS) was integrated to the BIM model, which enabled a constant asset condition update through multiple sensors located inside the building, similar to [10]. Figure 3 illustrates the 3D building model and shows some windows in red as an example of visual detection of rooms with an internal too-high temperature. Only a small set of assets from the initial BIM model was kept in order to enhance the overall visibility of the 3D model. Furthermore, the black and white appearance enables a better visual contrast between the highlighted windows and the surrounding environment. Transparency was then applied to all windows to improve the realism of the model and consequently its visual understanding. Ultimately, the lighting of the 3D model consists of a global ambient light and a directional light emitted from the camera location in the direction of the 3D model, which specifically enhances the lighting in the viewing direction of highlighted windows. Note that a shading effect is also produced as it assists in revealing the objects’ shape.
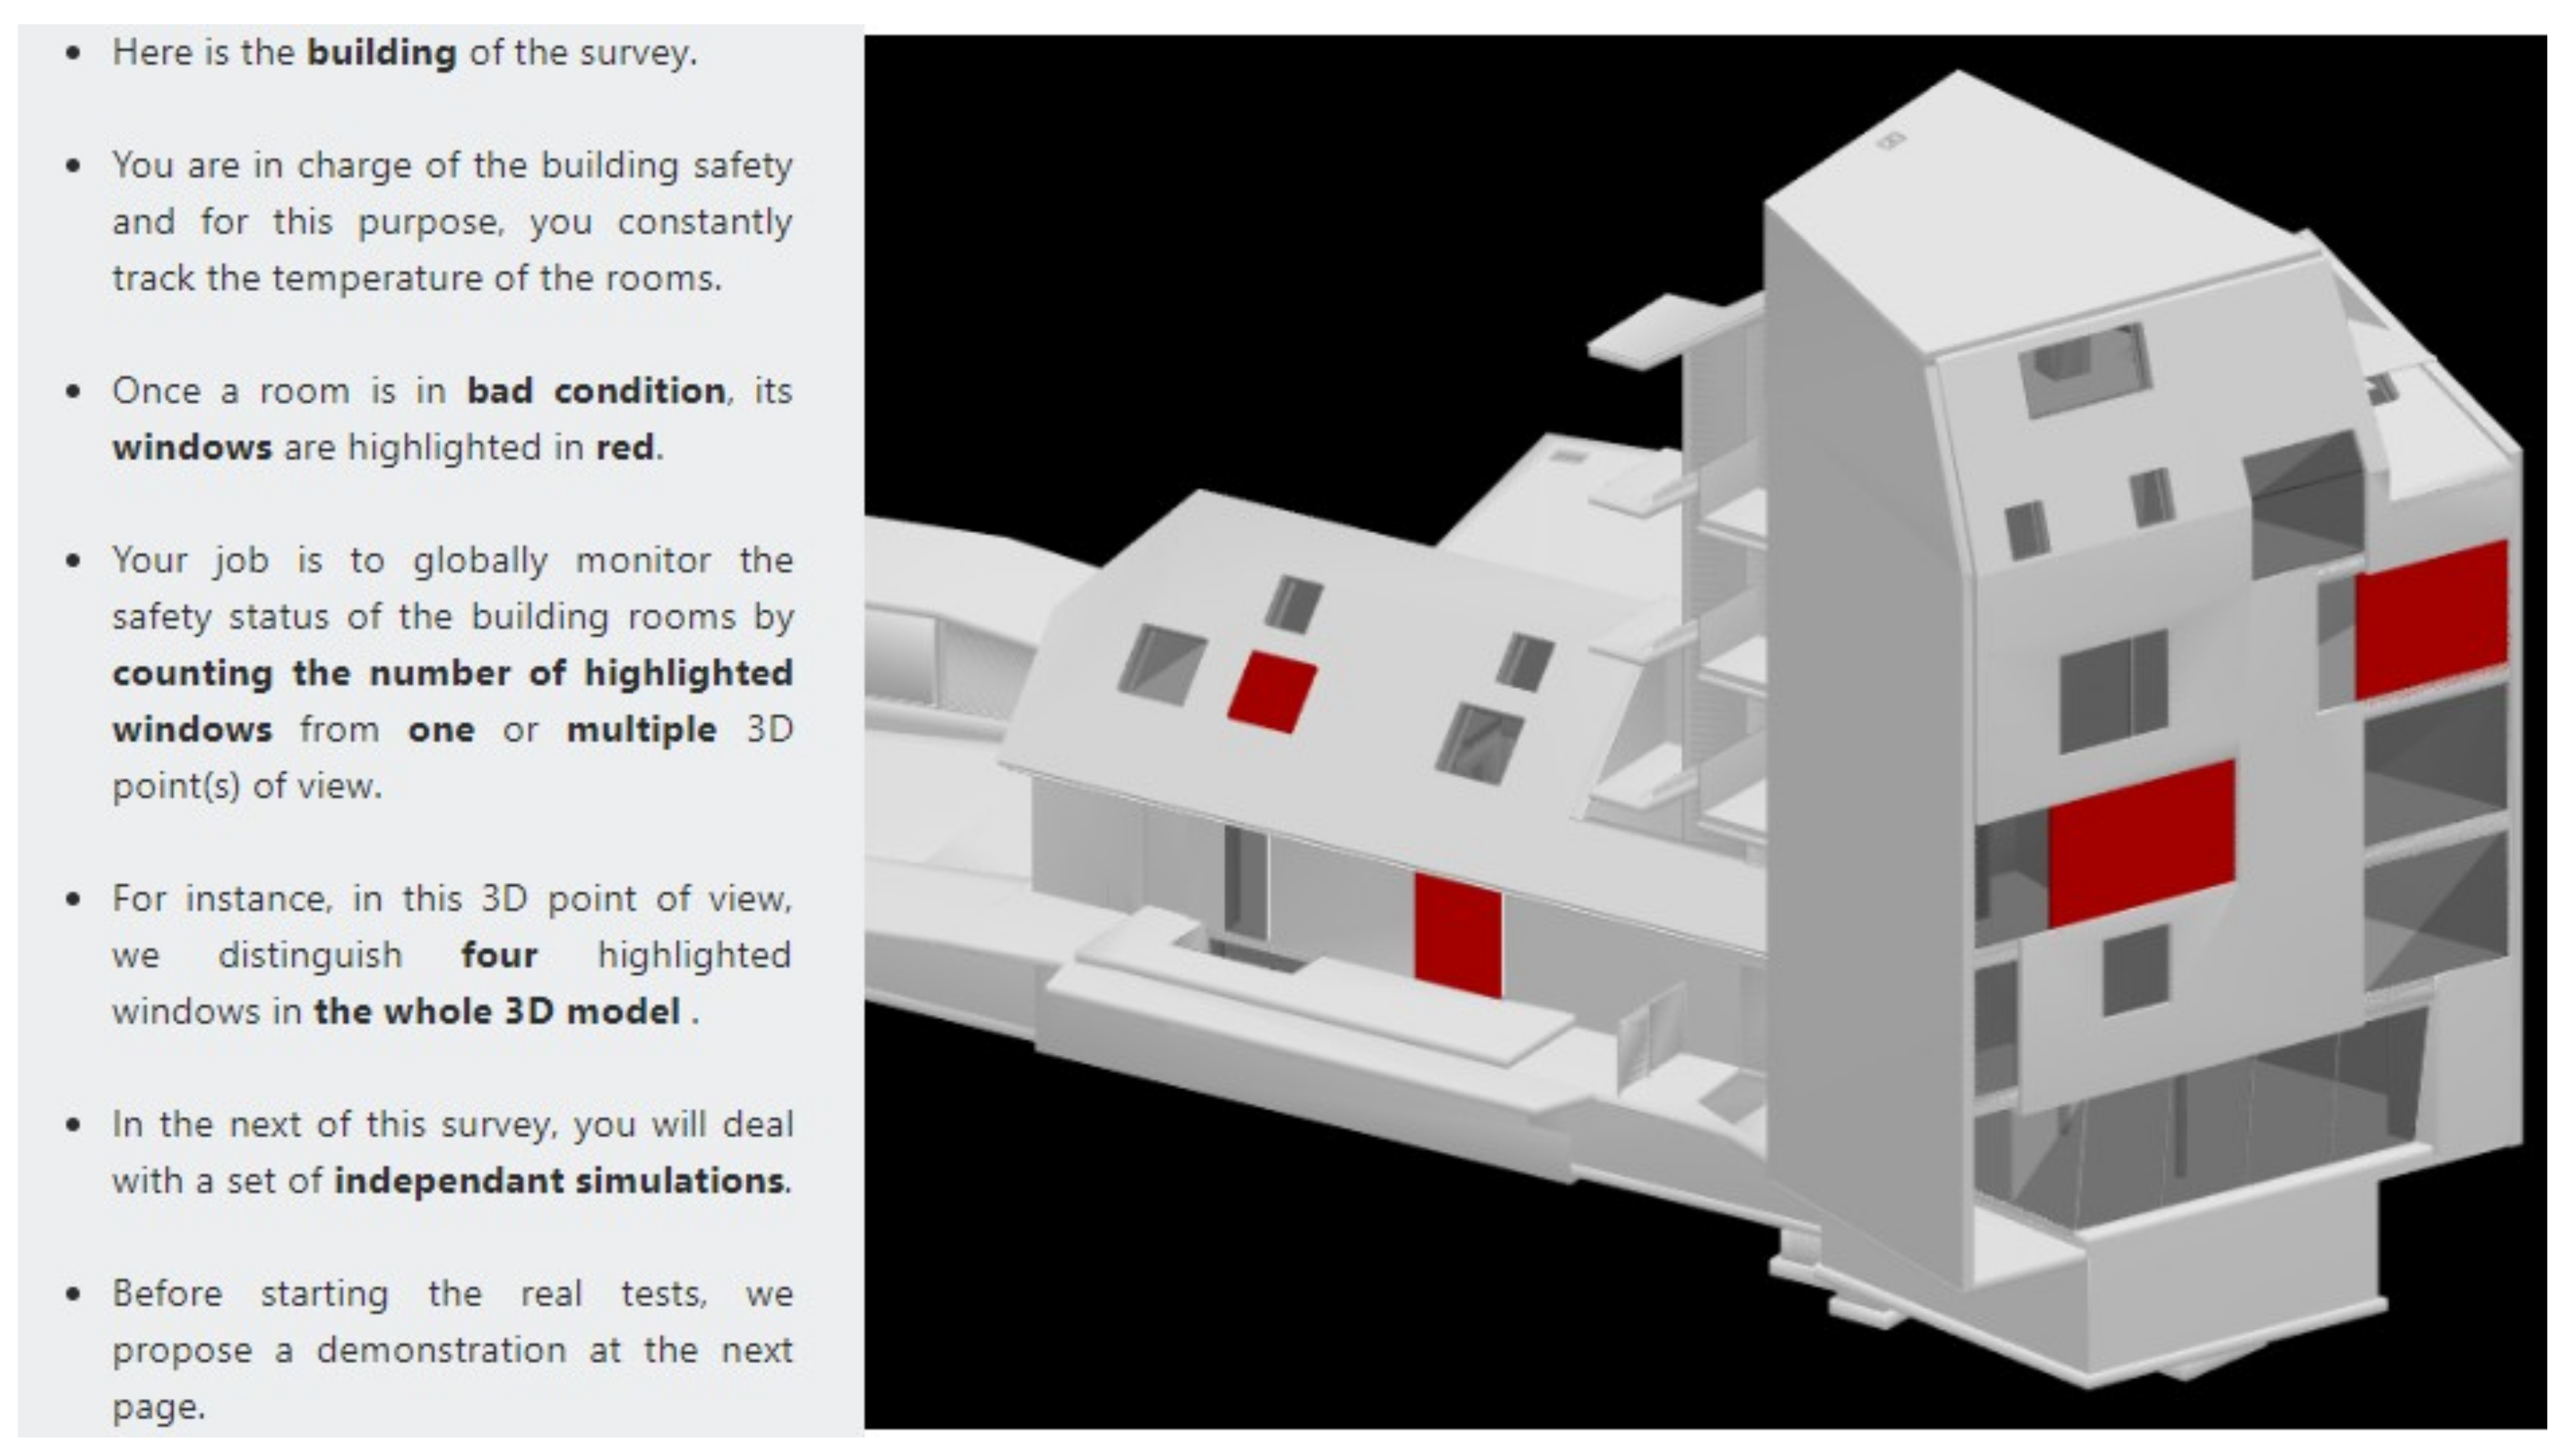
Then, the case study consisted for the participant in visually counting the number of highlighted windows within the 3D model from one or multiple 3D viewpoints. Twelve fictive internal too-high temperature incidents were created and were either visualized from:
- The traditional four side points of view (4 simulations out of 12);
- A single side point of view, i.e., either from a front, back, left, or right viewpoint (4 simulations out of 12);
- Or a point of view that maximizes the visibility of 3D geometric objects’ view area inside the viewport, and is provided by the viewpoint management algorithm (4 simulations of out 12).
Note that the simulations are independent of each other, which means that there is no correlation between the tests; all configurations are possible and might partially reappear. As a result, the carryover effect is avoided. Furthermore, the overall complexity linked to the visual counting achievement is kept as constant as possible among the three sorts of point of view. Indeed, the four simulations linked to each kind of viewpoint include the visual counting of either four, five, six, or seven highlighted windows.
2.3. Online Questionaire
The online questionnaire has been built as a website designed with Bootstrap, an open-source front-end framework. It incorporates a MySQL server for storing the participants’ profile and their responses. The questionnaire contains three main sections:
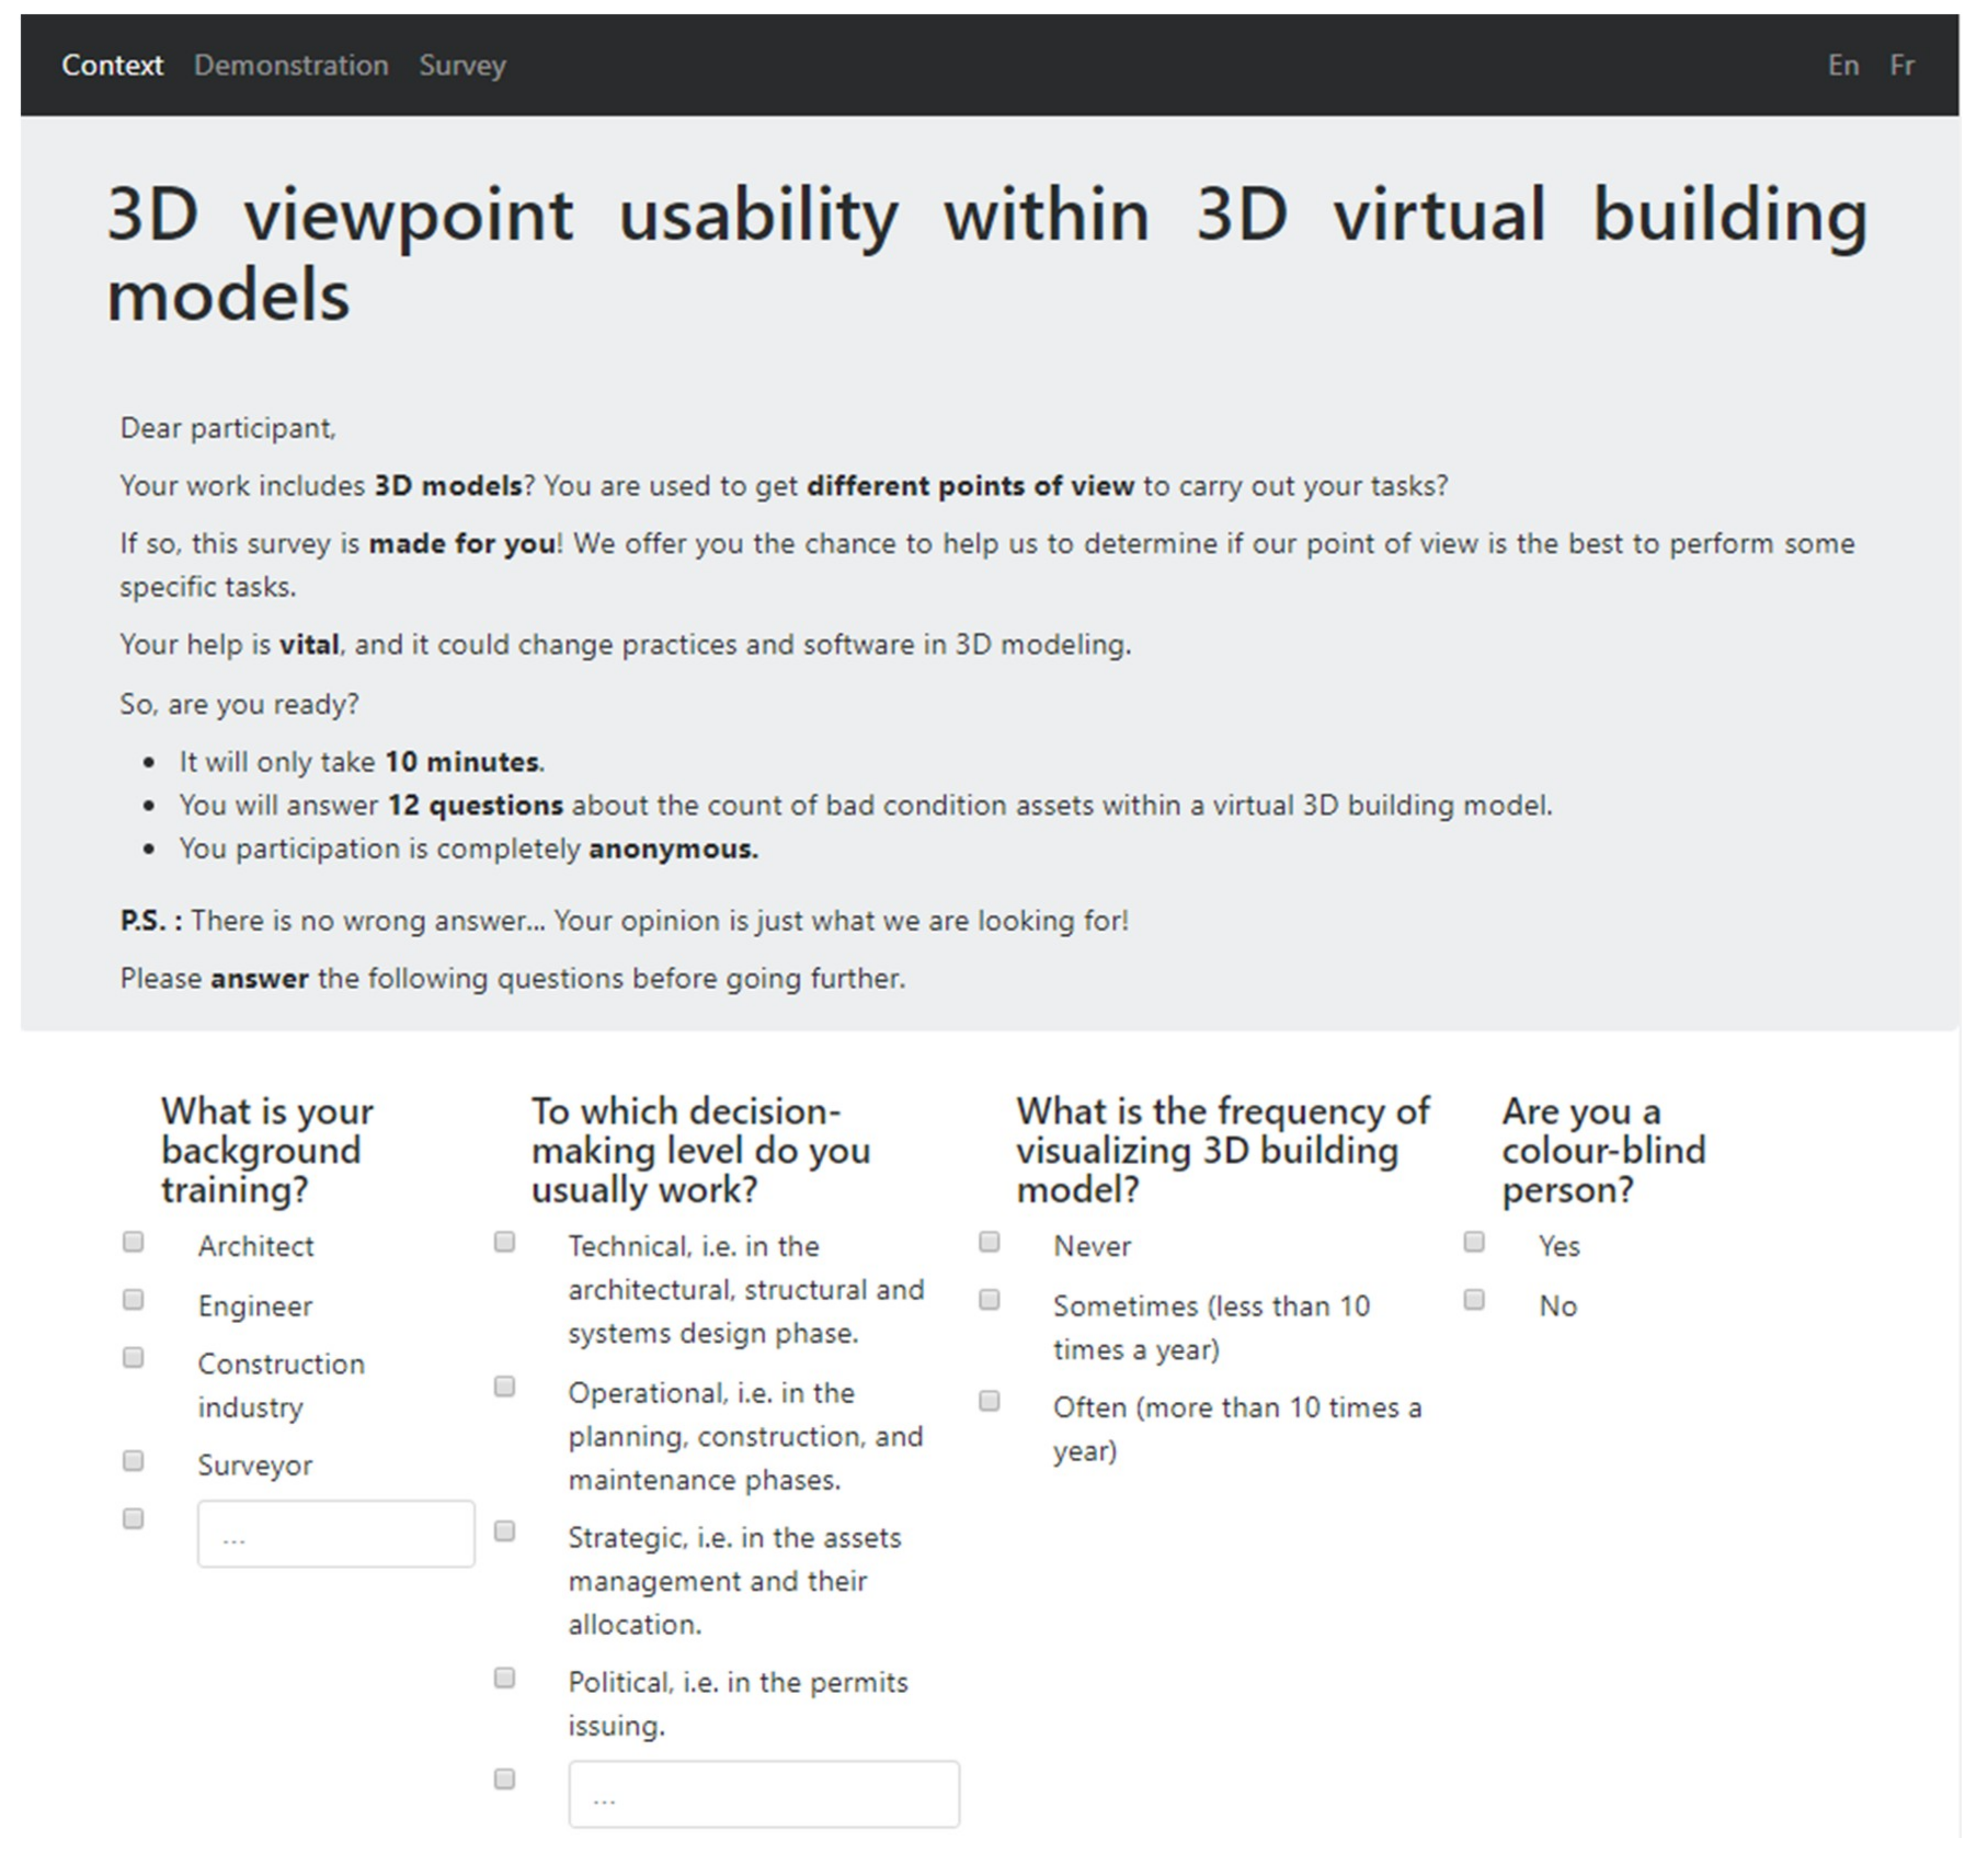
- The first section is related to the participant’s attributes. For this purpose, the participant must answer four questions linked to: His/her training background, the decision level to which he/she usually works, his/her frequency of visualizing 3D building models, his/her potential color perception deficiency.
- The second section presents the 3D building model of the survey, sets the context of the case study, and proposes a demonstration test from which the participant gets acquainted with the questions and the procedure for answering.
- The third section is the survey. The participant must answer twelve questions related to fictive too-high temperature incidents occurring inside the building. As a reminder, three kinds of viewpoint are provided: The traditional four side points of view, a single point of view, and the point of view provided by the viewpoint management algorithm.
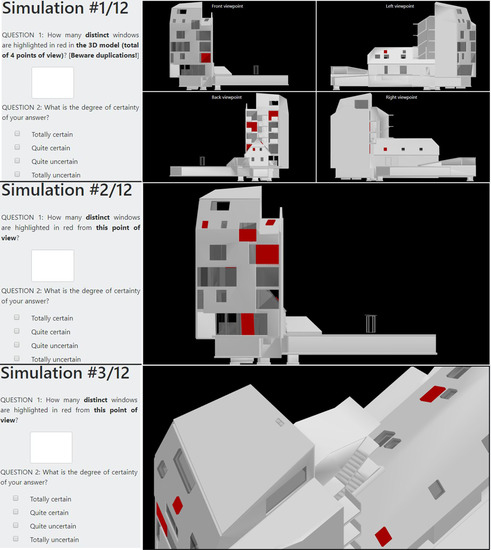
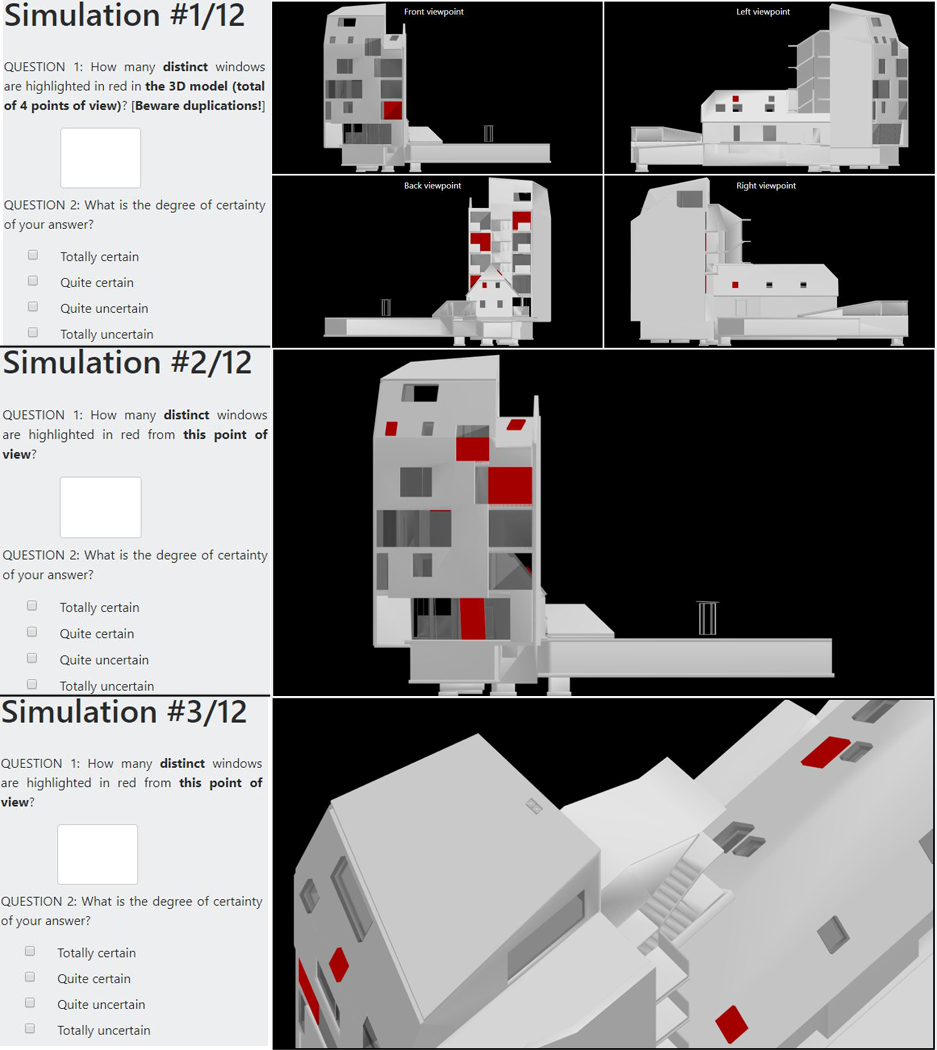
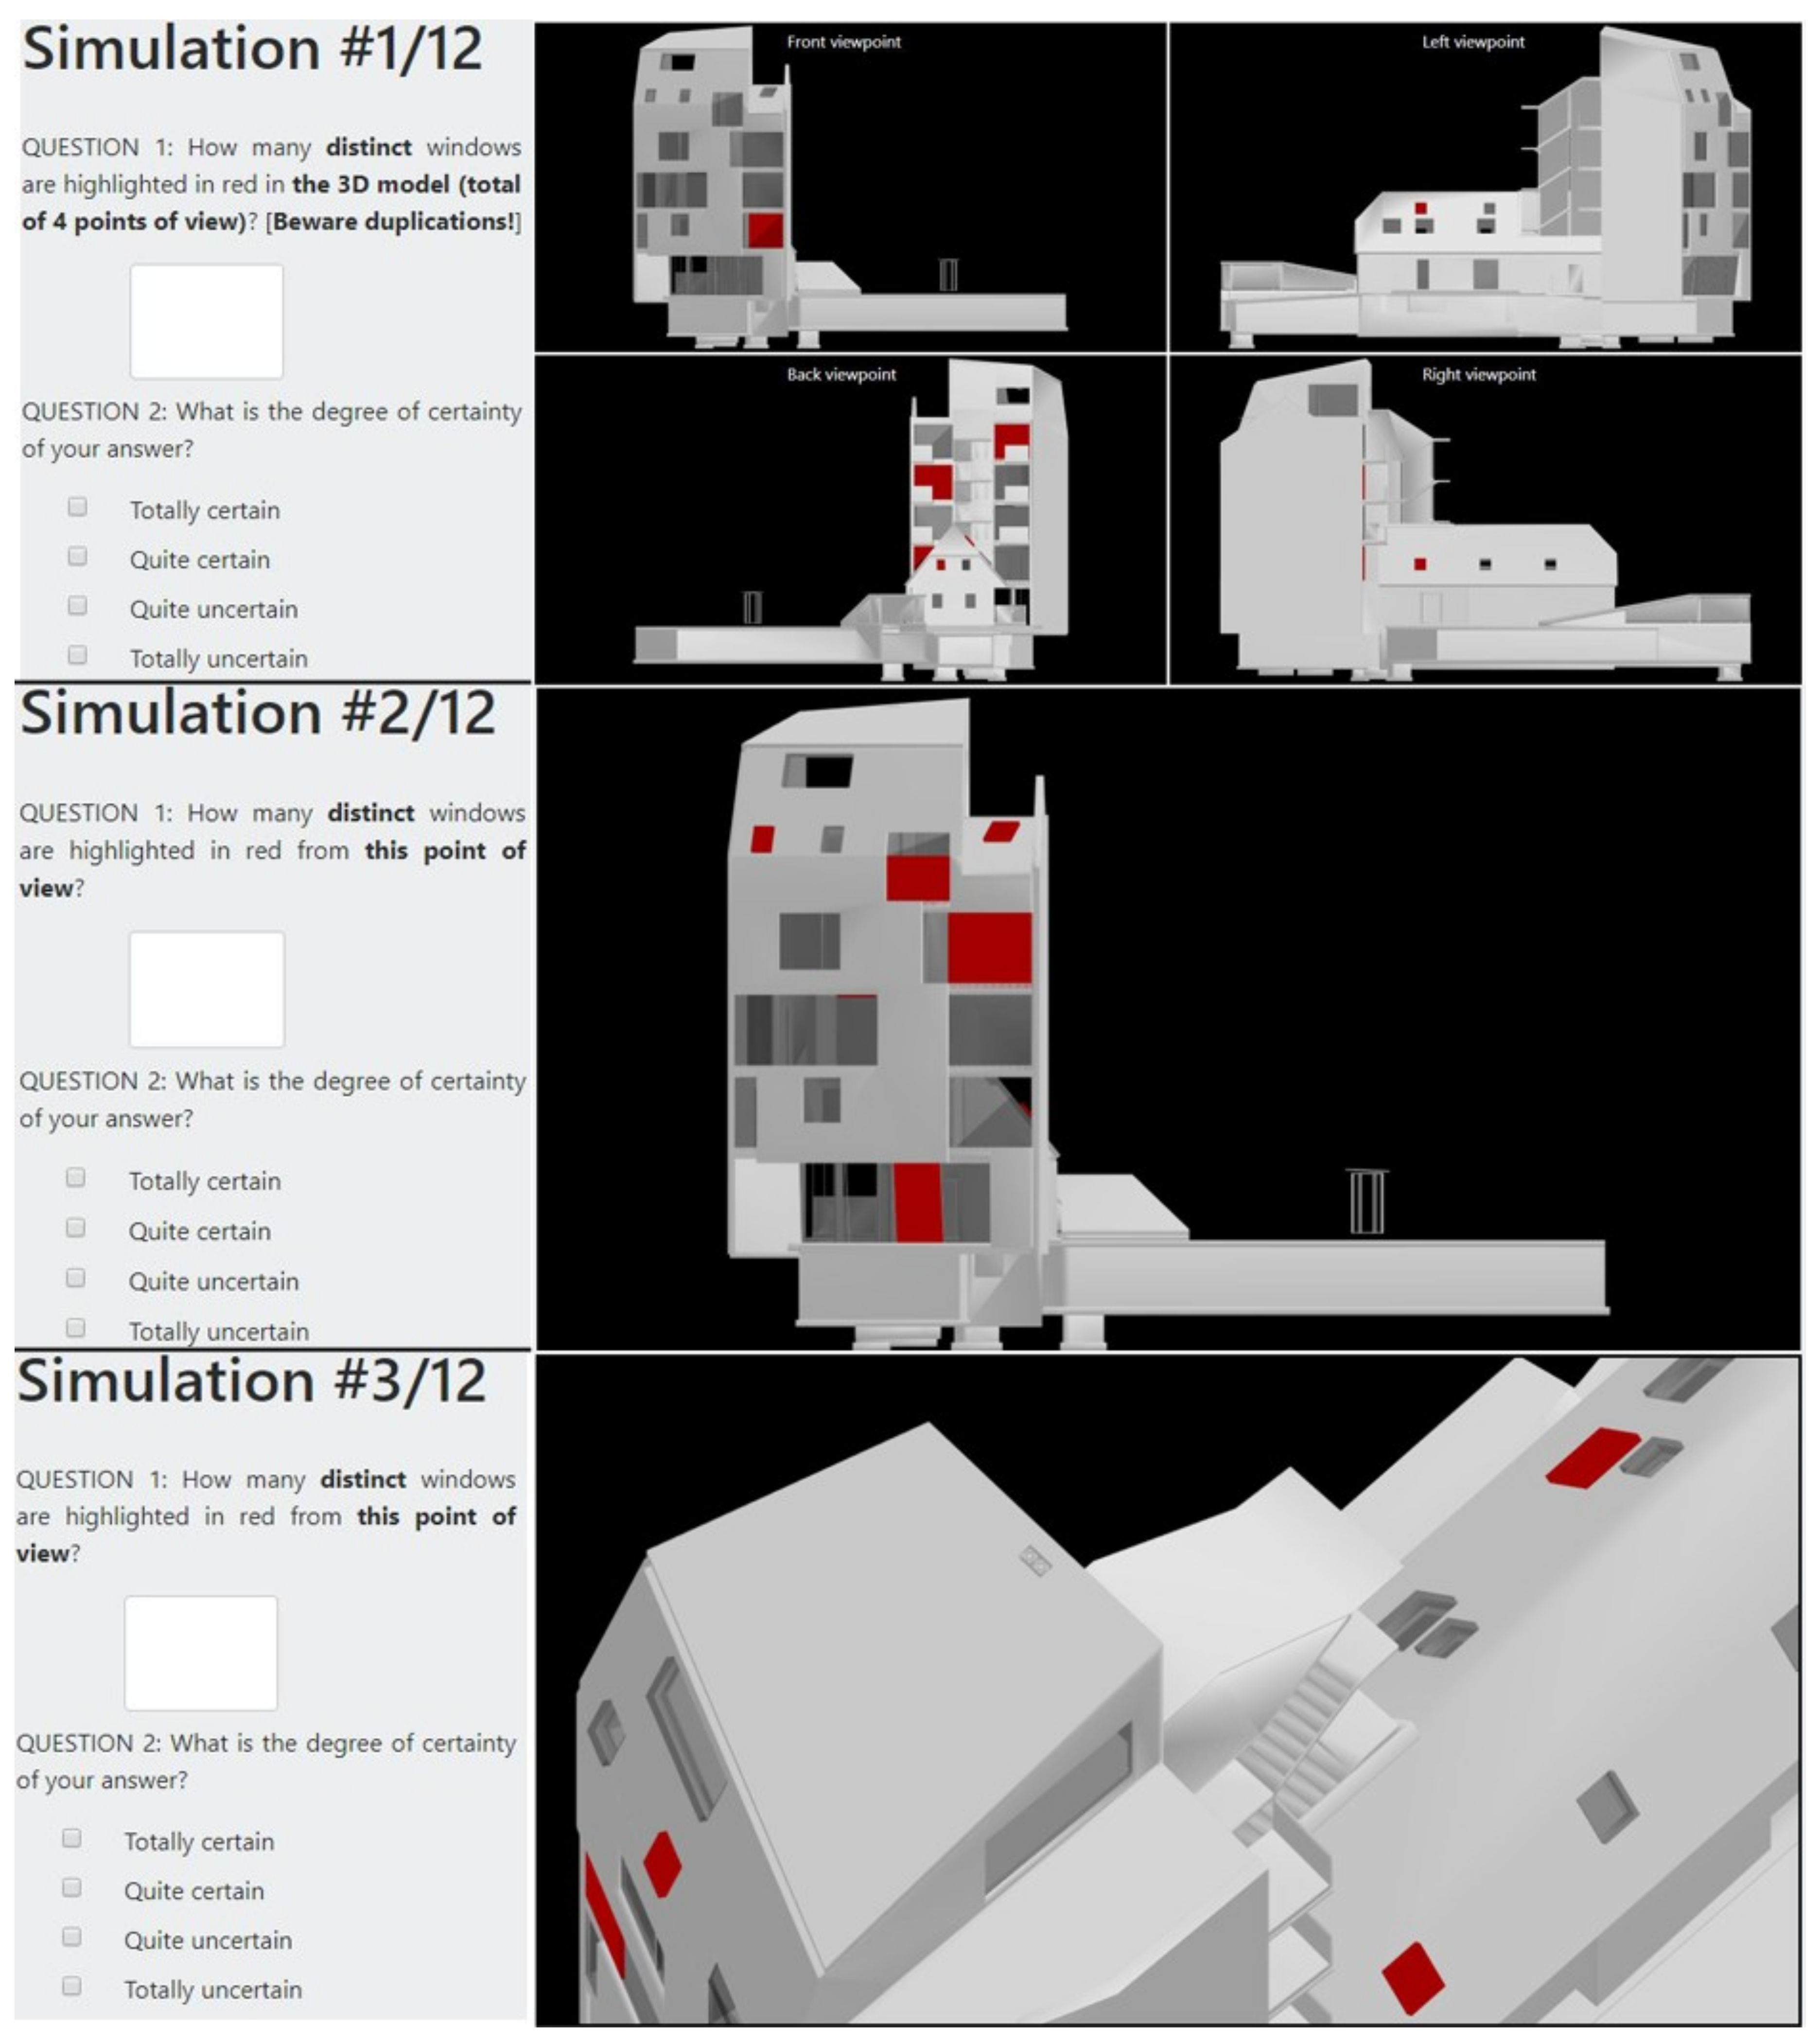
Figure 4 illustrates the first section of the questionnaire with the four questions related to the participant’s profile. Figure 5 shows the contextual setting of the survey and Figure 6 displays the first three simulations of the survey. As shown in Figure 6, the participant must answer two questions for each simulation:
- Question 1: How many distinct windows are highlighted in red in the 3D model?
- Question 2: What is the degree of certainty of your answer? Possible options: Totally certain, quite certain, quite uncertain, and totally uncertain.
The first question aims to measure the effectiveness parameter, i.e., the participant’s ability to visually count the number of bad condition assets within the 3D model correctly. The purpose of the second question is to measure the satisfaction linked to the visual counting task, i.e., the certainty with which the participant answers the first question. Then, the response time to complete the task is also stored as a measurement of the effectiveness criterion. Note that the timer is not activated for the traditional four side points of view. Indeed, the analysis of four images inevitably entails a longer response time compared to a single point of view. Finally, since the number of objects to be visually detected impacts the overall response time, the latter is reduced to a visual counting time per object in the statistical analysis.
3. Results
3.1. Participants’ Profile
Accessible through a consistent URL (3dviewpoint-survey.uliege.be), the website was visited by 48 participants from May to July 2019. Among these participants, six suffered from color perception deficiency and six did not fully complete the questionnaire. The statistical analysis was thus performed on a set of 36 participants with the following characteristics:
- Background training: 13 surveyors, 13 engineers, nine architects, and one expert from the industry construction.
- Decision-making level: Most of the participants (27 out of 36) usually work at the technical level (i.e., in the architectural, structural, or systems design phases); six work at the operational level (i.e., in the planning, construction, or maintenance phases); and three participants work at the strategic level (i.e., in the assets management and their allocation).
- 3D visualization experience: More than half of the participants (29 out of 36) were used to visualizing 3D building models: 21 on a regular basis (i.e., more than ten times a year) and 8 more sporadically (i.e., less than ten time a year). Note that only seven participants had never visualized 3D building models before the experiment.
3.2. Statistical Analysis: Overview
The statistical analysis was carried out with the software environment R. Four distinct statistical methods were applied to answer the five research questions: The exact binomial test, the Student’s test, the Anova (one-way), and the Chi-2 test. They are summarized in Table 1 and discussed in more detail in the next sections.
3.3. Is a 3D Viewpoint Based on the Maximization of 3D Geometric Objects’ View Area More Successful for Visual Counting of a Set of Objects Within a Virtual 3D Building Model?
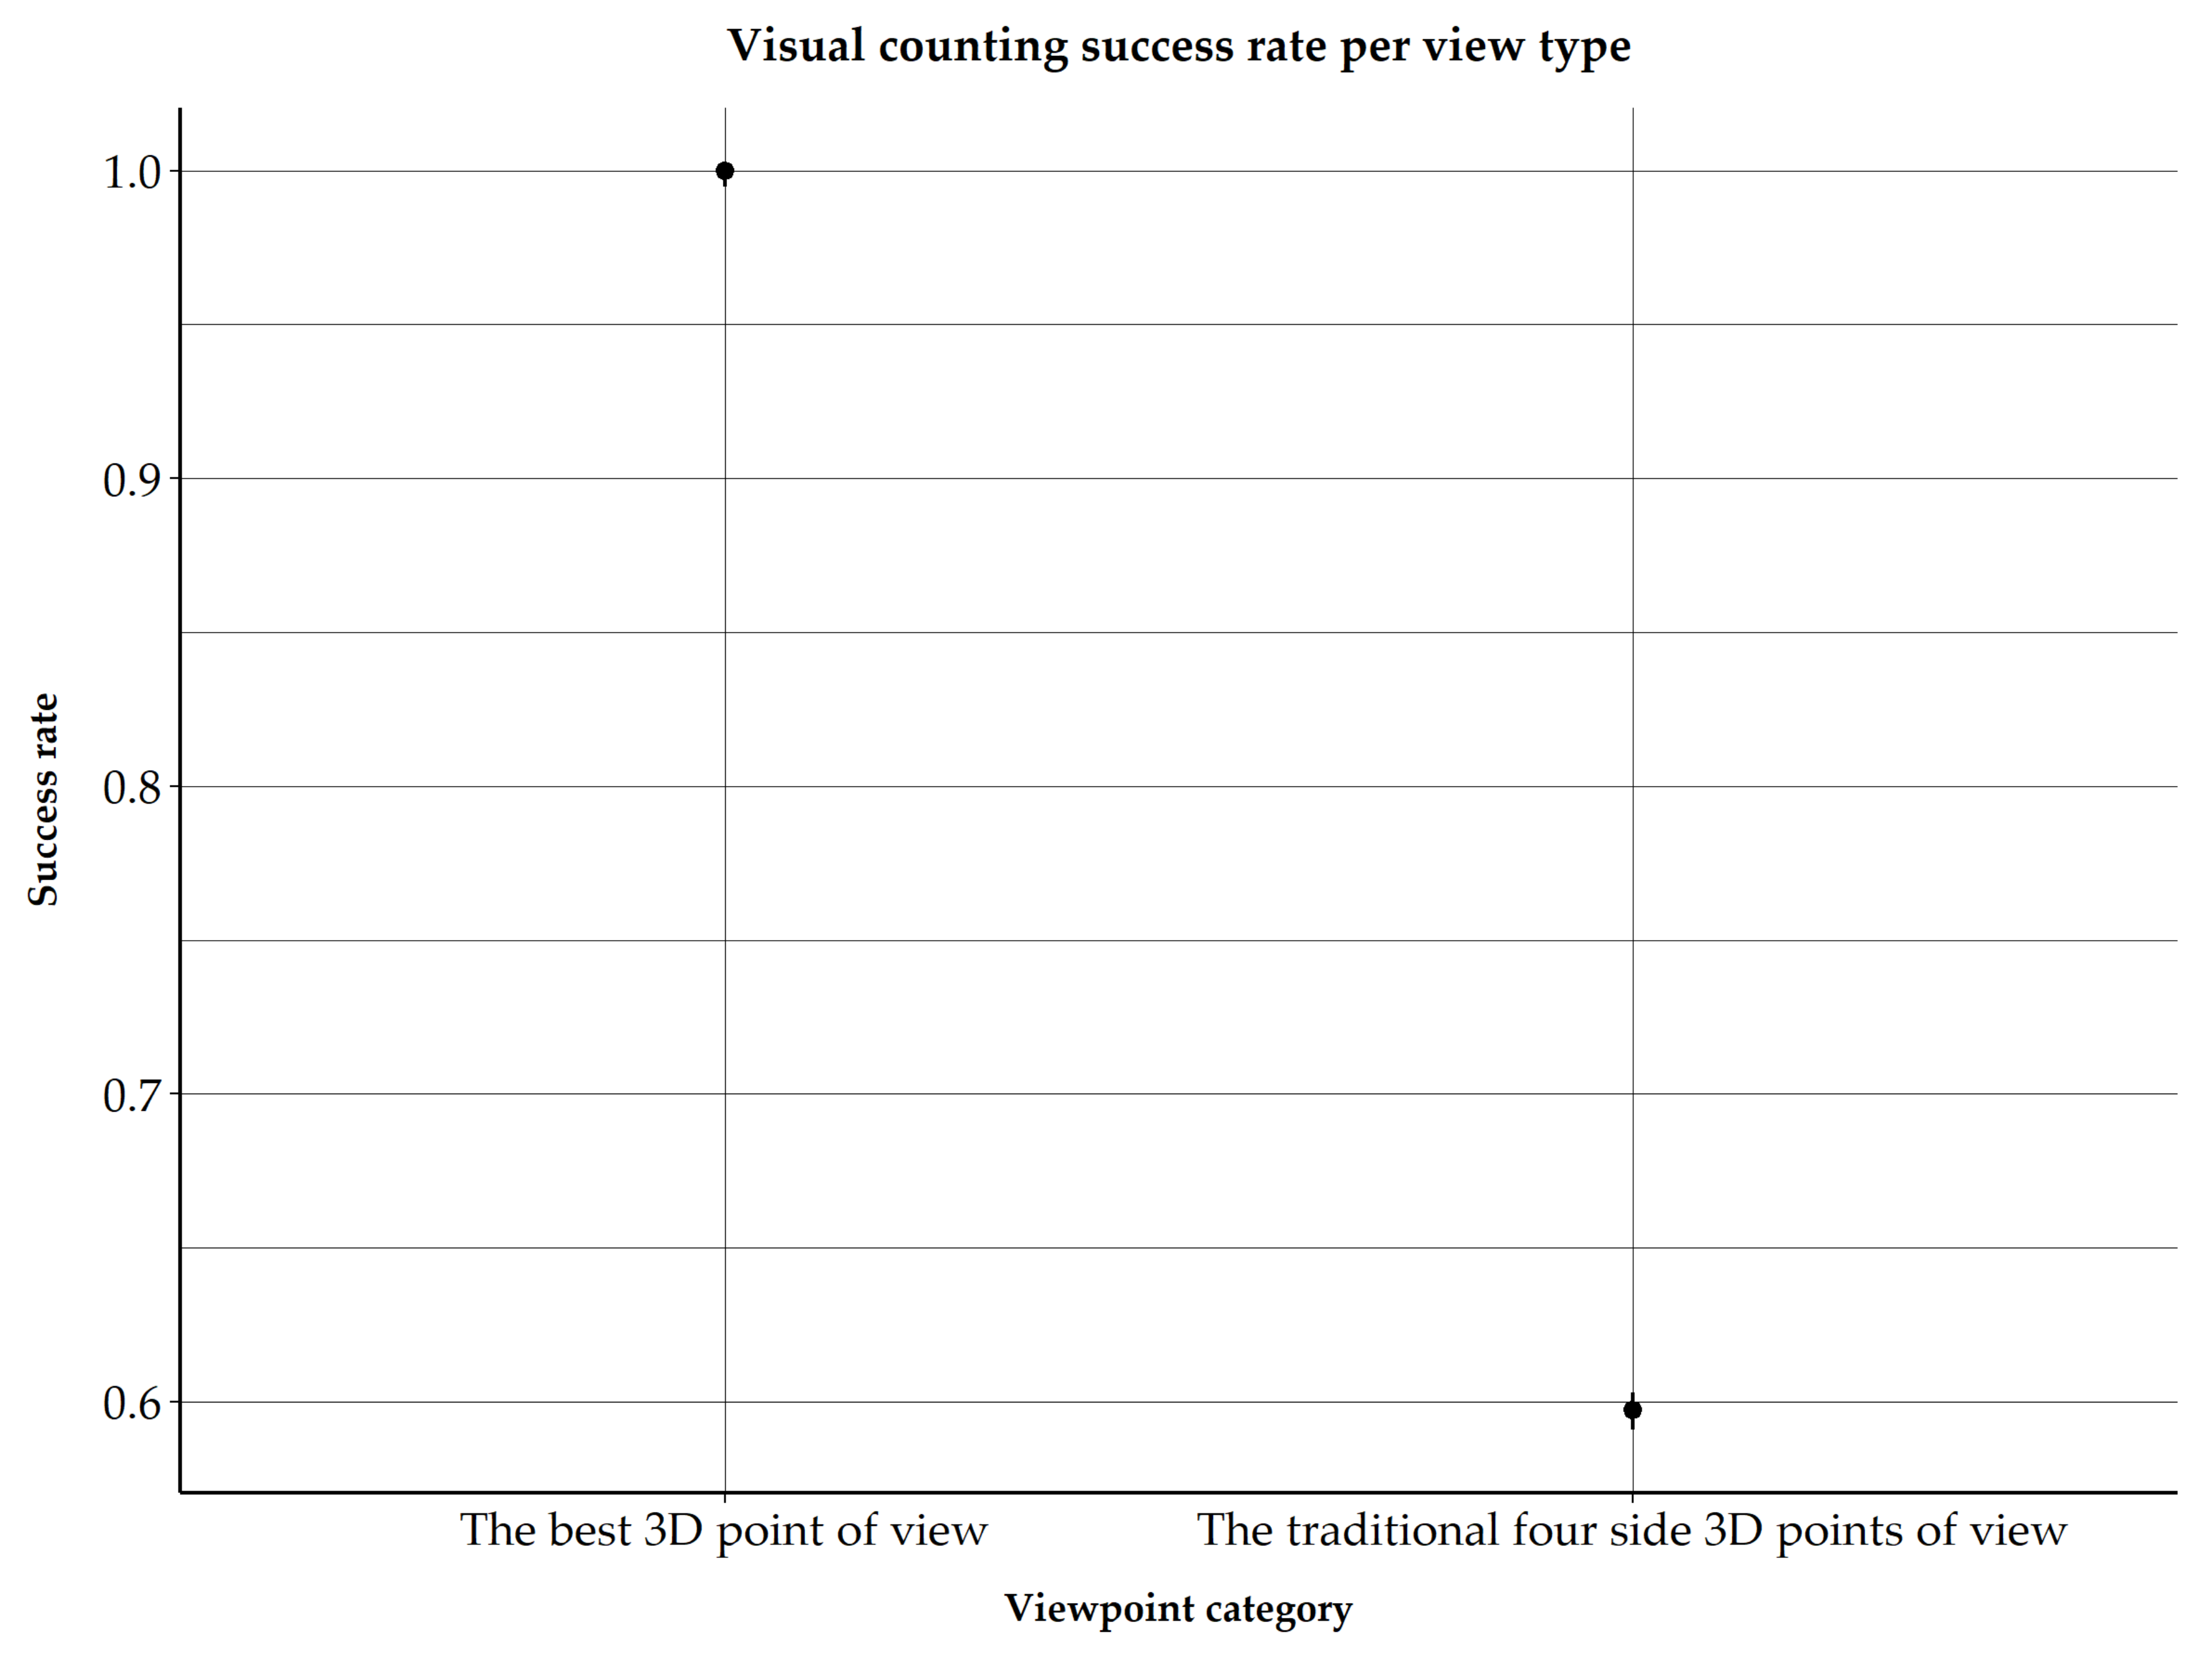
The exact binomial test shows that maximizing the 3D geometric objects’ view area inside the viewport significantly improves the achievement of a visual selectivity task compared to the traditional four side points of view. The overall mean success rate associated to the four side points of view is around 59.7%, while it reaches 100% for the point of view generated by the viewpoint management algorithm (Figure 7). Note that the exact binomial test has been preferred to the standard binomial test as the 3D viewpoint that maximizes the 3D geometric objects’ view area did not meet the initial application condition of a standard binomial test; n*p*q was lower than nine (n being the number of observations, p the probability of success, and q the probability of failure).
3.4. Is a 3D Viewpoint Based on the Maximization of 3D Geometric Objects’ View Area More Accurate for Visual Counting of a Set of Objects Within a Virtual 3D Building Model?
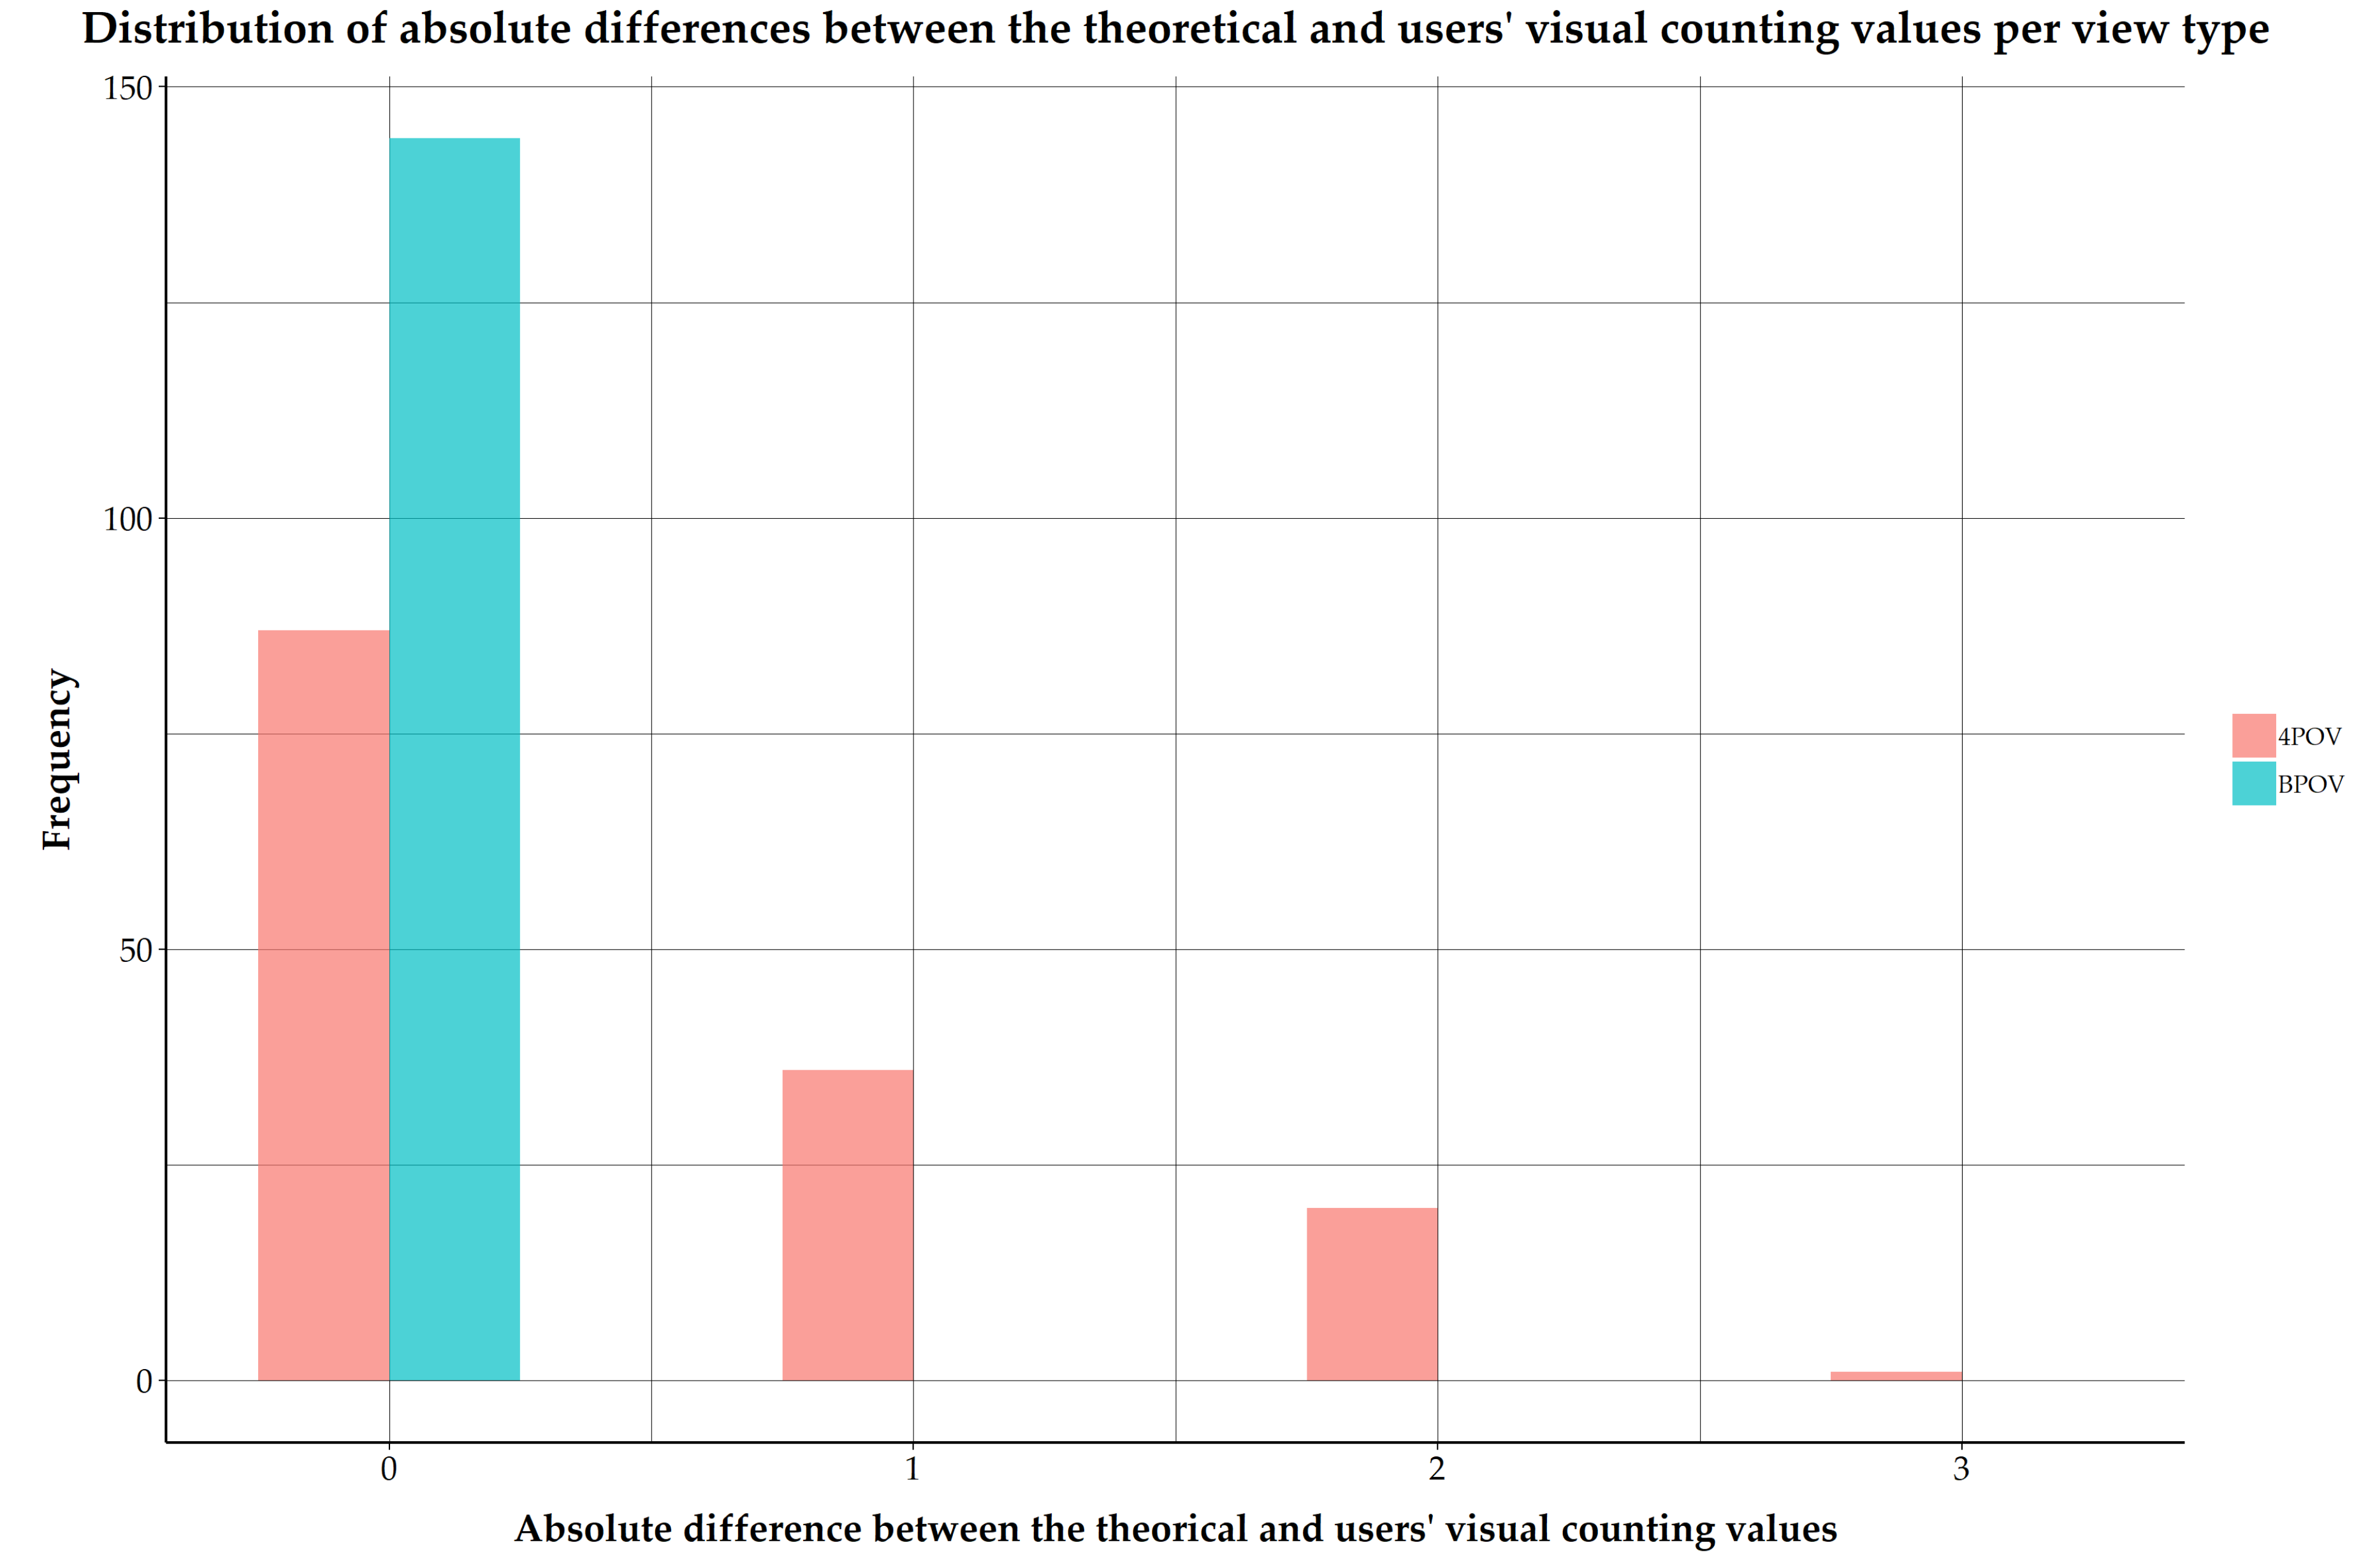
The Student’s t-test shows that maximizing the 3D geometric objects’ view area significantly improves the accuracy with which the participants complete the visual counting (p-value: 6.7 × 10⁻¹⁵ < 0.05). As shown in Figure 8, all participants were able to constantly count the exact number of windows from this 3D viewpoint. On the contrary, the use of the traditional four side points of view usually caused an error of one window within the detection process of at least one test.
3.5. Does a 3D Viewpoint Based on the Maximization of 3D Geometric Objects’ View Area Enhance the User’s Certainty When Visually Counting a Set of Objects within a Virtual 3D Building Model?
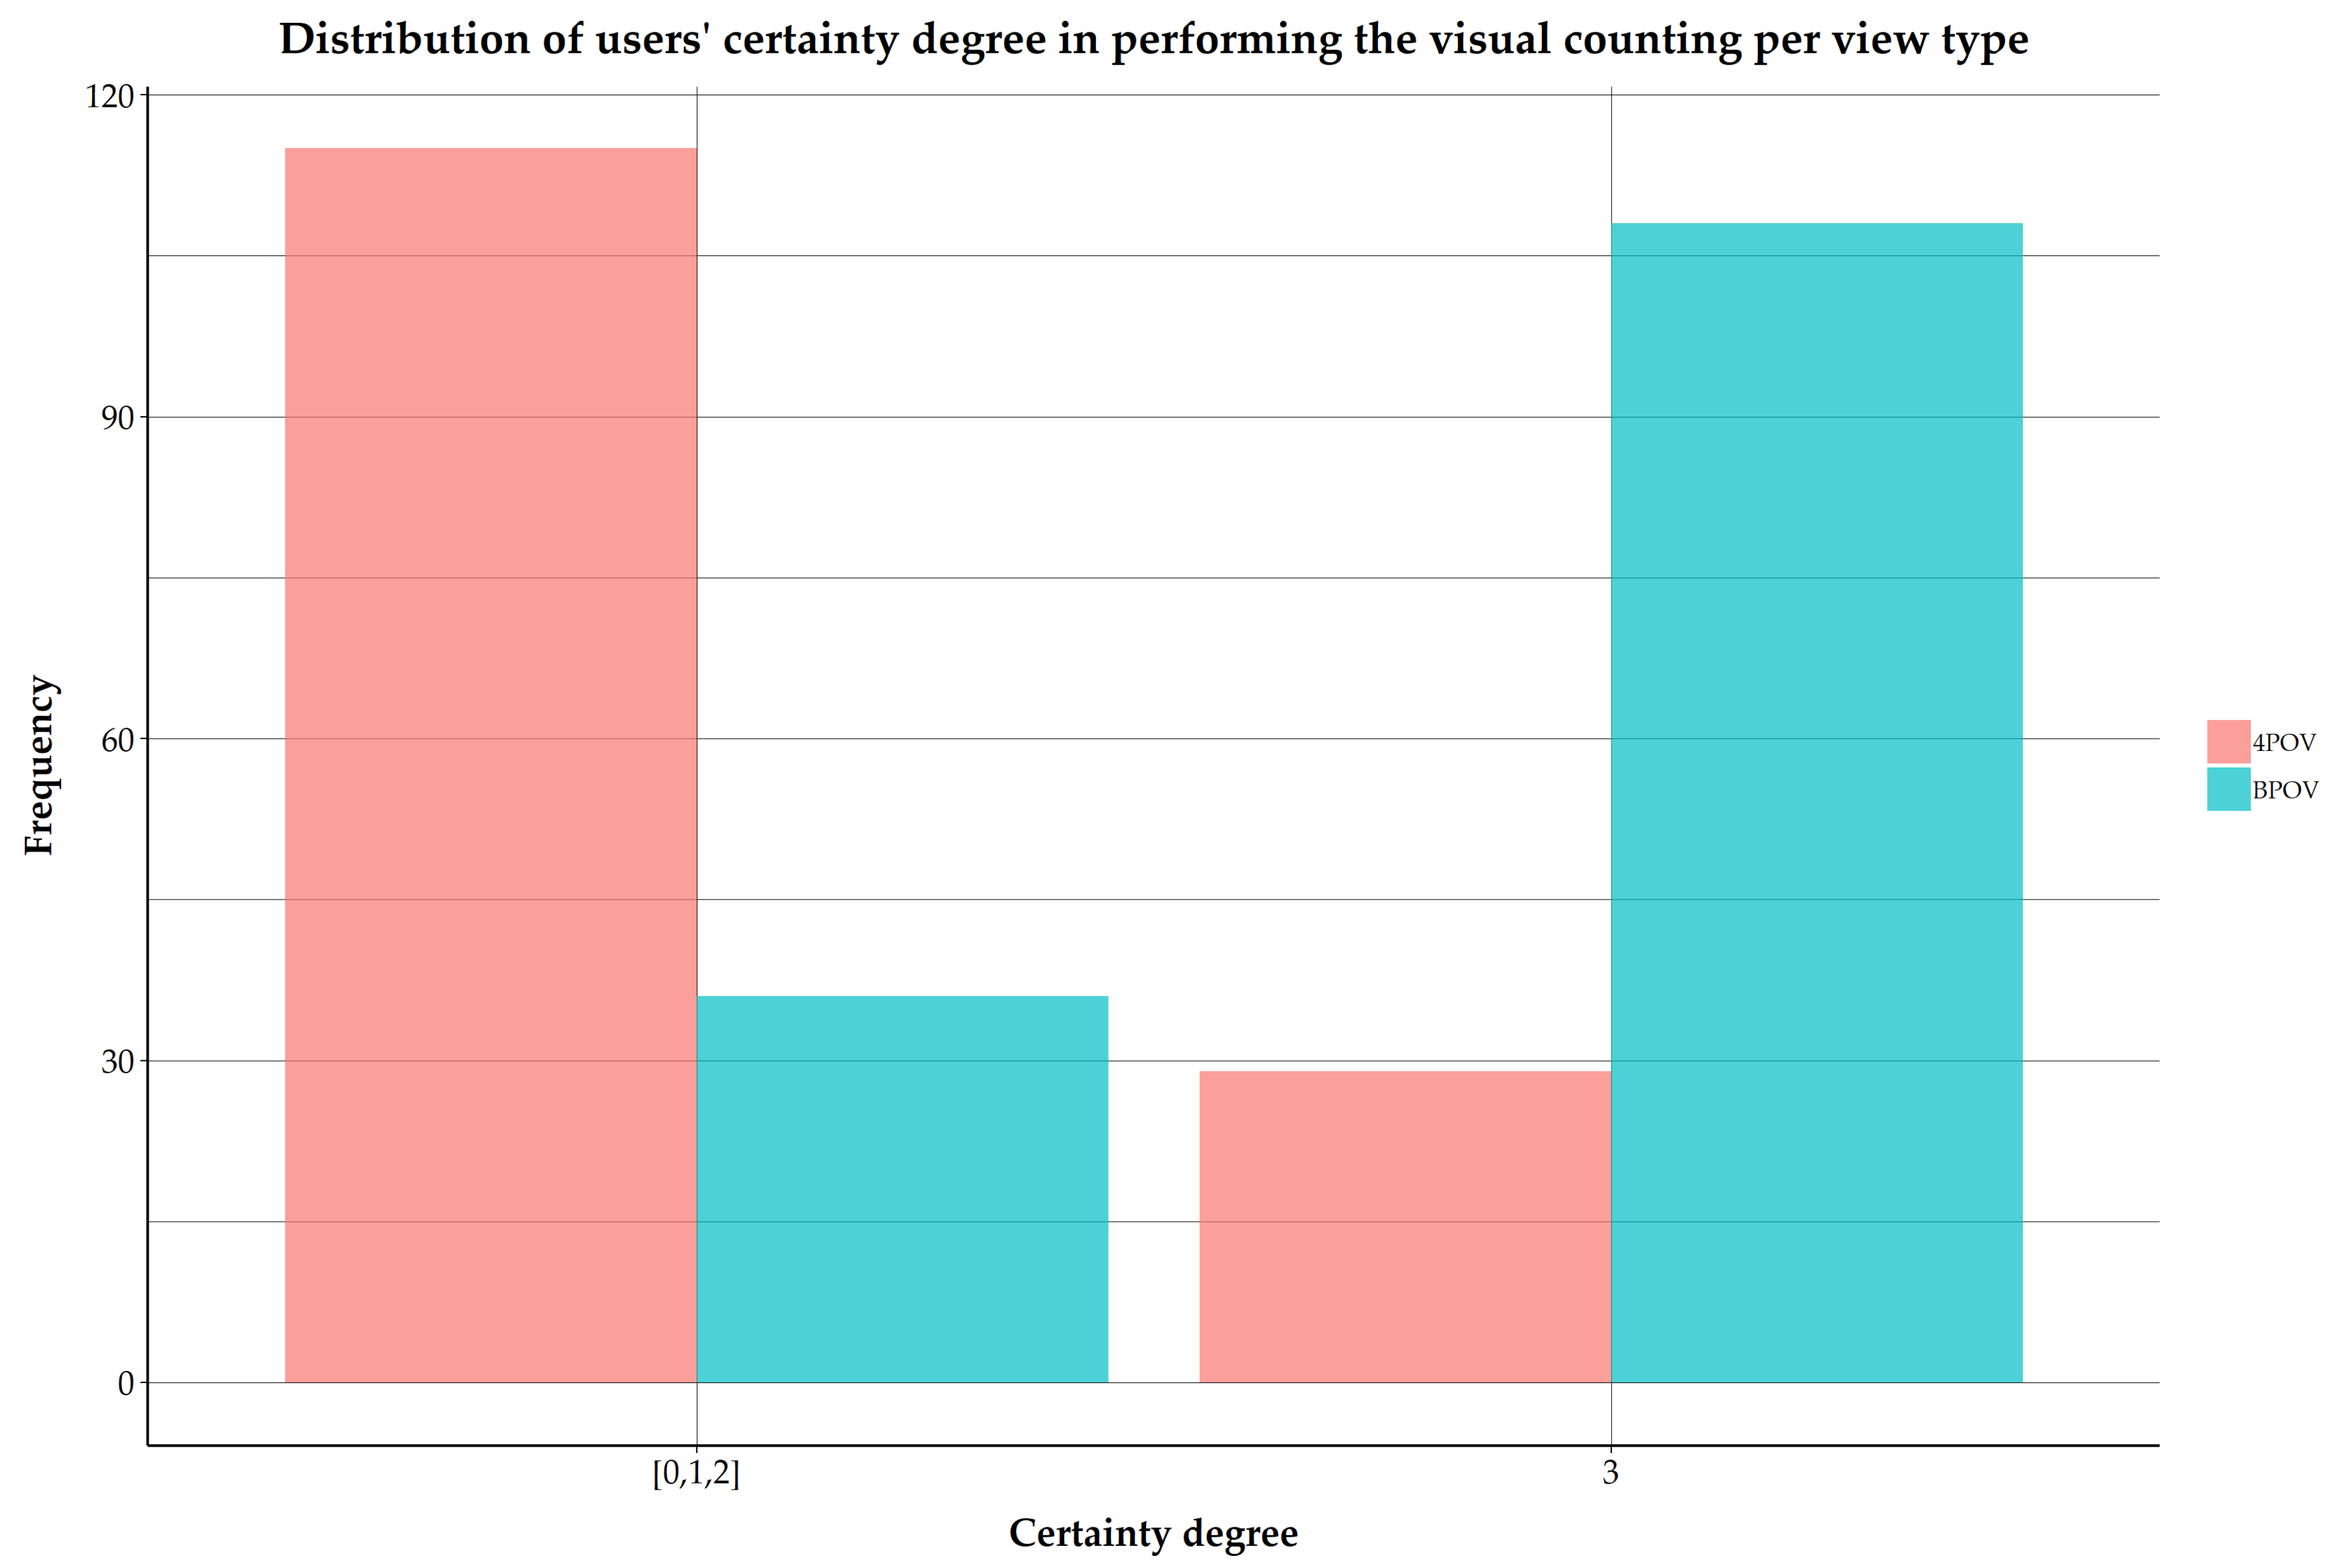
Prior to the statistical Chi-2 test, the initial measurement scale was reduced to two categories in order to meet the minimum number of observations per class (5). To achieve that, the frequencies associated to the totally uncertain, quite uncertain, and quite certain classes were merged; the totally certain class was not rearranged. Then, the application of the Chi-2 test showed that maximizing the 3D geometric objects’ view area significantly improves the degree of certainty of participants when achieving the counting task (p-value: 2.2 × 10⁻¹⁶ < 0.05). As shown in Figure 9, participants are usually totally certain (category 3) when performing the visual counting from this point of view. In contrast, they are generally less confident when dealing with the traditional four side points of view. Besides, note that the participants were never uncertain when performing the visual task with the best point of view. They were at least quite certain of their answer.
3.6. Does a 3D Viewpoint Based on the Maximization of 3D Geometric Objects’ View Area Make the Visual Counting of a Set of Objects Faster within a Virtual 3D Building Model?
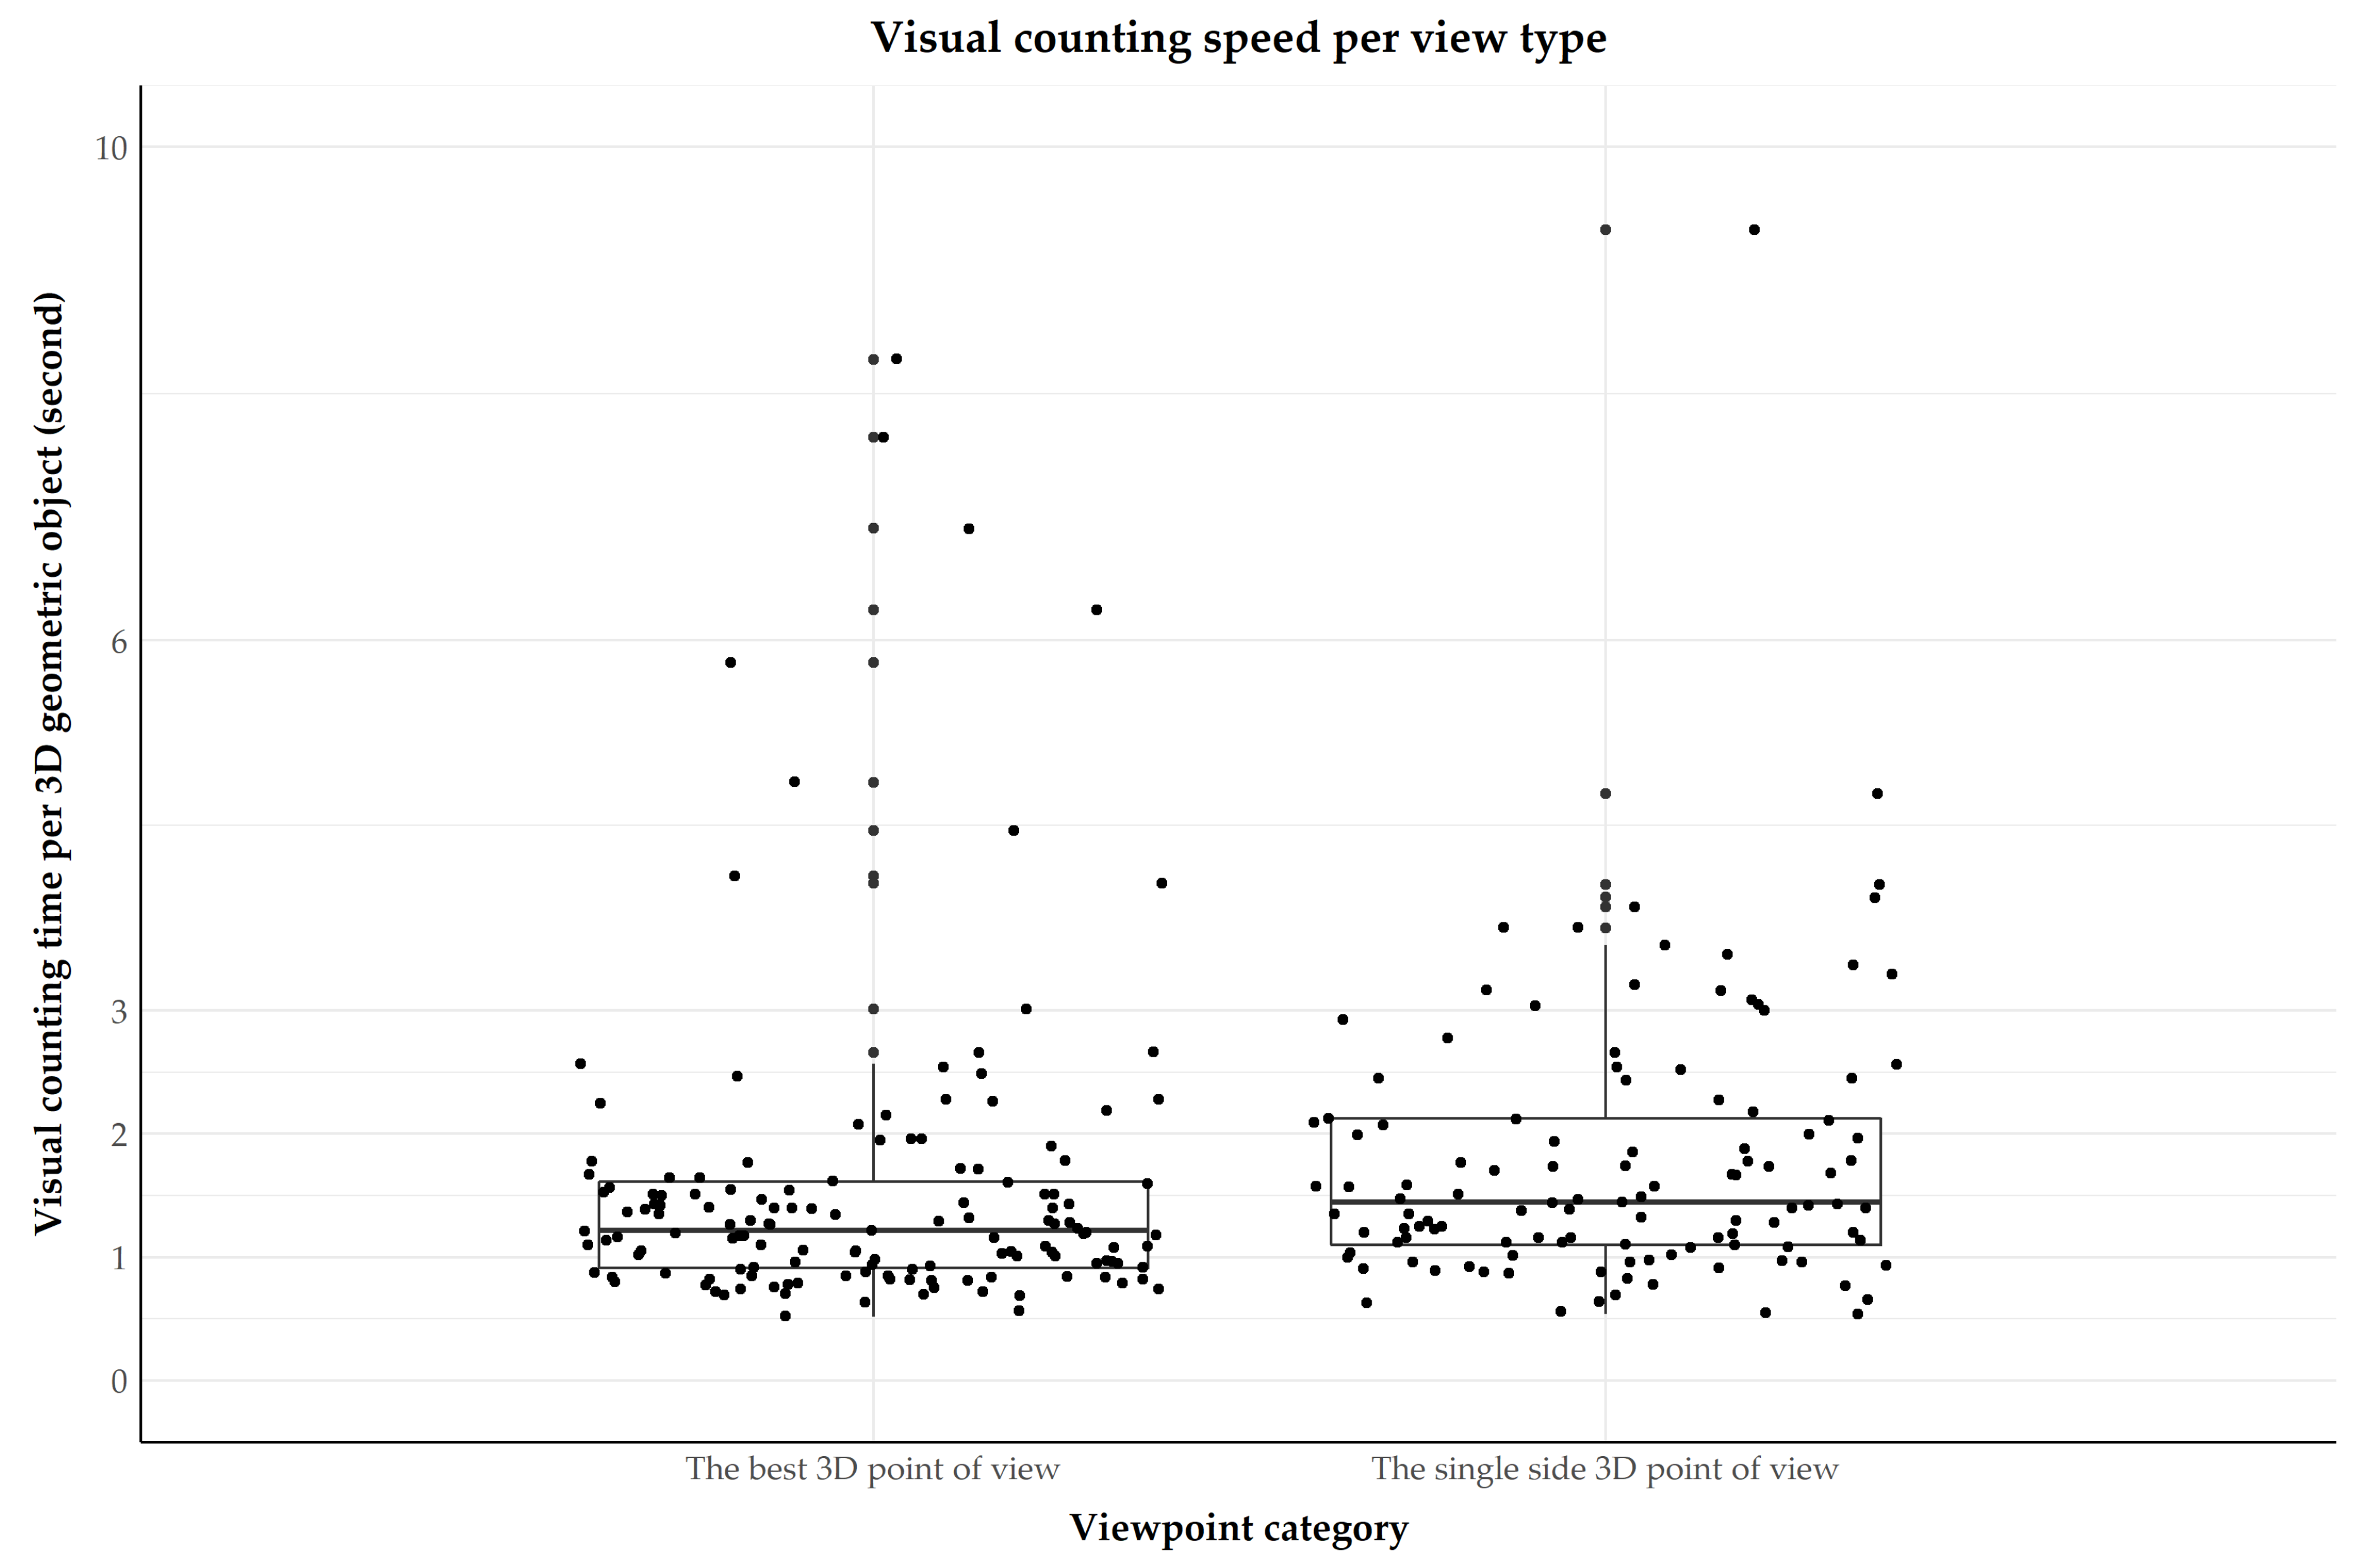
Before conducting the ANOVA, the response time was firstly reduced to a visual counting time per object. Furthermore, only response times related to questions correctly answered were considered in the statistical analysis. Performed on these time values, the statistical analysis shows no significant difference in speed between the single side point of view and the viewpoint maximizing the 3D geometric objects’ view area inside the viewport (p-value: 0.07 > 0.05). The average visual detection speed per object is around 1.57 s, while it reaches 2.0 s with the side point of view. Figure 10 displays the distribution of all registered visual counting times per object, which are grouped by view type. Note that two outliers (from the single side point of view) were visually removed to improve the reading; their values exceeded 24 s. Whilst no significant difference could not be demonstrated (at the confidence level of 95%), it is worth noticing that the single side point of view shows a higher variability in the response times compared to the viewpoint that maximizes the 3D objects’ visibility.
3.7. Do The User’s Attributes (Background Training, Decision-Making Level, Experience in 3D Visualization) Influence the Usability of the 3D Viewpoint that Maximizes the 3D Geometric Objects’ View Area Inside the Viewport?
As all participants of the survey successfully detected the right number of bad condition assets with the 3D precomputed viewpoint, there is thus no effect on the success and accuracy criteria. Since there was only one participant from the construction industry, this attribute was not taken into account in the statistical analysis of the users’ certainty and the visual counting time. The results seem to show that the training background, the decision-making level, and the experience in 3D visualization have no significant effect on the response time (at the confidence level of 95%). The results tend also to indicate that the training background, the decision-making level (except for the strategic level for which the number of observations per category did not meet the statistical test conditions), and the experience in 3D visualization have no significant effect on the level of certainty.
4. Discussion
4.1. Back to the Research Questions
Within the given framework of facility management, the results support that a 3D viewpoint that maximizes the visibility of 3D geometric objects inside the viewport improves the effectiveness (both in terms of success rate and accuracy) and certainty of a visual counting task compared to the traditional four side points of view. The statistical analyses even show that these two criteria are highly enhanced (p-value < 0.001). This aspect is essential from the perspective of including the 3D spatial data visualization in the decision-making procedures, especially when it comes to safety procedures. In the case of fire detection or propagation, the company in charge of the building safety might, for instance, provide a quicker and better evaluation to the emergency services. The deployment of required resources (both human and material) might then be enhanced and lead to facilitating the work in the field.
However, the hypothesis that the proposed point of view makes the visual counting of objects faster compared to a single side point of view could not be demonstrated at the 5% significance threshold. However, we can still notice that the 3D best point of view shows a lower variance, which may be explained by a higher consistency in the visibility of 3D geometric objects within the viewport. Moreover, the single side point of view greatly limited the choice of objects to be visualized due to their visibility requirement inside the viewport; the objects were usually close to each other, which may have facilitated the visual task achievement and reduced its completion time. In contrast, the precomputed point of view was applied on a more scattered spatial distribution of objects, which is more representative in practice. As a result, although no significant effect could be found, the proposed point of view still seems a promising solution for conducting a visual selective task as it still performs the task faster than the four traditional side points of view and is more suitable for actual scenarios in facility management.
Finally, the visual counting time per object linked to the best 3D viewpoint is not influenced by the background training, the decision-making level, and the experience in 3D visualization. The same applies to the certainty degree of the 3D best point of view, except for the strategic level for which the number of observations per category did not meet the statistical test conditions. To deeply analyze the effect of this decision-making level on the certainty degree, a higher number of participants is required and is vital to develop user-centered design strategies.
4.2. 3D Viewpoint in the 3D Geovisualization Process
Within the 3D geovisualization process, the results tend to support the key role of the 3D viewpoint in achieving specific visual tasks. While the visualization techniques applied to the 3D building model were kept constant throughout the experiment, we show that the achievement of a selective task (visual counting) can be greatly enhanced from a suitable 3D point of view. Initially included into the rendering aspect as variables of vision [34], the camera settings should be removed and considered as an external processing stage as they clearly impact the completion of the visual task independently of the mapping and rendering aspects.
Beyond the theoretical outcomes, this work also proposes a first RESTful web application for managing the 3D viewpoint of spatial data. Developed as a client-server application that can leverage the power of remote computers, the application could become a promising operational solution to be incorporated to existing online 3D viewers. This architecture could even be deployed on any kind of device (from desktop computers and laptops to tablets and smartphones), as the processing stage is performed remotely. The only parameters sent by the server to the client are two sets of three dimension coordinates that automatically locate and orient the camera inside the 3D scene. Note that these two sets of coordinates could even be incorporated into the visualization of the OGC Web Terrain Service as a powerful way to improve the understanding of the 3D scene [35]. For that purpose, the 3D coordinates of the best camera location should be converted into the OGC specifications: The distance from the point of interest (which is the 3D vector that fits the camera viewing direction provided by the algorithm), the pitch, the yaw, and the raw angles from this point of interest.
4.3. Limitations and Perspectives
First of all, only 36 experts participated in the survey, which is too small for the development of real user-centered design strategies. Consequently, the results must be interpreted with caution and a higher number of participants is required to achieve a greater confidence in the findings. Whilst the questionnaire was only deployed on the web for facilitating access during the interviews, no publicity actions were undertaken to introduce the questionnaire to a wider audience. Yet, this latter step should be required in the future in order to increase the sample size, although it does not guarantee the same degree of reliability as for interviews. Note that professional social networking sites (e.g., LinkedIn) could also be used so as to reach worldwide experts from the field.
Then, the visual counting task was only carried out on the windows of the 3D building, i.e., on objects visible from the outside. A more practical use case in facility management also requires 3D assets located inside the building, e.g., temperature or carbon monoxide sensors, ducts, and cabling. Since these objects are fundamentally occluded from an exterior 3D point of view, additional visualization techniques should be simultaneously applied (see [36] for a taxonomy of 3D occlusion management techniques).
Then, the experiment was only performed on one specific selective task: Visual counting. However, the selectivity interpretation task includes other assignments, such as the location of one or multiple asset(s) and the evaluation of the spatial relationship between assets. The last one might require a step prior to the 3D viewpoint computation, for instance, the extraction of the 3D geometric object to be visualized (e.g., a 3D surface or volume representing the spatial intersection between two assets).
Furthermore, the maximization of the 3D geometric objects’ visibility within the viewport was used as the only indicator that defined the viewpoint optimality criterion. This choice was driven by the selective task (visual counting) and the visualization conditions (the objects of interest were clearly contrasted from their surrounding). In the future, new or additional indicators could be proposed to specifically meet the requirements of other visual tasks. For that matter, an existing list of descriptors can be found in [37,38,39,40].
Beyond its use in facility management, the viewpoint management algorithm could be extended to the design phase of a building as a way to facilitate the understanding and solution of clash (or collision) detection. To date, current BIM software already provides algorithms to automatically detect clashes among architectural, structural, and MEP components [41], along with a log and clash images. However, we noted that the software illustrations are not based on any specific design guidance. A 3D viewpoint management module linked to suitable visualization techniques could enhance the comprehension and solution of clash detections.
Finally, the present proposal is only applied on 3D spatial data visualized through 2D screens. With the ongoing and growing development of virtual reality, the automatic 3D viewpoint selection could assist immersive guided tours, such as fly and walk-troughs, for better interaction with the designed space. For instance, it could be a part of a BIM-game system, i.e., an approach integrating both building information modeling and gaming, to improve architectural visualization and education [42]. In such systems, the algorithm could also enhance the visualization and understanding of simulations of physical building dynamics and behaviors of virtual building users.
5. Conclusions
In this paper, we propose the preliminary experiment to validate the general hypothesis that there exists at least one optimal 3D viewpoint for visualizing a set of 3D geometric objects and that this point of view is a function of the objects’ view area inside the viewport. Applied to visual counting of assets based on a BIM model in facility management, the study shows that visual counting success is significantly enhanced with a 3D viewpoint that maximizes the 3D geometric objects’ view area compared to the traditional four side points of view. The same is also true with respect to the certainty with which users undertake the visual task. In facility management, the viewpoint processing algorithm could therefore enhance the safety monitoring of buildings and the communication process with emergency services. The algorithm could even be a part of existing 3D online viewers, as it is already implemented as a web application.
The findings from this research also enrich the knowledge in the 3D geovisualization field as they stress the importance of the 3D viewpoint as a key parameter in the visualization process of 3D models. Moreover, only a few works in the domain use the experimental approach to validate their results, making the developed experimental setup innovative. In the future, 3D geovisualization-related studies could thus take advantage of this scientific approach.
In this paper, the hypothesis that a 3D viewpoint that maximizes the 3D geometric objects’ view area makes the visual counting of 3D geometric objects faster compared to a single side point of view could not be demonstrated. However, the statistical analysis shows promising results, leading to the conducting of additional surveys. This work also lays the foundation of eventual future investigations in the 3D viewpoint usability evaluation, in terms of visual tasks to be performed, 3D objects to be visualized, and 3D visualization supports.
Author Contributions
R.N. designed and implemented the viewpoint management algorithm, conceived and performed the experiment, and wrote the paper. J.P. assisted in the design of the experimental approach and R.B. took part in the research problematics definition; they also both participated in reviewing the paper.
Funding
Part of this project was funded by CRSNG RGPIN-2015-05514.
Acknowledgments
We want to thank Pierre Hallot for his help in the BIM model acquisition. We also want to sincerely thank Yves Cornet for his great help in the statistical analysis. Finally, we want to thank the anonymous reviewers for their relevant and in-depth comments.
Conflicts of Interest
The authors declare no conflict of interest.
References
- Azhar, S. Building information modeling (BIM): Trends, benefits, risks, and challenges for the AEC industry. Leadersh. Manag. Eng. 2011, 11, 241–252. [Google Scholar] [CrossRef]
- Czmoch, I.; Pękala, A. Traditional design versus BIM based design. Proc. Eng. 2014, 91, 210–215. [Google Scholar] [CrossRef]
- Abbasnejad, B.; Moud, H.I. BIM and basic challenges associated with its definitions, interpretations and expectations. Int. J. Eng. Res. Appl. 2013, 3, 287–294. [Google Scholar]
- Wetzel, E.M.; Thabet, W.Y. The Use of a BIM-Based Framework to Support Safe Facility Management Processes; Virginia Polytechnic Institute and State University: Blacksburg, VA, USA, 2016. [Google Scholar]
- Becerik-Gerber, B.; Jazizadeh, F.; Li, N.; Calis, G. Application areas and data requirements for BIM-enabled facilities management. J. Constr. Eng. Manag. 2012, 138, 431–442. [Google Scholar] [CrossRef]
- Wang, Y.; Wang, X.; Wang, J.; Yung, P.; Jun, G. Engagement of facilities management in design stage through BIM: Framework and a case study. Adv. Civ. Eng. 2013, 2013, 1–8. [Google Scholar] [CrossRef]
- Zhang, X.; Arayici, Y.; Wu, S.; Abbott, C.; Aouad, G. Integrating BIM and GIS for large scale (building) asset management: A critical review. In Proceedings of the 12th International Conference on Civil Structural and Environmental Engineering Computing, Madeira, Portugal, 1–4 September 2009. [Google Scholar]
- Akcamete, A.; Liu, X.; Akinci, B.; Garrett, J.H. Integrating and visualizing maintenance and repair work orders in BIM: Lessons learned from a prototype. In Proceedings of the 11th International Conference on Construction Applications of Virtual Reality (CONVR), Weimar, Germany, 3–4 November 2011. [Google Scholar]
- Kyle, B.R.; Vanier, D.J.; Kosovac, B.; Froese, T.M. Visualizer: An interactive, graphical, decision-support tool for service life prediction for asset managers. In Proceedings of the 9th International Conference on durability of building materials and components, Brisbane, Australia, 17–20 March 2002. [Google Scholar]
- Motamedi, A.; Hammad, A.; Asen, Y. Knowledge-assisted BIM-based visual analytics for failure root cause detection in facilities management. Autom. Constr. 2014, 43, 73–83. [Google Scholar] [CrossRef]
- Akcamete, A.; Akinci, B.; Garrett, J.H. Potential utilization of building information models for planning maintenance activities. In Proceedings of the International Conference on Computing in Civil and Building Engineering, Nottingham, UK, 30 June–2 July 2010. [Google Scholar]
- Lee, W.-L.; Tsai, M.-H.; Yang, C.-H.; Juang, J.-R.; Su, J.-Y. V3DM+: BIM interactive collaboration system for facility management. Vis. Eng. 2016, 4, 15. [Google Scholar] [CrossRef]
- Li, X.; Zhu, H. Modeling and visualization of underground structures. J. Comput. Civ. Eng. 2009, 23, 348–354. [Google Scholar] [CrossRef]
- Elmqvist, N.; Tudoreanu, M.E. Occlusion management in immersive and desktop 3D virtual environments: Theory and evaluation. IJVR 2007, 6, 13. [Google Scholar]
- Azhar, S.; Nadeem, A.; Mok, J.Y.N.; Leung, B.H.Y. Building information modeling (BIM): A new paradigm for visual interactive modeling and simulation for construction projects. In Proceedings of the Advancing and Integrating Construction Education, Research and Practice, Karachi, Pakistan, 4–5 August 2008; pp. 435–446. [Google Scholar]
- Neuville, R.; Poux, F.; Hallot, P.; Billen, R. Towards a normalised 3D geovisualisation: The viewpoint management. ISPRS Ann. Photogramm. Remote Sens. Spat. Inf. Sci. 2016, 4, 179–186. [Google Scholar] [CrossRef]
- Neuville, R.; Pouliot, J.; Poux, F.; Billen, R. 3D viewpoint management and navigation in urban planning: Application to the exploratory phase. Remote Sens. 2019, 11, 236. [Google Scholar] [CrossRef]
- Pouliot, J.; Badard, T.; Desgagné, E.; Bédard, K.; Thomas, V. Development of a web geological feature server (WGFS) for sharing and querying of 3D objects. In Advances in 3D Geoinformation Systems; van Oosterom, P., Zlatanova, S., Penninga, F., Fendel, E.M., Eds.; Springer: Berlin/Heidelberg, Germany, 2008; pp. 115–130. ISBN 978-3-540-72134-5. [Google Scholar]
- American Society of Civil Engineers. Glossary of the Mapping Sciences; ASCE Publications: New York, NY, USA, 1994. [Google Scholar]
- Neuville, R.; Pouliot, J.; Poux, F.; De Rudder, L.; Billen, R. A formalized 3D geovisualization illustrated to selectivity purpose of virtual 3D city model. ISPRS Int. J. Geo. Inf. 2018, 7, 194. [Google Scholar] [CrossRef]
- Poux, F.; Neuville, R.; Hallot, P.; Van Wersch, L.; Luczfalvy Jancsó, A.; Billen, R. Digital Investigations of an Archaeological Smart Point Cloud: A Real Time Web-Based Platform To Manage the Visualisation of Semantical Queries. In Proceedings of the The International Archives of the Photogrammetry, Remote Sensing and Spatial Information Sciences, Florence, Italy, 16 May 2017; Volume XLII-5/W1, pp. 581–588. [Google Scholar]
- Bertin, J. Sémiologie Graphique: Les Diagrammes, les Réseaux et les Cartes; Gauthier-Villars, Mouton and Cie.: Paris, France, 1967. [Google Scholar]
- Pouliot, J.; Wang, C.; Fuchs, V.; Hubert, F.; Bédard, M. Experiments with notaries about the semiology of 3D cadastral models. ISPRS Int. Arch. Photogramm. Remote Sens. Spat. Inf. Sci. 2013, XL-2/W2, 53–57. [Google Scholar] [CrossRef]
- Rautenbach, V.; Coetzee, S.; Schiewe, J.; Çöltekin, A. An assessment of visual variables for the cartographic design of 3D informal settlement models. In Proceedings of the 27th International Cartographic Conference, Rio de Janeiro, Brazil, 23–28 August 2015. [Google Scholar]
- Van Velsen, L.; Van Der Geest, T.; Klaassen, R.; Steehouder, M. User-centered evaluation of adaptive and adaptable systems: A literature review. Knowl. Eng. Rev. 2008, 23, 261–281. [Google Scholar] [CrossRef]
- Oosterom, P.V.; Stoter, J.; Ploeger, H.; Thompson, R.; Karki, S. World-wide inventory of the status of 3D cadastres in 2010 and expectations for 2014. In Proceedings of the FIG Working Week 2011, Marrakech, Morocco, 18–22 May 2011. [Google Scholar]
- Shojaei, D.; Kalantari, M.; Bishop, I.D.; Rajabifard, A.; Aien, A. Visualization requirements for 3D cadastral systems. Comput. Environ. Urban Syst. 2013, 41, 39–54. [Google Scholar] [CrossRef]
- Wang, C.; Pouliot, J.; Hubert, F. How users perceive transparency in the 3D visualization of cadastre: Testing its usability in an online questionnaire. GeoInformatica 2017, 21, 599–618. [Google Scholar] [CrossRef]
- Abran, A.; Khelifi, A.; Suryn, W. Usability meanings and interpretations in ISO standards. Softw. Qual. J. 2003, 11, 325–338. [Google Scholar] [CrossRef]
- Green, M. Toward a perceptual science of multidimensional data visualization: Bertin and beyond. ERGO/GERO Hum. Factors Sci. 1998, 8, 1–30. [Google Scholar]
- Wallach, D.; Scholz, S.C. User-centered design: Why and how to put users first in software development. In Software for People; Maedche, A., Botzenhardt, A., Neer, L., Eds.; Springer: Berlin/Heidelberg, Germany, 2012; pp. 11–38. ISBN 978-3-642-31370-7. [Google Scholar]
- Lazar, J.; Feng, J.H.; Hochheiser, H. Research Methods in Human-Computer Interaction; Wiley: Hoboken, NJ, USA, 2010. [Google Scholar]
- Virzi, R. Refining the test phase of usability evaluation: How many subjects is enough? Hum. Factors 1992, 34, 457–468. [Google Scholar] [CrossRef]
- Semmo, A.; Trapp, M.; Jobst, M.; Döllner, J. Cartography-oriented design of 3D geospatial information visualization—Overview and techniques. Cartogr. J. 2015, 52, 95–106. [Google Scholar] [CrossRef]
- Open Geospatial Consortium. Web Terrain Server (WTS), Number OGC 01-061, Version: 0.3.2. 2001.
- Elmqvist, N.; Tsigas, P. A taxonomy of 3D occlusion management techniques. In Proceedings of the IEEE 2007 Virtual Reality Conference, VR’07, Charlotte, NC, USA, 10–14 March 2007; pp. 51–58. [Google Scholar]
- Polonsky, O.; Patané, G.; Biasotti, S.; Gotsman, C.; Spagnuolo, M. What’s in an image? Towards the computation of the “best” view of an object. Vis. Comput. 2005, 21, 840–847. [Google Scholar] [CrossRef]
- Vazquez, P.-P.; Feixas, M.; Sbert, M.; Heidrich, W. Viewpoint selection using viewpoint entropy. In Proceedings of the Vision Modeling and Visualization Conference, Aka GlbH, Stuttgart, Germany, 21–23 November 2001; pp. 273–280. [Google Scholar]
- Lee, C.H.; Varshney, A.; Jacobs, D.W. Mesh saliency. ACM Trans. Graph. 2005, 24, 656–659. [Google Scholar] [CrossRef]
- Page, D.L.; Koschan, A.F.; Sukumar, S.R.; Roui-Abidi, B.; Abidi, M.A. Shape analysis algorithm based on information theory. In Proceedings 2003 International Conference on Image Processing (Cat. No.03CH37429); IEEE: Barcelona, Spain, 2003; Volume 1, pp. 229–232. [Google Scholar]
- Azhar, S.; Sattineni, A.; Hein, M. BIM undergraduate capstone thesis: Student perceptions and lessons learned. In Proceedings of the 46th ASC Annual Conference, Boston, MA, USA, 17 July 2010; pp. 1–8. [Google Scholar]
- Yan, W.; Culp, C.; Graf, R. Integrating BIM and gaming for real-time interactive architectural visualization. Autom. Constr. 2011, 20, 446–458. [Google Scholar] [CrossRef]
Figure 1.
A 3D viewpoint and its components: Camera position, orientation, focal length, and vision time (from [17]).
Figure 1.
A 3D viewpoint and its components: Camera position, orientation, focal length, and vision time (from [17]).

Figure 2.
A complete RESTful web application managing the 3D viewpoint. The 3D visualization process is carried out client-side (via WebGL) while the computation process is supplied server-side thanks to Node.js and three.js (from [17]).
Figure 2.
A complete RESTful web application managing the 3D viewpoint. The 3D visualization process is carried out client-side (via WebGL) while the computation process is supplied server-side thanks to Node.js and three.js (from [17]).

Figure 3.
A 3D building model and example of visual detection of rooms with an internal too-high temperature.
Figure 3.
A 3D building model and example of visual detection of rooms with an internal too-high temperature.

Figure 4.
Website: Participants’ attributes (section 1 of the questionnaire).

Figure 5.
Website: Contextual setting of the survey (section 2 of the questionnaire).

Figure 6.
Website: The first three simulations of the survey (section 3 of the questionnaire).

Figure 7.
Exact binomial test. Visual counting success rate associated to the 3D viewpoint maximizing the 3D geometric objects’ view area inside the viewpoint (the best 3D point of view) and the traditional four side 3D points of view.
Figure 7.
Exact binomial test. Visual counting success rate associated to the 3D viewpoint maximizing the 3D geometric objects’ view area inside the viewpoint (the best 3D point of view) and the traditional four side 3D points of view.

Figure 8.
Distribution of absolute differences between the theoretical and user’s visual counting values per view type. 4POV: The traditional four side points of view; BPOV: The best point of view, i.e., the viewpoint maximizing the 3D geometric objects’ view area within the viewport.
Figure 8.
Distribution of absolute differences between the theoretical and user’s visual counting values per view type. 4POV: The traditional four side points of view; BPOV: The best point of view, i.e., the viewpoint maximizing the 3D geometric objects’ view area within the viewport.

Figure 9.
Distribution of users’ certainty degree in performing the visual counting per view type; 4POV: The traditional four side points of view; BPOV: The best point of view, i.e., the viewpoint maximizing the 3D geometric objects’ view area within the viewport. The categories 0, 1, and 2 (respectively, totally uncertain, quite uncertain, and quite certain) have been merged to meet the minimum number of observations per class (5).

Figure 10.
One-way ANOVA. Visual counting speed per view type associated to the 3D viewpoint maximizing the 3D geometric object’s view area inside the viewpoint (the best 3D point of view) and the single side 3D points of view.
Figure 10.
One-way ANOVA. Visual counting speed per view type associated to the 3D viewpoint maximizing the 3D geometric object’s view area inside the viewpoint (the best 3D point of view) and the single side 3D points of view.


Table 1.
Research questions and associated statistical methods.
| Research Question | Criterion | Type of Input Data | Statistical Method | Alpha |
|---|---|---|---|---|
| Success rate | Effectiveness | Quantitative (ratio and discrete) | Exact binomial | 5% |
| Accuracy | Effectiveness | Quantitative (ratio and continuous) | Student’s t test | 5% |
| Speed | Effectiveness | Quantitative (ratio and continuous) | ANOVA (one-way) | 5% |
| Certainty | Satisfaction | Qualitative (ordinal) | Chi-2 | 5% |
© 2019 by the authors. Licensee MDPI, Basel, Switzerland. This article is an open access article distributed under the terms and conditions of the Creative Commons Attribution (CC BY) license (http://creativecommons.org/licenses/by/4.0/).
Share and Cite
MDPI and ACS Style
Neuville, R.; Pouliot, J.; Billen, R. Identification of the Best 3D Viewpoint within the BIM Model: Application to Visual Tasks Related to Facility Management. Buildings 2019, 9, 167. https://doi.org/10.3390/buildings9070167
AMA Style
Neuville R, Pouliot J, Billen R. Identification of the Best 3D Viewpoint within the BIM Model: Application to Visual Tasks Related to Facility Management. Buildings. 2019; 9(7):167. https://doi.org/10.3390/buildings9070167
Chicago/Turabian StyleNeuville, Romain, Jacynthe Pouliot, and Roland Billen. 2019. "Identification of the Best 3D Viewpoint within the BIM Model: Application to Visual Tasks Related to Facility Management" Buildings 9, no. 7: 167. https://doi.org/10.3390/buildings9070167
Note that from the first issue of 2016, this journal uses article numbers instead of page numbers. See further details here.