
Estimating Functional and Physical Service Life of Timber Buildings Concerning Thermal Performance Simulations


1
Department of Construction Engineering and Management, School of Engineering, Pontificia Universidad Católica de Chile, Avenida Vicuña Mackenna, Santiago 4860, Chile
2
Department of Civil Engineering, Architecture and Georresources, Instituto Superior Técnico, University of Lisbon, Av. Rovisco Pais, 1049-001 Lisbon, Portugal
3
Centro Nacional de Excelencia para la Industria de la Madera (CENAMAD), Pontificia Universidad Católica de Chile, Avenida Vicuña Mackenna, Santiago 4860, Chile
*
Author to whom correspondence should be addressed.
Buildings 2022, 12(9), 1299; https://doi.org/10.3390/buildings12091299
Submission received: 12 July 2022
/
Revised: 11 August 2022
/
Accepted: 16 August 2022
/
Published: 24 August 2022
(This article belongs to the Section Building Energy, Physics, Environment, and Systems)
Abstract
:Currently, the cities in southern region of Chile present extremely high levels of atmospheric pollution. One of the main reasons for that is the adoption of inadequate thermal envelopes, which are not adapted to the buildings’ climatic and environmental surrounding conditions. Usually, the existing buildings do not have any type of thermal insulation, which causes excessive heating of spaces, in a region where the main source of heat is firewood. Thus, there is a need to intervene, improving the thermal energy performance of timber buildings, but will it be possible to make technically informed decisions that consider buildings’ service life? In this study, 72 buildings in the cities of Valdivia and Niebla (South Chile) have been analysed based on in-situ visual inspections. Concerning the novelty of the study, two methodologies have been used to define the end of their physical and functional service life, establishing a hierarchical scale concerning the priority of intervention in timber buildings. After that, three different thermal energy insulation performance scenarios have been modelled in terms of evaluating current conditions, basic thermal rehabilitation, or deep thermal rehabilitation. A more effective and profound intervention in terms of thermal performance leads to better habitability conditions for the buildings’ occupants in the context of South Chile, increasing their comfort between 36% to 46% of the year, when compared with current conditions. This kind of innovative analyses are extremely significant for the implementation of preventive maintenance programs focused not only on the restoration of the physical or functional service life of building stocks, but also considering their thermal energy performance in order to improve the habitability of the buildings for their occupants, and reducing both atmospheric pollutants and firewood consumption in the South of the country.
1. Introduction
This study is focused on the analysis of the thermal energy performance of a set of timber buildings, which have reached the end of their physical and functional service life. This kind of approach seeks to define: (i) ‘when to intervene’ as a suggestion or recommendation of timing of the intervention and (ii) ‘how to intervene’, with some possible simulations of the type of intervention that could be developed considering several situations or factors, including social, economic, environmental, or architectural variables, among others.
1.1. Service Life Prediction Models
Standards are normally developed by professional experts of the construction sector to promote a more holistic methodology for building design, construction and operation in terms of use and maintenance actions. To this end, the International Organization for Standardization (ISO) endorses a design procedure called service life planning (SLP). ISO 15686-1; 2011 [1] defines SLP as “a design process that seeks to ensure that the service life of a building or other constructed asset will equal or exceed its design life” [1,2]. In this sense, the service life prediction can support more rational and even sustainable solutions, since it provides relevant knowledge regarding how and when to intervene in a building or in a building envelope [3].
Construction assets suffer from various types of depreciation throughout their life cycle, which begins when the structure is first put into use [4], ultimately leading to the end of the building’s service life. In this sense, service life prediction methods are based on assessing the extent of deterioration in some specific measurable properties [5]. These methods are extremely relevant in architecture, engineering, and construction (AEC) sectors, since they influence the sustainability, repair costs, and environmental impact of the buildings. According to ISO 15686:4 [6], service life can be defined as a period of time after installation during which the building and its parts meet or exceed the performance requirements. The basic assumptions for service life prediction models should be based on both the durability of the building components and economic reasons or even considering functional criteria related to stakeholders’ expectations [7].
Façade claddings are the most exterior layer of the building, and are directly exposed to degradation agents [8]. Therefore, the claddings are normally more prone to suffer anomalies, with direct consequences on the quality of the users’ comfort, urban space, and on the maintenance or repair costs [9,10]. The end of the façade claddings’ service life can thus occur due to different factors, such as: (i) technological obsolescence; (ii) economic obsolescence; (iii) physical degradation; (iv) functional obsolescence; (v) social context and/or legal obsolescence; (vi) aesthetic obsolescence; and (vii) building envelope obsolescence related to thermal efficiency [11].
1.2. Thermal Building Envelope and Energy Consumption
Recently, different multi-criteria optimization methodologies have been developed [12,13], in order to consider the building envelope obsolescence and to minimize the buildings’ energy consumption. The optimisation of energy consumption in buildings presents benefits in terms of economic efficiency, ecological impact, thermal comfort, visual comfort, indoor air quality and even outdoor air quality [14,15,16,17].
One of the most important parameters to minimise the energy consumption of a building is related to an adequate thermal insulation of the building envelope [18]. Bolattürk [19] developed a methodology to obtain the optimum thickness of the insulation, which was established by the: (i) degree-days of heating; (ii) cost of the insulating material; and (iii) cost of the fuel, firewood or other materials that will be used to heat a house in a decade. Various studies have focused on the optimisation of the thermal insulation and the thermal transmittance of external walls [20]. Specifically, Verichev et al. [21,22] presented a methodology to determine the optimal U-value for external walls as well as the thickness of the insulating material through energy simulation in the context of maintaining the energy performance of the house under standard conditions. Another physical phenomenon to consider in the energy calculation is the airtightness of the building. Air infiltrations represent a significant part of the demand for heating and cooling [23]. The reduction of infiltrations in the rehabilitation of buildings is one of the main focuses of the intervention [24].
1.3. Atmospheric Contamination
The World Health Organization (WHO) points out that air pollution presents a severe health risk for societies. Measures to reduce pollution can reduce many of today’s diseases, such as asthma and lung cancer, among others. Various developing regions use biomass-based heating and, consequently, plans for mitigation measures are necessary [25].
In the case of Chile, the Ministry of the Environment (ME) has different Atmospheric Decontamination Plans (ADPs) in force, which are defined as: “An ADP is an environmental management instrument that, through the definition and implementation of specific measures and actions, aims to recover the levels indicated in the primary and/or secondary environmental quality standards of an area classified as saturated by one or more pollutants” [26].
In South Chile, the ADP of the commune of Valdivia was established based on S.D. No. 25/2017 of the ME, which declares a saturated zone above certain levels of respirable particulate material (PM10), in terms of daily and annual concentration, and of breathable fine particulate material (PM2.5), in terms of daily concentration, in the geographical area that comprises the commune of Valdivia [27]. The objective of this environmental management instrument is, within a period of 10 years, to achieve compliance in the saturated area with the primary environmental quality standard for PM10, and the primary environmental quality standard for PM2.5. This effort from the Ministry of the Environment (ME) is mainly due to the acknowledgment that urban air pollution can profoundly degrade the quality of life in cities [28].
Similarly to other cities in central and southern Chile, in Valdivia commune, the main source of atmospheric pollution arises from the residential sector due to the combustion of firewood (Table 1), both for heating and cooking, which is why the Atmospheric Decontamination Plan focuses on reducing the emissions generated in the sector [27]. Additionally, other economic activities or pollutant sources such as industries and transportation are added to a lesser extent, as they contribute to emissions of particulate matter that increase the risk of adverse effects on the health of the population [29]. Likewise, the emission of gases from these sources are precursors in the formation of secondary PM2.5.
In accordance with the National Strategy of Atmospheric Decontamination Plans of the ME [26], which intends to reduce emissions from the residential sector, the Atmospheric Decontamination Plan considers four main strategic axes: (i) thermal improvement of dwellings; (ii) improvement of the efficiency of firewood and other wood-based combustion devices; (iii) improvement of the quality of firewood and availability of other fuels; (iv) education and awareness in the community.
2. Research Aim
The novelty of this study is to contribute to the thermal improvement of dwellings strategy regarding the ADPs in Chile. The main innovation is the analysis of two service life prediction methodologies for defining the end of their physical and functional service life, establishing a priority of intervention in timber buildings in Valdivia and Niebla (South Chile). After that, three different thermal energy insulation performance scenarios have been modelled in terms of evaluating current conditions, basic thermal rehabilitation, or deep thermal rehabilitation. This kind of innovative application will help to establish possible future mitigation strategies focused of thermal improvement of dwellings and also including preventive maintenance actions of the buildings as a whole, based on informed, scientific and technical criteria.
3. Materials and Methods
The Section 1 describes the study area and the characterisation of the case studies under analysis. The Section 2 presents the definition of the physical service life model, the functional degradation model, and the modelling conditions and thermal energy simulations, respectively.
3.1. Materials
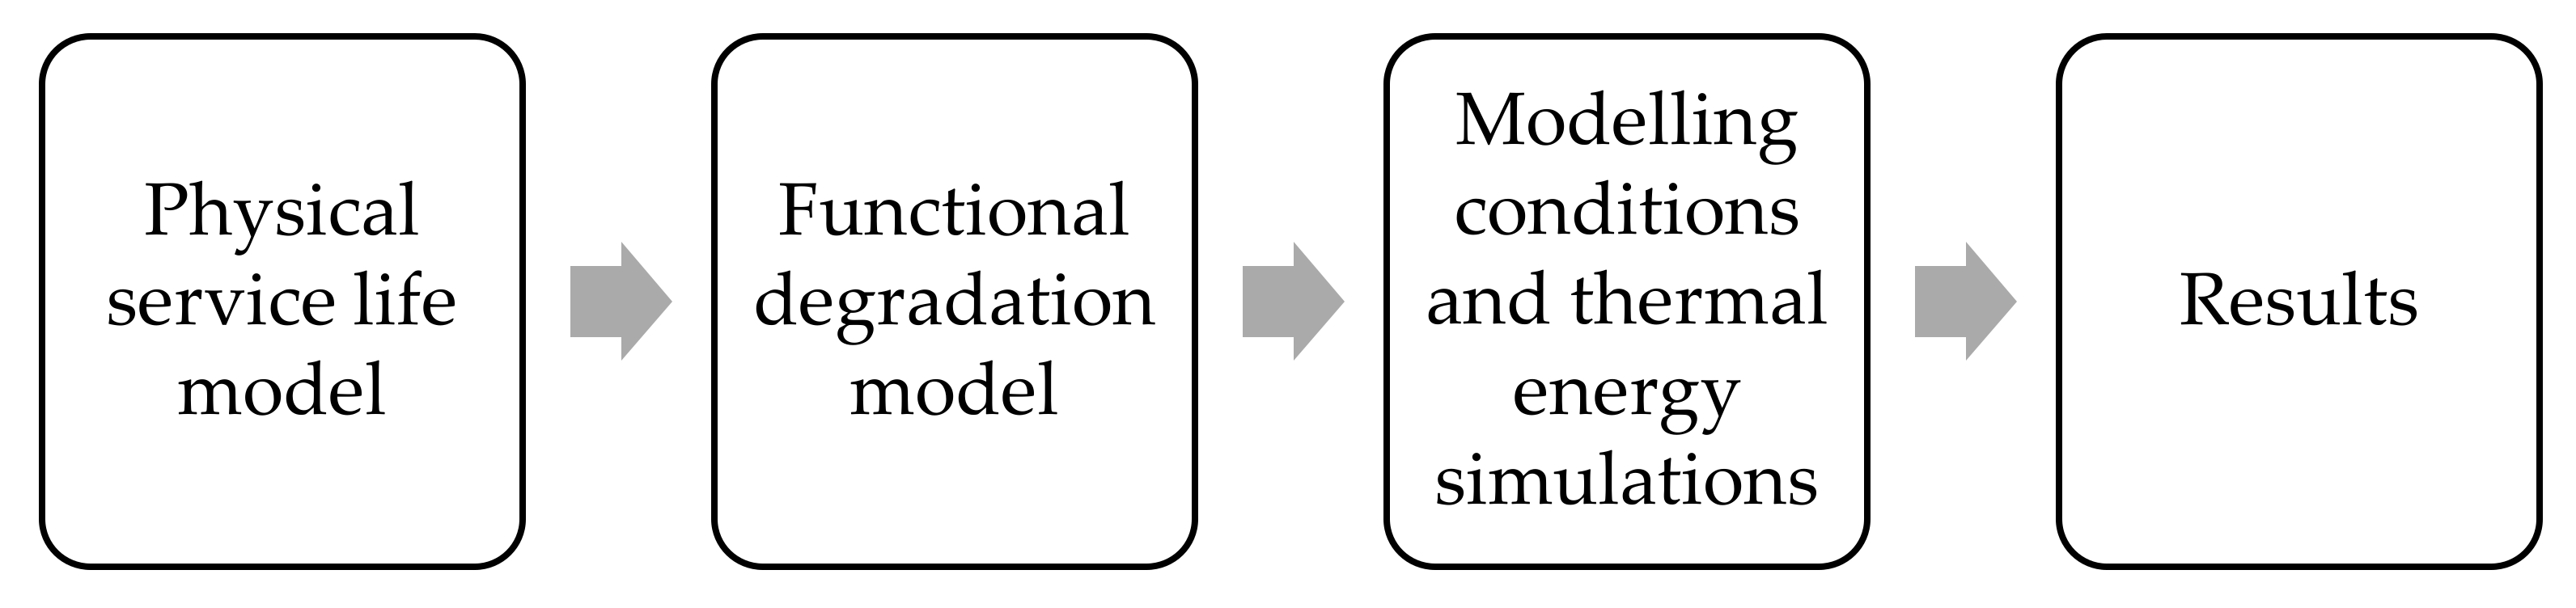
Figure 1 shows the methodological sequence of the work, where three significant phases can be seen before reaching the final results. This work aims to analyse buildings’ physical and functional life to define the end of their service life. Therefore, it helps us to determine when to intervene in the building. After the first two phases are achieved, the intervention processes are modelled. In this sense, the thermal conditions of the envelope and their corresponding simulations are simulated for different scenarios depending on the complexity of the intervention.
3.1.1. Study Area
The set of case studies analysed is composed of 72 timber buildings in the commune of Valdivia (Los Ríos region) in South Chile (Figure 2). Concerning the climate of Valdivia, this area has a temperate rainy type with Mediterranean influence. The average annual temperature is around 10 °C, with a thermal amplitude, which normally does not exceed 8–9 °C, which shows the moderating influence of the proximity of the Pacific Ocean coastline. The warm period is observed between December, January, and February (summertime), with an average temperature around 17 °C and absolute maximum temperatures in that period, which vary around 28–30 °C. The minimum temperatures are observed in the period from June, July and August with an average minimum temperature around 6–7 °C, in July, the coldest month [27].
Average annual rainfall in the basin is approximately 2600 mm. The highest rainfall occurs in the Andean Mountain range, reaching more than 5500 mm. There is a dry period especially in the months of January and February, where average rainfall does not exceed 60 mm per month. The precipitation is usually of cyclonal or frontal origin. These can last for several days, with a water supply that can exceed 100 mm per storm [30]. Regarding the average frequency of the winds, there is a predominance of North-Northwest winds during the year, prevailing low speeds and calm between the months of March and August, which associated with low temperatures, generate concentration events and poor dispersion of pollutants [27]. In some months of the year, specifically in the coldest months, the fine particulate material (2.5 µm) reaches a proportion up to 80%, thus generating high impacts on the health of the population. In the case of the months of higher temperatures, the ratio of PM2.5 contained in PM10 decreases considerably, reaching a proportion over 30%, thus indicating the incidence of the use of firewood of low-quality standards (wet firewood) and the limited technology of residential heating appliances (fireplaces, salamanders, stoves, single chamber heaters) used for heating in cold months [27].
3.1.2. Characterisation of Case Study
The sample buildings were constructed from the 19th century to the 21st century and their main use is related to dwelling, services, and commerce. Many of these buildings reflect the architectural, cultural, and technical style adopted in Valdivia as a manifestation of the European colonisations, in particular, the German influence. The German settlers have reproduced the vernacular architecture of their homeland (Central and South Germany) with some adaptations, namely, through the use of native wood from Chile, since it is the locally available building material [31,32] (Figure 3). In developing countries, buildings with and without heritage characteristics are usually at risk due to several causes, but essentially due to the lack of knowledge and models to aid the decision of intervene and the limited resources applied in the buildings’ conservation [33]. In this sense, the Chilean Ministry of Cultures, Arts and Heritage, Ministry of Housing and Urbanism and Ministry of Environment have made several efforts to improve the effectiveness of the management of the buildings. These efforts include some recommendations regarding the adoption of thermal insulation in façade claddings, in order to optimize the thermal indoor spaces, and strategies of preventive maintenance to comply with present and future needs [34]. The selected buildings (Figure 3) have similar construction systems based on walls of double wood veneer with an air chamber; roofs of metal sheet, oriented strand board, air chamber and wood veneer; floors of slabs above ground; and monolithic glass in windows.
3.2. Methods
3.2.1. Physical Service Life Model
The buildings’ envelope can be defined as “the skin” of the building, contributing to increase the durability of the structure, protecting it from the environmental agents [3]. The façade cladding is the most exposed exterior layer of the building, and therefore more exposed to the degradation agents. Gaspar and de Brito developed a quantitative index, called “severity of degradation” (Sw), which determines the overall degradation condition of building components [35]. The Sw index is defined from the relationship between the total area affected by a set of anomalies that can occur in the buildings’ components under analysis, weighted by their condition and severity, and a reference area corresponding to the total façade area. Numerous studies have been developed regarding the validation of the method’s application to different types of facades’ claddings, and the model proved to be a reliable system in terms of the assessment of the buildings components’ degradation condition [36,37]. In 2019, the Sw methodology was applied to external timber claddings, encompassing the appropriate modifications, to reflect the particular context of South Chile [34]. The Sw index of timber claddings is expressed as shown in Equation (1).
where Sw is the severity of the degradation of timber claddings, in percentage; An is the area of cladding affected by the anomaly n (m2); kn corresponds to the multiplying factor of anomaly n, according to the condition level (ranging between 0 and 4); ka,n is the weighting factor corresponding to the relative weight of the anomaly detected; A is the façade area, in m2; and ∑(kmax.) corresponds to the sum of the weighting factors for the highest degradation level of each particular anomaly in a façade cladding with an area equal to A.
3.2.2. Functional Degradation Model
Fuzzy logic, introduced by Zadeh in 1965, established the fuzzy set theory, transforming the path in which uncertainties were modelled [38]. Fuzzy set extended the notion of classical crisp sets (Boolean logic) to handle fuzzy sets, leading to the new approach of fuzzy logic [39]. Fuzzy logic system offers an approach to modelling real-world parameter uncertainties that is complementary to probability theory, which addresses random uncertainty [40]. In this sense, fuzzy model enables a mathematical translation of linguistic variables (qualitative parameters) into numeric form (quantitative parameters). Moreover, fuzzy logic also allows modelling a given phenomenon with ambiguous information and in the absence of complete and precise data [41]. This particularly occurs in the evaluation of the functional degradation of buildings, structures, and constructions, and in the measurement of the external risks, caused by several associated variables, such as: (i) social, (ii) cultural, (iii) climatic, (iv) natural or (v) environmental factors.
In 2014, Macías-Bernal et al., designed a previous version of the model applied in this study, namely, the fuzzy building service life (FBSL) system [42]. The fuzzy logic system was upgraded to a new software version (FBSL2.0), considering the following enhancement measures: (i) adaptation to the international standard of risk management ISO 3100: 2011 [43,44]; (ii) correlation and validation to physical service life prediction methodology, which revealed that, when the functionality index decreases, the degradation of the building components increases and vice versa; (iii) identification and evaluation of previous refurbishment and maintenance actions in the functional performance of buildings over time; and (iv) analysis of the impact of climate change in the heritage timber buildings in South Chile [45].
This methodology was able to express the overall functional performance degradation of heritage buildings (parish churches) concerning a total of 17 inputs variables: five vulnerability variables (Table 2) and 12 external hazards, as shown in Table 3.
The fuzzification stage consists in the conversion of crisp values into grades of membership of fuzzy sets [46]. The FBSL2.0 adopts Gaussian membership functions [47], as the most appropriate to model the functional performance of buildings, with exception to the geological location input variable (v1), which uses trapezoidal membership functions (to contemplate almost a crisp valuation considering only a total of four types of terrain). The set of input parameters are fuzzified in membership functions μA; regarding a universe of discourse (U) in which a fuzzy set can range any value described in the range [0, 1]. A membership function (μ) assigns to each element a membership degree in the fuzzy set (A), ranging from 0 to 1 [48].
The combinations of the set of input membership functions, output membership functions, the base of knowledge, the fuzzy rules and hierarchical structures were specially established through expert knowledge-based judgements and evaluations [42]. The Delphi methodology was used to handle the experts’ answers, obtained during the expert survey stage. In this sense, the professional expert survey found a total of 354 inference rules in four inference layers. FBSL2.0 is a Mamdani’s fuzzy model, which is one of the most accepted algorithms [49]. The functional degradation method (FBSL2.0) was designed as a modus ponens model. The IF part of the inference rules is defined as the premise (combinations of input membership functions) and the THEN part of the rule is stated as the consequence (output membership functions) [50].
The defuzzification stage is used to obtain crisp values representing the fuzzy data produced by the model (output). In FBSL2.0 the Center of the Area (CoA) was used as one of the most successful and standardised methodologies for obtaining defuzzification procedures [51]. The fuzzy system can provide a semi-qualitative index (output) for describing the functional performance degradation of each case study analysed (building), based on the assessment of specialists. The functional level of performance is categorised by a total of three conditions levels, condition A, B or C [52]. In Table 4, the conditions levels are described.
3.2.3. Modelling Conditions and Thermal Energy Simulations
The main modelling conditions for the simulations performed in this study are obtained from the New Zealand standards for thermal insulation for houses and small buildings NZS 4218: 2009 [53]. This regulation establishes the values for internal gains (occupants, lighting, and equipment), percentage of use and hours. The minimum ventilation for buildings is defined according to the Manual of Procedures for Energy Qualification of Houses in Chile [27]. The criteria for the thermal energy simulations have been to consider only the condition of the buildings. The impact of neighbouring buildings or planning layout has not been evaluated.
The climate file used is from the city of Valdivia and was developed through the International Weather for Energy Calculation (IWEC2) methodology [54]. The climate file considers accurate 10-year historical data for temperature, relative humidity and solar radiation from 2009 to 2019. These data are obtained from the meteorological stations of the Meteorological Direction of Chile [55]. The construction of the typical year for the climate file was done using the methodology of ISO 15927-4 [56]. In terms of calculating the thermal loads of buildings, an ideal air conditioning system (heating and cooling) with a coefficient of performance (COP) equal to 1 has been considered. Table 5 and Table 6 present the main modelling conditions and their values, which has been used in the simulations.
Each case study has been modelled considering three levels of intervention (Table 6). Regarding the appraisal of the thermal energy performance of the buildings according to their type of envelope, the annual thermal loads and the operative temperatures inside the buildings have been compared for both the summer design day and the winter design day (without air conditioning system). As a criterion to characterize a house with a high thermal energy performance, the maximum thermal demands (thermal loads) of the projects are evaluated according to the values set by the Sustainable Housing Certification Handbook (SHC) [58].
Valdivia is located in a thermal zone G according to the Sustainable Construction Standards (ECS-Estándares de Construcción Sustentable) [59]—where the zones are classified from A (warmest) to I (coldest). For zone G, the heating and cooling thermal demands are equal to 82 kWh/m2*year and 13 kWh/m2*year, respectively. The combined criterion of heating and cooling demand for a single house is 95 kWh/m2*year in Valdivia.
4. Results and Discussion
Section 1 and Section 2 are focused on the analysis of the physical and functional degradation of the sample of 72 timber buildings in South Chile. Section 3 considers three thermal energy simulations applied to five case studies, which have reached the end of their physical and functional service life.
4.1. Physical Service-Life Prediction to Timber Claddings
Based on an empirical method proposed by Shohet et al. [63], the evolution of the degradation condition of buildings can be illustrated graphically by degradation curves, which allow correlating the degradation condition (dependent variable, in ordinates) with the age of the cladding under analysis (independent variable, in abscissas). A second-degree polynomial line is adjusted to the scatter of points corresponding to the cases analysed in the field work. Figure 4 presents the degradation curve obtained for the 72 timber claddings analysed. This study examines the loss of performance of timber claddings over time, contemplating the natural degradation evolution of these elements. In this research work, the timber cladding age is described as the period of time between the last overall maintenance action or repair (assuming that this action improved the cladding’s condition to as good-as-new) and the inspection date [8]. This physical degradation curve corresponds to the expression of physical and chemical degradation agents, whose degradation potential can increase over time. A determination coefficient (R2) around 0.78 is achieved, which reveals that 78% of the variance of the severity of degradation of timber claddings is described by the model that only includes the claddings’ age as an explanatory variable. Thus, 22% of the variability of the degradation conditions of timber cladding can be explained by several external factors, which were not analysed in detail in this study.
In this study, the end of the timber claddings’ physical service life occurs when a Sw equal to 20% is reached. A total of five degradation levels (from 0 to 4) have been described concerning the classification of the timber claddings’ degradation [34]. Considering this degradation curve, an average estimated service life can be obtained for the whole sample, which is reached through the intersection between the degradation curve and the limit that determines the end of service life of timber claddings. Following this graphical procedure, an estimated service life of 35 years was achieved as an average value of the sample analysed.
4.2. Functional Service-Life Prediction to Timber Buildings
Concerning the application of the fuzzy model (FBSL2.0) in Chile, a sensitivity analysis was performed in [45,52], to define the minimum and maximum possible values for the proposed model. This previous analysis confirmed that the lowest possible value of the model is nine points, which were obtained in previous applications, in other regions of South Europe (Portugal and Spain) [64,65]. However, the highest possible value for the output (functional service life index) was established in 51 points, for buildings in South Chile (Table 4).
The proposed model —explained in the materials and methods section—presents four variables that specially encompass the location and climatic characteristics of the buildings under analysis: one variable related with the vulnerability of the building (v1-geological location); and three variables related with external hazards (r12-rainfall; r13-temperature; and r14-population growth). In this study, the functional service life model (FBSL2.0) has been applied considering the whole sample located in Valdivia and Niebla cities (commune of Valdivia-Los Ríos region), South Chile. Concerning the fuzzy model application, Table 7 provides information related to the input and output parameters of the 72 timber structures analysed.
In this sense, 5.5% of the sample have reached the highest functionality level, i.e., condition A, where vulnerabilities and risks are regarded as low and, therefore, an intervention or maintenance action is not required, in a short-medium term. A total of 62.5% of the sample are ranged in the middle functionality level (condition B), in which the vulnerabilities and risks are regarded as moderate, where costs and benefits are taken into account and balanced in order to decide when it is necessary to intervene.
The remaining 32.0% of the sample present the lowest functionality level, i.e., condition C, in which the vulnerabilities and risks are regarded as especially aggressive; thus a building inspection and a possible intervention in a short period of time are recommended (Table 7). This kind of data contribute to optimizing budgets and resources, to saving time, and to the use of personnel (professional experts, users, owners, researchers, and private or public administrations) in a more efficient way [66].
4.3. Thermal Building Envelope Simulations
Emphasising the relationship between physical and functional service life, Masters [67] indicates that the concept of functional service life is meaningless unless it is possible to define the functional requirements and demands in a quantitative and perceptible way. The correlation between the physical and functional service life helps to give sufficient information to know the physical and functional performance of buildings’ components. This study gives information to optimize maintenance strategies on buildings and to support decision making. Concerning the end of service life, it corresponds to the instant from which the buildings are unable to fulfil physical and functional requirements, needing a rehabilitation action to restore their original performance features [68]. The relationship between physical (Sw model) and functional (FBSL2.0 model) service life has been corroborated in previous studies considering different types of claddings (natural stone, render, ceramic and paints) emplaced in Portugal, Europe [69].
In this sense, concerning the 23 buildings in functional condition C (FBSL2.0 ≤ 20.0), which have reached the end of their functional service life, a total of eight case studies had also achieved the end of their physical service life (Sw ≥ 20.0%) (Table 8) (Silva and Prieto, 2021). To determine the number of buildings that should be analysed in this study, the Chilean regulation NCh44Of.2007 [70] has been considered, which indicates the number of representative buildings to be selected according to the total number of properties identified. After this analysis, five of the eight case studies (62.5%), which had reached the end of their physical and functional service life, were analysed in detail. Figure 5 and Table 8 show the case studies selected (ID-07, ID-04, ID-41, ID-30 and ID-49) for simulating the three possible levels of intervention, concerning thermal energy insulation.
Zou et al. [71] observe that, currently, there is a lack of strategies focused on the buildings’ energy performance that take into account a life-cycle thinking approach, service life analytical methods, stakeholder’s attributions, or decision criteria and users’ behaviour. In this sense, this study thus intends to simulate the thermal performance of the buildings’ envelope of these five buildings, considering their physical and functional service life. These five case studies have reached the end of their service life, considering both their physical degradation and their functional performance. Usually, façades in these conditions bring about significant negative impacts on the thermal energy performance of buildings [21]. Therefore, in this study, the current thermal energy behaviour of these five case studies and the effect of possible rehabilitation of their thermal envelope, are analysed in detail.
In Figure 6, a simplified characterization of the five case studies selected are shown. The buildings selected are simulated according to the conditions previously described and the annual thermal loads are calculated for all cases. Table 9 shows the ideal thermal loads for the different buildings according to the envelope’s condition.
Currently, the five case studies have a low thermal energy performance mainly due to the high heating loads that are needed to maintain the thermal comfort in the occupants that vary in a range between 204 and 261 kWh/m2*year. Regarding a preliminary analysis between the current conditions and basic reconditioning of thermal loads (Table 9), several variations are observed.
Even for buildings located in the same city and apparently exposed to the same environmental conditions, each building shows slightly different performance in terms of thermal behaviour when subjected to thermal rehabilitation [72]. The case studies present an average improvement of their heating thermal performance of 45.0%. ID-41 presents the highest improvement (49.5%) while ID-30 has the lowest heating thermal performance after rehabilitation (40.5%). Regarding the cooling thermal performance, an average improvement of 30.5% was obtained for the five buildings analysed. The case study ID-04 shows the best cooling improvement (40.4%), while ID-49 shows the lowest cooling improvement (21.8%).
Concerning the comparison between the heating and cooling thermal insulation in the current condition and the deep thermal rehabilitation, the results reveal that a deep thermal rehabilitation leads to an average improvement of the heating thermal performance around 80.2% for the five case studies analysed. ID-41 showed the highest improvement (82.4%) and ID-30 presented the lowest heating thermal improvement (77.7%). An average improvement of cooling thermal performance around 48.4% was obtained for the five case studies. The case study ID-04 had the best cooling improvement (62.6%) and ID-07 was the lowest cooling improvement of 39.4% in relation to the current condition (Table 10).
Table 10 shows the minimum and maximum operative temperatures recorded inside the building for the winter and summer design days, respectively. In accordance with the thermal loads obtained for each case study, the lowest and highest operative temperatures are recorded in all representative buildings with the current condition of their envelope, with an average of 14.0 °C and 30.7 °C, respectively. The results reveal that the rehabilitation of the envelope leads to a greater thermal comfort for the occupants [73]. With basic thermal rehabilitation, average operative temperatures of 15.2 °C and 28.3 °C are recorded, and with deep thermal rehabilitation, average operative temperatures of 16.3 °C and 27.0 °C are recorded.
To compare the thermal comfort of the occupants according to the different case studies, the percentage of hours in which the interior temperature of the buildings is in the range of thermal comfort (18 °C ≤ interior building temperature ≤ 25 °C) is analysed in a whole year. In addition, the percentage of hours in which the occupants feel overheating, and lack of heating is indicated in Table 11.
Table 11 reveals that the current condition of the buildings provides low thermal comfort for the occupants, since they only feel comfortable between 17% to 28% of the year. During 65% to 68% of the time, the occupants perceive a sensation of cold inside the building during the year. Regarding deep thermal rehabilitation, better habitability conditions can be granted to the occupants, since they feel comfortable for a higher percentage (36% to 46%) of time during the year. However, the sensation of cold prevails between 41% to 57% in terms of a year-based analysis.
Analysis of the thermal loads of the buildings under study shows that they have a low thermal performance in relation to their current condition, which is mainly due to heating problems. On average, thermal loads of 235.3 kWh/m2*year for heating and 23.1 kWh/m2*year for cooling are observed for the current condition; thermal loads of 130.4 kWh/m2*year for heating and 16.3 kWh/m2*year for cooling are obtained for basic thermal rehabilitation; and thermal loads of 46.7 kWh/m2*year for heating and 12.2 kWh/m2*year for cooling are estimated for deep thermal rehabilitation. Moreover, in the current condition of the envelope, the lowest operative temperatures are recorded for the winter design day and the highest for the summer design day, which is reflected in the thermal comfort of the occupants, since in the current condition, the residents only feel comfortable in 17% to 28% of the year, while with deep thermal rehabilitation, residents feel comfortable in 36% to 46% of the year. Despite this, a feeling of cold would still predominant during the year. By improving the current condition of the thermal envelope, the thermal energy performance of the buildings analysed is considerably improved. This demonstrates the importance of energy rehabilitation interventions in heritage buildings for optimal comfort of the occupants [73]. Thus, the optimisation of energy consumption in buildings reveals several benefits in terms of economic efficiency, ecological impact, thermal comfort, and also indoor-outdoor air quality. This is a first approach intended to preliminarily evaluate the impact of an intervention on the energy-thermal performance of buildings, which can help to optimize maintenance strategies on buildings and to support future decision-making [74].
5. Conclusions and Future Research Work
Two methodologies for analysing the service life of 72 buildings were proposed. The first one was focused on the physical degradation of buildings’ envelope. The second one studied the overall functional service life of the buildings as a whole. Both methods allow identification of ‘when and how to intervene in the case studies that have reached the end of their service life’ that would require a possible partial or total intervention of their envelopes in order to recover their physical and functional service life, while enhancing thermal performance. For this, three simulations in different scenarios of thermal energy improvement of five case studies that had already reached the end of their physical and functional service life were considered. In a comparison between the current buildings’ conditions and basic or deep thermal rehabilitation simulation, the results reveal that the rehabilitation of the envelope leads to better habitability conditions. Occupants could feel more comfortable between 26% to 31% of the year, when a basic thermal rehabilitation is performed, while when a deep thermal rehabilitation is carried out, the thermal comfort is improved to 36% to 46% of the year. The results reveal that the thermal rehabilitation of the envelope presents a significant improvement of the current thermal energy performance of the case studies under analysis.
The main purpose of this kind of approach is to contribute to the Atmostpheric Decontamination Plan (ADP) of the saturated area of Valdivia (Los Rios region). This study contributes mainly to two specific areas: the first relies on the identification of buildings that have already achieved their physical and functional service life, so a preventive intervention should be proposed to improve their service life parameters; and the second corresponds to contribute towards improve the thermal insulation of buildings’ envelope located in southern Chile, which present low energy thermal efficiency performance. The reduction of emissions associated with decontamination plans presents economic, social and environmental effects, which are summarized in benefits for the community as a whole (owners, users, governors—in short, inhabitants of the locality). The potential impact of this study concerns the idea to promote limited intervention on the envelopes of the houses located in southern regions of Chile, in the face of a greater consumption of natural resources (firewood) in order to heat the indoor spaces of dwellings.
The current research work presents some limitations, namely: the study has been focused on the analysis of a particular local context in South America (Valdivia, Chile) considering very specific architectural, cultural, social, environmental and natural context; and currently the models require information from in-situ professional experts’ inspections. In future research works, new developments and applications of the methodologies will need specific adaptations regarding detailed analysis of the several variables involved and also to evaluate the incorporation of monitoring of building data.
Author Contributions
A.J.P., A.S., F.T. and M.C. took part in the entire researching process. All authors have read and agreed to the published version of the manuscript.
Funding
The paper was also funded by Agencia Nacional de Investigación y Desarrollo (ANID) of Chile throughout the research projects ANID FONDECYT 11190554 and ANID FONDECYT 1201052.
Institutional Review Board Statement
Not applicable.
Informed Consent Statement
Not applicable.
Data Availability Statement
Data are provided upon request to the corresponding author.
Acknowledgments
The authors gratefully acknowledge the support of Agencia Nacional de Investigación y Desarrollo (ANID) of Chile throughout the research projects ANID FONDECYT 11190554; ANID FONDECYT 1201052 and ANID BASAL FB210015 CENAMAD. This study also was the support of CERIS Research Institute of Instituto Superior Técnico, University of Lisbon, and the FCT (Foundation for Science and Technology) through project Best Maintenance-Lower Risks (PTDC/ECI-CON/29286/2017).
Conflicts of Interest
The authors declare no conflict of interest.
References
- ISO 15686-1:2011; Buildings and Constructed Assets—Service life planning—Part 1: General Principles and Framework. International Organization for Standardization: Geneva, Switzerland, 2011.
- Van Niekerk, P.B.; Brischke, C.; Niklewski, J. Estimating the service life of timber structures concerning risk and influence of fungal decay—A review of existing theory and modelling approaches. Forests 2021, 12, 588. [Google Scholar] [CrossRef]
- Silva, A.; de Brito, J.; Gaspar, P.L. Methodologies for Service Life Prediction of Buildings; Springer: Berlin/Heidelberg, Germany, 2016. [Google Scholar] [CrossRef]
- Rikey, M.; Cotgrave, A. The context of maintenance. In Construction Technology; Bloomsbury Visual Arts: London, UK, 2005. [Google Scholar]
- Sjöström, C. Overview of methodologies for prediction of service life. In Problems in Service Life Prediction of Building and Construction Materials; Springer: Dordrecht, The Netherland, 1985; pp. 3–20. [Google Scholar]
- ISO 15686-4:2014; Building Construction—Service Life Planning—Part 4: Service Life Planning using Building Information Modelling. International Organization for Standardization: Geneva, Switzerland, 2014; p. 34.
- Aikivuori, A.M. Critical loss of performance—What fails before durability. In Proceedings of the Eighth International Conference on Durability of Building Materials and Components, 8 dbmc, Vancouver, BC, Canada, 30 May–3 June 1999; pp. 1369–1376. [Google Scholar]
- Silva, A.; Prieto, A.J. Modelling the service life of timber claddings using the factor method. J. Build. Eng. 2021, 37, 102137. [Google Scholar] [CrossRef]
- Kirkham, R.J.; Boussabaine, A.H. Forecasting the residual service life of NHS hospital buildings: A stochastic approach. Constr. Manag. Econ. 2005, 23, 521–529. [Google Scholar] [CrossRef]
- Thomsen, A.; Van Der Flier, K. Understanding obsolescence: A conceptual model for buildings. Build. Res. Inf. 2011, 39, 352–362. [Google Scholar] [CrossRef] [Green Version]
- Flores-Colen, I.; De Brito, J. A systematic approach for maintenance budgeting of buildings faades based on predictive and preventive strategies. Constr. Build. Mater. 2010, 24, 1718–1729. [Google Scholar] [CrossRef]
- Sahu, M.; Bhattacharjee, B.; Kaushik, S.C. Thermal design of air-conditioned building for tropical climate using admittance method and genetic algorithm. Energy Build. 2012, 53, 1–6. [Google Scholar] [CrossRef]
- Asadi, S.; Amiri, S.S.; Mottahedi, M. On the development of multi-linear regression analysis to assess energy consumption in the early stages of building design. Energy Build. 2014, 85, 246–255. [Google Scholar] [CrossRef]
- Wang, L.; Wong Nyuk, H.; Li, S. Facade design optimization for naturally ventilated residential buildings in Singapore. Energy Build. 2007, 39, 954–961. [Google Scholar] [CrossRef]
- Stavrakakis, G.M.; Zervas, P.L.; Sarimveis, H.; Markatos, N.C. Optimization of window-openings design for thermal comfort in naturally ventilated buildings. Appl. Math. Model. 2012, 36, 193–211. [Google Scholar] [CrossRef]
- Shen, E.; Hu, J.; Patel, M. Energy and visual comfort analysis of lighting and daylight control strategies. Build. Environ. 2014, 78, 155–170. [Google Scholar] [CrossRef]
- Cheng, Y.; Zhang, S.; Huan, C.; Oladokun, M.O.; Lin, Z. Optimization on fresh outdoor air ratio of air conditioning system with stratum ventilation for both targeted indoor air quality and maximal energy saving. Build. Environ. 2019, 147, 11–22. [Google Scholar] [CrossRef] [Green Version]
- Ihm, P.; Krarti, M. Design optimization of energy efficient residential buildings in Tunisia. Build. Environ. 2012, 58, 81–90. [Google Scholar] [CrossRef]
- Bolattürk, A. Determination of optimum insulation thickness for building walls with respect to various fuels and climate zones in Turkey. Appl. Therm. Eng. 2006, 26, 1301–1309. [Google Scholar] [CrossRef]
- Ucar, A.; Balo, F. Determination of the energy savings and the optimum insulation thickness in the four different insulated exterior walls. Renew. Energy 2010, 35, 88–94. [Google Scholar] [CrossRef]
- Verichev, K.; Zamorano, M.; Carpio, M. Effects of climate change on variations in climatic zones and heating energy consumption of residential buildings in the southern Chile. Energy Build. 2020, 215, 109874. [Google Scholar] [CrossRef]
- Verichev, K.; Zamorano, M.; Fuentes-Sepúlveda, A.; Cárdenas, N.; Carpio, M. Adaptation and mitigation to climate change of envelope wall thermal insulation of residential buildings in a temperate oceanic climate. Energy Build. 2021, 235, 1107199. [Google Scholar] [CrossRef]
- Poza-Casado, I.; Cardoso, V.E.M.; Almeida, R.M.S.F.; Meiss, A.; Ramos, N.M.M.; Padilla-Marcos, M.Á. Residential buildings airtightness frameworks: A review on the main databases and setups in Europe and North America. Build. Environ. 2020, 183, 107221. [Google Scholar] [CrossRef]
- Rodríguez-Jiménez, C.E.; Carretero-Ayuso, M.J.; Claro-Ponce, J.C. Influencia de las infiltraciones en la rehabilitación energética de la envolvente. El caso del plan de actuaciones en el parque público residencial de Andalucía. Informes de la Construcción 2018, 70, 271. [Google Scholar] [CrossRef]
- WHO. World Health Organization; WHO: Geneva, Switzerland, 2021. [Google Scholar]
- Gobierno de Chile. Ministerio de Medio Ambiente—Planes de Descontaminación Atmosférica; Gobierno de Chile: Santiago, Chile, 2021.
- Ministerio de Vivienda y Urbanismo. Plan de Descontaminación Atmosférica de la Comuna de Valdivia. Available online: https://ppda.mma.gob.cl/los-rios/pda-para-la-comuna-valdivia/ (accessed on 17 June 2022).
- Silva, L.T.; Mendes, J.F.G. City Noise-Air: An environmental quality index for cities. Sustain. Cities Soc. 2012, 4, 1–11. [Google Scholar] [CrossRef]
- Gielen, D.; Boshell, F.; Saygin, D.; Bazilian, M.D.; Wagner, N.; Gorini, R. The role of renewable energy in the global energy transformation. Energy Strateg. Rev. 2019, 24, 38–50. [Google Scholar] [CrossRef]
- González-Reyes, Á.; Muñoz, A.A. Cambios en la precipitación de la ciudad de Valdivia (Chile) durante los últimos 150 años. Bosque 2013, 34, 191–200. [Google Scholar] [CrossRef] [Green Version]
- Prado, F.; D’Alençon, R.; Kramm, F. Arquitectura alemana en el sur de Chile: Importación y desarrollo de patrones tipológicos, espaciales y constructivos. Revista la Construcción 2011, 10, 104–121. [Google Scholar] [CrossRef]
- Saelzer, G. Luis Oyarzún House. Project of Heritage Intervention (Dirección); Universidad Austral de Chile: Valdivia, Chile, 2018. [Google Scholar]
- Báez-Montenegro, A.; Bedate, A.M.; Herrero, L.C.; Sanz, J. Ángel Inhabitants’ willingness to pay for cultural heritage: A case study in valdivia, chile, using contingent valuation. J. Appl. Econ. 2012, 15, 235–258. [Google Scholar] [CrossRef]
- Prieto, A.J.; Silva, A. Service life prediction and environmental exposure conditions of timber claddings in South Chile. Build. Res. Inf. 2020, 48, 191–206. [Google Scholar] [CrossRef]
- Gaspar, P.L.; De Brito, J. Service life estimation of cement-rendered facades. Build. Res. Inf. 2008, 36, 44–55. [Google Scholar] [CrossRef]
- Ramos, R.; Silva, A.; de Brito, J.; Lima Gaspar, P. Methodology for the service life prediction of ceramic claddings in pitched roofs. Constr. Build. Mater. 2018, 166, 386–399. [Google Scholar] [CrossRef]
- Maia, M.; Morais, R.; Silva, A. Application of the factor method to the service life prediction of window frames. Eng. Fail. Anal. 2020, 109, 1–34. [Google Scholar] [CrossRef]
- Zadeh, L.A. Fuzzy sets. Inf. Control 1965, 8, 338–353. [Google Scholar] [CrossRef] [Green Version]
- Fayek, A.R. Fuzzy Logic and Fuzzy Hybrid Techniques for Construction Engineering and Management. J. Constr. Eng. Manag. 2020, 146, 04020064, 1–11. [Google Scholar] [CrossRef]
- Ward, S.; Chapman, C. Transforming project risk management into project uncertainty management. Int. J. Proj. Manag. 2003, 21, 97–105. [Google Scholar] [CrossRef]
- Jiang, L.S.; Liao, H. Mixed fuzzy least absolute regression analysis with quantitative and probabilistic linguistic information. Fuzzy Sets Syst. 2020, 387, 35–48. [Google Scholar] [CrossRef]
- Macías-Bernal, J.M.; Calama-Rodríguez, J.M.; Chávez-de Diego, M.J. Modelo de predicción de la vida útil de la edificación patrimonial a partir de la lógica difusa. Inf. la Constr. 2014, 66, 1–11. [Google Scholar] [CrossRef] [Green Version]
- ISO 31000; Risk Management—Principles and Guidelines. International Organization for Standardization: Geneva, Switzerland, 2009.
- Prieto Ibáñez, A.J.; Macías Bernal, J.M.; Chávez de Diego, M.J.; Alejandre Sánchez, F.J. Expert system for predicting buildings service life under ISO 31000 standard. Application in architectural heritage. J. Cult. Herit. 2016, 18, 209–218. [Google Scholar] [CrossRef]
- Prieto, A.J.; Verichev, K.; Silva, A.; de Brito, J. On the impacts of climate change on the functional deterioration of heritage buildings in South Chile. Build. Environ. 2020, 183, 107138. [Google Scholar] [CrossRef]
- Thaker, S.; Nagori, V. Analysis of Fuzzification Process in Fuzzy Expert System. Procedia Comput. Sci. 2018, 132, 1308–1316. [Google Scholar] [CrossRef]
- Li, Y.; Deng, J.M.; Wei, M.Y. Meaning and precision of adaptive fuzzy systems with Gaussian-type membership functions. Fuzzy Sets Syst. 2002, 127, 85–97. [Google Scholar] [CrossRef]
- Kao, C.; Liu, S.T. Fuzzy efficiency measures in data envelopment analysis. Fuzzy Sets Syst. 2000, 113, 427–437. [Google Scholar] [CrossRef]
- Assilian, S.; Mamdani, E. A Fuzzy Logic Controller for a Dynamic Plant; Queen Mary College: Lahore, Pakistan, 1973. [Google Scholar]
- Nageshrao, S.; Costa, B.; Filev, D. Interpretable approximation of a deep reinforcement learning agent as a set of if-then rules. In Proceedings of the 18th IEEE International Conference on Machine Learning and Applications, ICMLA, Boca Raton, FL, USA, 16–19 December 2019; pp. 216–221. [Google Scholar] [CrossRef]
- Arun, N.K.; Mohan, B.M. Modeling, stability analysis, and computational aspects of some simplest nonlinear fuzzy two-term controllers derived via center of area/gravity defuzzification. ISA Trans. 2017, 70, 16–29. [Google Scholar] [CrossRef]
- Prieto, A.J.; Verichev, K.; Carpio, M. Heritage, resilience and climate change: A fuzzy logic application in timber-framed masonry buildings in Valparaíso, Chile. Build. Environ. 2020, 174, 106657. [Google Scholar] [CrossRef]
- NZS 4218:2009; Thermal Insulation—Housing and Small Buildings. Department of Building and Housing: Nelson, New Zealand, 2009.
- White Box Technologies. White Box Technologies Weather. Available online: http://weather.whiteboxtechnologies.com/ (accessed on 17 August 2020).
- Meterological Direction of Chile. Available online: http://www.meteochile.gob.cl (accessed on 17 June 2022).
- International Organization for Standardization. ISO 15927-4:2005—Hygrothermal Performance Of Buildings—Calculation and Presentation of Climatic Data—Part 4: Hourly Data for Assessing the Annual Energy Use for Heating and Cooling. Available online: https://www.iso.org/standard/41371.html (accessed on 17 June 2022).
- Ministerio de Vivienda y Urbanismo. Manuales CEV | Calificacion Energetica de Viviendas; MINVU: Santiago, Chile, 2018.
- Ministerio de Vivienda y Urbanismo. Manual de Aplicación de la Certificación de Vivienda Sustentable; MINVU: Santiago, Chile, 2019.
- Ministerio de Vivienda y Urbanismo. Estándares de Construcción Sustentable Para Vivienda de Chile; MINVU: Santiago, Chile, 2018.
- Trimble Inc. SketchUp. Available online: https://www.sketchup.com/license/e/sketchup (accessed on 17 June 2018).
- National Renewable Energy Laboratory. Euclid. Available online: https://bigladdersoftware.com/projects/euclid/ (accessed on 17 August 2017).
- United States Department of Energy. Energy Plus Simulation Program: Vol. V. 7.1.0. Available online: http://apps1.eere.energy.gov (accessed on 17 June 2022).
- Shohet, I.M.; Rosenfeld, Y.; Puterman, M.; Gilboa, E. Deterioration Patterns for Maintenance Management—A Methodological Approach; Institute for Research in Construction: Ottawa, ON, Canada, 1999; pp. 1666–1678. [Google Scholar]
- Prieto, A.J.; Silva, A.; de Brito, J.; Macias-Bernal, J.M. Serviceability of facade claddings. Build. Res. Inf. 2018, 46, 179–190. [Google Scholar] [CrossRef]
- Prieto, A.J.; Macías-Bernal, J.M.; Chávez, M.-J.; Alejandre, F.J.; Silva, A. Impact of Maintenance, Rehabilitation, and Other Interventions on Functionality of Heritage Buildings. J. Perform. Constr. Facil. 2019, 33, 279–286. [Google Scholar] [CrossRef]
- Sawhney, A.; Riley, M.; Irizarry, J. Construction 4.0: An Innovation Platform for the Built Environment; Routledge: London, UK; Taylor & Francis Group: Abingdon, UK, 2020. [Google Scholar]
- Masters, L.W. Problems in Service Life Prediction of Building and Construction Materials; Springer Science & Business Media: Berlin, Germany, 2012. [Google Scholar]
- Prieto, A.J.; Silva, A.; de Brito, J.; Alejandre, F.J. Functional and physical service life of natural stone claddings. J. Mater. Civ. Eng. 2016, 28, 01016150. [Google Scholar] [CrossRef]
- Torres-Gonzalez, M.; Prieto, A.J.; Alejandre, F.J.; Blasco-l, F.J. Digital Management Focused on the Preventive Maintenance of World Heritage Sites. Automation in Construction. 2021, 129, 103813. [Google Scholar] [CrossRef]
- Instituto Nacional de Normalización. NCh 44. Of2007. Procedimientos de Muestreo Para Inspección Por Atributos—Planes de Muestreo Indexados Por Nivel de Calidad Aceptable (AQL) Para la Inspección Lote por Lote; Instituto Nacional de Normalización: Santiago, Chile, 2007. [Google Scholar]
- Zou, P.X.W.; Xu, X.; Sanjayan, J.; Wang, J. Review of 10 years research on building energy performance gap: Life-cycle and stakeholder perspectives. Energy Build. 2018, 178, 165–181. [Google Scholar] [CrossRef]
- Al-Sanea, S.A.; Zedan, M.F. Improving thermal performance of building walls by optimizing insulation layer distribution and thickness for same thermal mass. Appl. Energy 2011, 88, 3113–3124. [Google Scholar] [CrossRef]
- Carpio, M.; López-Ochoa, L.M.; Las-Heras-Casas, J.; Verichev, K. Influence of heating degree day calculation methods in designing the thermal envelope of buildings. J. Build. Eng. 2022, 46, 103604. [Google Scholar] [CrossRef]
- Madrazo, L.; Sicilia, A.; Massetti, M.; Plazas, F.L.; Ortet, E. Enhancing energy performance certificates with energy related data to support decision making for building retrofitting. Therm. Sci. 2018, 22, 957–969. [Google Scholar] [CrossRef] [Green Version]
Figure 1.
Research methodological sequence.

Figure 2.
Location of the 72 case studies analysed in South Chile.

Figure 3.
A random selection of the 72 case studies under analysis.

Figure 4.
Physical degradation curve obtained for the 72 timber claddings examined.

Figure 5.
Five case studies (ID-07 to ID-49) that have reached the end of their physical and functional service life.
Figure 5.
Five case studies (ID-07 to ID-49) that have reached the end of their physical and functional service life.

Figure 6.
Simplified characterization of the case studies under thermal energy analysis.


Table 1.
Emissions inventory according to the General Analysis of the Economic and Social Impact (GAESI), based on the year 2013 [27] (ADP, 2017).
Table 1.
Emissions inventory according to the General Analysis of the Economic and Social Impact (GAESI), based on the year 2013 [27] (ADP, 2017).
| Sector | Emissions (Ton/Year) | |||||
|---|---|---|---|---|---|---|
| MP10 | MP2.5 | SO2 | NOx | NH3 | CO | |
| Residential/Housing | 7375 | 7171 | 55 | 359 | 304 | 178,457 |
| Burns and forest fires | 22 | 21 | 1 | 7 | 0 | 128 |
| Fixed sources | 439 | 376 | 293 | 670 | 0 | 292 |
| Mobile sources on the road | 16 | 15 | 3 | 490 | 11 | 704 |
| Fugitive sources | 282 | 41 | 0 | 0 | 0 | 0 |
| TOTAL | 8134 | 7624 | 352 | 1526 | 315 | 179,581 |
Table 2.
Vulnerability input variables description.
| Vulnerabilities | Ids | Quantitative Valuation (Very Good/Medium/Very Bad) | Qualitative Valuation (Very Good/Medium/Very Bad) | Description |
|---|---|---|---|---|
| Geological location | v1 | 1.0/2.5/4.0 | Favourable/Medium-Regular/Unfavourable | Best geological location in terms of ground conditions and stability/Acceptable level of geological condition in terms ground conditions and stability/Unfavourable geological condition in terms of ground conditions and stability. |
| Roof design | v2 | 1.0/4.5/8.0 | Favourable/Medium-Regular/Unfavourable | Fast evacuation of water/Normal evacuation of water/Very complex water evacuation/Acceptable level of water evacuation/Slow water evacuation. |
| Environmental conditions | v3 | 1.0/4.5/8.0 | Favourable/Medium-Regular/Unfavourable | Building without any construction around it/Medium valuation between optimal and the worst possible situations/Building emplaced inside of the built heritage urban traces and with the existence of several complex constructions around it. |
| Construction system | v4 | 1.0/4.5/8.0 | Favourable/Medium-Regular/Unfavourable | Optimal level-uniform construction system features/Medium level-between uniform and completely heterogeneous characteristics of construction system/bad level-heterogeneous characteristics of construction system. |
| Preservation | v5 | 1.0/4.5/8.0 | Favourable/Medium-Regular/Unfavourable | Optimal state of conservation (very good situation)/Normal state of conservation (medium situation)/Neglected state of conservation (bad situation). |
Table 3.
Static-structural, atmospheric and anthropic hazards input variables description.
| Hazards | Ids | Quantitative Valuation (Very Good/Medium/Very Bad) | Qualitative Valuation (Very Good/Medium/Very Bad) | Description |
|---|---|---|---|---|
| Static-structural | ||||
| Load state modification | r6 | 1.0/4.5/8.0 | Favourable/Medium-Regular/Unfavourable | Apparent modification/Symmetric and balanced modification/Disorderly modification. |
| Live loads | r7 | 1.0/4.5/8.0 | Favourable/Medium-Regular/Unfavourable | Live load below than the original level/Live load equal than the original level/Live load higher than the original level. |
| Ventilation | r8 | 1.0/4.5/8.0 | Favourable/Medium-Regular/Unfavourable | Natural cross-ventilation in all areas/Natural cross-ventilation just some areas/Natural cross-ventilation nowhere. |
| Facilities | r9 | 1.0/4.5/8.0 | Favourable/Medium-Regular/Unfavourable | All facilities are in use/Some facilities are in use or they are not ready to be used/The facilities cannot be used. |
| Fire | r10 | 1.0/4.5/8.0 | Favourable/Medium-Regular/Unfavourable | Low fire load in relation with combustible structure/Medium fire load in relation with combustible structure/High fire load in relation with combustible structure. |
| Inner environment | r11 | 1.0/4.5/8.0 | Favourable/Medium-Regular/Unfavourable | Maximum level of health, cleanliness and hygiene of the building’s spaces/Medium level of health, cleanliness and hygiene of the building’s spaces/Low level of health, cleanliness and hygiene of the building’s spaces. |
| Atmospheric | ||||
| Precipitation (Average annual precipitation (mm)) | r12 | 1.0/4.5/8.0 | Favourable/Medium-Regular/Unfavourable | Location with very low annual rainfall (<500 mm)/Location with medium annual rainfall (500–5000 mm)/Location with maximum annual rainfall (>5000 mm) |
| Temperature (Average annual temperature (°C)) | r13 | 1.0/4.5/8.0 | Favourable/Medium-Regular/Unfavourable | Area with low temperature differences (>18.0 °C)/Area with medium temperature differences (18–5 °C)/Area with maximum temperature differences (<5 °C) |
| Anthropic | ||||
| Population growth | r14 | 1.0/4.5/8.0 | Favourable/Medium-Regular/Unfavourable | Population growth greater than 15%/Population growth around 0%/Population growth less than 5%. |
| Heritage value | r15 | 1.0/4.5/8.0 | Favourable/Medium-Regular/Unfavourable | Properties with great historical value/Properties with normal historical value/Properties with low historical value. |
| Furniture value | r16 | 1.0/4.5/8.0 | Favourable/Medium-Regular/Unfavourable | Social, cultural and liturgical appreciation (high value)/Social, cultural and liturgical appreciation (normal value)/Social, cultural and liturgical appreciation (low value). |
| Occupancy | r17 | 1.0/4.5/8.0 | Favourable/Medium-Regular/Unfavourable | High occupancy in the building/Media occupancy in the building/Low occupancy in the building. |
Table 4.
Functional degradation conditions regarding the context of South Chile (data sourced from (Prieto, Verichev and Carpio, 2020)).
Table 4.
Functional degradation conditions regarding the context of South Chile (data sourced from (Prieto, Verichev and Carpio, 2020)).
| Conditions | Colour | Levels | Ranges | Description |
|---|---|---|---|---|
| A | Green | Upper level | [51–30%] | Building presents an acceptable functionality level. No intervention is recommended. |
| B | Orange | Middle level | [30–20%] | Building displays a situation in which the set of costs and benefits of preventive measures must be taken into account and balanced. Periodical inspections are recommended. |
| C | Red | Lower level | [20–09%] | Building presents a high priority of intervention. Intervention is recommended in a short period of time. |
Table 5.
Modelling conditions for thermal energy simulations.
| Category | Parameters |
|---|---|
| Temperature control * | Setpoint heating temperature: 18 °C |
| Setpoint cooling temperature: 25 °C | |
| Air-conditioning system | COP heating temperature: 1.0 |
| COP cooling temperature: 1.0 | |
| Occupants * | Internal load: 3 W/m2 |
| Lighting and equipment * | Internal load: 24.5 W/m2 |
| Ventilation ** | 0.5 ACH @50 Pa |
| Climatic file | Valdivia city |
Notes: * standard NZs, ** CEV [57].
Table 6.
Definition of the thermal energy conditions.
| Levels of Intervention | Characteristics of the Envelope | ||||
|---|---|---|---|---|---|
| Walls | Roof | Floor | Windows | Infiltrations | |
| Current condition | Wood veneer [12 mm] | Metal sheet [0.2 mm] | Slab above ground [100 mm] | Monolithic glass | 18 ACH @50 Pa |
| Oriented strand board [11 mm] | U = 5.7 W/m2K | ||||
| Air chamber | Air chamber | SHGC = 0.8 | |||
| Wood veneer [12 mm] | Wood veneer [12 mm] | ||||
| Basic thermal rehabilitation | Wood veneer [12 mm] | Metal sheet [0.2 mm] | Slab above ground [100 mm] | Monolithic glass | 10 ACH @50 Pa |
| Oriented strand board [11 mm] | U = 5.7 W/m2K | - | |||
| Expanded polystyrene [10 mm] | Expanded polystyrene [60 mm] | SHGC = 0.8 | |||
| Wood veneer [12 mm] | Wood veneer [12 mm] | ||||
| Deep thermal rehabilitation | Wood veneer [12 mm] | Metal sheet [0.2 mm] | Slab above ground [100 mm] | Double glass | 5 ACH @50 Pa |
| Oriented strand board [11 mm] | U = 2.4 W/m2K | ||||
| Expanded polystyrene [60 mm] | Expanded polystyrene [100 mm] | SHGC = 0.7 | |||
| Wood veneer [12 mm] | Wood veneer [12 mm] | ||||
Table 7.
Functional condition of the 72 timber buildings examined.
| ID | v1 | v2 | v3 | v4 | v5 | r6 | r7 | r8 | r9 | r10 | r11 | r12 | r13 | r14 | r15 | r16 | r17 | FBSL2.0 | Conditions |
|---|---|---|---|---|---|---|---|---|---|---|---|---|---|---|---|---|---|---|---|
| 67 | 4.0 | 2.0 | 4.0 | 2.0 | 6.6 | 4.0 | 1.0 | 8.0 | 7.5 | 7.0 | 5.0 | 6.0 | 5.0 | 4.0 | 7.0 | 7.5 | 8.0 | 9.30 | C |
| 32 | 4.0 | 3.5 | 4.5 | 3.4 | 5.6 | 1.5 | 3.5 | 5.5 | 5.5 | 6.5 | 5.0 | 6.0 | 5.0 | 4.0 | 7.5 | 6.5 | 6.5 | 11.24 | C |
| 48 | 4.0 | 2.5 | 5.0 | 2.0 | 7.2 | 2.0 | 3.5 | 7.5 | 7.5 | 7.5 | 5.0 | 6.0 | 5.0 | 4.0 | 6.5 | 7.5 | 8.0 | 12.67 | C |
| 7 | 4.0 | 5.0 | 5.6 | 5.2 | 6.6 | 5.6 | 5.6 | 5.2 | 7.0 | 7.0 | 5.0 | 6.0 | 5.0 | 4.0 | 1.0 | 7.0 | 6.0 | 17.88 | C |
| 4 | 4.0 | 4.6 | 4.0 | 2.4 | 6.6 | 3.0 | 5.6 | 8.0 | 6.4 | 7.0 | 5.0 | 6.0 | 5.0 | 4.0 | 1.0 | 7.0 | 7.0 | 18.10 | C |
| 6 | 4.0 | 6.6 | 6.4 | 4.4 | 4.6 | 4.6 | 4.0 | 6.0 | 5.0 | 6.6 | 5.0 | 6.0 | 5.0 | 4.0 | 1.0 | 6.0 | 6.0 | 18.37 | C |
| 63 | 4.0 | 3.6 | 6.3 | 3.6 | 5.8 | 5.5 | 6.5 | 6.5 | 5.5 | 8.0 | 5.0 | 6.0 | 5.0 | 4.0 | 7.5 | 7.0 | 4.5 | 18.51 | C |
| 62 | 4.0 | 3.0 | 4.8 | 2.0 | 6.3 | 4.0 | 3.5 | 6.0 | 4.5 | 7.8 | 5.0 | 6.0 | 5.0 | 4.0 | 7.0 | 7.0 | 6.5 | 18.93 | C |
| 45 | 4.0 | 1.2 | 4.0 | 2.5 | 6.2 | 1.5 | 3.5 | 5.5 | 5.5 | 6.0 | 5.0 | 6.0 | 5.0 | 4.0 | 7.5 | 7.5 | 6.0 | 18.98 | C |
| 54 | 4.0 | 4.2 | 5.2 | 2.2 | 5.7 | 1.5 | 3.5 | 5.5 | 4.0 | 7.0 | 5.0 | 6.0 | 5.0 | 4.0 | 6.5 | 6.5 | 6.0 | 19.25 | C |
| 69 | 4.0 | 3.5 | 5.0 | 3.0 | 5.1 | 5.5 | 5.0 | 5.5 | 6.0 | 8.0 | 5.0 | 6.0 | 5.0 | 4.0 | 6.0 | 6.0 | 4.5 | 19.26 | C |
| 28 | 4.0 | 3.0 | 4.2 | 4.5 | 6.0 | 3.5 | 3.5 | 4.5 | 4.5 | 6.0 | 5.0 | 6.0 | 5.0 | 4.0 | 6.5 | 7.0 | 5.5 | 19.27 | C |
| 29 | 4.0 | 3.0 | 4.2 | 4.5 | 6.0 | 3.5 | 3.5 | 4.5 | 4.5 | 6.0 | 5.0 | 6.0 | 5.0 | 4.0 | 6.5 | 7.0 | 5.5 | 19.27 | C |
| 72 | 4.0 | 2.0 | 5.0 | 2.2 | 5.4 | 2.0 | 2.0 | 6.5 | 4.0 | 7.0 | 5.0 | 6.0 | 5.0 | 4.0 | 7.0 | 6.5 | 7.0 | 19.31 | C |
| 41 | 4.0 | 3.0 | 5.0 | 2.0 | 6.5 | 4.5 | 5.5 | 6.0 | 6.5 | 7.0 | 5.0 | 6.0 | 5.0 | 4.0 | 7.0 | 6.5 | 4.5 | 19.38 | C |
| 44 | 4.0 | 3.0 | 4.2 | 2.2 | 5.7 | 1.5 | 1.5 | 6.5 | 6.5 | 5.5 | 5.0 | 6.0 | 5.0 | 4.0 | 5.0 | 7.0 | 6.5 | 19.38 | C |
| 71 | 4.0 | 4.2 | 4.8 | 3.8 | 5.9 | 5.0 | 3.5 | 6.5 | 5.5 | 7.8 | 5.0 | 6.0 | 5.0 | 4.0 | 7.6 | 7.0 | 5.0 | 19.39 | C |
| 30 | 4.0 | 1.5 | 4.5 | 2.4 | 6.0 | 2.0 | 3.5 | 4.5 | 3.5 | 6.0 | 5.0 | 6.0 | 5.0 | 4.0 | 7.0 | 6.5 | 5.0 | 19.41 | C |
| 2 | 4.0 | 4.8 | 6.4 | 4.6 | 4.9 | 4.8 | 5.2 | 6.0 | 4.8 | 7.0 | 5.0 | 6.0 | 5.0 | 4.0 | 1.0 | 4.6 | 4.0 | 19.62 | C |
| 26 | 4.0 | 2.5 | 6.5 | 2.5 | 5.6 | 3.5 | 3.5 | 5.5 | 4.5 | 6.5 | 5.0 | 6.0 | 5.0 | 4.0 | 7.5 | 5.5 | 4.5 | 19.62 | C |
| 8 | 4.0 | 4.8 | 4.4 | 4.2 | 4.5 | 5.5 | 3.8 | 7.0 | 5.5 | 7.0 | 5.0 | 6.0 | 5.0 | 4.0 | 1.0 | 5.5 | 7.0 | 19.64 | C |
| 49 | 4.0 | 2.8 | 4.5 | 2.2 | 7.0 | 2.0 | 2.0 | 5.5 | 4.5 | 6.5 | 5.0 | 6.0 | 5.0 | 4.0 | 4.5 | 6.5 | 5.0 | 19.65 | C |
| 50 | 4.0 | 1.4 | 3.2 | 2.8 | 6.8 | 1.5 | 3.5 | 7.5 | 7.5 | 5.0 | 5.0 | 6.0 | 5.0 | 4.0 | 6.0 | 7.5 | 7.5 | 19.81 | C |
| 11 | 4.0 | 5.0 | 4.2 | 3.5 | 3.7 | 5.5 | 3.2 | 5.5 | 3.0 | 6.2 | 5.0 | 6.0 | 5.0 | 4.0 | 1.0 | 2.0 | 3.0 | 20.70 | B |
| 1 | 4.0 | 7.6 | 5.2 | 4.4 | 5.1 | 5.0 | 4.4 | 6.0 | 5.2 | 6.0 | 5.0 | 6.0 | 5.0 | 4.0 | 1.0 | 2.6 | 3.2 | 20.78 | B |
| 66 | 4.0 | 3.0 | 3.5 | 1.5 | 3.3 | 4.5 | 5.5 | 4.5 | 2.0 | 7.5 | 5.0 | 6.0 | 5.0 | 4.0 | 5.0 | 4.0 | 2.5 | 20.80 | B |
| 10 | 4.0 | 5.8 | 4.2 | 3.5 | 3.1 | 6.0 | 5.5 | 5.5 | 3.0 | 6.2 | 5.0 | 6.0 | 5.0 | 4.0 | 1.0 | 3.0 | 3.0 | 20.87 | B |
| 34 | 4.0 | 2.0 | 3.5 | 2.3 | 5.4 | 3.0 | 3.5 | 5.5 | 3.5 | 5.5 | 5.0 | 6.0 | 5.0 | 4.0 | 7.0 | 6.5 | 6.0 | 20.90 | B |
| 5 | 4.0 | 3.6 | 5.6 | 2.4 | 4.8 | 4.4 | 3.6 | 5.4 | 3.2 | 7.0 | 5.0 | 6.0 | 5.0 | 4.0 | 1.0 | 6.4 | 5.0 | 20.98 | B |
| 3 | 4.0 | 4.4 | 4.0 | 3.2 | 4.1 | 4.4 | 3.6 | 5.0 | 3.0 | 6.4 | 5.0 | 6.0 | 5.0 | 4.0 | 1.0 | 6.0 | 4.4 | 21.06 | B |
| 51 | 4.0 | 3.5 | 4.0 | 3.0 | 5.8 | 2.5 | 5.5 | 4.5 | 4.0 | 5.0 | 5.0 | 6.0 | 5.0 | 4.0 | 3.0 | 6.0 | 7.0 | 21.11 | B |
| 56 | 4.0 | 4.0 | 4.8 | 2.0 | 4.1 | 2.5 | 3.5 | 4.0 | 2.0 | 7.8 | 5.0 | 6.0 | 5.0 | 4.0 | 5.5 | 6.0 | 4.5 | 21.27 | B |
| 47 | 4.0 | 1.5 | 4.8 | 2.8 | 5.1 | 1.5 | 3.5 | 4.5 | 5.5 | 6.5 | 5.0 | 6.0 | 5.0 | 4.0 | 7.0 | 6.0 | 5.0 | 21.40 | B |
| 70 | 4.0 | 3.5 | 4.0 | 2.5 | 5.1 | 2.0 | 4.5 | 3.0 | 2.0 | 7.6 | 5.0 | 6.0 | 5.0 | 4.0 | 5.5 | 5.5 | 4.0 | 21.50 | B |
| 53 | 4.0 | 2.0 | 5.2 | 3.0 | 5.1 | 7.5 | 5.5 | 5.5 | 3.5 | 7.0 | 5.0 | 6.0 | 5.0 | 4.0 | 7.0 | 6.5 | 4.0 | 21.76 | B |
| 59 | 4.0 | 4.0 | 4.5 | 1.5 | 4.6 | 2.5 | 3.5 | 4.5 | 2.0 | 7.5 | 5.0 | 6.0 | 5.0 | 4.0 | 5.0 | 5.0 | 4.5 | 21.91 | B |
| 57 | 4.0 | 3.8 | 4.5 | 4.2 | 4.6 | 7.0 | 4.0 | 3.5 | 2.0 | 7.2 | 5.0 | 6.0 | 5.0 | 4.0 | 6.5 | 5.5 | 4.2 | 22.00 | B |
| 9 | 4.0 | 4.0 | 4.2 | 3.5 | 4.2 | 6.0 | 6.0 | 4.5 | 3.5 | 6.2 | 5.0 | 6.0 | 5.0 | 4.0 | 1.0 | 3.0 | 2.5 | 22.18 | B |
| 13 | 4.0 | 3.5 | 4.2 | 3.5 | 4.4 | 6.5 | 4.6 | 5.5 | 3.2 | 6.2 | 5.0 | 6.0 | 5.0 | 4.0 | 1.0 | 3.5 | 5.0 | 22.31 | B |
| 68 | 4.0 | 3.2 | 3.5 | 2.0 | 4.1 | 4.5 | 3.5 | 3.0 | 2.0 | 7.5 | 5.0 | 6.0 | 5.0 | 4.0 | 5.5 | 5.5 | 4.5 | 22.42 | B |
| 60 | 4.0 | 4.0 | 4.5 | 1.8 | 4.0 | 3.5 | 4.0 | 4.5 | 2.0 | 7.5 | 5.0 | 6.0 | 5.0 | 4.0 | 5.0 | 3.5 | 2.5 | 22.66 | B |
| 58 | 4.0 | 2.5 | 3.0 | 2.2 | 5.3 | 2.0 | 3.5 | 5.5 | 3.5 | 7.0 | 5.0 | 6.0 | 5.0 | 4.0 | 6.5 | 6.5 | 5.0 | 24.15 | B |
| 61 | 4.0 | 3.0 | 4.8 | 2.8 | 4.7 | 2.0 | 3.5 | 4.5 | 2.5 | 7.0 | 5.0 | 6.0 | 5.0 | 4.0 | 6.5 | 6.0 | 4.5 | 24.54 | B |
| 52 | 4.0 | 2.2 | 3.5 | 2.0 | 4.3 | 4.0 | 3.5 | 4.5 | 3.0 | 5.5 | 5.0 | 6.0 | 5.0 | 4.0 | 6.5 | 5.5 | 5.0 | 24.74 | B |
| 33 | 4.0 | 3.5 | 5.5 | 3.0 | 4.6 | 1.5 | 3.0 | 4.5 | 4.5 | 6.5 | 5.0 | 6.0 | 5.0 | 4.0 | 7.0 | 6.5 | 4.5 | 25.38 | B |
| 31 | 4.0 | 1.5 | 4.5 | 2.4 | 5.1 | 1.5 | 2.5 | 5.0 | 3.5 | 6.5 | 5.0 | 6.0 | 5.0 | 4.0 | 7.0 | 6.5 | 6.0 | 25.92 | B |
| 16 | 4.0 | 4.5 | 2.5 | 3.5 | 3.1 | 3.5 | 3.5 | 2.5 | 2.5 | 4.5 | 5.0 | 6.0 | 5.0 | 4.0 | 1.0 | 2.5 | 2.5 | 26.35 | B |
| 43 | 4.0 | 3.0 | 4.2 | 4.0 | 3.9 | 1.5 | 3.5 | 5.0 | 3.5 | 6.5 | 5.0 | 6.0 | 5.0 | 4.0 | 5.0 | 5.5 | 5.0 | 26.46 | B |
| 55 | 4.0 | 2.0 | 4.2 | 3.0 | 4.9 | 2.5 | 3.5 | 5.5 | 3.5 | 5.5 | 5.0 | 6.0 | 5.0 | 4.0 | 6.5 | 6.0 | 4.5 | 26.46 | B |
| 38 | 4.0 | 2.5 | 4.5 | 2.5 | 4.8 | 2.0 | 3.0 | 3.5 | 4.5 | 6.0 | 5.0 | 6.0 | 5.0 | 4.0 | 6.5 | 6.5 | 6.5 | 26.67 | B |
| 19 | 4.0 | 2.2 | 5.2 | 2.2 | 4.4 | 3.0 | 3.5 | 5.5 | 3.5 | 7.0 | 5.0 | 6.0 | 5.0 | 4.0 | 6.5 | 6.5 | 4.5 | 26.70 | B |
| 46 | 4.0 | 1.5 | 4.2 | 2.8 | 5.1 | 1.5 | 3.5 | 5.0 | 3.5 | 5.5 | 5.0 | 6.0 | 5.0 | 4.0 | 7.0 | 6.5 | 6.5 | 26.95 | B |
| 21 | 4.0 | 2.2 | 5.2 | 2.2 | 4.3 | 3.0 | 3.5 | 5.5 | 3.5 | 7.0 | 5.0 | 6.0 | 5.0 | 4.0 | 6.5 | 6.5 | 4.5 | 27.12 | B |
| 64 | 4.0 | 2.0 | 4.0 | 1.5 | 4.8 | 2.5 | 3.5 | 5.5 | 2.4 | 6.0 | 5.0 | 6.0 | 5.0 | 4.0 | 6.5 | 6.5 | 5.0 | 27.23 | B |
| 15 | 4.0 | 3.5 | 4.2 | 3.5 | 3.6 | 6.5 | 5.5 | 3.5 | 2.5 | 6.0 | 5.0 | 6.0 | 5.0 | 4.0 | 1.0 | 3.5 | 3.0 | 27.28 | B |
| 27 | 4.0 | 3.2 | 5.2 | 2.8 | 3.4 | 3.0 | 3.0 | 4.5 | 2.5 | 6.5 | 5.0 | 6.0 | 5.0 | 4.0 | 6.5 | 6.0 | 5.0 | 27.49 | B |
| 17 | 4.0 | 2.2 | 5.2 | 2.2 | 4.2 | 3.0 | 3.5 | 5.5 | 3.5 | 7.0 | 5.0 | 6.0 | 5.0 | 4.0 | 6.5 | 6.5 | 4.5 | 27.57 | B |
| 20 | 4.0 | 2.2 | 5.2 | 2.2 | 4.2 | 3.0 | 3.5 | 5.5 | 3.5 | 7.0 | 5.0 | 6.0 | 5.0 | 4.0 | 6.5 | 6.5 | 4.5 | 27.57 | B |
| 39 | 4.0 | 1.5 | 6.0 | 2.0 | 3.6 | 2.0 | 3.0 | 4.5 | 2.0 | 6.5 | 5.0 | 6.0 | 5.0 | 4.0 | 7.0 | 6.0 | 5.0 | 27.67 | B |
| 12 | 4.0 | 3.5 | 2.5 | 2.3 | 3.4 | 5.5 | 4.0 | 5.5 | 3.0 | 6.2 | 5.0 | 6.0 | 5.0 | 4.0 | 1.0 | 3.5 | 3.0 | 28.43 | B |
| 22 | 4.0 | 2.6 | 4.2 | 2.0 | 4.3 | 1.5 | 3.5 | 5.0 | 3.5 | 6.0 | 5.0 | 6.0 | 5.0 | 4.0 | 6.5 | 6.5 | 4.5 | 28.60 | B |
| 14 | 4.0 | 3.2 | 3.5 | 3.0 | 3.4 | 5.5 | 4.0 | 4.5 | 6.0 | 6.0 | 5.0 | 6.0 | 5.0 | 4.0 | 1.0 | 5.5 | 3.0 | 28.84 | B |
| 35 | 4.0 | 2.0 | 4.0 | 2.8 | 4.3 | 2.5 | 3.0 | 4.5 | 3.5 | 5.5 | 5.0 | 6.0 | 5.0 | 4.0 | 7.0 | 6.0 | 5.0 | 29.02 | B |
| 18 | 4.0 | 1.8 | 5.2 | 2.2 | 3.8 | 3.0 | 3.5 | 5.5 | 3.5 | 7.0 | 5.0 | 6.0 | 5.0 | 4.0 | 6.5 | 6.5 | 4.5 | 29.13 | B |
| 25 | 4.0 | 1.5 | 3.2 | 2.2 | 4.4 | 1.5 | 3.5 | 5.5 | 3.5 | 5.0 | 5.0 | 6.0 | 5.0 | 4.0 | 6.5 | 6.5 | 4.5 | 29.15 | B |
| 23 | 4.0 | 1.5 | 3.0 | 2.2 | 4.2 | 1.5 | 3.5 | 5.5 | 3.5 | 5.0 | 5.0 | 6.0 | 5.0 | 4.0 | 6.5 | 6.5 | 4.5 | 29.38 | B |
| 24 | 4.0 | 1.5 | 3.0 | 2.2 | 4.2 | 1.5 | 3.5 | 5.5 | 3.5 | 5.0 | 5.0 | 6.0 | 5.0 | 4.0 | 6.5 | 6.5 | 4.5 | 29.38 | B |
| 37 | 4.0 | 3.5 | 4.5 | 2.0 | 3.8 | 2.5 | 3.0 | 4.5 | 3.5 | 5.0 | 5.0 | 6.0 | 5.0 | 4.0 | 5.0 | 6.0 | 5.5 | 29.57 | B |
| 42 | 4.0 | 6.5 | 7.5 | 5.5 | 2.9 | 5.0 | 3.0 | 2.0 | 1.0 | 2.5 | 5.0 | 6.0 | 5.0 | 4.0 | 4.5 | 1.0 | 1.5 | 30.88 | A |
| 36 | 4.0 | 2.0 | 5.5 | 3.5 | 2.8 | 1.5 | 3.5 | 3.5 | 3.0 | 6.5 | 5.0 | 6.0 | 5.0 | 4.0 | 6.5 | 4.5 | 3.5 | 35.46 | A |
| 65 | 4.0 | 3.8 | 4.5 | 1.8 | 2.5 | 3.5 | 3.5 | 5.5 | 2.0 | 6.8 | 5.0 | 6.0 | 5.0 | 4.0 | 5.5 | 4.5 | 4.5 | 35.56 | A |
| 40 | 4.0 | 2.0 | 4.5 | 3.5 | 2.9 | 3.0 | 3.5 | 5.0 | 2.5 | 3.5 | 5.0 | 6.0 | 5.0 | 4.0 | 6.0 | 5.0 | 4.5 | 36.99 | A |
Table 8.
Classification of eight case studies, which have achieved the end of their physical and functional service life.
Table 8.
Classification of eight case studies, which have achieved the end of their physical and functional service life.
| IDs | City | Physical Degradation-Sw | Functional Degradation-FBSL2.0 * |
|---|---|---|---|
| 48 | Valdivia | 25.0 | 12.7 |
| 07 | Valdivia | 21.0 | 17.9 |
| 04 | Valdivia | 28.0 | 18.1 |
| 69 | Niebla | 25.0 | 19.3 |
| 41 | Valdivia | 22.0 | 19.4 |
| 44 | Valdivia | 21.0 | 19.4 |
| 30 | Valdivia | 20.0 | 19.4 |
| 49 | Valdivia | 20.0 | 19.7 |
Note: * The classification is ranked according to the FBSL2.0 column.
Table 9.
Ideal annual thermal loads.
| ID | Ideal Thermal Loads (kWh/m2*year) | |||||
|---|---|---|---|---|---|---|
| Current Condition | Basic Thermal Rehabilitation | Deep Thermal Rehabilitation | ||||
| Heating | Cooling | Heating | Cooling | Heating | Cooling | |
| ID-41 *,** | 204.8 | 24.8 | 103.4 | 15.3 | 36.0 | 12.5 |
| ID-49 ** | 242.4 | 27.1 | 140.6 | 21.2 | 49.1 | 15.8 |
| ID-07 ** | 260.9 | 24.6 | 137.7 | 17.5 | 48.8 | 14.9 |
| ID-30 *,** | 214.1 | 20.2 | 127.4 | 15.5 | 47.8 | 10.4 |
| ID-04 *,** | 257.3 | 20.3 | 140.2 | 12.1 | 52.2 | 7.6 |
Notes: * In accordance with the differentiated criteria of SHC; ** Note: In accordance with the combined criteria of SHC.
Table 10.
Minimum and maximum operative temperatures (°C).
| ID | Current Condition | Basic Thermal Rehabilitation | Deep Thermal Rehabilitation | |||
|---|---|---|---|---|---|---|
| Winter Season (min) | Summer Season (max) | Winter Season (min) | Summer Season (max) | Winter Season (min) | Summer Season (max) | |
| ID-41 | 14.1 | 32.5 | 15.7 | 28.4 | 16.6 | 27.4 |
| ID-49 | 13.6 | 31.3 | 14.6 | 29.0 | 16.1 | 27.5 |
| ID-07 | 14.3 | 31.2 | 15.7 | 29.2 | 16.5 | 28.1 |
| ID-30 | 14.3 | 28.9 | 15.0 | 27.7 | 16.1 | 26.3 |
| ID-04 | 13.8 | 29.6 | 15.0 | 27.4 | 16.2 | 25.9 |
Table 11.
Thermal comfort of occupants based on operative temperature in one year.
| ID | Current Condition | Basic Thermal Rehabilitation | Deep Thermal Rehabilitation | ||||||
|---|---|---|---|---|---|---|---|---|---|
| Overcooling | Comfortable | Overheating | Overcooling | Comfortable | Overheating | Overcooling | Comfortable | Overheating | |
| ID-41 | 66% | 17% | 17% | 56% | 29% | 15% | 41% | 46% | 13% |
| ID-49 | 65% | 28% | 7% | 62% | 31% | 6% | 53% | 45% | 1% |
| ID-07 | 68% | 19% | 13% | 63% | 26% | 11% | 52% | 36% | 12% |
| ID-30 | 65% | 24% | 10% | 62% | 29% | 9% | 54% | 41% | 6% |
| ID-04 | 68% | 22% | 10% | 65% | 28% | 8% | 57% | 39% | 4% |
Publisher’s Note: MDPI stays neutral with regard to jurisdictional claims in published maps and institutional affiliations. |
© 2022 by the authors. Licensee MDPI, Basel, Switzerland. This article is an open access article distributed under the terms and conditions of the Creative Commons Attribution (CC BY) license (https://creativecommons.org/licenses/by/4.0/).
Share and Cite
MDPI and ACS Style
Prieto, A.J.; Silva, A.; Tori, F.; Carpio, M. Estimating Functional and Physical Service Life of Timber Buildings Concerning Thermal Performance Simulations. Buildings 2022, 12, 1299. https://doi.org/10.3390/buildings12091299
AMA Style
Prieto AJ, Silva A, Tori F, Carpio M. Estimating Functional and Physical Service Life of Timber Buildings Concerning Thermal Performance Simulations. Buildings. 2022; 12(9):1299. https://doi.org/10.3390/buildings12091299
Chicago/Turabian StylePrieto, Andrés J., Ana Silva, Felipe Tori, and Manuel Carpio. 2022. "Estimating Functional and Physical Service Life of Timber Buildings Concerning Thermal Performance Simulations" Buildings 12, no. 9: 1299. https://doi.org/10.3390/buildings12091299
Note that from the first issue of 2016, this journal uses article numbers instead of page numbers. See further details here.