Article

Homology Modelling, Molecular Docking and Molecular Dynamics Simulation Studies of CALMH1 against Secondary Metabolites of Bauhinia variegata to Treat Alzheimer’s Disease

1
Institute of Biosciences and Technology, Shri Ramswaroop Memorial University, Barabanki 225003, Uttar Pradesh, India
2
Department of Biotechnology, Dr. A.P.J. Abdul Kalam Technical University, Lucknow 226021, Uttar Pradesh, India
3
Department of Pharmaceutics, College of Pharmacy, University of Hail, Hail 2240, Saudi Arabia
4
Department of Medical Laboratory Sciences, College of Applied Medical Sciences, Majmaah University, Majmaah 11952, Saudi Arabia
5
Health and Basic Sciences Research Center, Majmaah University, Al Majmaah 15341, Saudi Arabia
6
School of Medicine and Surgery, University of Milano-Bicocca, 20900 Monza, Italy
7
Department of Biotechnology, School of Engineering and Technology, Sharda University, Greater Noida 201310, Uttar Pradesh, India
8
Department of Biotechnology, School of Applied & Life Sciences (SALS), Uttaranchal University, Dehradun 248007, Uttarakhand, India
9
Department of Biotechnology Engineering and Food Technology, Chandigarh University, Mohali 140413, Punjab, India
*
Authors to whom correspondence should be addressed.
Brain Sci. 2022, 12(6), 770; https://doi.org/10.3390/brainsci12060770
Submission received: 15 February 2022 / Revised: 5 May 2022 / Accepted: 31 May 2022 / Published: 12 June 2022

Abstract

:
Calcium homeostasis modulator 1 (CALHM1) is a protein responsible for causing Alzheimer’s disease. In the absence of an experimentally designed protein molecule, homology modelling was performed. Through homology modelling, different CALHM1 models were generated and validated through Rampage. To carry out further in silico studies, through molecular docking and molecular dynamics simulation experiments, various flavonoids and alkaloids from Bauhinia variegata were utilised as inhibitors to target the protein (CALHM1). The sequence of CALHM1 was retrieved from UniProt and the secondary structure prediction of CALHM1 was done through CFSSP, GOR4, and SOPMA methods. The structure was identified through LOMETS, MUSTER, and MODELLER and finally, the structures were validated through Rampage. Bauhinia variegata plant was used to check the interaction of alkaloids and flavonoids against CALHM1. The protein and protein–ligand complex were also validated through molecular dynamics simulations studies. The model generated through MODELLER software with 6VAM A was used because this model predicted the best results in the Ramachandran plot. Further molecular docking was performed, quercetin was found to be the most appropriate candidate for the protein molecule with the minimum binding energy of −12.45 kcal/mol and their ADME properties were analysed through Molsoft and Molinspiration. Molecular dynamics simulations showed that CALHM1 and CALHM1–quercetin complex became stable at 2500 ps. It may be seen through the study that quercetin may act as a good inhibitor for treatment. With the help of an in silico study, it was easier to analyse the 3D structure of the protein, which may be scrutinized for the best-predicted model. Quercetin may work as a good inhibitor for treating Alzheimer’s disease, according to in silico research using molecular docking and molecular dynamics simulations, and future in vitro and in vivo analysis may confirm its effectiveness.

1. Introduction

Alzheimer’s disease is a long-term illness that causes brain cell loss and degeneration. The most common kind of dementia is Alzheimer’s disease, which is characterised as a gradual loss of mental, communicative, and social abilities that makes it difficult for a person to operate independently [1]. Current Alzheimer’s disease medicines may temporarily alleviate symptoms or delay the progression of the illness. Medications can often assist patients with Alzheimer’s disease enhance their neuron function. For those with Alzheimer’s disease, a variety of programs and services can be quite beneficial [2].
Intracellular calcium (Ca2+) dynamics govern key neuronal functions such as neurotransmission, synaptic plasticity, learning, and memory, and signalling cascades, cytoskeleton modifications, synaptic function, and neuronal survival are all affected by changes in Ca2+ dynamics [3]. Several investigations have indicated the essential role of Ca2+ dysregulation in central Alzheimer’s disease-related pathogenic processes since the first systematic hypothesis was proposed twenty years ago (AD). Disturbances in Ca2+ signals were discovered in the early stages of Alzheimer’s disease, even before the build-up of amyloid ß-peptide (Aß), a clinical marker of the disease [4]. A growing body of evidence shows that mutations in AD-related genes such as presenilins, amyloid precursor protein, or apolipoprotein-E affect Ca2+ signalling, leading to apoptosis, synaptic plasticity failure, and neurodegeneration [5].
Ca2+o (extracellular calcium) plays an important part in physiological processes. In a number of physiological and pathological circumstances, changes in Ca2+o concentration ([Ca2+o]) have been discovered to modify neuronal excitability, although the mechanisms by which neurons detect [Ca2+]o remain unknown [6]. Calcium homeostasis modulator 1 (CALHM1) expression has been shown to generate cation currents in cells and enhance the concentration of cytoplasmic Ca2+ ([Ca2+]) in response to Ca2+o removal and subsequent addition. It is unclear if CALHM1 is a pore-forming ion channel or a modulator of endogenous ion channels. CALHM1 is also expressed in mouse cortical neurons, which respond to reduced [Ca2+]o with increased conductivity and potential firing action, as well as a significantly higher [Ca2+i] when Ca2+o is withdrawn [7]. Those reactions, on the other hand, are significantly reduced in mouse neurons that have had CALHM1 genetically eliminated. These findings demonstrate that CALHM1 is an evolutionarily conserved family of ion channels that senses membrane voltage and external Ca2+ levels and plays a role in cortical neuronal excitability and Ca2+ homeostasis, notably in response to decreasing and restoring [Ca2+o] [8].
The absence of an experimentally characterized structure has hampered progress in determining the function of CALHM1 in Alzheimer’s disease. The two most common experimental approaches for determining the structure of proteins are X-ray crystallography and nuclear magnetic resonance (NMR) spectroscopy. These techniques, however, have requirements such as a high time and personnel needs [9]. Obtaining protein sequences, on the other hand, is much easier than obtaining protein structure, thanks to current sequencing methods. As a result, databases such as UniProt (https://www.uniprot.org/ (accessed on 7 January 2021)) and TrEMBL (Translated EMBL) (https://www.uniprot.org/statistics/TrEMBL (accessed on 8 January 2021)) include many protein sequences. In the late twentieth century, computational approaches for predicting the structure of proteins gave a sequence of amino acids. The information essential for a protein’s correct folding is encoded in its amino acid sequence, according to research (Anfinsen’s dogma). Homology modelling (based on sequence comparison) and threading are presently the most used computational approaches for predicting protein structure (based on sequence comparison) [10].
The goal of this research was to create useful models of the CALHM1 computational protein structure. As a result, additional research and analysis of CALHM1 function in Alzheimer’s disease will be aided [11]. Comparative modelling was carried out in the absence of its experimentally deduced structure using the software programs MODELLER (https:/salilab.org/modeller/ (accessed on 15 January 2021)), LOMETS (Local MetaThreading Server) (https:/zhanglab.ccmb.med.umich.edu/LOMETS/ (accessed on 19 January 2021)) and MUSTER (MUlti-Sources ThreadER) (https:/zhanglab.cccmb.med.umich.edu/MUSTER/ (accessed on 30 January 2021)) [12]. RAMPAGE (Ramachandran Plot Assessment) (http:/mordred.bioc.cam.ac.uk/~rapper (accessed on 3 February 2021)) was then used to test the model structure. Using SPDBV (Swiss PDB Viewer) (https:/spdbv.vital-it.ch/ (accessed on 5 February 2021)) software, the energy minimisation of the four modelled structures was carried out. Using GOR4 (Garnier–Osguthorpe–Robson) (https:/npsa-prabi.ibcp.fr/NPSA/npsa gor4.html (accessed on 5 February 2021)), CFSSP (Chou and Fasman Secondary Structure Prediction Server) (http:/www.biogem.org/tool/chou-fasman/ (accessed on 5 February 2021)), and SOPMA (Self-Optimized Prediction System with Alignment) algorithms (https:/npsa-prabi.ibcp.fr/cgi-bin/npsa automat.pl?page=/NPSA/npsa sopma.html (accessed on 5 February 2021)) also generated secondary protein structure [13].

2. Material and Methods

The protein structure prediction modelling for comparative modelling consisted of the following steps. Target identification came first, followed by alignments of the target and prototype sequences. The model was built when the alignment template procedure was completed. Finally, the model’s strength, stearic collisions, and stability were evaluated.

2.1. Protein Sequence Retrieval

The CALHM1 protein sequence (accession number: Q8IU99 (CAHM1_HUMAN) was saved from the UniProt database (https://www.uniprot.org/ (accessed on 7 January 2021)) [14].

2.2. Protein Secondary Structure Prediction

The CALHM1 protein sequence (accession number: O43315 (AQP9 HUMAN)) was further subjected to secondary structure prediction on the Expasy server using GOR4, SOPMA and CFSSP [15].

2.3. Protein Tertiary Structure Prediction through Template Identification

A thorough search of the PDB (Protein Data Bank) (http://www.rcsb.org/ (accessed on 16 February 2021)) was conducted to search the most similar sequences already known for experimentally designed structures. The template protein structures (6VAM A and 6LMT A) were analysed as the most accurate template for identifying the three-dimensional protein structure based on various factors such as E-value, percentage identity, alignment score, and query coverage [16].

2.4. Modelling

The protein CALHM1 three-dimensional structure was calculated using MODELLER version 9.15, LOMETS, and the MUSTER server. MODELLER carries out a comparative modelling of the proteins according to the identified template. LOMETS is based on a metathreading technique for identifying the protein structure based on a template. MUSTER is based on a protein threading algorithm, which identifies PDB library template structures [17]. It generates sequence–template alignments with multiple structural data by combining different sequences. Several models were created through two templates, and a comparison of their DOPE score was selected for the best model [18].

2.5. Validation of the Structure

The RAMPAGE server was used to create Ramachandran plots in order to validate the predicted protein structures by looking at criteria such as preferred, allowed, and outside amino acid residue areas. The pdb files of the best target gene models predicted by MODELLER, LOMETS, and MUSTER were sent to the RAMPAGE service to create Ramachandran plots. Plots were identified for the anticipated structures, and the plots were matched to determine the best structure among the projected structures and further studies. Validation of the protein structure’s quality was also carried out using the ProSA server [12].

2.6. Energy Minimisation of the Predicted Molecule

For SPDBV to achieve the lowest energy conformation, the identified and analysed models were subjected to energy minimisation.

2.7. Preparation of Ligand Molecule

The flavonoids and alkaloids structure of the plant Bauhinia variegata were retrieved in sdf format from the PubChem online database. The stem bark of the plant contains beta-carotene, quercetin, stigmasterol, hentriacontane, flavanone, isoquericetroside, kaempferol-3-glucoside, lupeol, myricetol, phenanthriquinone, quercitroside, rutoside, xanthophyll, dihydroquercetin, octacosanol, and beta-sitosterol. All the structures were retrieved in 3D structure in SDF format and were further converted into pdb format through online converting tool [19].

2.8. Initial Docking through iGEMDOCK Software

Initial docking was performed to screen the ligands on the basis of the binding energy. The docking process was carried out through iGEMDOCK version 2.1. The result was in the form of an electrostatic force, hydrogen bonds, and Van Der Waals forces [20]. The docking was performed between protein and ligand with a population size of 200 and the number of generations was 70 with 2 solutions [21].

2.9. Final Molecular Docking through AutoDock Vina and Drug Likeliness Property Analysis

The ligands were screened through iGEMDOCK and these screened ligands were tested against CALHM1 protein through AutoDock vina software. This software tool is freely available online. The protein CALHM1 was assigned with Kollman charges and polar hydrogens. The screened ligands were added with nonpolar hydrogen atoms and with Gasteiger partial charges. The torsion angles were allowed to rotate freely. A grid box of 80 × 80 × 80 Å was adjusted in such a manner that it was covering the target molecule to give the best docked result. The docking algorithm was adjusted to 100 runs. The default parameters were the Lamarckian genetic algorithm (LGA) and the empirical free energy function. The best-targeted molecule was screened further based on its minimal binding energy (Kcal/mol) [22].
Drug likeliness analysis was done through Molsoft (http://www.molsoft.com/ (accessed on 2 March 2021)) and Molinspiration (http://www.molinspiration.com/ (accessed on 2 March 2021)). Different properties of the screened ligand were analysed through pkCSM [23].

2.10. Molecular Dynamics Simulations

According to the molecular docking results, a molecular dynamics simulation was performed. The molecule which showed the minimum binding energy with the protein molecule was compared with the protein molecule for the dynamics study. The Groningen Machine for Chemical Simulations (GROMACS) 4.5.6 package was used to run molecular dynamics simulations. For the simulations, Gromacs was utilised to build the protein target and ligand file. With the help of an online server PRODRG2.5, the topology parameters of the ligand were generated [24]. The protein and ligand complex was placed inside the shell. The volume of the box was 284.14 nm3 and the distance between the protein molecule and the box was kept at 1.0 nm. After adding 8 sodium ions to the shell, simple point charges and water molecules were neutralized. Energy minimisation was achieved using the steepest approach of 8 ps. The machine was balanced at 40 ps when the temperature was raised to 300 K. The simulations at 10 ns were performed at 1 bar and at the temperature of 300 K. Finally, an all-bond restriction was employed to keep the ligand from migrating during molecular dynamics [25].

3. Results and Discussion

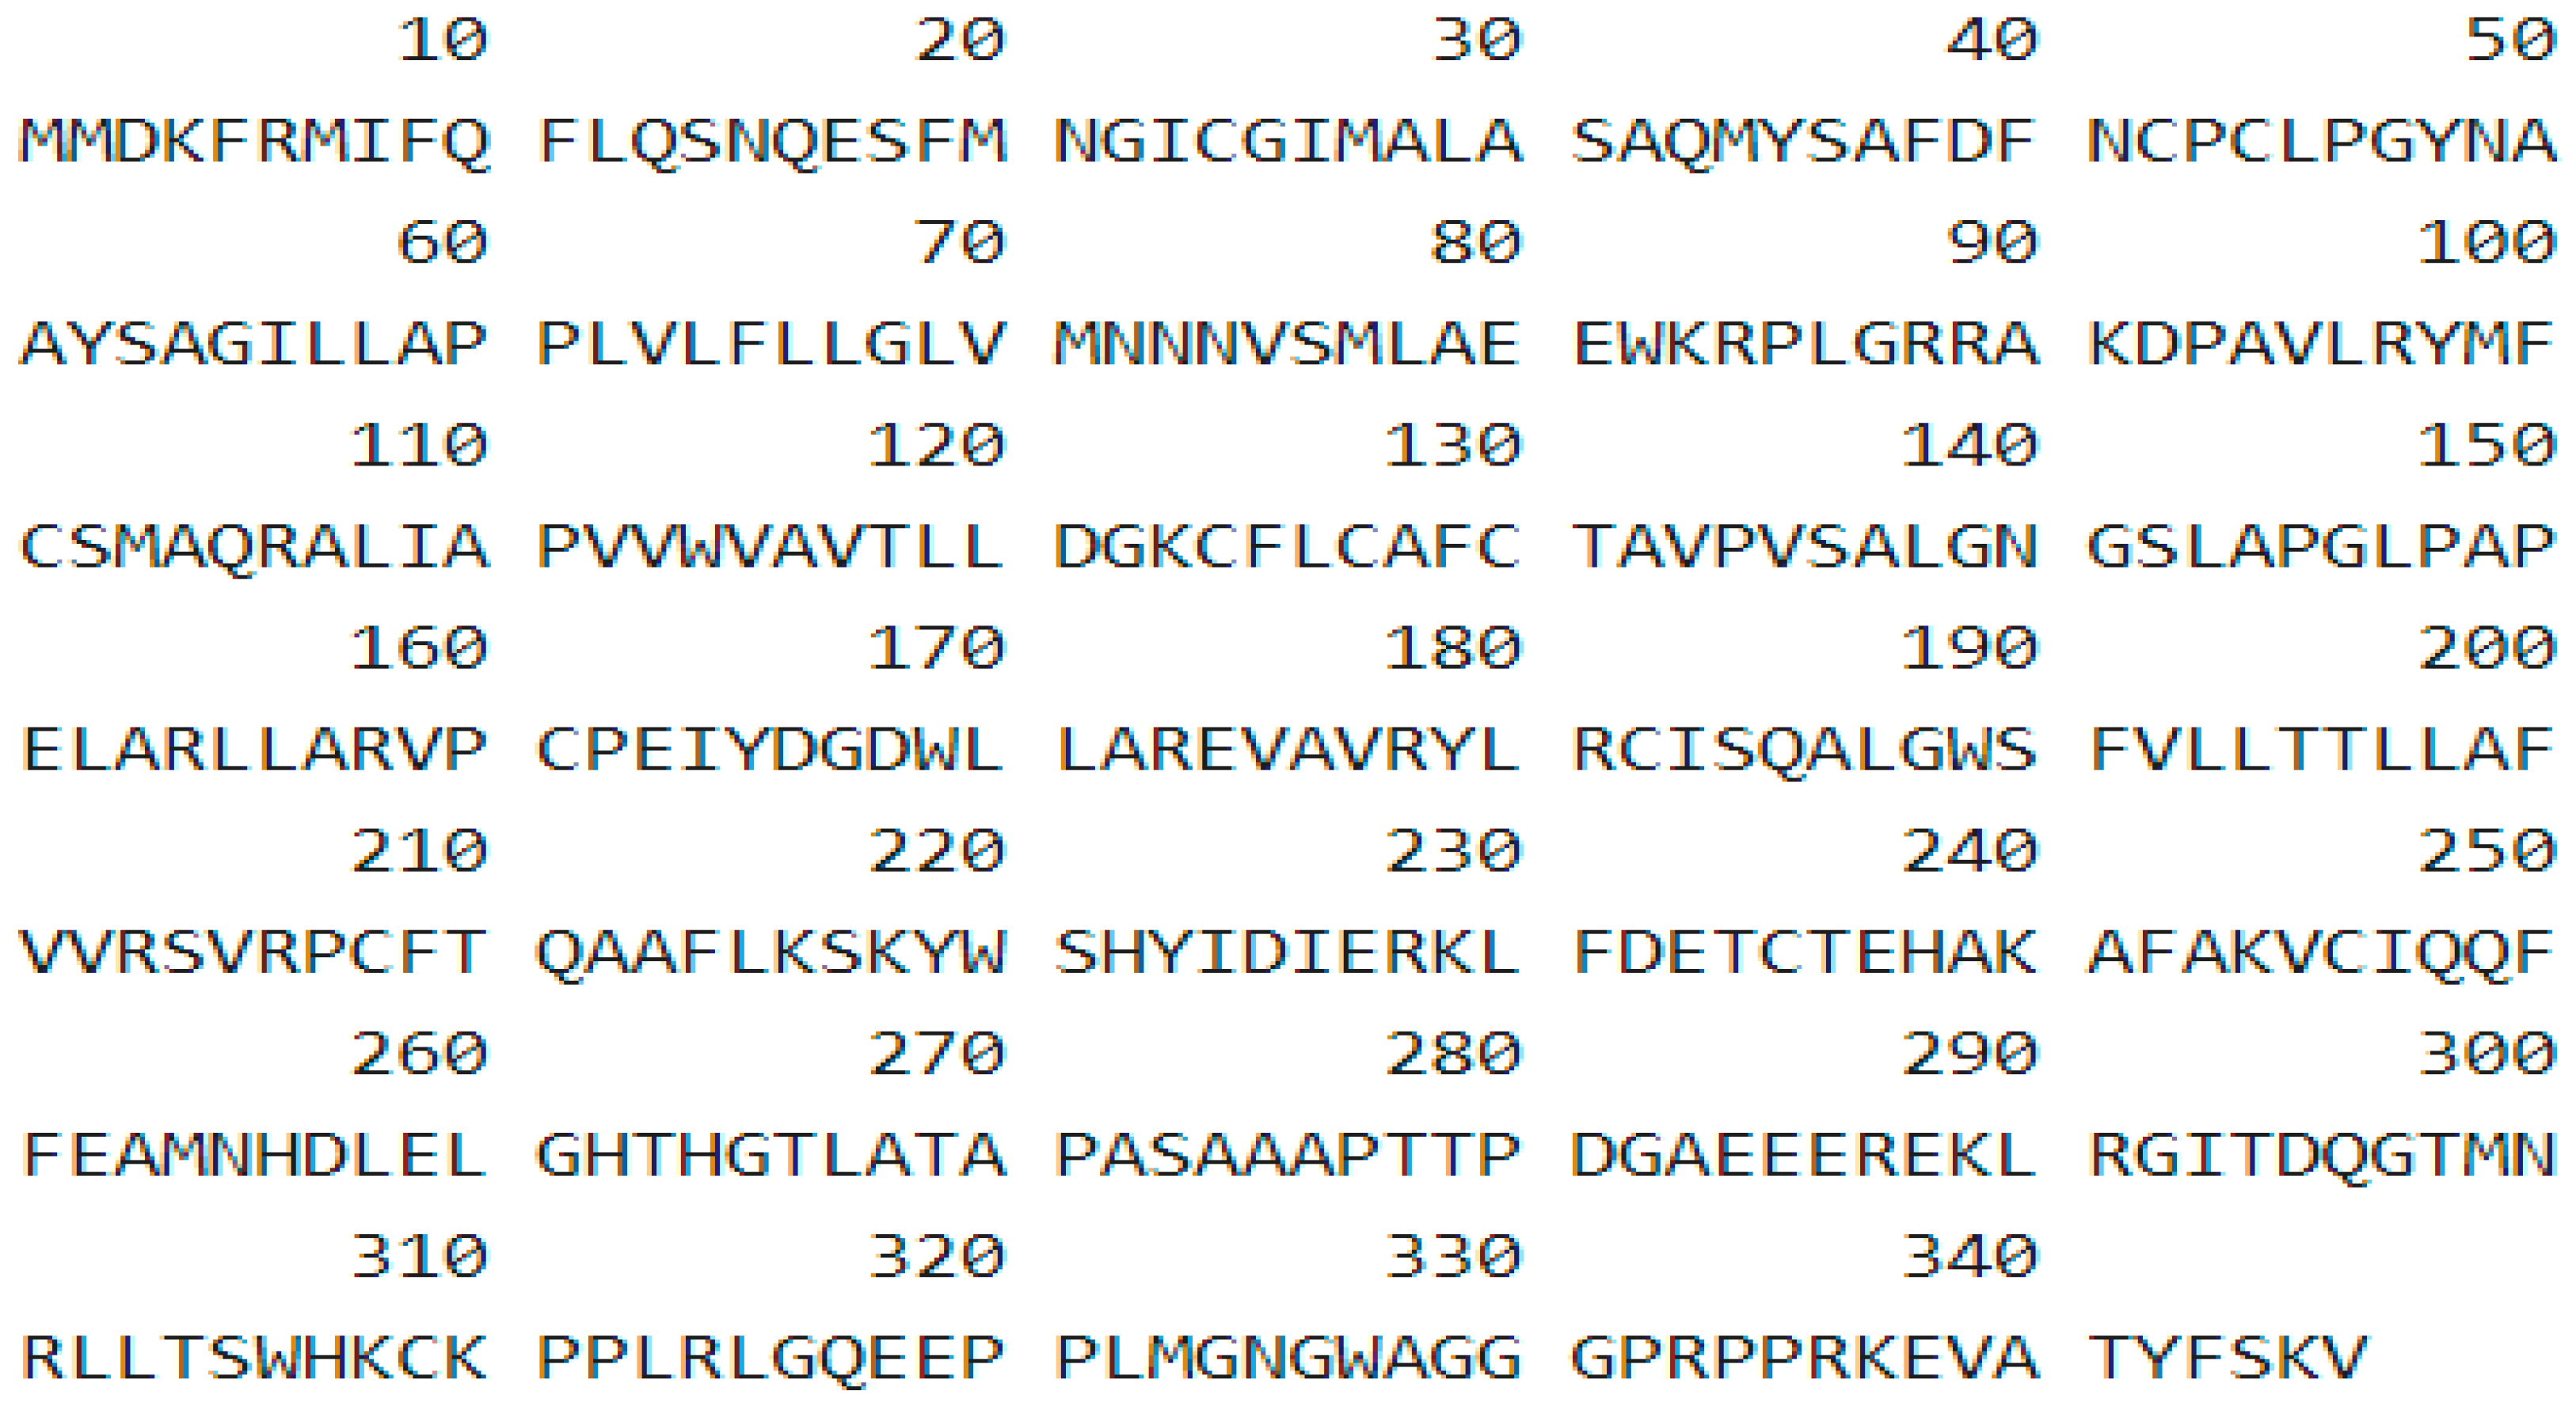
3.1. Protein Sequence

The protein sequence of CALHM1 was retrieved in FASTA format from the UniProt database as shown in Figure 1.

3.2. Protein Secondary Structure Prediction

The secondary structure prediction of CALHM1 was carried out with the aid of methods such as Chou and Fasman Secondary Structure Prediction Server (CFSSP), Garnier–Osguthorpe–Robson (GOR4), and the Self-Optimised Prediction Method with Alignment (SOPMA). Information from GOR4, CFSSP, and SOPMA Expasy tools were obtained and the secondary structures such as alpha helix, beta strand, and random coil for the target CALHM1 were extracted.
Chou and Fasman Secondary Structure Prediction Server (CFSSP) is an empirical predictive tool of secondary protein structures. The method depends on analyses of the relative frequencies in alpha helices, beta sheets, and turns of each amino acid based on known protein structures solved with X-ray crystallography. The analysis of the CFSSP showed that CALHM1 consisted of 271 alpha helix, 248 extended strands, and 34 turns, as shown in Figure 2.
The Garnier–Osguthorpe–Robson (GOR4) method is a technique based on information theory to predict the secondary structures in proteins. It uses probability factors derived from empirical research of known tertiary protein structures solved using X-ray crystallography. The analysis of GOR4 showed that CALHM1 consisted of 133 alpha helix, 45 extended strands, and 168 random coils, as shown in Figure 3.
The Self-Optimised Prediction Method with Alignment (SOPMA) is an Expasy server protein-aided secondary structure prediction tool. Using consensus estimation from several alignments, the algorithm contributes to significant advances in protein secondary structure. Analysing SOPMA, CALHM1 consisted of 182 alpha helix, 34 extended strands, and 119 random coils as shown in Figure 4.

3.3. Template Identification

PDB Blast was performed to define CALHM1 modelling prototype structures for comparative homology modelling. We compared the templates and selected two of them (6VAM A and 6LMT A) based on their query cover, E-value and identity as shown in Table 1. Using MODELLER software, the two structures were downloaded from PDB for modelling the protein.

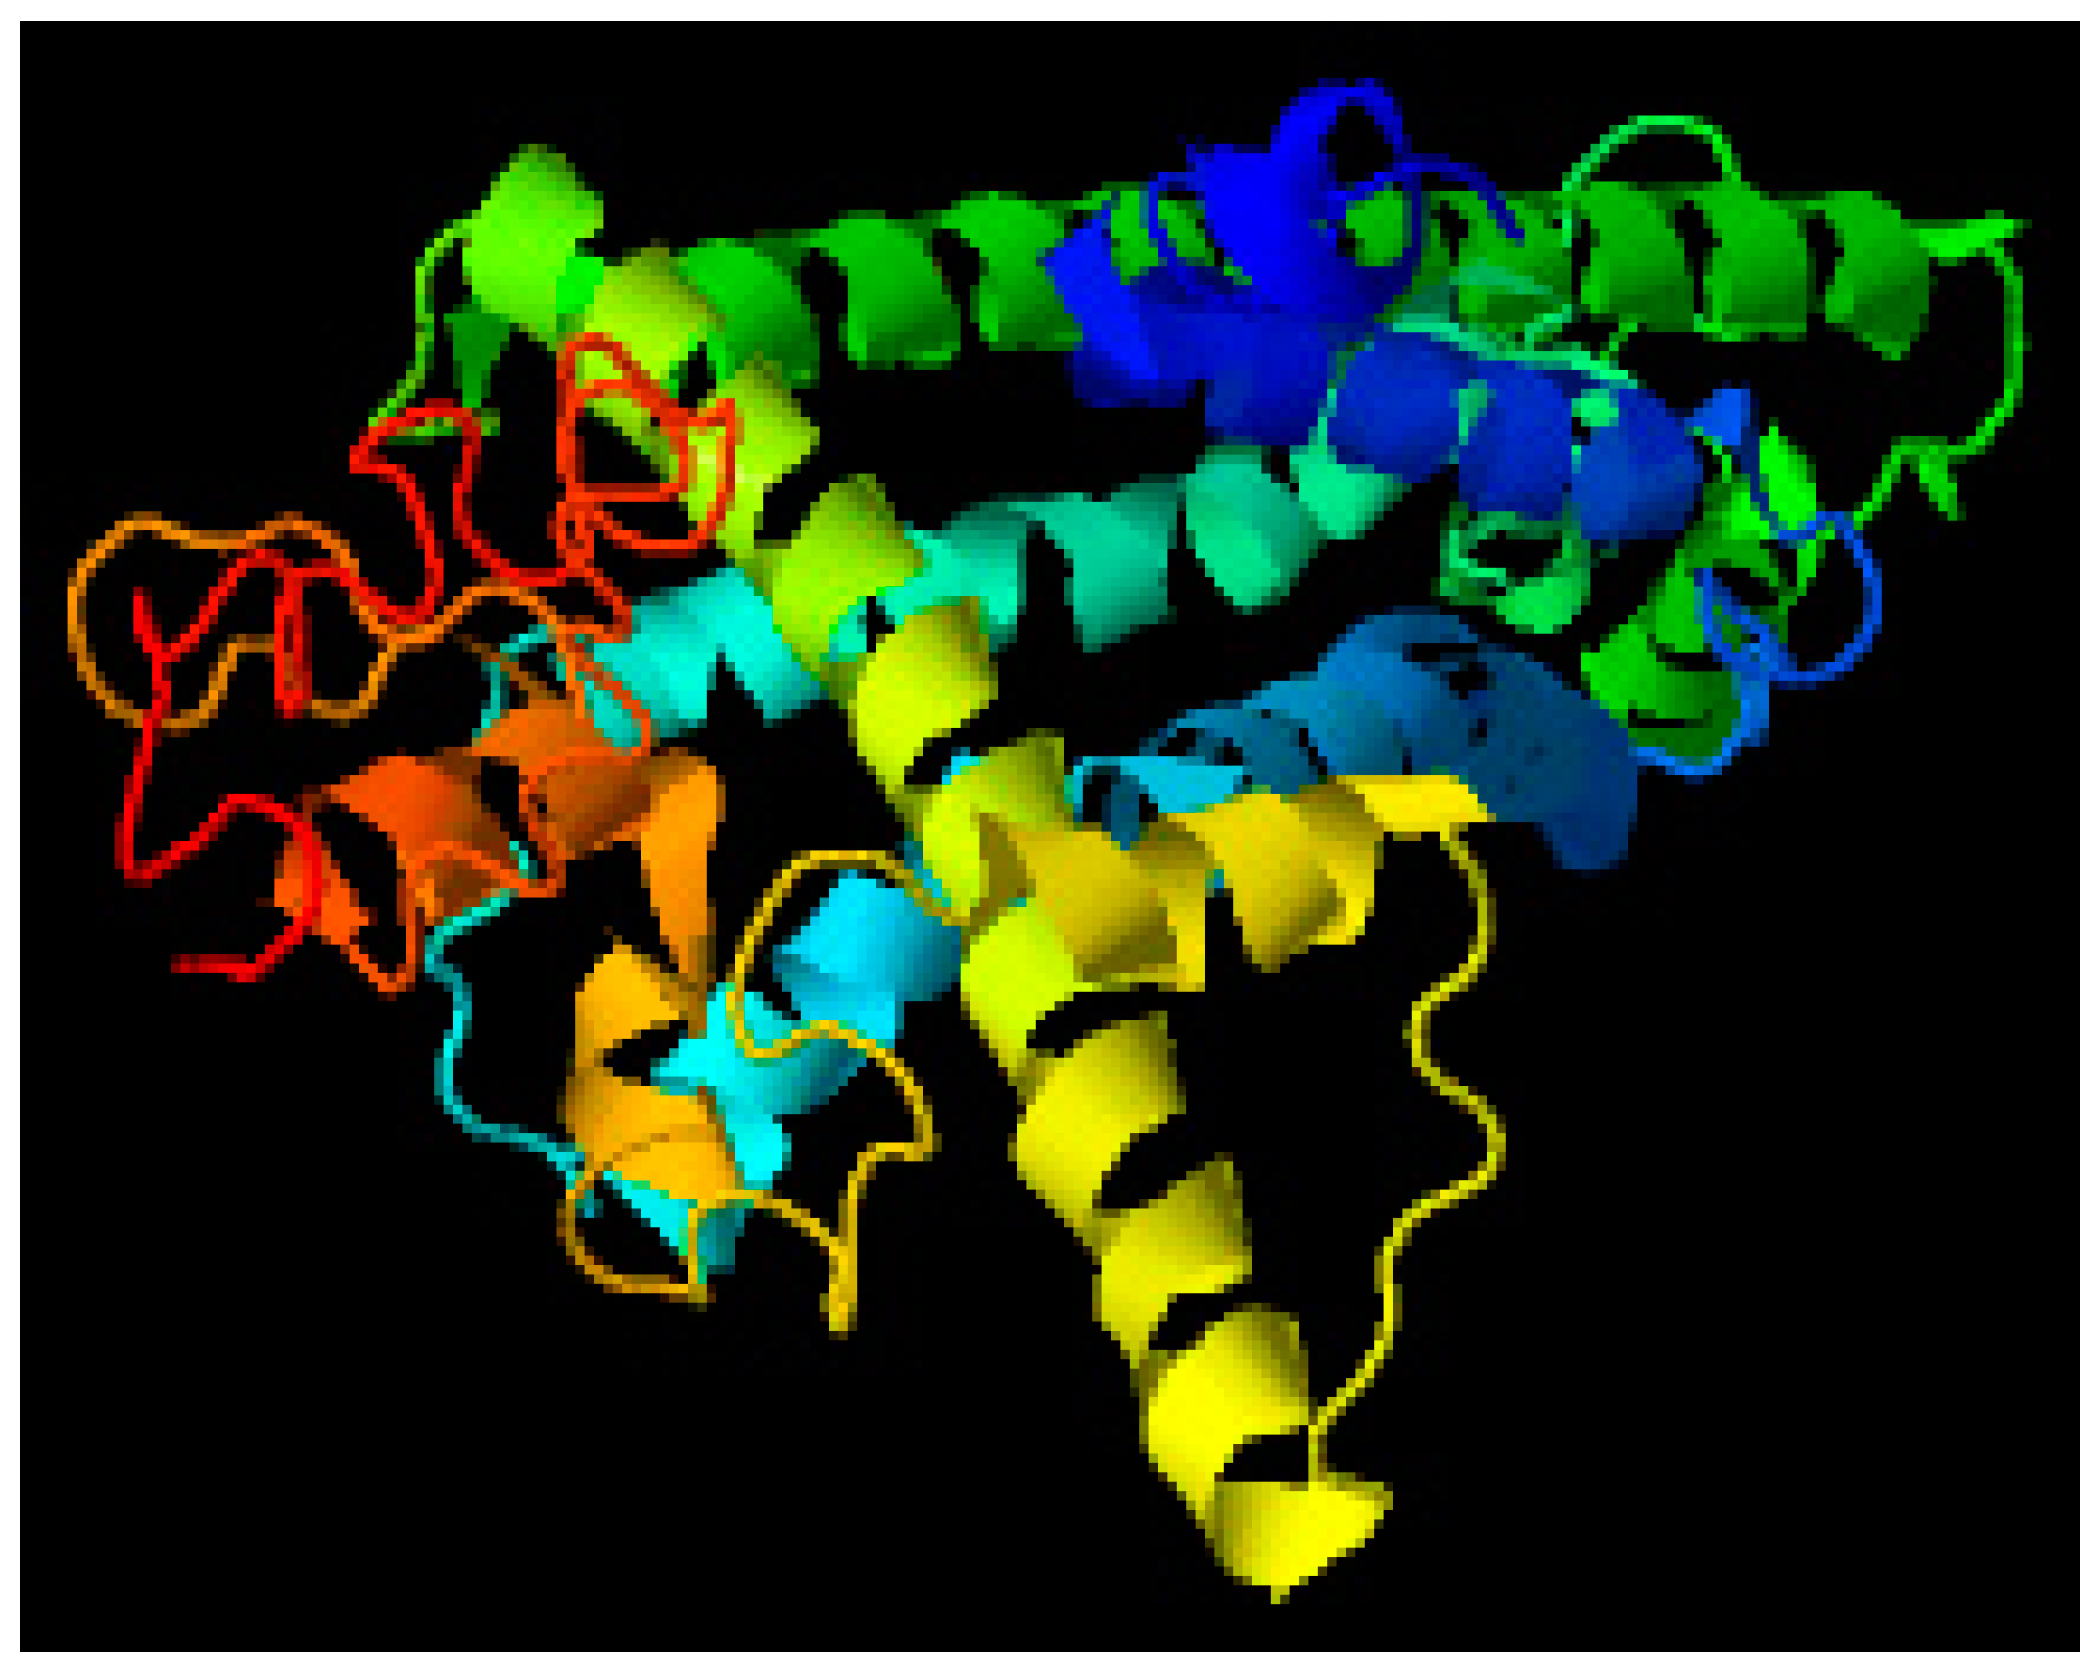
3.4. Modelling through MODELLER

Through 6VAM A and 6LMT A prototype files, structures were modelled using MODELLER version 9.15 software for the protein CALHM1. Fifty models were produced using 6VAM A and 6LMT A modellers. With the help of the DOPE score as a criterion, we selected one best model for 6VAM A (Model 1) as shown in Figure 5 and Figure 6LMT A (Model 2) as shown in Figure 6.

3.5. Structure Prediction through LOMETS Server

LOMETS server was used as a meta threading approach to identify the 3D structure of the given sequence. Ten protein structures were generated, and the best structures were further evaluated. Comparing the Z-score and maximum coverage, the best model among them was selected as shown in Figure 7.

3.6. Protein Structure Prediction Using MUSTER Server

In addition, the MUSTER online server was used for protein treading. This server created ten different protein sequence models, among which the structure with the lowest Z-score and the maximum coverage was chosen as the fittest structure as shown in Figure 8.

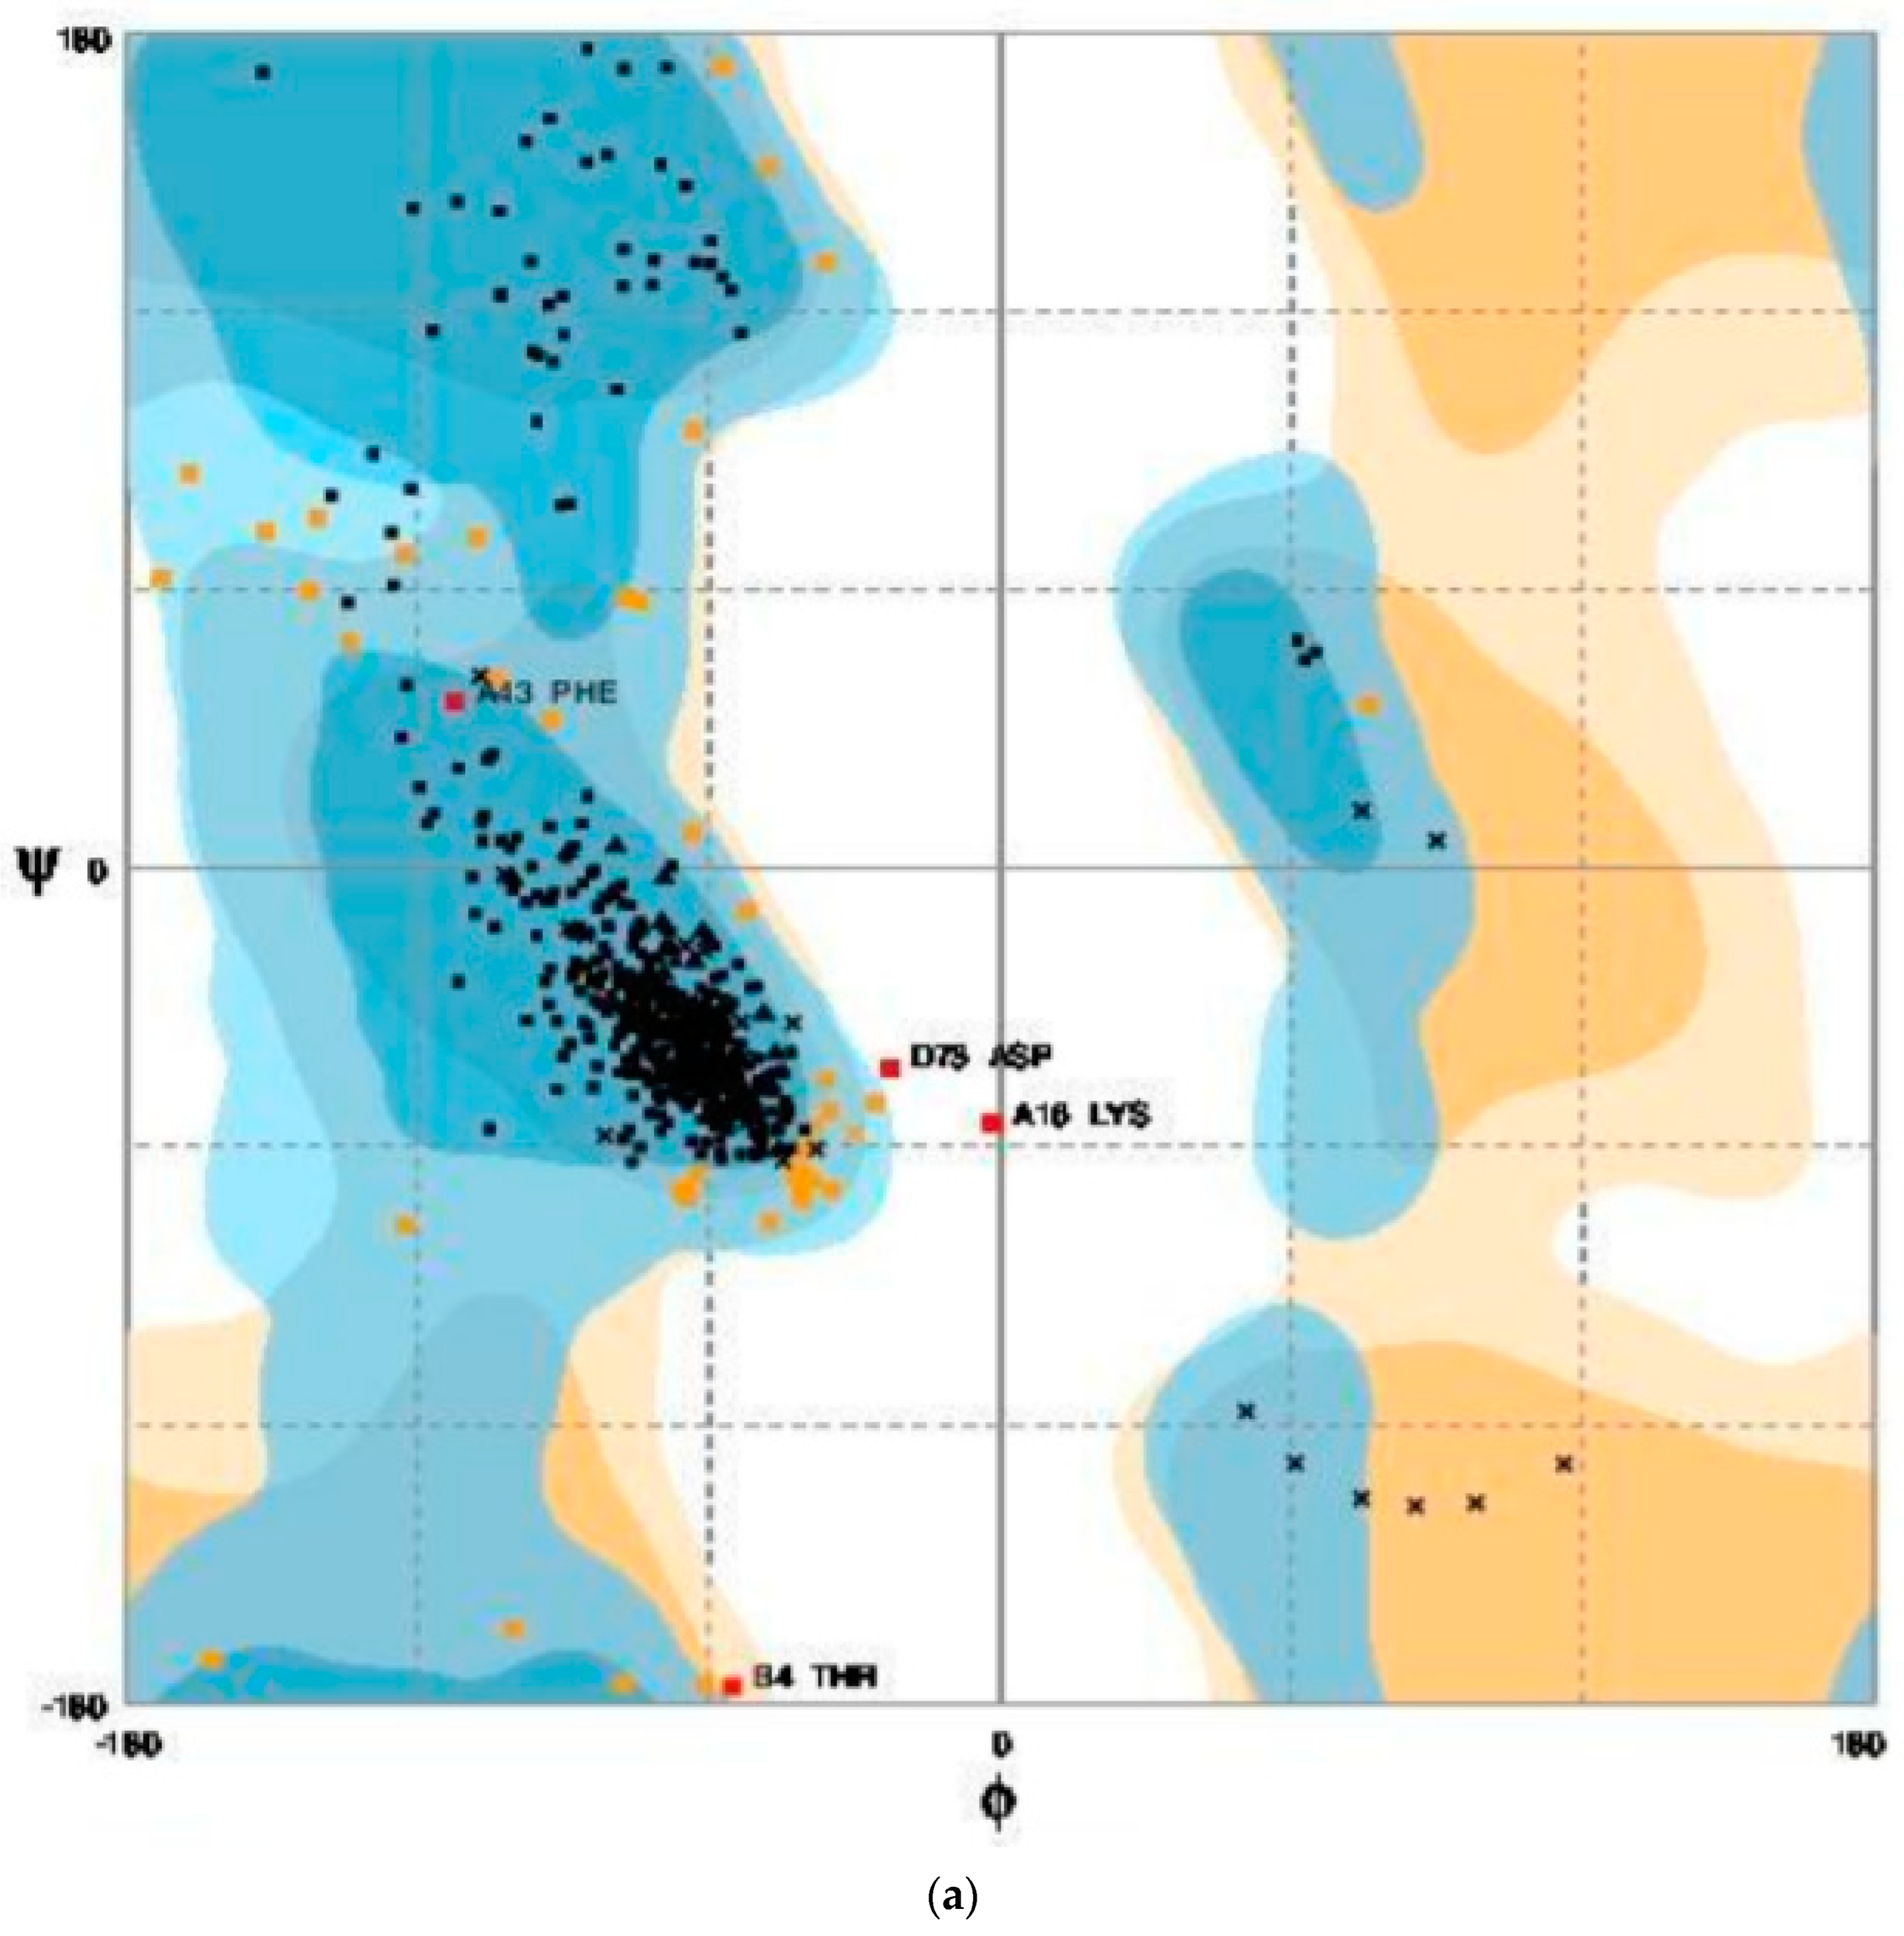
3.7. Structure Validation Using Ramachandran Plot

The selected four protein structures were uploaded to RAMPAGE to analyse the predicted structures, which produced the Ramachandran plots for the predicted protein structures as shown in Figure 9. In this plot, the amino acids (residues) have been identified in three distinct regions. The three distinct regions were favoured region, allowed region, and outlier region as shown in Table 2. Further structure validation was also performed through the ProSA server (https://prosa.services.came.sbg.ac.at/prosa.php (accessed on 3 February 2021)) to analyse the protein structure as shown in Figure 10.

3.8. Energy Minimisation

The energy minimisation was carried through SPDBV (Swiss PDB Viewer) (https://spdbv.vital-it.ch/ (accessed on 5 February 2021)) software for the predicted models. The values retrieved from the energy minimisation were analysed to identify the best protein structure which was predicted as shown in Table 3. MODELLER 6VAM A had the least energy content (E = 2468.876 KJ/mol).

3.9. Ligands from Bauhinia variegata

The three-dimensional structure in sdf format were downloaded from PubChem. The secondary metabolites were xanthophyll, beta-carotene, beta-sitosterol, dihydroquercetin, quercetin, stigma sterol, hentriacontane, octacosanol, flavanone, isoquericetroside, kaempeferol-3-glucoside, lupeol, myricetol, phenanthriquinone, quercitroside, and rutoside, as shown in Table 4.

3.10. Screening of Ligands through iGEMDOCK

All the downloaded ligands were interacted with the protein molecule (CALHM1). Table 5 shows how the Van der Waal forces, binding energy, and hydrogen bond were used to filter the best docked molecules. The structure of the screened docked protein– ligands are shown in Figure 11.

3.11. Molecular Docking Analysis through AutoDock Vina

Using the AutoDock vina program, the screened ligands were docked with CALHM1. The ligands were then sorted according to their minimal binding affinity. The optimum posture was determined based on the lowest binding affinity, as illustrated in Figure 12. Quercetin (CID: 5280343) exhibited the lowest binding affinity with CALHM1 according to molecular docking findings. The optimum energy value after comparing the poses of quercetin with CALHM1 was −12.45 Kcal/mol, as indicated in Table 6. The AutoDock vina energies were evaluated.

3.12. Cheminformatics Properties and Lipinski’s Rule of Five Validation of Quercetin

The cheminformatics properties were studied for quercetin. The properties were molecular formula, molecular weight (g/mol), molar refractivity (cm3), density (cm3), drug likeness, etc., as shown in Table 7. The molecular weight of quercetin was 302.24 g/mol, the value of log P was 0.56, molecular refractivity was 122.60 cm3. The comparative result of quercetin predicts it to be a good candidate. Quercetin was also validated for its Lipinski’s rule of five properties, the value of quercetin predicted <10 hydrogen bond acceptors, <5 hydrogen bond donors, <500 g/mol molecular weight, <5 log P value [26].

3.13. Quercetin’s Pharmacokinetic Properties

Properties such as absorption, distribution, metabolism, excretion and toxicity properties (ADMET) were analysed for quercetin under pharmacokinetics.
The absorption property was analysed by intestinal water solubility at −2.925 log mol/L, and the intestinal solubility was found to be 96.902 percent, and the skin permeability value was −2.735 log Kp, which showed a strong quercetin structure that validated its good behaviour in terms of drug likeness. The blood brain barrier (BBB) and central nervous system (CNS) permeability values of quercetin were analysed for distribution properties with a weak BBB value of −1.098 log BB. However, the permeability value of the central nervous system (CNS) was −3.065 log PS. The CYP3A4 substrate, which is the isoform of cytochrome P450, confirmed the metabolism property. The property of excretion showed that the total clearance value was 0.407, which showed that quercetin had nontoxic actions, and nontoxicity was inferred [27]. Table 8 shows all of the results.

3.14. Molecular Dynamic Simulations Analysis

The protein target (CALHM1) along with quercetin and CALHM1 were selected for the molecular dynamics simulations to check the conformations. Using the GROMACS, the trajectories were analysed in terms of RMSD (root mean square deviation), Rg (radius of gyration), SASA (solvent accessible surface area), and RMSF (root mean square fluctuation).

3.15. Root Mean Square Deviation (RMSD)

The RMSD was used to identify the stability of unliganded CALHM1 and CALHM1 with quercetin. The system was in balance, with RMSD fluctuating about 2500 ps. As seen in Figure 13, the backbone atoms grew up to around 0.23 nm before stabilising until the end of the simulation, showing that the molecular system was then properly set.

3.16. Radius of Gyration

After around 2500 ps, the systems stabilised, indicating that the molecular dynamics simulation equilibrated. The CALHM1–quercetin binding was anticipated to be excellent based on the radius of gyration. As illustrated in Figure 14, the environment does not alter during contact.

3.17. Solvent Accessible Surface Area (SASA)

The CALHM1 total solvent exposed surface area was displayed at 10,000 ps. The differences seen in the SASA graph were a bit similar to those of the radius of gyration. As demonstrated in Figure 15, it can be seen that there is a similarity between the SASA and the radius of gyration, which shows the accuracy in the simulation results.

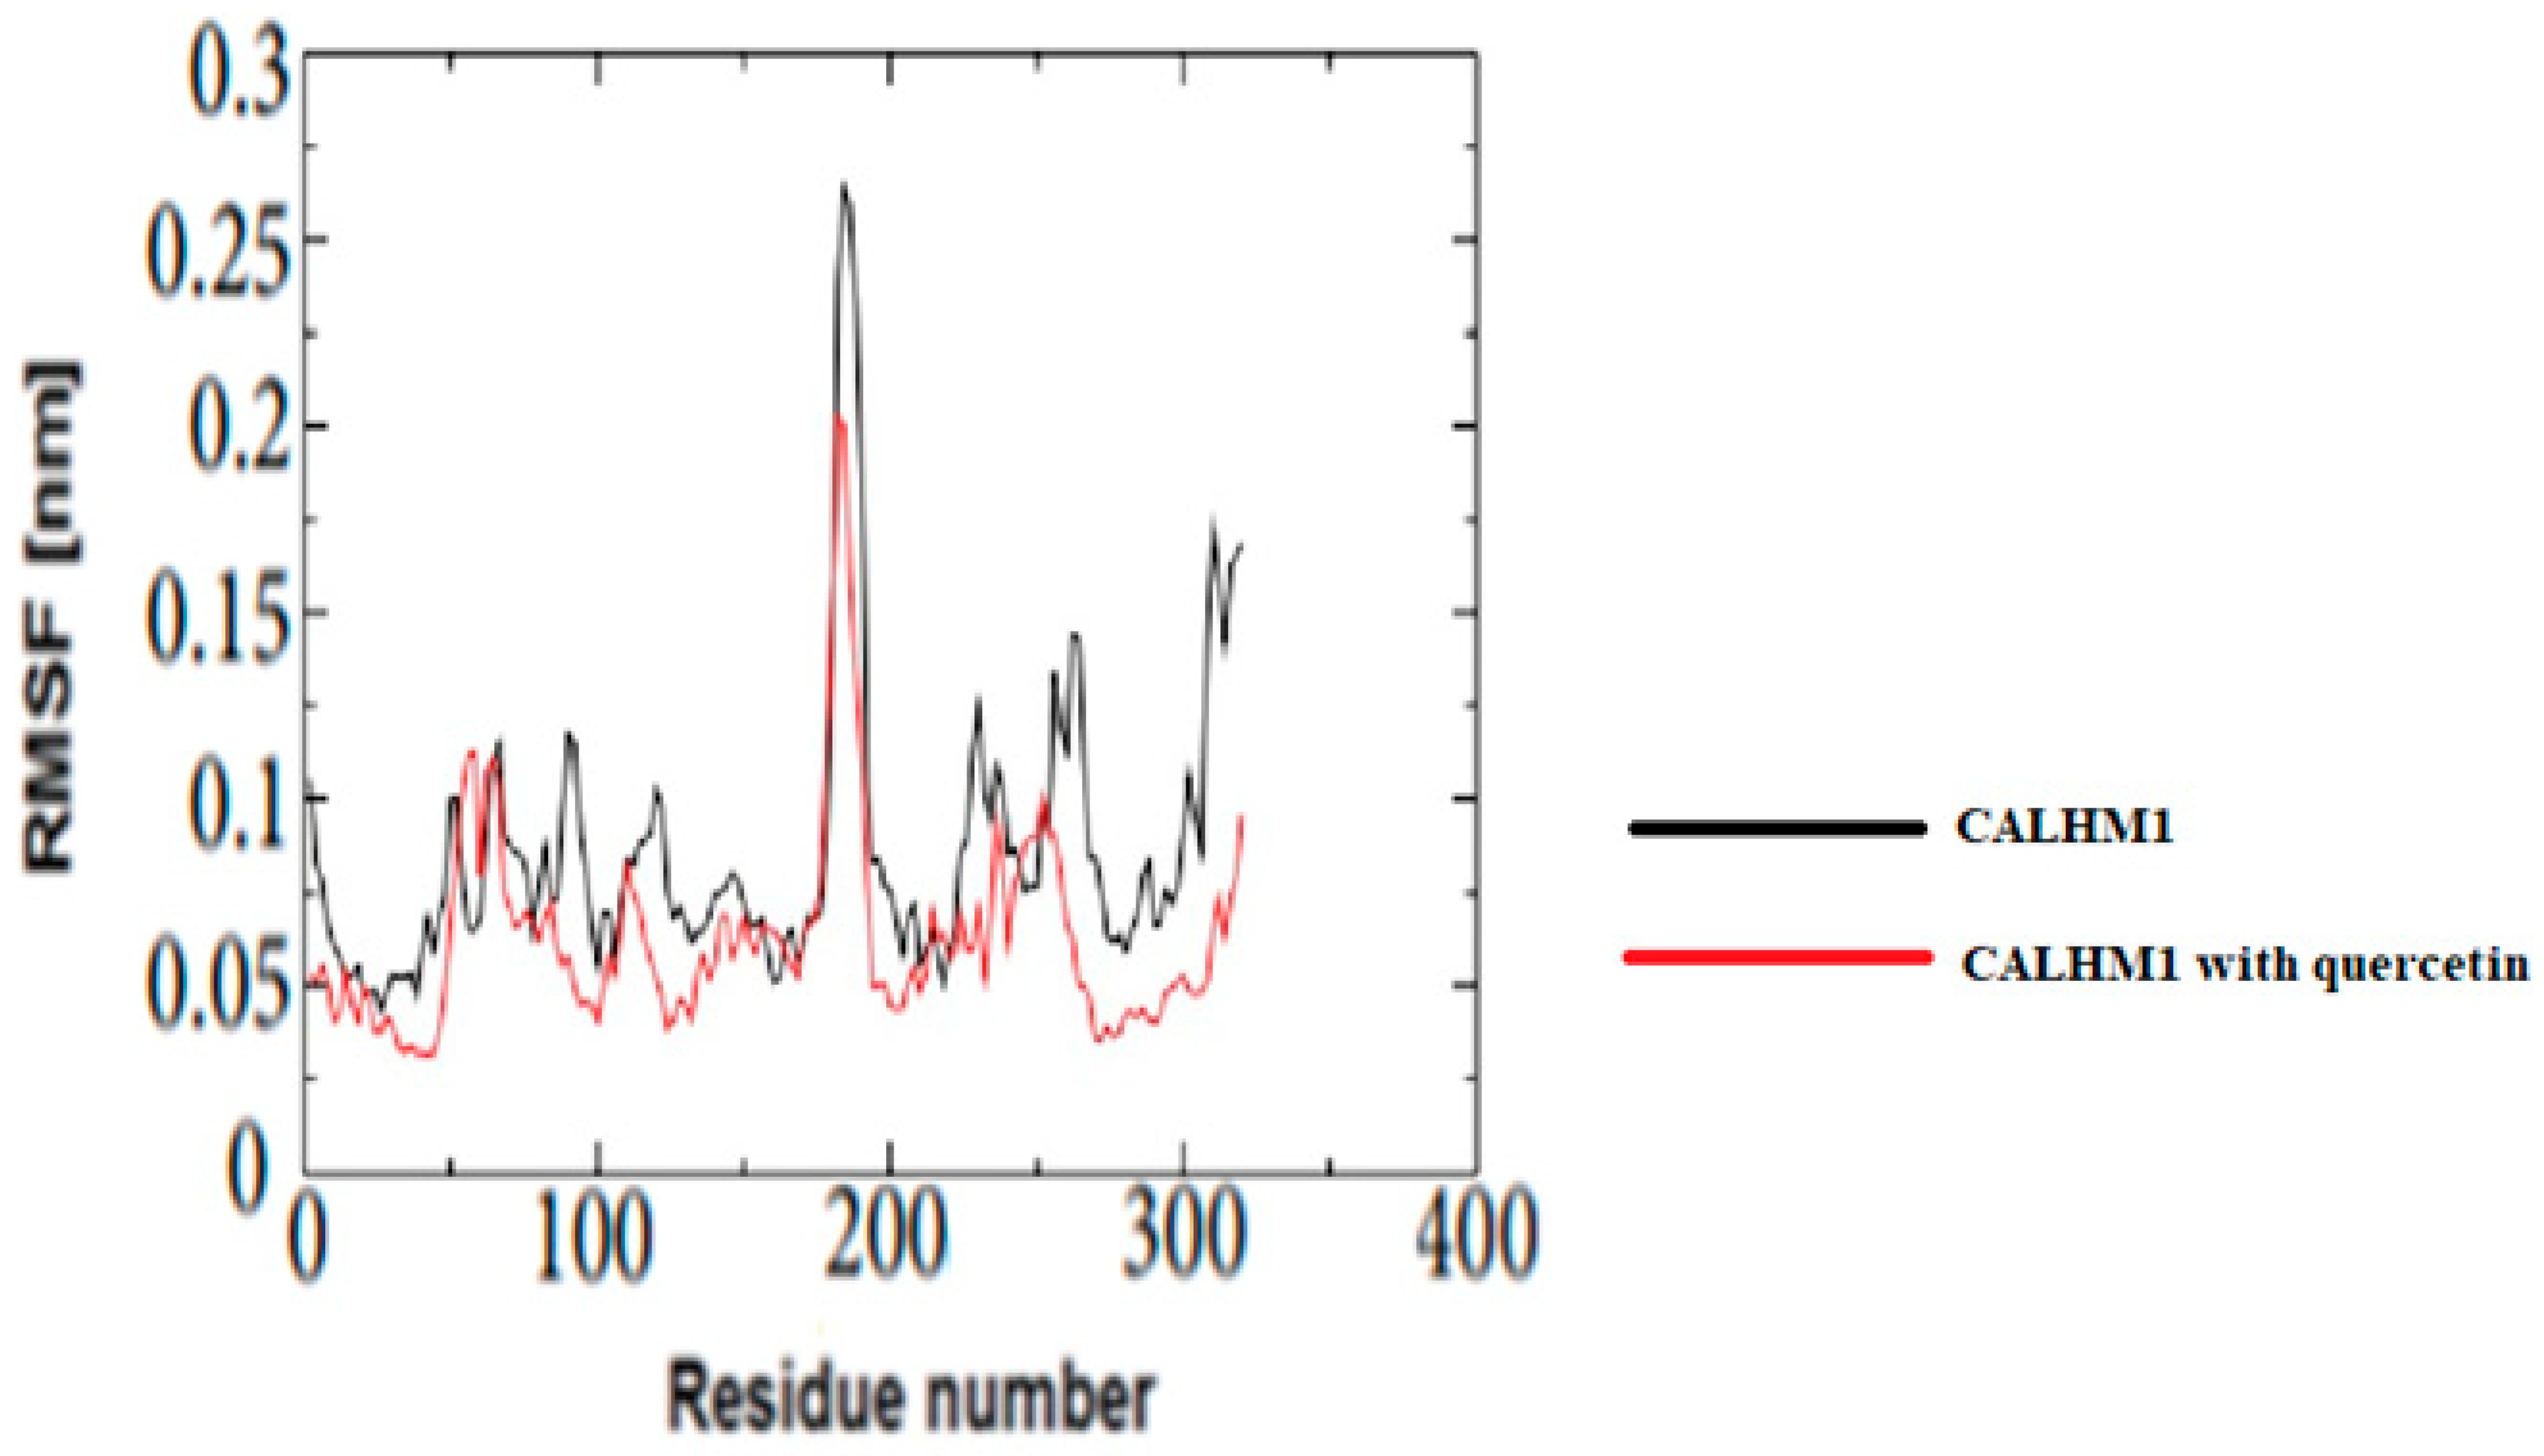
3.18. Root Mean Square Fluctuation (RMSF)

The RMSF was used to investigate the mobility of CALHM1 residues in the presence and absence of ligands. The findings show that variations greater than 0.25 nm indicate residues located far from each ligand’s binding sites. Furthermore, as seen in Figure 16, the residues in contact with the quercetin were the most stable and had the lowest RMSF values.

4. Conclusions

In recent years, there has been a huge growth in the use of various software and algorithms to predict protein structure using in silico methods. However, the precision of structure prediction, the severity of fold assignment errors, and the modelling of side chains and loops all need a significant body shift. CALHM1 (calcium homeostasis modulator 1) is involved in the pathogenesis of Alzheimer’s disease. CALHM1’s various models were developed and verified using homology modelling and Rampage. The interaction of alkaloids and flavonoids with CALHM1 was tested using the Bauhinia variegata plant. The model created with MODELLER software and 6VAM A was chosen because it performed best on the Ramachandran plot. Quercetin was shown to be the best choice for the protein molecule, with a minimum binding energy of −12.45 kcal/mol, and its ADME qualities were assessed using Molsoft and Molinspiration. At 2500 ps, CALHM1 and the CALHM1–quercetin combination became stable, according to molecular dynamics simulations. Finally, the in silico analysis suggested that quercetin might be a suitable therapeutic inhibitor. Quercetin may operate as a good inhibitor for treating Alzheimer’s disease, according to in silico research using molecular docking and molecular dynamics simulations, and future in vitro and in vivo investigations may establish its therapeutic potential.

Author Contributions

N.K.—Performed the entire experiment. S.K.M., S.M.D.R., H.M.A., S.A.A., W.A., Q.Z. and C.V.—They all helped in performing the experiment. S.K.J. and N.K.J.—They both helped in designing and preparing the manuscript. D.I. and A.K.J.—They conceived the idea and prepared the manuscript. All authors have read and agreed to the published version of the manuscript.

Funding

This research was funded by a Deanship of Scientific Research at Majmaah University under project no. R-2022-177.

Institutional Review Board Statement

Not applicable.

Informed Consent Statement

Not applicable.

Data Availability Statement

Not applicable.

Acknowledgments

The authors are very thankful to the Institute of Technology and Management, Meerut, Uttar Pradesh, India, Shri Ramswaroop Memorial University, India and Institute of Applied Medicines and Research, Ghaziabad, India for providing a good platform to carry out the research work. The authors would also like to thank Deanship of Scientific Research at Majmaah University for supporting this work under project no. R-2022-177.

Conflicts of Interest

The authors declare no conflict of interest.

References

  1. Chandra, P.M.; Venkateshwar, J. Biological evaluation of Schiff bases of new isatin derivatives for anti Alzheimer’s activity. Asian J. Pharm. Clin. Res. 2014, 7, 114–117. Available online: https://innovareacademics.in/journals/index.php/ajpcr/article/view/966 (accessed on 31 December 2020).
  2. Khare, N.; Maheshwari, S.K.; Jha, A.K. Screening and identification of secondary metabolites in the bark of Bauhinia variegata to treat Alzheimer’s disease by using molecular docking and molecular dynamics simulations. J. Biomol. Struct. Dyn. 2020, 39, 5988–5998. [Google Scholar] [CrossRef]
  3. Ma, Z.; Siebert, A.P.; Cheung, K.H.; Lee, R.J.; Johnson, B.; Cohen, A.S.; Foskett, J.K. Calcium homeostasis modulator 1 (CALHM1) is the pore-forming subunit of an ion channel that mediates extracellular Ca2+ regulation of neuronal excitability. Proc. Natl. Acad. Sci. USA 2012, 109, E1963–E1971. [Google Scholar] [CrossRef]
  4. Syrjanen, J.L.; Michalski, K.; Chou, T.H.; Grant, T.; Rao, S.; Simorowski, N.; Furukawa, H. Structure and assembly of calcium homeostasis modulator proteins. Nat. Struct. Mol. Biol. 2020, 27, 150–159. [Google Scholar] [CrossRef] [PubMed]
  5. Rubio, M.F.; Seto, S.N.; Pera, M.; Bosch, M.M.; Plata, C.; Belbin, O.; Soininen, H. Rare variants in calcium homeostasis modulator 1 (CALHM1) found in early onset Alzheimer’s disease patients alter calcium homeostasis. PLoS ONE 2013, 8, e74203. [Google Scholar]
  6. Ma, Z.; Tanis, J.E.; Taruno, A.; Foskett, J.K. Calcium homeostasis modulator (CALHM) ion channels. Pflüg. Arch.-Eur. J. Physiol. 2016, 468, 395–403. [Google Scholar] [CrossRef] [PubMed]
  7. Taruno, A.; Vingtdeux, V.; Ohmoto, M.; Ma, Z.; Dvoryanchikov, G.; Li, A.; Koppel, J. CALHM1 ion channel mediates purinergic neurotransmission of sweet, bitter and umami tastes. Nature 2013, 495, 223–226. [Google Scholar] [CrossRef] [PubMed]
  8. Nacmias, B.; Tedde, A.; Bagnoli, S.; Lucenteforte Cellini, E.; Piaceri, I.; Sorbi, S. Lack of implication for CALHM1 P86L common variation in Italian patients with early and late onset Alzheimer’s disease. J. Alzheimer’s Dis. 2010, 20, 37–41. [Google Scholar] [CrossRef]
  9. Bigiani, A. Calcium homeostasis modulator 1-like currents in rat fungiform taste cells expressing amiloride-sensitive sodium currents. Chem. Senses 2017, 42, 343–359. [Google Scholar] [CrossRef] [PubMed]
  10. Dreses, W.U.; Lambert, J.C.; Vingtdeux, V.; Zhao, H.; Vais, H.; Siebert, A.; Pasquier, F. A polymorphism in CALHM1 influences Ca2+ homeostasis, Aβ levels, and Alzheimer’s disease risk. Cell 2008, 133, 1149–1161. [Google Scholar] [CrossRef]
  11. Dreses, W.U.; Vingtdeux, V.; Zhao, H.; Chandakkar, P.; Davies, P.; Marambaud, P. CALHM1 controls the Ca2+-dependent MEK, ERK, RSK and MSK signaling cascade in neurons. J. Cell Sci. 2013, 126, 1199–1206. [Google Scholar] [CrossRef] [PubMed]
  12. Wu, S.; Zhang, Y. MUSTER: Improving protein sequence profile–profile alignments by using multiple sources of structure information. Proteins 2008, 72, 547–556. [Google Scholar] [CrossRef] [PubMed]
  13. Orry, A.J.; Abagyan, R. Homology Modeling: Methods and Protocols; Humana Press: New York, NY, USA, 2012. [Google Scholar]
  14. Karim, R.; Aziz, M.; Al, M.; Shatabda, S.; Rahman, M.S.; Mia, M. CoMOGrad and PHOG: From computer vision to fast and accurate protein tertiary structure retrieval. Sci. Rep. 2015, 5, 13275. [Google Scholar] [CrossRef]
  15. Drozdetskiy, A.; Cole, C.; Procter, J.; Barton, G.J. JPred4: A protein secondary structure prediction server. Nucleic Acids Res. 2015, 43, W389–W394. [Google Scholar] [CrossRef]
  16. Liu, J.; Wu, T.; Guo, Z.; Hou, J.; Cheng, J. Improving protein tertiary structure prediction by deep learning and distance prediction in CASP14. Proteins 2022, 90, 58–72. [Google Scholar] [CrossRef]
  17. Waterhouse, A.; Bertoni, M.; Bienert, S.; Studer, G.; Tauriello, G.; Gumienny, R.; Schwede, T. SWISS-MODEL: Homology modelling of protein structures and complexes. Nucleic Acids Res. 2018, 46, W296–W303. [Google Scholar] [CrossRef] [PubMed]
  18. Marhefka, C.A.; Moore, B.M.; Bishop, T.C.; Kirkovsky, L.; Mukherjee, A.; Dalton, J.T.; Miller, D.D. Homology modeling using multiple molecular dynamics simulations and docking studies of the human androgen receptor ligand binding domain bound to testosterone and nonsteroidal ligands. J. Med. Chem. 2001, 44, 1729–1740. [Google Scholar] [CrossRef] [PubMed]
  19. Khare, P.; Kishore, K.; Sharma, D. A study on the standardization parameters of Bauhinia variegate. Asian J. Pharm. Clin. Res. 2017, 10, 133–136. [Google Scholar] [CrossRef]
  20. Dallakyan, S.; Olson, A.J. Small-molecule library screening by docking with PyRx. In Chemical Biology; Humana Press: New York, NY, USA, 2015; pp. 243–250. [Google Scholar]
  21. Nousheen, L.; Akkiraju, P.C.; Enaganti, S. Molecular docking mutational studies on human surfactant protein-D. World J. Pharm. Res. 2014, 3, 1140–1148. [Google Scholar]
  22. Fuhrmann, J.; Rurainski, A.; Lenhof, H.P.; Neumann, D. A new Lamarckian genetic algorithm for flexible ligand-receptor docking. J. Comput. Chem. 2010, 31, 1911–1918. [Google Scholar] [CrossRef]
  23. Pires, D.E.; Blundell, T.L.; Ascher, D.B. pkCSM: Predicting small-molecule pharmacokinetic and toxicity properties using graphbased signatures. J. Med. Chem. 2015, 58, 4066–4072. [Google Scholar] [CrossRef] [PubMed]
  24. Van, S.P.D.; Lindahl, E.; Hess, B.; Groenhof, G.; Mark, A.E.; Berendsen, H.J. GROMACS: Fast, flexible, and free. J. Comput. Chem. 2005, 26, 1701–1718. [Google Scholar]
  25. Iqbal, D.; Khan, M.S.; Waiz, M.; Rehman, M.T.; Alaidarous, M.; Jamal, A.; Alothaim, A.S.; AlAjmi, M.F.; Alshehri, B.M.; Banawas, S.; et al. Exploring the Binding Pattern of Geraniol with Acetylcholinesterase through In Silico Docking, Molecular Dynamics Simulation, and In Vitro Enzyme Inhibition Kinetics Studies. Cells 2021, 10, 3533. [Google Scholar] [CrossRef]
  26. Iqbal, D.; Rehman, M.T.; Bin Dukhyil, A.; Rizvi, S.M.D.; Al Ajmi, M.F.; Alshehri, B.M.; Alsaweed, M. High-Throughput Screening and Molecular Dynamics Simulation of Natural Product-like Compounds against Alzheimer’s Disease through Multitarget Approach. Pharmaceuticals 2021, 14, 937. [Google Scholar] [CrossRef] [PubMed]
  27. Ongey, E.L.; Yassi, H.; Pflugmacher, S.; Neubauer, P. Pharmacological and pharmacokinetic properties of lanthipeptides undergoing clinical studies. Biotechnol. Lett. 2017, 39, 473–482. [Google Scholar] [CrossRef] [PubMed]
Figure 1. Protein sequence of CALHM1.
Brainsci 12 00770 g001
Figure 2. CFSSP result.
Brainsci 12 00770 g002
Figure 3. GOR4 result (dark blue is denoting alpha helix, light blue is denoting pi helix, dark pink is denoting beta bridge, red is denoting extended strands).
Brainsci 12 00770 g003
Figure 4. SOPMA result (dark blue is denoting alpha helix, green is denoting pi helix, dark pink is denoting beta bridge, red is denoting extended strands).
Brainsci 12 00770 g004
Figure 5. Best predicted model by MODELLER (6VAM A).
Brainsci 12 00770 g005
Figure 6. Best predicted model by MODELLER (6LMT A).
Brainsci 12 00770 g006
Figure 7. Best predicted model by LOMETS.
Brainsci 12 00770 g007
Figure 8. Best predicted model by MUSTER.
Brainsci 12 00770 g008
Figure 9. Ramachandran plots for (a) MODELLER (6VAM A); (b) MODELLER (6LMT A); (c) LO-ETS server; (d) MUSTER server.
Brainsci 12 00770 g009aBrainsci 12 00770 g009bBrainsci 12 00770 g009c
Figure 10. Quality of the protein structure (ProSA Server).
Brainsci 12 00770 g010
Figure 11. Molecular docking analysis: (a) pose view of CALHM1 with betacarotene; (b) pose view of CALHM1 with betasitosterol; (c) pose view of CALHM1 with quercetin; (d) pose view of CALHM1 with stigmasterol; (e) pose view of CALHM1 with xanthophyll; (f) pose view of CALHM1 with dihydroquercetin.
Brainsci 12 00770 g011aBrainsci 12 00770 g011b
Figure 12. CALHM1 docking and Ligplot interaction with quercetin. (a) The hydrogen bond distance between the docked ligand and the active site is shown; (b) a two-dimensional depiction of a ligand and a protein residue.
Brainsci 12 00770 g012
Figure 13. Time dependence of root mean square deviation. RMSD values for unliganded CALHM1 and CALHM1–quercetin complex.
Brainsci 12 00770 g013
Figure 14. Radius of gyration (Rg) during 10,000 ps of MD simulation of unliganded CALHM1 and CALHM1–quercetin complex.
Brainsci 12 00770 g014
Figure 15. Solvent accessible surface area (SASA) during 10,000 ps of MD simulation of unliganded CALHM1 and CALHM1–quercetin complex.
Brainsci 12 00770 g015
Figure 16. The RMSF values of unliganded CALHM1 and CALHM1–quercetin complex.
Brainsci 12 00770 g016
Table 1. CALHM1 BLAST parameters.
Query CoverE-ValueIdentityAccession
99%6 × 10−16968.36%6VAM A
88%4 × 10−13958.82%6LMT A
Table 2. Ramachandran plot for each model.
MODELLERLOMETSMUSTER
6VAM A6LMT A
Favoured region187172177196
Allowed region561410
Outlier region23156
Table 3. Energy minimisation values through SPDBV.
MODELLERLOMETSMUSTER
6VAM A6LMT A
Energy (KJ/mol)2468.8765688.25510,265.8898714.236
Table 4. Compounds and their respective PubChem IDs.
CompoundPubChem ID
HentriacontaneCID: 12410
OctacosanolCID:68406
StigmasterolCID:5280794
BetasitosterolCID:222284
FlavanoneCID:10251
IsoquericetrosideCID:5484006
Kaempeferol-3-glucosideCID:6325460
LupeolCID:259846
MyricetolCID:5281672
PhenanthriquinoneCID:6763
QuercitrosideCID:5280459
RutosideCID:5280805
XanthophyllCID:5281243
Beta- caroteneCID:5280489
DihydroquercetinCID:439533
QuercetinCID:5280343
Table 5. Initial docking by iGEMDOCK.
LigandsBinding EnergyVDWHBond
Quercetin (CID: 5280343)−12.66−22.13−2.34
Dihydroquercetin (CID: 439533)−10.30−21.11−2.18
Beta-carotene (CID: 5280489)−10.26−20.11−3.42
Xanthophylls (CID: 5281243)−8.20−11.33−4.57
Stigma sterol (CID: 5280794)−7.80−29.20−7.6
Beta-sitosterol (CID: 222284)−6.70−30.29−3.41
Table 6. Docking result of quercetin against CALHM1.
S.NoModeAffinity (kcal/mol)Distance From Best Mode RMSD l.bDistance From Best Mode RMSD u.b
1.1−12.450.0000.000
2.2−12.3421.11520.357
3.3−12.1212.23512.514
4.4−11.659.6566.524
5.5−11.258.4592.722
6.6−10.818.28710.650
7.7−9.457.7751.089
8.8−9.326.00211.924
9.9−8.236.02814.615
Table 7. Cheminformatics properties of quercetin.
Molecular FormulaC15H10O7
Molecular weight (g/mol)302.24
Hydrogen bond acceptor7
Hydrogen bond donor5
Rotatable bonds1
Log p0.56
No of atoms22
Polar surface area (A2)103.49 A2
Molar refractivity (cm3)122.60
Density (cm3)1.23
Molar volume (cm3)268.73 cm3
Drug likeness1
Lipinski validationyes
GPCR ligand−0.06
Ion channel modulator−0.19
Kinase inhibitor0.28
Nuclear receptor ligand0.36
Protease inhibitor−0.25
Enzyme inhibitor0.28
Table 8. Pharmacokinetic properties of quercetin.
S.No.PropertyModel NamePredicted ValueUnit
1.AbsorptionWater solubility−2.925Numeric (log mol/L)
2.AbsorptionCaco2 permeability−0.229Numeric (log Papp in 10–6 cm/s)
3.AbsorptionIntestinal absorption (human)96.902Numeric (% absorbed)
4.AbsorptionSkin permeability−2.735Numeric (log Kp)
5.AbsorptionP-glycoprotein substrateYesCategorical (Yes/No)
6.AbsorptionP-glycoprotein I inhibitorNoCategorical (Yes/No)
7.AbsorptionP-glycoprotein II inhibitorNoCategorical (Yes/No)
8.DistributionVDss (human)1.559Numeric (log L/kg)
9.DistributionFraction unbound (human)0.206Numeric (Fu)
10.DistributionBBB permeability−1.098Numeric (log BB)
11.DistributionCNS permeability−3.065Numeric (log PS)
12.MetabolismCYP2D6 substrateNoCategorical (yes/no)
13.MetabolismCYP3A4 substrateNoCategorical (yes/no)
14.MetabolismCYP1A2 inhibitorYesCategorical (yes/no)
15.MetabolismCYP2C19 inhibitorNoCategorical (yes/no)
16.MetabolismCYP2C9 inhibitorNoCategorical (yes/no)
17.MetabolismCYP2D6 inhibitorNoCategorical (yes/no)
18.MetabolismCYP3A4 inhibitorNoCategorical (yes/no)
19.ExcretionTotal clearance0.407Numeric (log ml/min/kg)
20.ExcretionRenal OCT2 substrateNoCategorical (yes/no)
21.ToxicityAMES toxicityNoCategorical (yes/no)
22.ToxicityMax. tolerated dose (human)0.499Numeric (log mg/kg/day)
23.ToxicityhERG I inhibitorNoCategorical (yes/no)
24.ToxicityhERG II inhibitorNoCategorical (yes/no)
25.ToxicityOral rat acute toxicity (LD50)2.471Numeric (mol/kg)
26.ToxicityOral rat chronic toxicity (LOAEL)2.612Numeric (log mg/kg_bw/day)
27.ToxicityHepatotoxicityNoCategorical (yes/no)
28.ToxicitySkin sensitisationNoCategorical (yes/no)
29.ToxicityT. pyriformis toxicity0.288Numeric (log μg/L)
30.ToxicityMinnow toxicity3.721Numeric (log mM)
Publisher’s Note: MDPI stays neutral with regard to jurisdictional claims in published maps and institutional affiliations.

