Identification of Crucial Candidate Genes and Pathways in Glioblastoma Multiform by Bioinformatics Analysis


1
Department of Clinical Pharmacy, College of Pharmacy, Najran University, Najran 61441, Saudi Arabia
2
Department of Pharmaceutics, SET`S College of Pharmacy, Dharwad, Karnataka 580002, India
3
Department of Pharmacology, College of Pharmacy, Najran University, Najran 61441, Saudi Arabia
4
Biostatistics and Bioinformatics, Chanabasava Nilaya, Bharthinagar, Dharwad 580001, Karnataka, India
*
Author to whom correspondence should be addressed.
Biomolecules 2019, 9(5), 201; https://doi.org/10.3390/biom9050201
Submission received: 9 April 2019
/
Revised: 17 May 2019
/
Accepted: 23 May 2019
/
Published: 24 May 2019
(This article belongs to the Special Issue Biomarkers for Cancer)
Abstract
:The present study aimed to investigate the molecular mechanisms underlying glioblastoma multiform (GBM) and its biomarkers. The differentially expressed genes (DEGs) were diagnosed using the limma software package. The ToppGene (ToppFun) was used to perform pathway and Gene Ontology (GO) enrichment analysis of the DEGs. Protein-protein interaction (PPI) networks, extracted modules, miRNA-target genes regulatory network and TF-target genes regulatory network were used to obtain insight into the actions of DEGs. Survival analysis for DEGs was carried out. A total of 590 DEGs, including 243 up regulated and 347 down regulated genes, were diagnosed between scrambled shRNA expression and Lin7A knock down. The up-regulated genes were enriched in ribosome, mitochondrial translation termination, translation, and peptide biosynthetic process. The down-regulated genes were enriched in focal adhesion, VEGFR3 signaling in lymphatic endothelium, extracellular matrix organization, and extracellular matrix. The current study screened the genes in the PPI network, extracted modules, miRNA-target genes regulatory network, and TF-target genes regulatory network with higher degrees as hub genes, which included NPM1, CUL4A, YIPF1, SHC1, AKT1, VLDLR, RPL14, P3H2, DTNA, FAM126B, RPL34, and MYL5. Survival analysis indicated that the high expression of RPL36A and MRPL35 were predicting longer survival of GBM, while high expression of AP1S1 and AKAP12 were predicting shorter survival of GBM. High expression of RPL36A and AP1S1 were associated with pathogenesis of GBM, while low expression of ALPL was associated with pathogenesis of GBM. In conclusion, the current study diagnosed DEGs between scrambled shRNA expression and Lin7A knock down samples, which could improve our understanding of the molecular mechanisms in the progression of GBM, and these crucial as well as new diagnostic markers might be used as therapeutic targets for GBM.
1. Introduction
Glioblastoma multiform (GBM) is a malignancy that occurs in the astrocytes and it is the most common type of central nervous system cancer in adults worldwide [1]. In recent decades, the mortality caused by glioblastoma has diminished dramatically owing to the great development in early identification and treatment [2]. However, glioblastoma debris is an outstanding global health problem that may be associated to the absence of exhaustive systemic and sympathetic underlying molecular mechanisms of tumorigenesis. The metastasis and recurrence of GBM as well as its indigent prognosis, results in indigent survival for patients [3]. Thus, an enhanced interpretation of the elemental molecular mechanisms and gene networks associated in the development and advancement of GBM is required.
Various studies on the mechanisms and therapeutic actions for the treatment of GBM have been disclosed to date [4]. Exposure to prior radiation, cigarette smoking, alcohol consumption, use of drugs of any kind, or dietary intake of cured or smoked meat or fish, is considered to be a significant risk factor for the development of GBM [5]. During cancer development, multiple biomarkers experience upor down regulation [6]. A number of biomarkers and signaling pathways linked in the advancement of GBM have already been diagnosed [7]. Graff et al. (2005) [8] reported that protein kinase Cβ (PKCβ) was an effective activator of angiogenesis and cancer growth in carcinomas of the brain. In addition, the authors noticed that the expression of SIRT2 was down regulated in patients with GBM [9]. Previous studies have established that expression of vascular endothelial growth factor (VGEF) is responsible for progression of GBM [10]. Additionally, epidermal growth factor receptor (EGFR), which participates in signaling pathways associated with various tumors such as lung cancer [11], colorectal cancer [12], head and neck cancer [13], and breast cancer [14], and this gene has been previously noticed to be over expressed in glioblastoma [15]. The tumor suppressor gene Lin7A decreases the invasion of GBM cells [16]. Lin7A knockdown may assist in advancement of GBM. The aim of our study is to know if the knockdown of Lin7A is responsible for invasion of GBM cells and also find out how it affects or alters the expression of other genes. In this study we identified differential expressed genes (DEGs) between scrambled shRNA expression and Lin7A knock down samples by various bioinformatics methods.
In the present study, we utilized the conception of this high-throughput method. Therefore, we examined the hub node recognition using the statistical methods and comparative analysis among the list of data compiled from numerous sources. We analyzed the differential expressed genes (DEGs) between scrambled shRNA expression and Lin7A knock down samples, in order to investigate the underlying molecular mechanisms of GBM. Afterwards, pathway and gene enrichment analysis were executed. Protein-protein interaction (PPI) networks and its modules were constructed and topological parameters such as degree, betweenness centrality, closeness centrality, stress centrality and clustering coefficient, in order to exercise and analyze target genes for the diagnosis and treatment of GBM. In addition, target gene-miRNA networks and target gene-TFs networks were constructed and analyzed. In addition, our study concentrated on the present developments around the GBM and their important differences underlined between the subgroups. Moreover, the heterogeneity of GBM has not been treated sufficiently in clinical trials, which is one of the enigmatic reasons for the challengein advancing the novel therapeutic approaches. This study aimed to diagnose protein-coding genes that can be used as molecular markers of early stage GBM.
2. Materials and Methods
2.1. Illumina Microarray Data
The microarray expression profile dataset E-MTAB-5871, which is based on the HumanHT-12 v4 Expression BeadChip (Illumina Way, San Diego, CA, USA), was downloaded from the European Bioinformatics Institute ArrayExpress database (https://www.ebi.ac.uk/arrayexpress/experiments/E-MTAB-5871/). The dataset contained 9 samples, including 3 scrambled shRNA expression samples, 3 Lin7A knock down samples, and 3 Lin7A knock down complemented by wild type Lin7A samples. In the current study, the scrambled shRNA expression, Lin7A knock down samples, and Lin7A knock down complemented by wild type Lin7A samples were analyzed by bioinformatics methods.
2.2. Data Preprocessing and Differential Expression Analysis
The authentic array data were transformed into expression measures. Background correction, data normalization, and probe summarization were performed using the quantile [17] algorithm in the R lumi package (https://www.bioconductor.org/packages/release/bioc/html/lumi.html) [18]. Paired test based on the Linear Models for Microarray Data package (https://bioconductor.org/packages/release/bioc/html/limma.html) [19] in R (https://www.rproject.org/) was used to identify DEGs between scrambled shRNA expression and Lin7A knock down samples. Multiple testing corrections were executed with the Benjamini-Hochberg method [20] to gain the adjusted p-value. Subsequently, log2fold change (log2FC) was determined. Only those genes indicating |log2FC| > 1.0 and adjusted p < 0.001 were regarded as DEGs.
2.3. Pathway Enrichment Analysis
By using online based software ToppGene (ToppFun) (https://toppgene.cchmc.org/enrichment.jsp) [21], which integrates different pathway databases such as Kyoto Encyclopedia of Genes and Genomes (KEGG; http://www.genome.jp/kegg/) [22], Pathway Interaction Database (PID, http://pid.nci.nih.gov/) [23], Reactome (https://reactome.org/PathwayBrowser/) [24], Molecular signatures database (MSigDB, http://software.broadinstitute.org/gsea/msigdb/) [25], GenMAPP (http://www.genmapp.org/) [26], Pathway Ontology (https://bioportal.bioontology.org/ontologies/PW) [27] and PantherDB (http://www.pantherdb.org/) [28]. In order to analyze the identified DEGs at the functional level, KEGG, PID, Reactome, MSigDB and PantherDB pathway analysis were performed using the ToppGene (ToppFun) online tool. p < 0.05 was set as the threshold value.
2.4. GO Term Enrichment Analysis
Gene Ontology (GO; http://geneontology.org/) [29] is a tool for consolidation of biology that compiles structured, defined, and disciplined glossary for huge scale gene annotation. The ToppGene (ToppFun) involves an extensive set of functional annotation tools that have been advanced for associating functional terms with lists of genes via clustering algorithms. In order to analyze the identified DEGs at the functional level, GO enrichment was performed using the ToppGene (ToppFun) online tool. p < 0.05 was set as the threshold value.
2.5. PPI Network Construction
Biomolecular Interaction Network Database (BIND, http://www.bind.ca/) [30], Human Protein Reference Database (HPRD, http://www.hprd.org/) [31], General Repository for Interaction Datasets (BioGRID, https://thebiogrid.org/) [32], The comprehensive resource of mammalian protein complexes (CORUM, http://mips.helmholtz-muenchen.de/corum/) [33], Database of Interacting Proteins (DIP, http://dip.doe-mbi.ucla.edu) [34], The International Molecular Exchange Consortium (IntAct, http://www.imexconsortium.org) [35], The Molecular INTeraction Database (MINT, http://mint.bio.uniroma2.it/mint/) [36], the Munich Information Center for Protein Sequences (MIPS) protein interaction resource on yeast (MPact, http://mips.gsf.de/genre/proj/mpact) [37], Mammalian Protein-Protein Interaction Database (MPPI, http://mips.gsf.de/proj/ppi/) [38], and The Online Predicted Human Interaction Database (OPHID, http://ophid.utoronto.ca) [39] are a precompiled global resource designed to evaluate PPI information. In the current study, the iRefIndex (http://irefindex.org/wiki/index.php?title=iRefIndex) [40] online tool was used to generate the graph file for the PPI network of DEGs, and those experimentally validated interactions with a combined score >0.4 were selected as significant.
The bulk of the PPI networks in the biological network constructed were noticed to obey topological properties [41]. Thus, the degree of connectivity, betweenness centrality, stress, closeness centrality, and clustering coefficient were statistically analyzed in networks using the cytoscape version 3.6.0 (www.cytoscape.org/) [42], to obtain the significant nodes or hub proteins [43] in the PPI networks. Subsequently, the overlapping target genes were identified and the miRNA-target gene pairs.
2.6. Module Analysis
Interaction reliability assessment and weighted clustering coefficient (PEWCC1) explain the densely connected nodes from the large protein-protein interaction (PPI) network, which can be called as modules [44]. The PEWCC1 algorithm used in the module construction limits the existence of a single node in more than one module. Further, if a single hub is interacting with more than one module with huge interactions, the node is attributed to be a super hub, which can physically allow us to restrict it as a crosstalk among the modules. The modules obtained were used for further analysis after refinement using degree of connectivity.
2.7. Construction of the Target Gene-miRNA Network
miRNet (http://www.mirnet.ca) [45] is an online tool for target gene-miRNA network generation, which integrates 10 miRNA database such as TarBase (http://diana.imis.athena-innovation.gr/DianaTools/index.php?r=tarbase/index) [46], miRTarBase (http://mirtarbase.mbc.nctu.edu.tw/php/download.php) [47], miRecords (http://miRecords.umn.edu/miRecords) [48], miR2Disease (http://www.mir2disease.org/) [49], the Human microRNA Disease Database HMDD (http://www.cuilab.cn/hmdd) [50], PhenomiR (http://mips.helmholtz-muenchen.de/phenomir/) [51], SM2miR (http://bioinfo.hrbmu.edu.cn/SM2miR/) [52], PharmacomiR (http://www.pharmaco-mir.org/) [53], EpimiR (http://bioinfo.hrbmu.edu.cn/EpimiR/) [54], and starBase (http://starbase.sysu.edu.cn/) [55]. The targategene-miRNA network was visualized using the Cytoscape version 3.6.0.
2.8. Construction of the Target Gene-TF-Network
NetworkAnalyst (https://www.networkanalyst.ca/) [56] is online tool for target gene-TF network generation, which integrates the ENCODE ChIP-seqTF database (https://www.encodeproject.org/) [57], which provided data on eukaryotic transcription factors, consensus binding sequences (positional weight matrices), experimentally confirmed binding sites, and regulated genes. The target gene-TF network was visualized using Cytoscape version 3.6.0 software.
2.9. Survival Analysis of Hub Genes
Gene expression profiling and interactive analyses (GEPIA, http://gepia.cancer-pku.cn/) [58] is a web-based database for exploring correlations between gene expression and cancer patient survival. The survival analysis of core genes was conducted by clinical data of GBM patients obtained from the TCGA and GTEx data portal, including the overall survival (OS) time and vital status. The patients were divided into the following two groups according to the median expression value of the diagnosed overlapping hub genes in the cancer group: High expression group and low expression group. The Kaplan–Meier curves of the two groups are drawn. p-value, 0.05 is set as a statistically significant threshold. Based on the GEPIA on the webpage, the hazard ratio (HR) with 95% confidence intervals and log rank p-values were calculated and the curves were generated.
2.10. The mRNA Expression Levels of Hub Genes in GBM
The expression level of all the prognosis-related genes identified by Kaplan–Meier analysis and Cox proportional hazard analysis was performed in boxplots to visualize the relationship between GBM and healthy tissue based on data from TCGA and GTEx. The expression level was expressed as mean (standard deviation). A p-value of 0.01 is considered statistically significant.
2.11. Mutation Analysis
The online tool CBio Cancer Genomics Portal (http://www.cbioportal.org) [59] is an open strong platform that is useful for visualization, analysis, and downloadinga large-scale cancer genomic dataset of GBM. This online tool is useful for investigators to find and compare genetic modifications across samples.
3. Results
3.1. Identification of DEGs
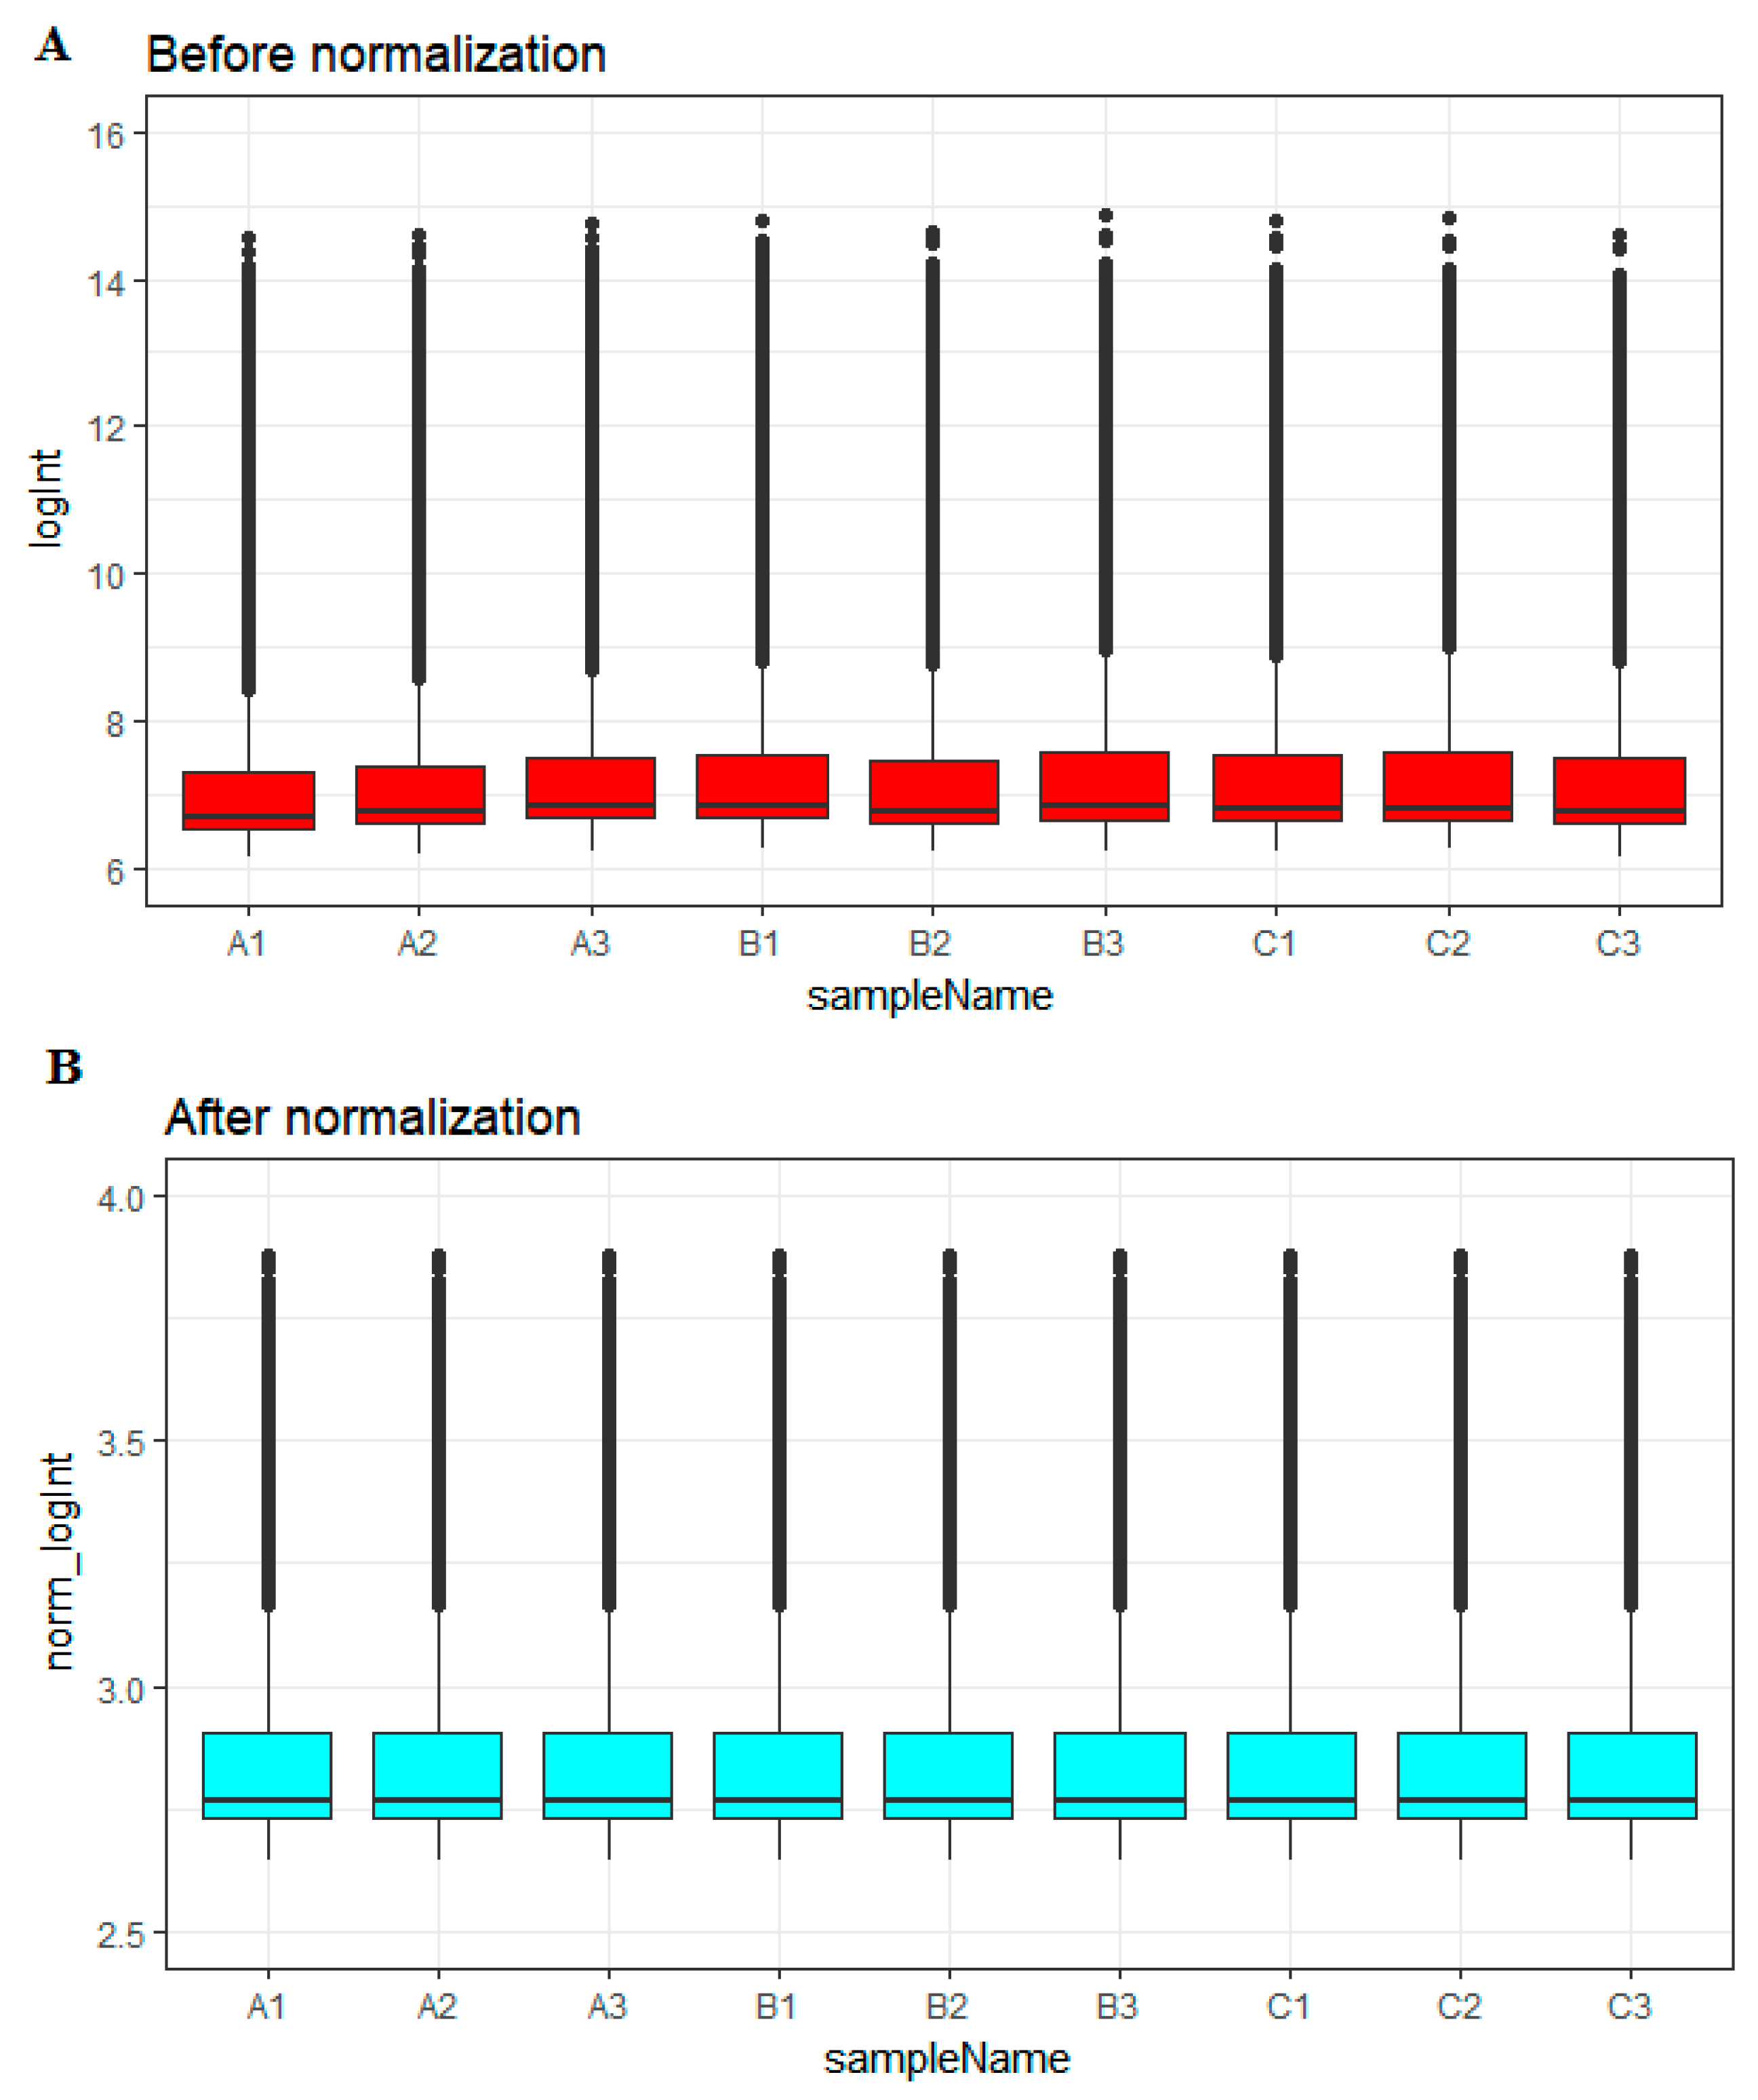
Before normalization, the medians of gene expression in each sample were notably recognizable (Figure 1A). However, the medians became persistent and were at a similar level following normalization (Figure 1B), advising us that the normalization process was fruitful and the normalized data may be used for additional analysis.
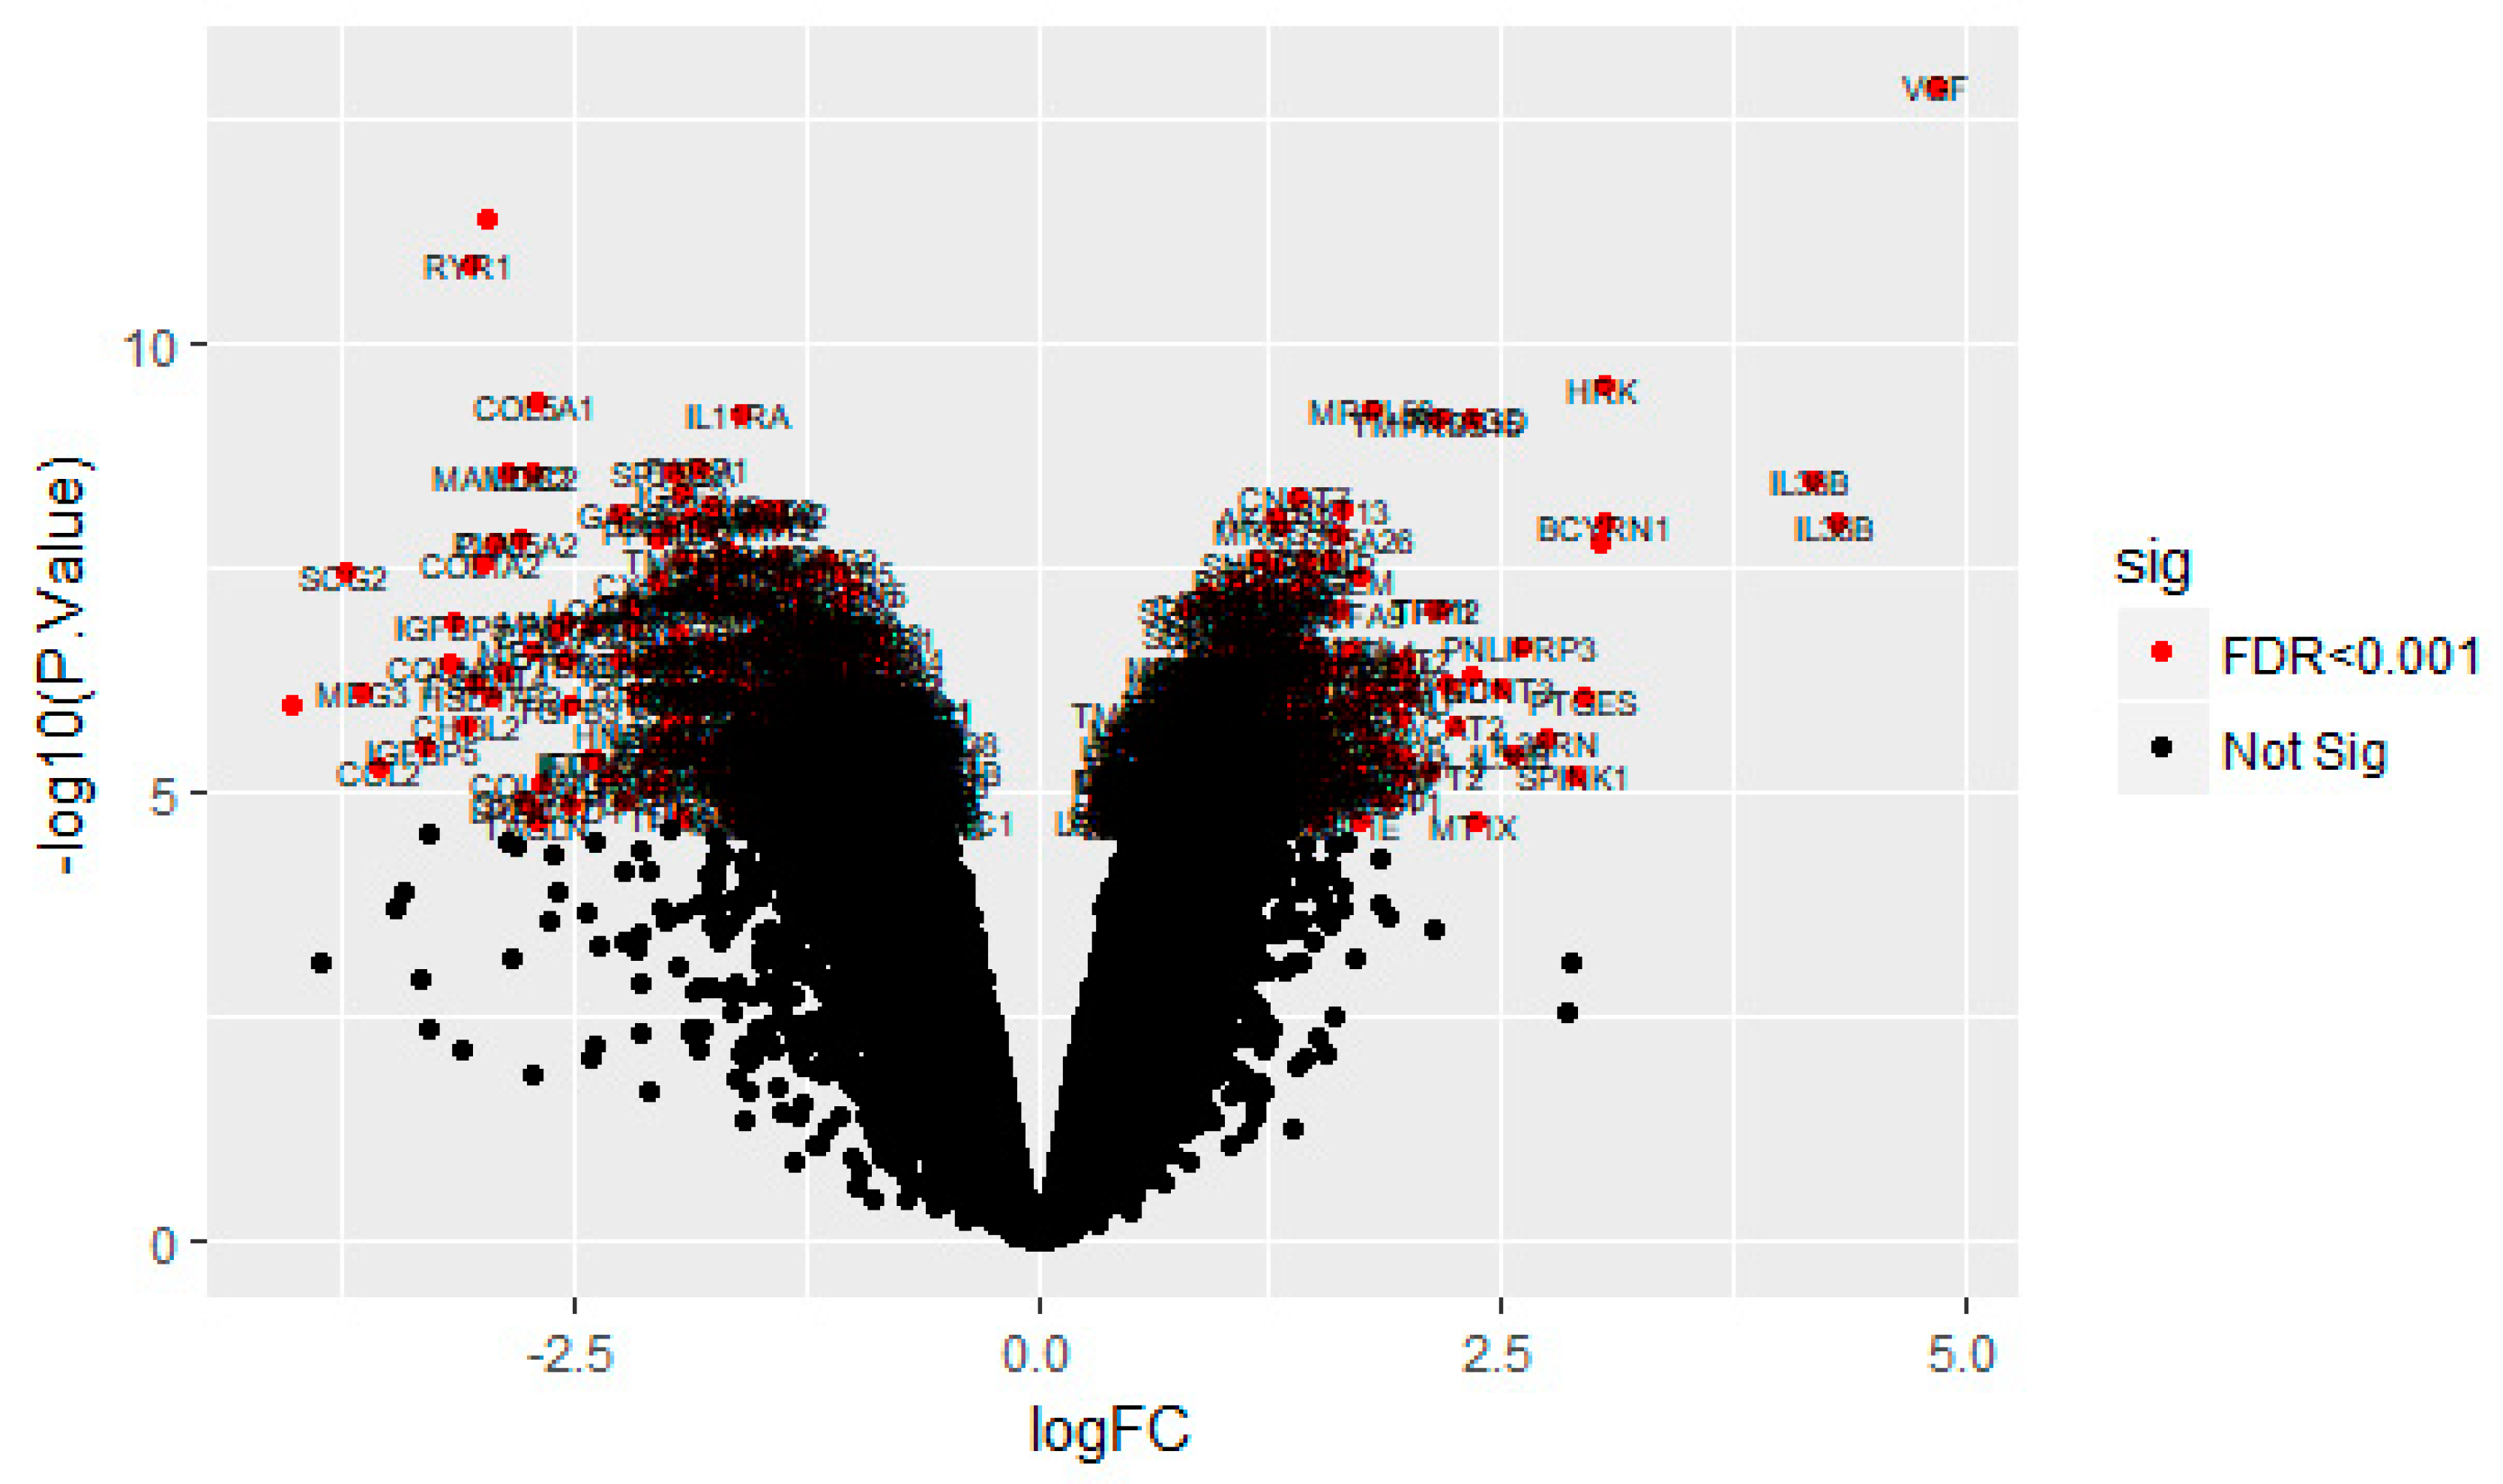
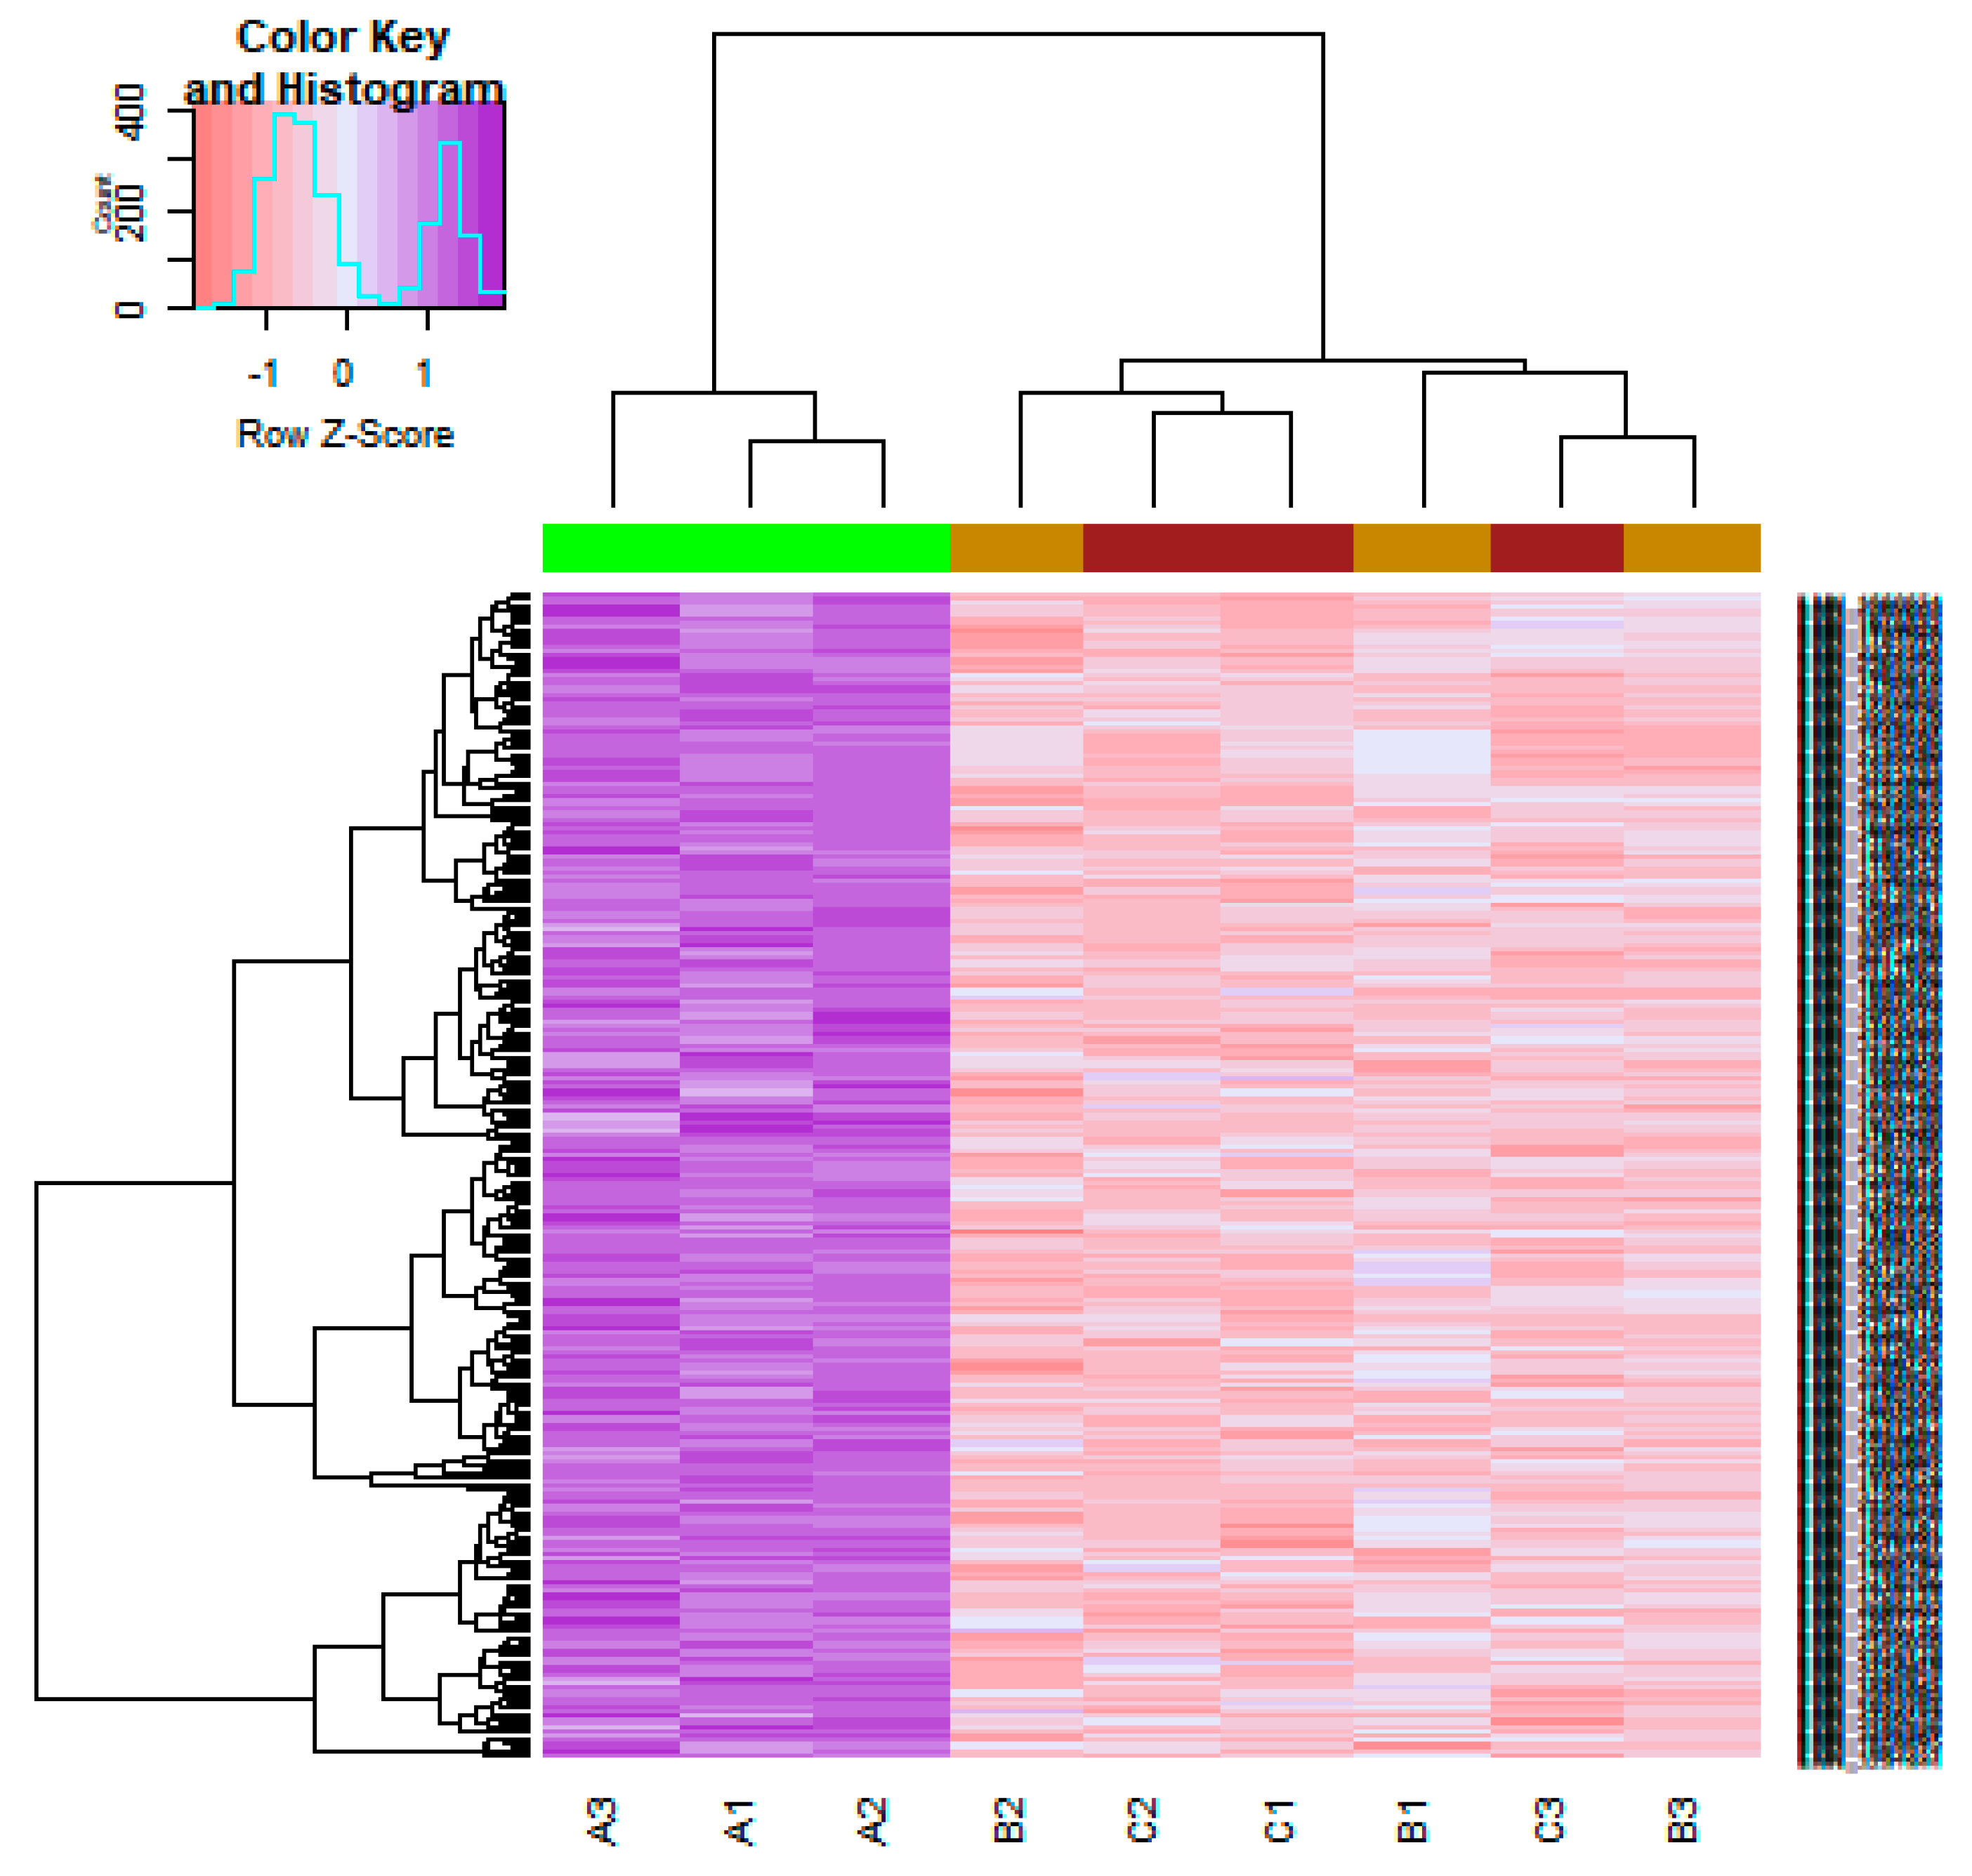
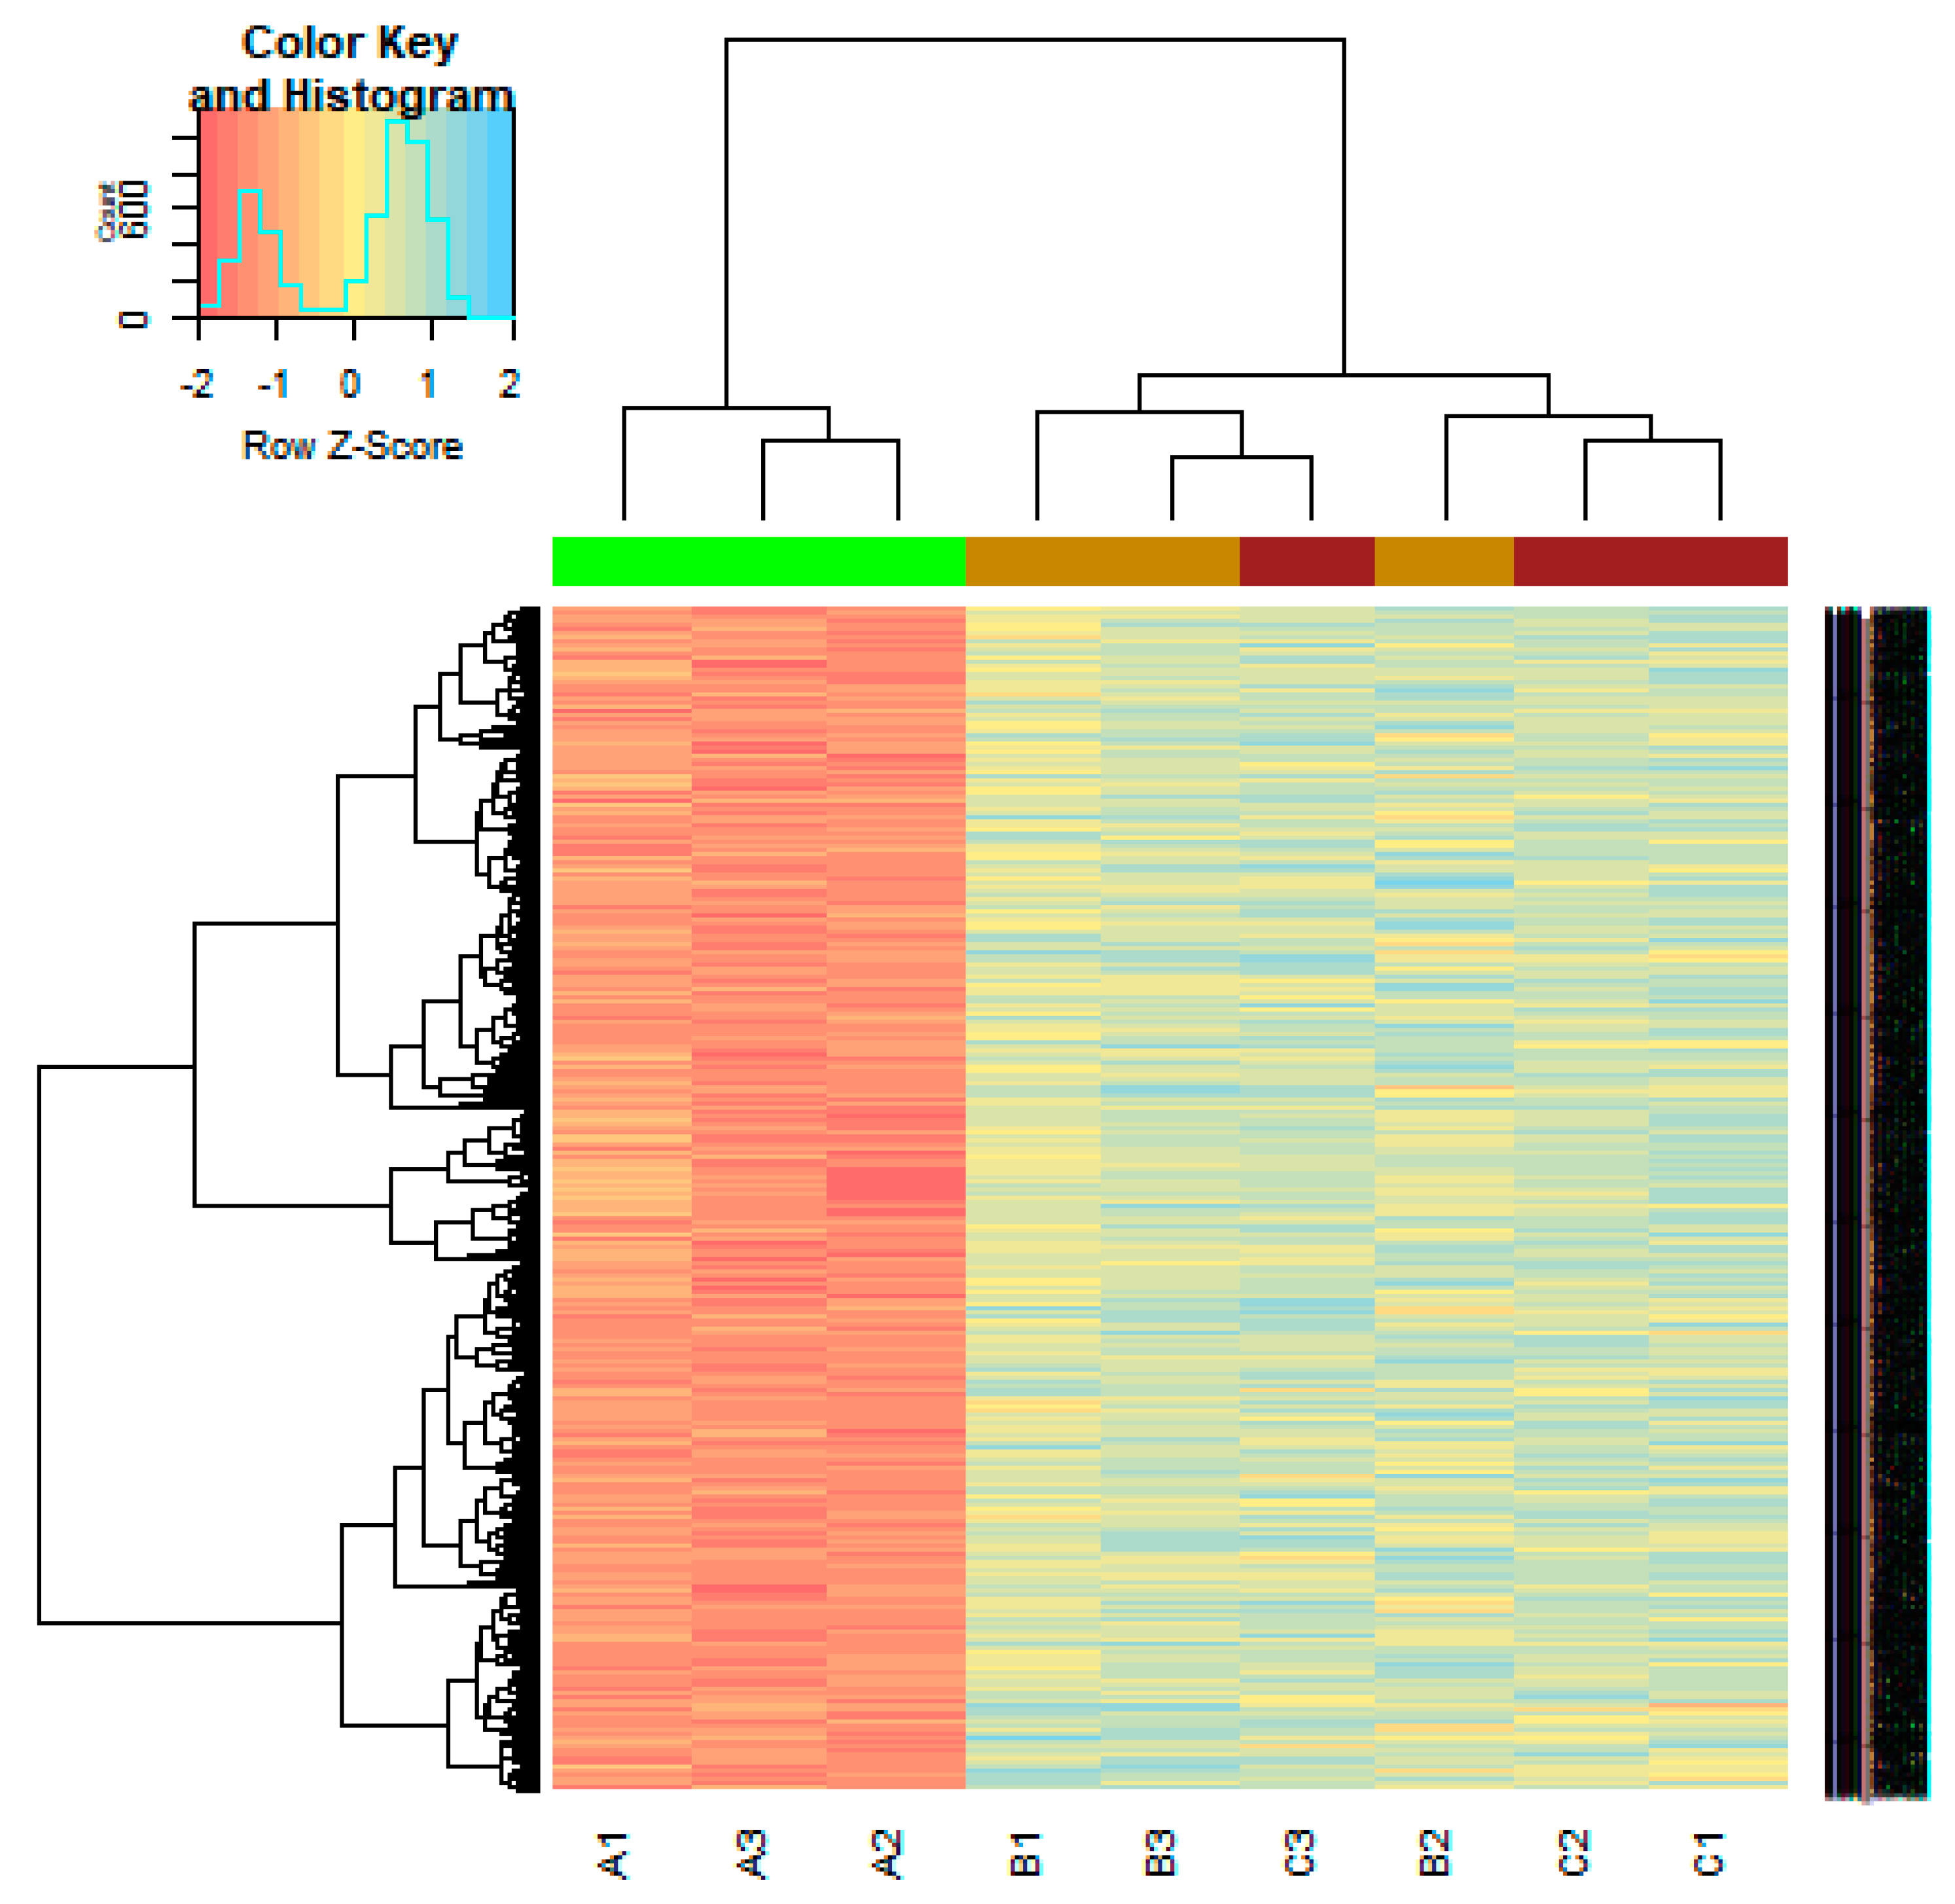
On the basis of the threshold criteria, a total of 590 DEGs were obtained, including 243 up regulated and 347 down regulated genes in scrambled shRNA expression and Lin7A knock down samples (Table S1). There were 590 common DEGs across the two treatment groups. A volcano plot illuminated the expression variance in the number of DEGs at different p-values and log fold changes (Figure 2). A heat map revealed that the up and down regulated DEGs in the scrambled shRNA expression and in the Lin7A knock down samples (Figure 3 and Figure 4).
3.2. Pathway Enrichment Analysis
The up-regulated genes were enriched in pathways from different pathway databases such as ribosome, mineral absorption, mitochondrial translation termination, mitochondrial translation, pyruvate metabolism, and oxidative phosphorylation, which are listed Table S2, meanwhile down-regulated genes were enriched in pathways from different pathway databases such as focal adhesion, protein digestion, absorption, VEGFR3 signaling in lymphatic endothelium, IL4-mediated signaling events, collagen biosynthesis, modifying enzymes, collagen formation, ensemble of genes encoding extracellular matrix, extracellular matrix-associated proteins, ensemble of genes encoding core extracellular matrix including ECM glycoproteins, collagens, proteoglycans, integrin signaling pathway, and interleukin signaling pathway, as shown in Table S3.
3.3. GO Term Enrichment Analysis
GO analysis results showed that up-regulated genes were significantly enriched in all GO terms (BP, CC and MF) such as translation, peptide biosynthetic process, ribosome, ribosomal subunit, structural constituent of ribosome and RNA binding, as listed in Table S4, while, down-regulated DEGs were significantly enriched in all GO terms (BP, CC and MF) such as extracellular matrix organization, extracellular structure organization, extracellular matrix, extracellular matrix component, platelet-derived growth factor binding, and growth factor binding, as listed in Table S5.
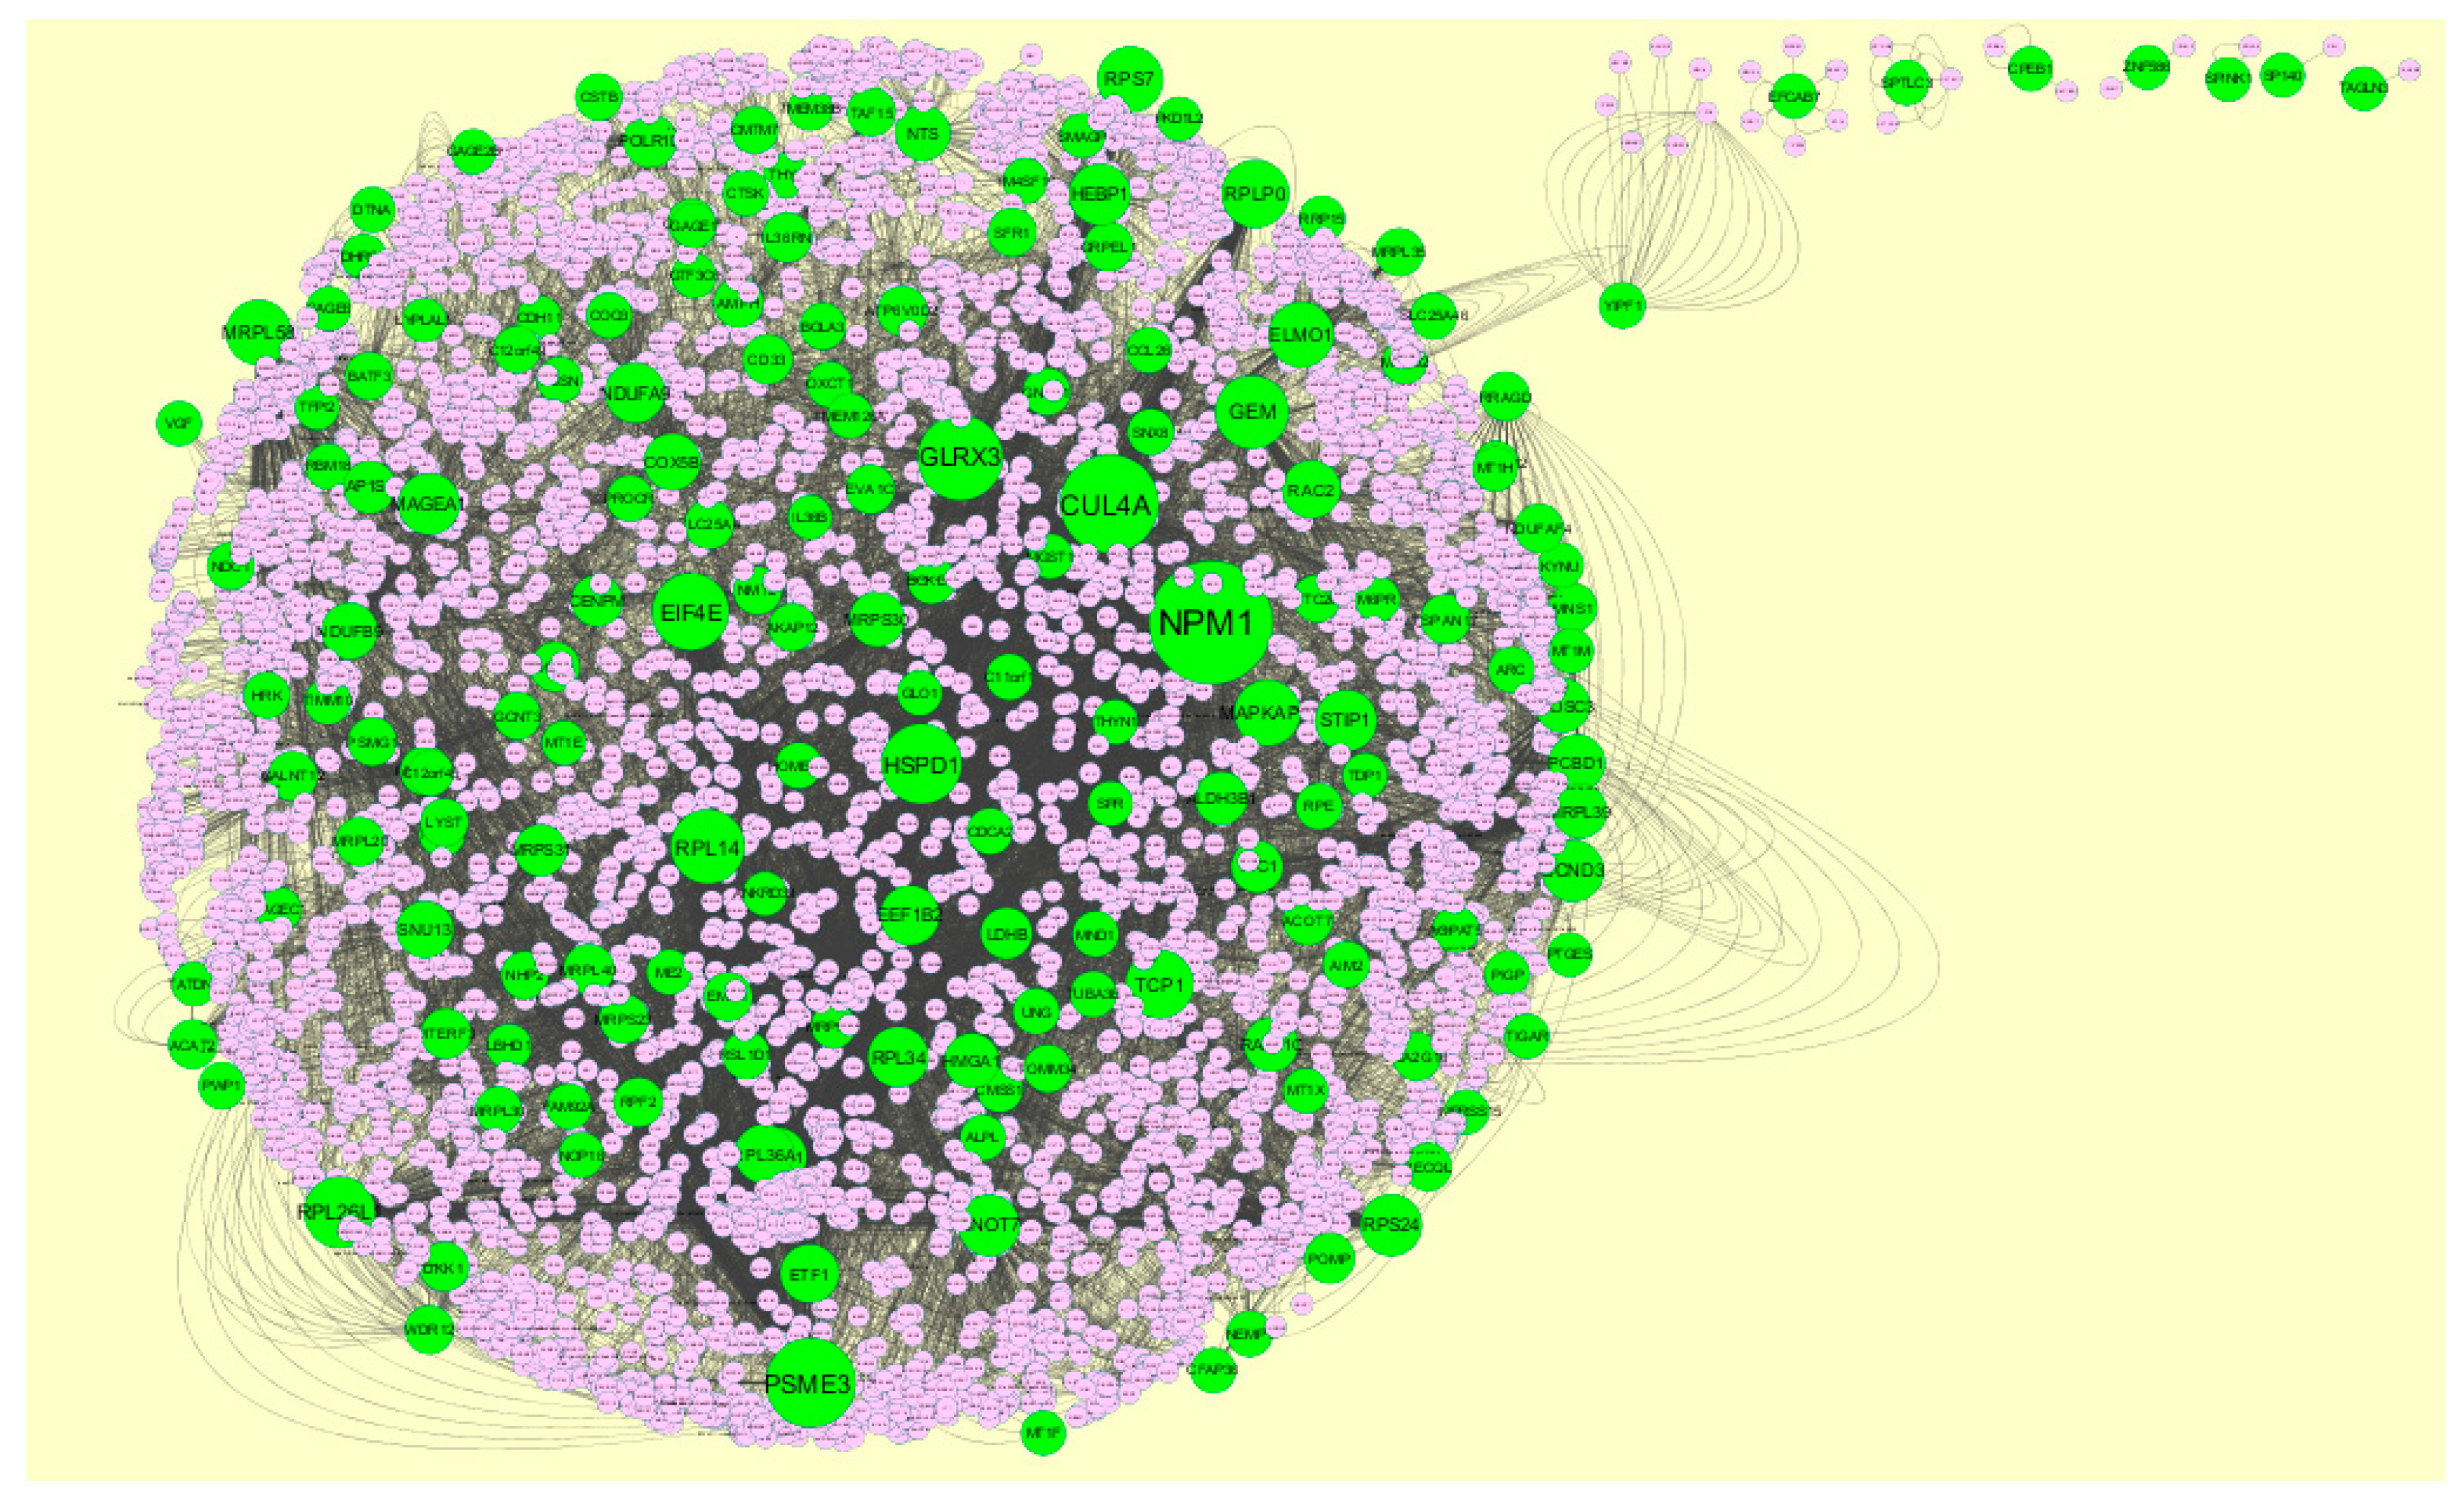
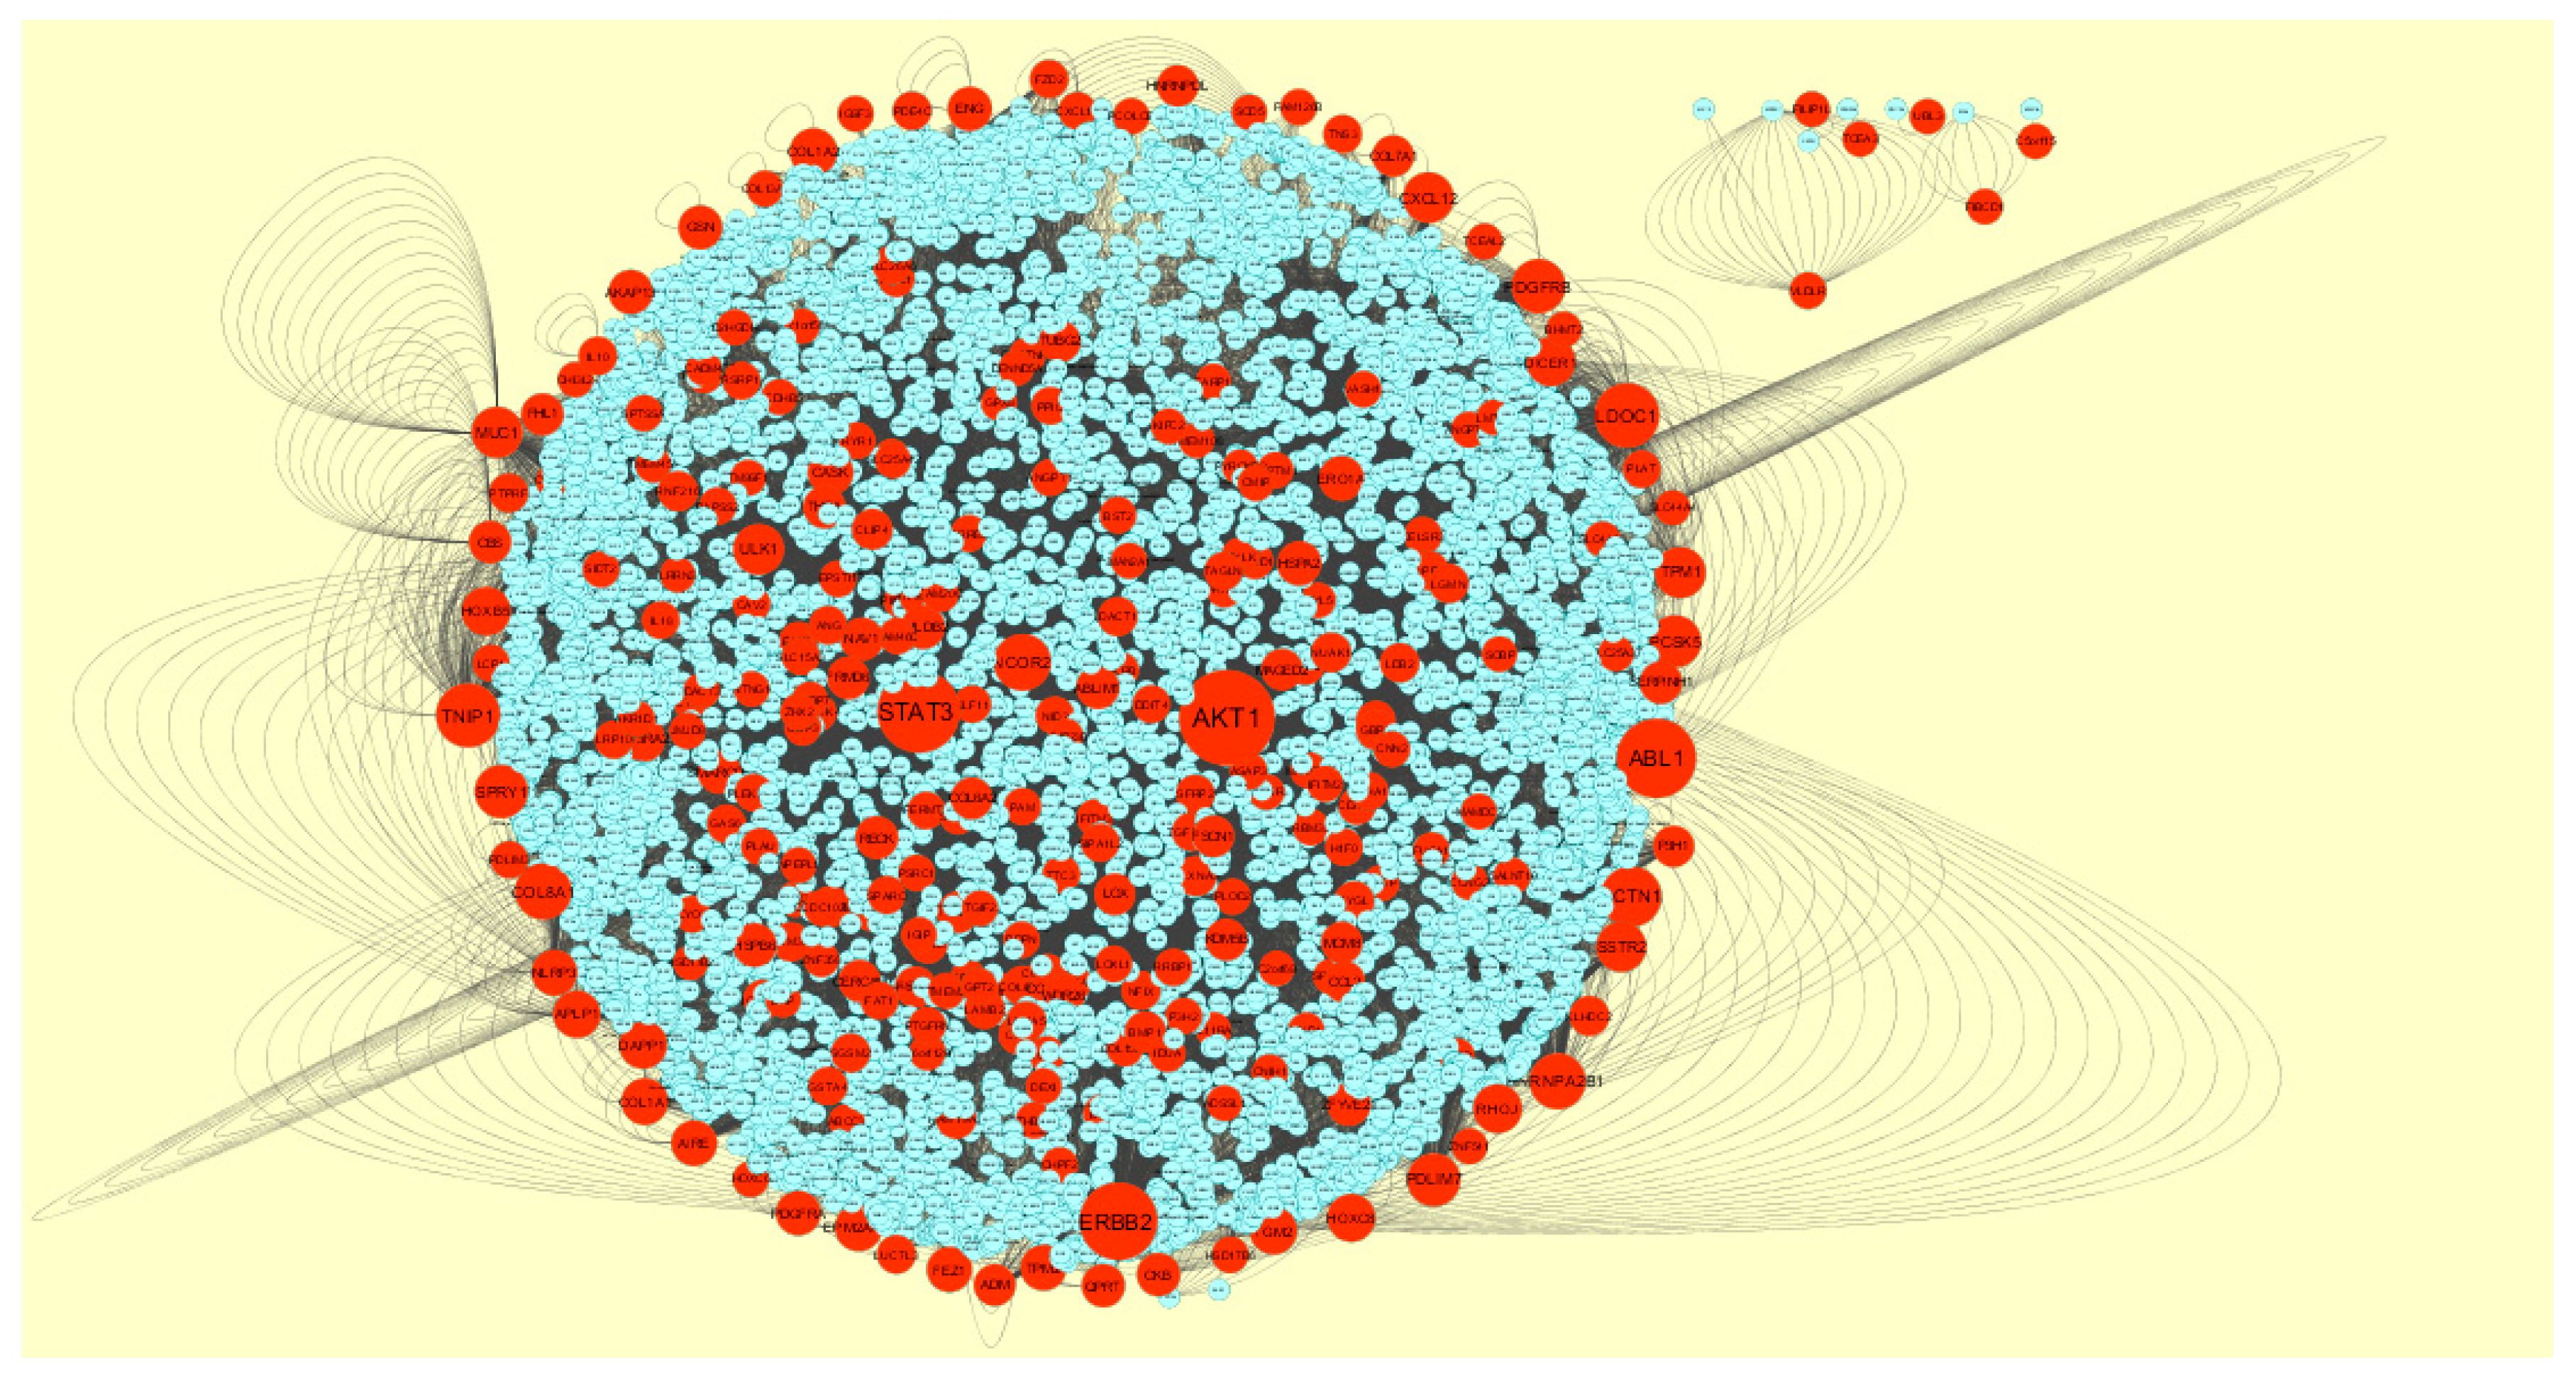
3.4. Construction PPI Network and Topological Analysis
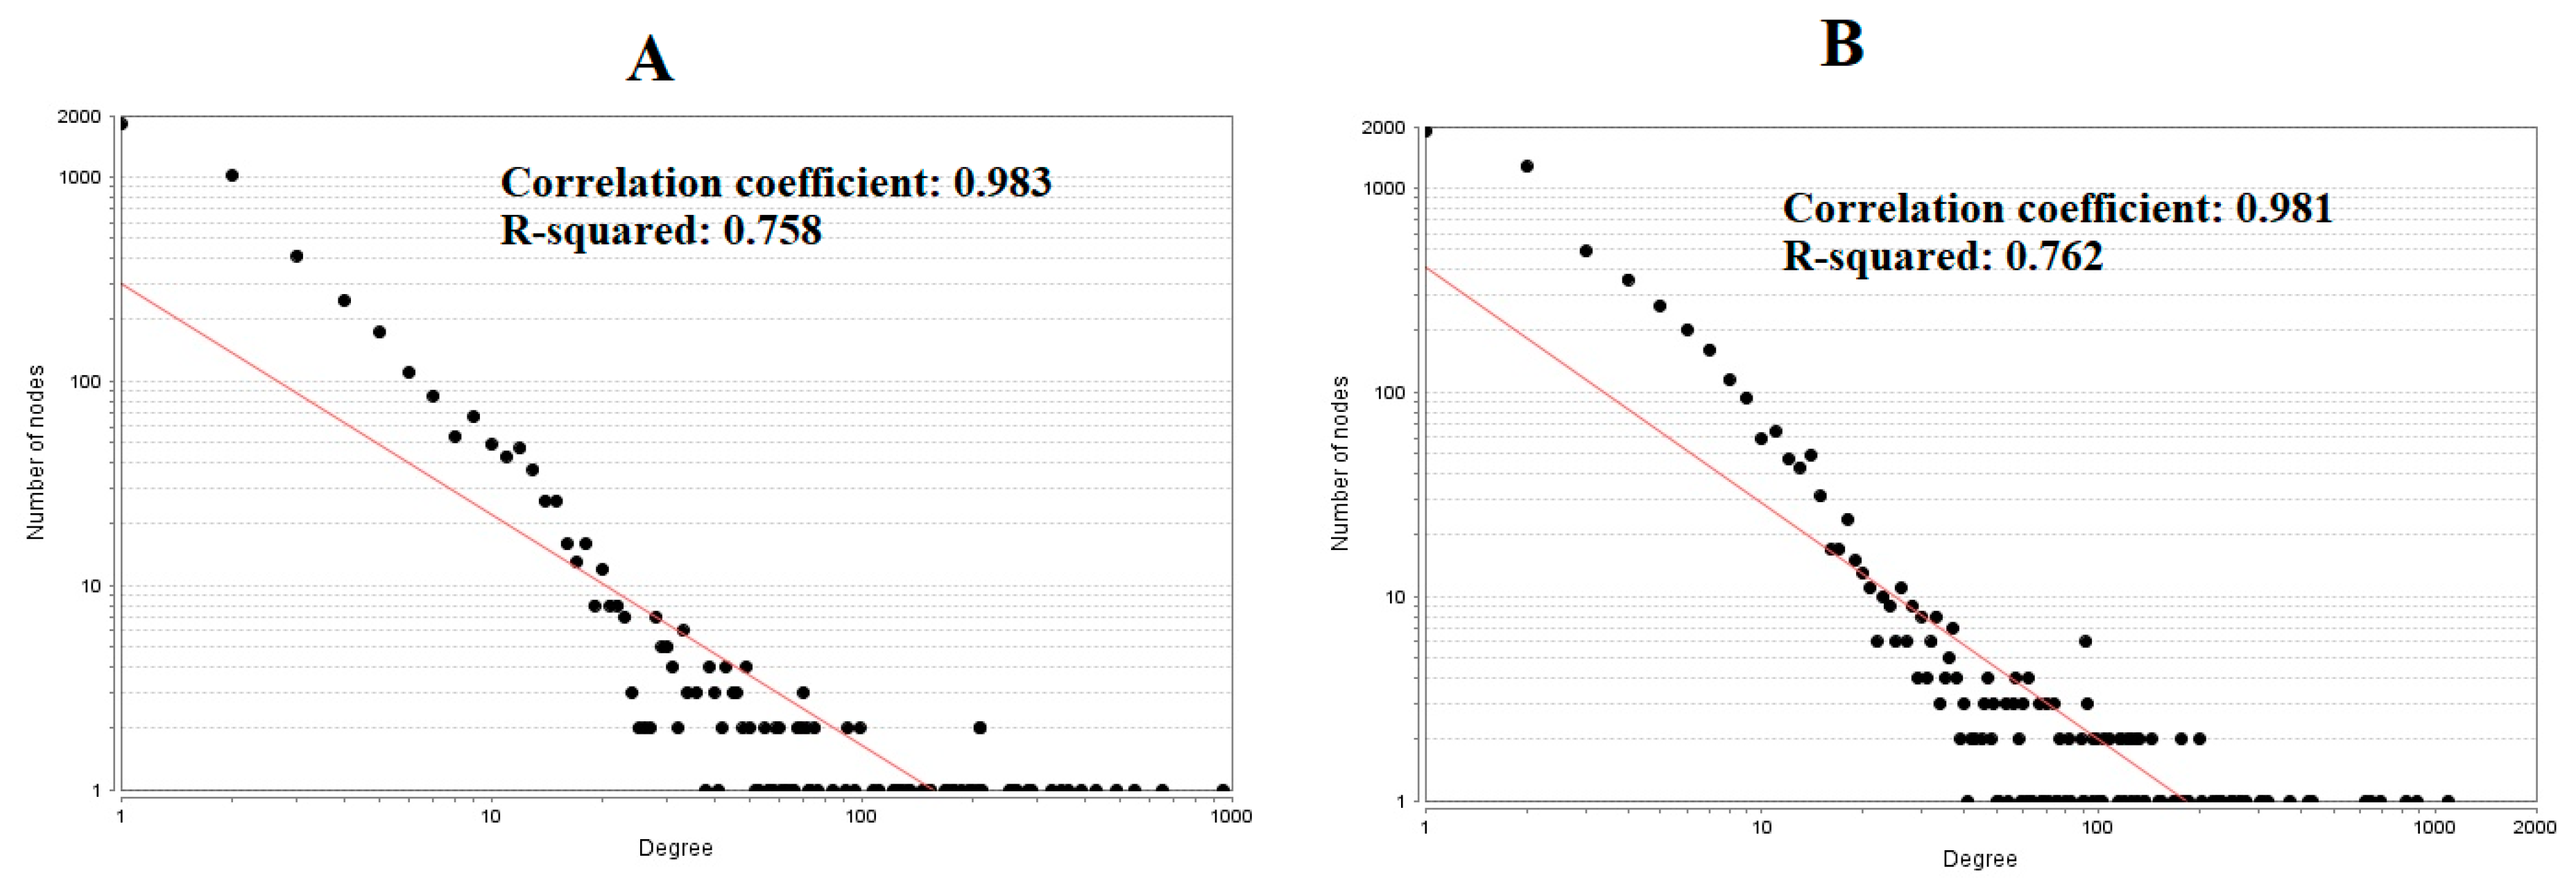
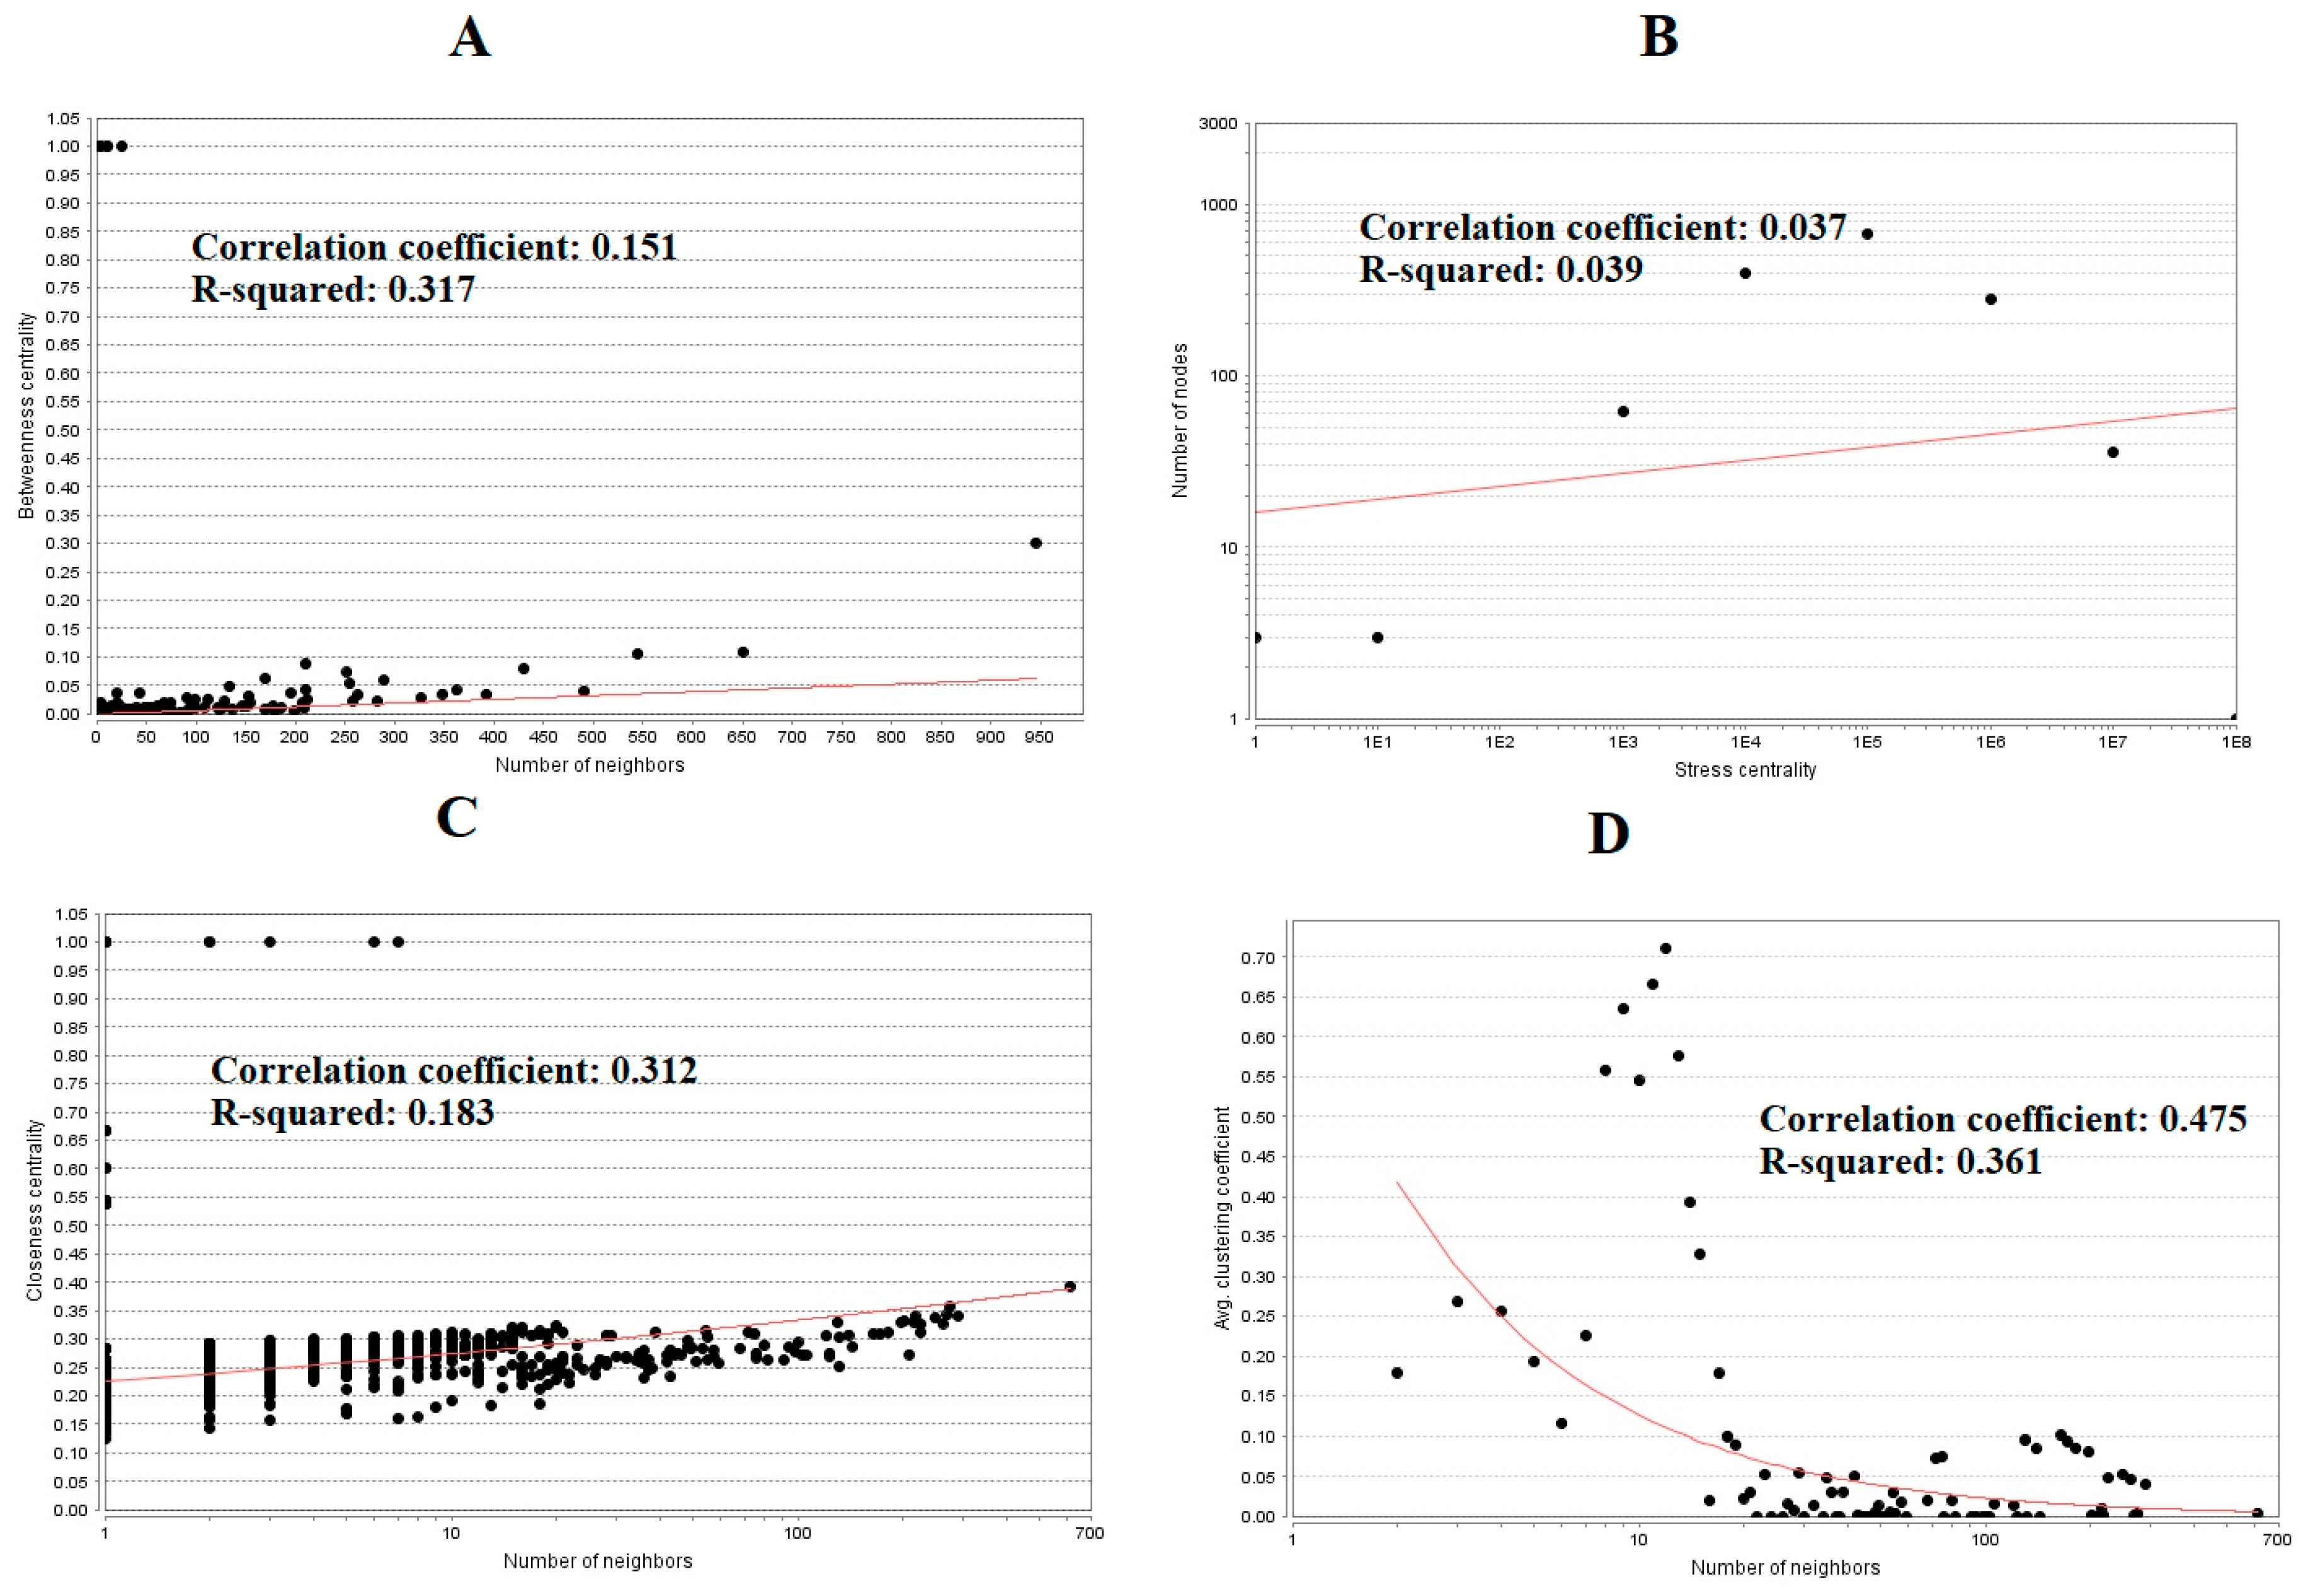
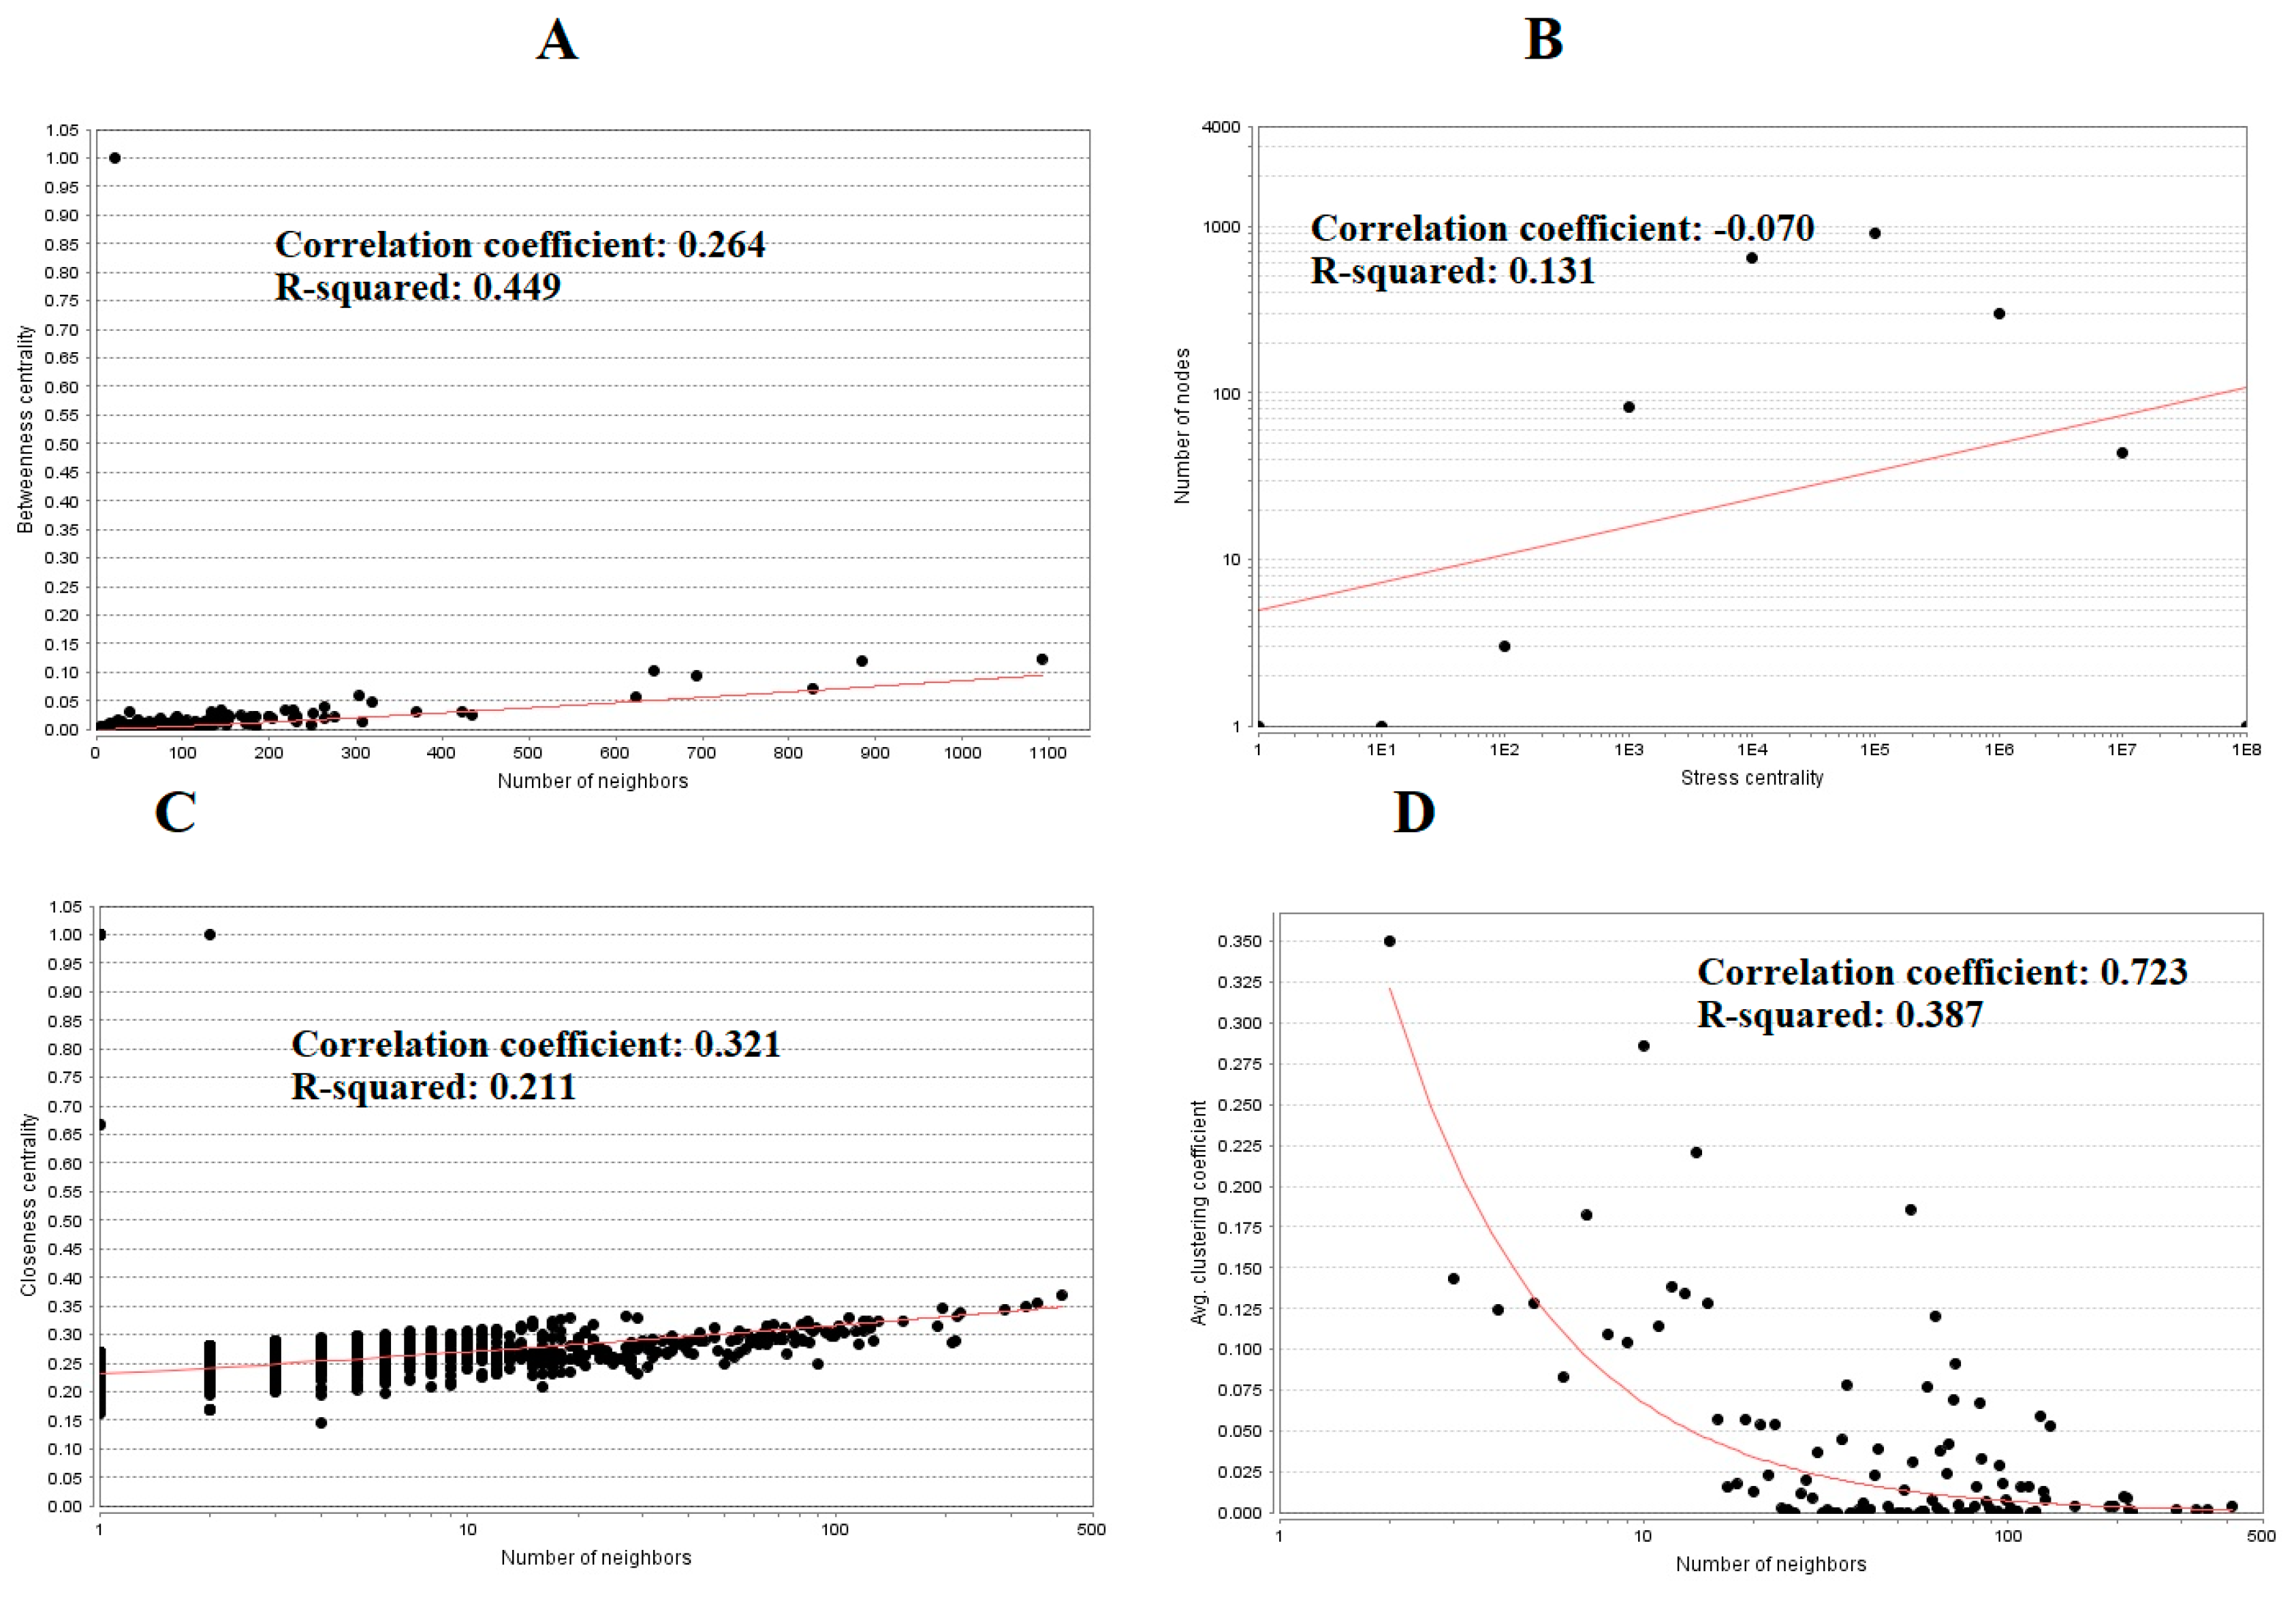
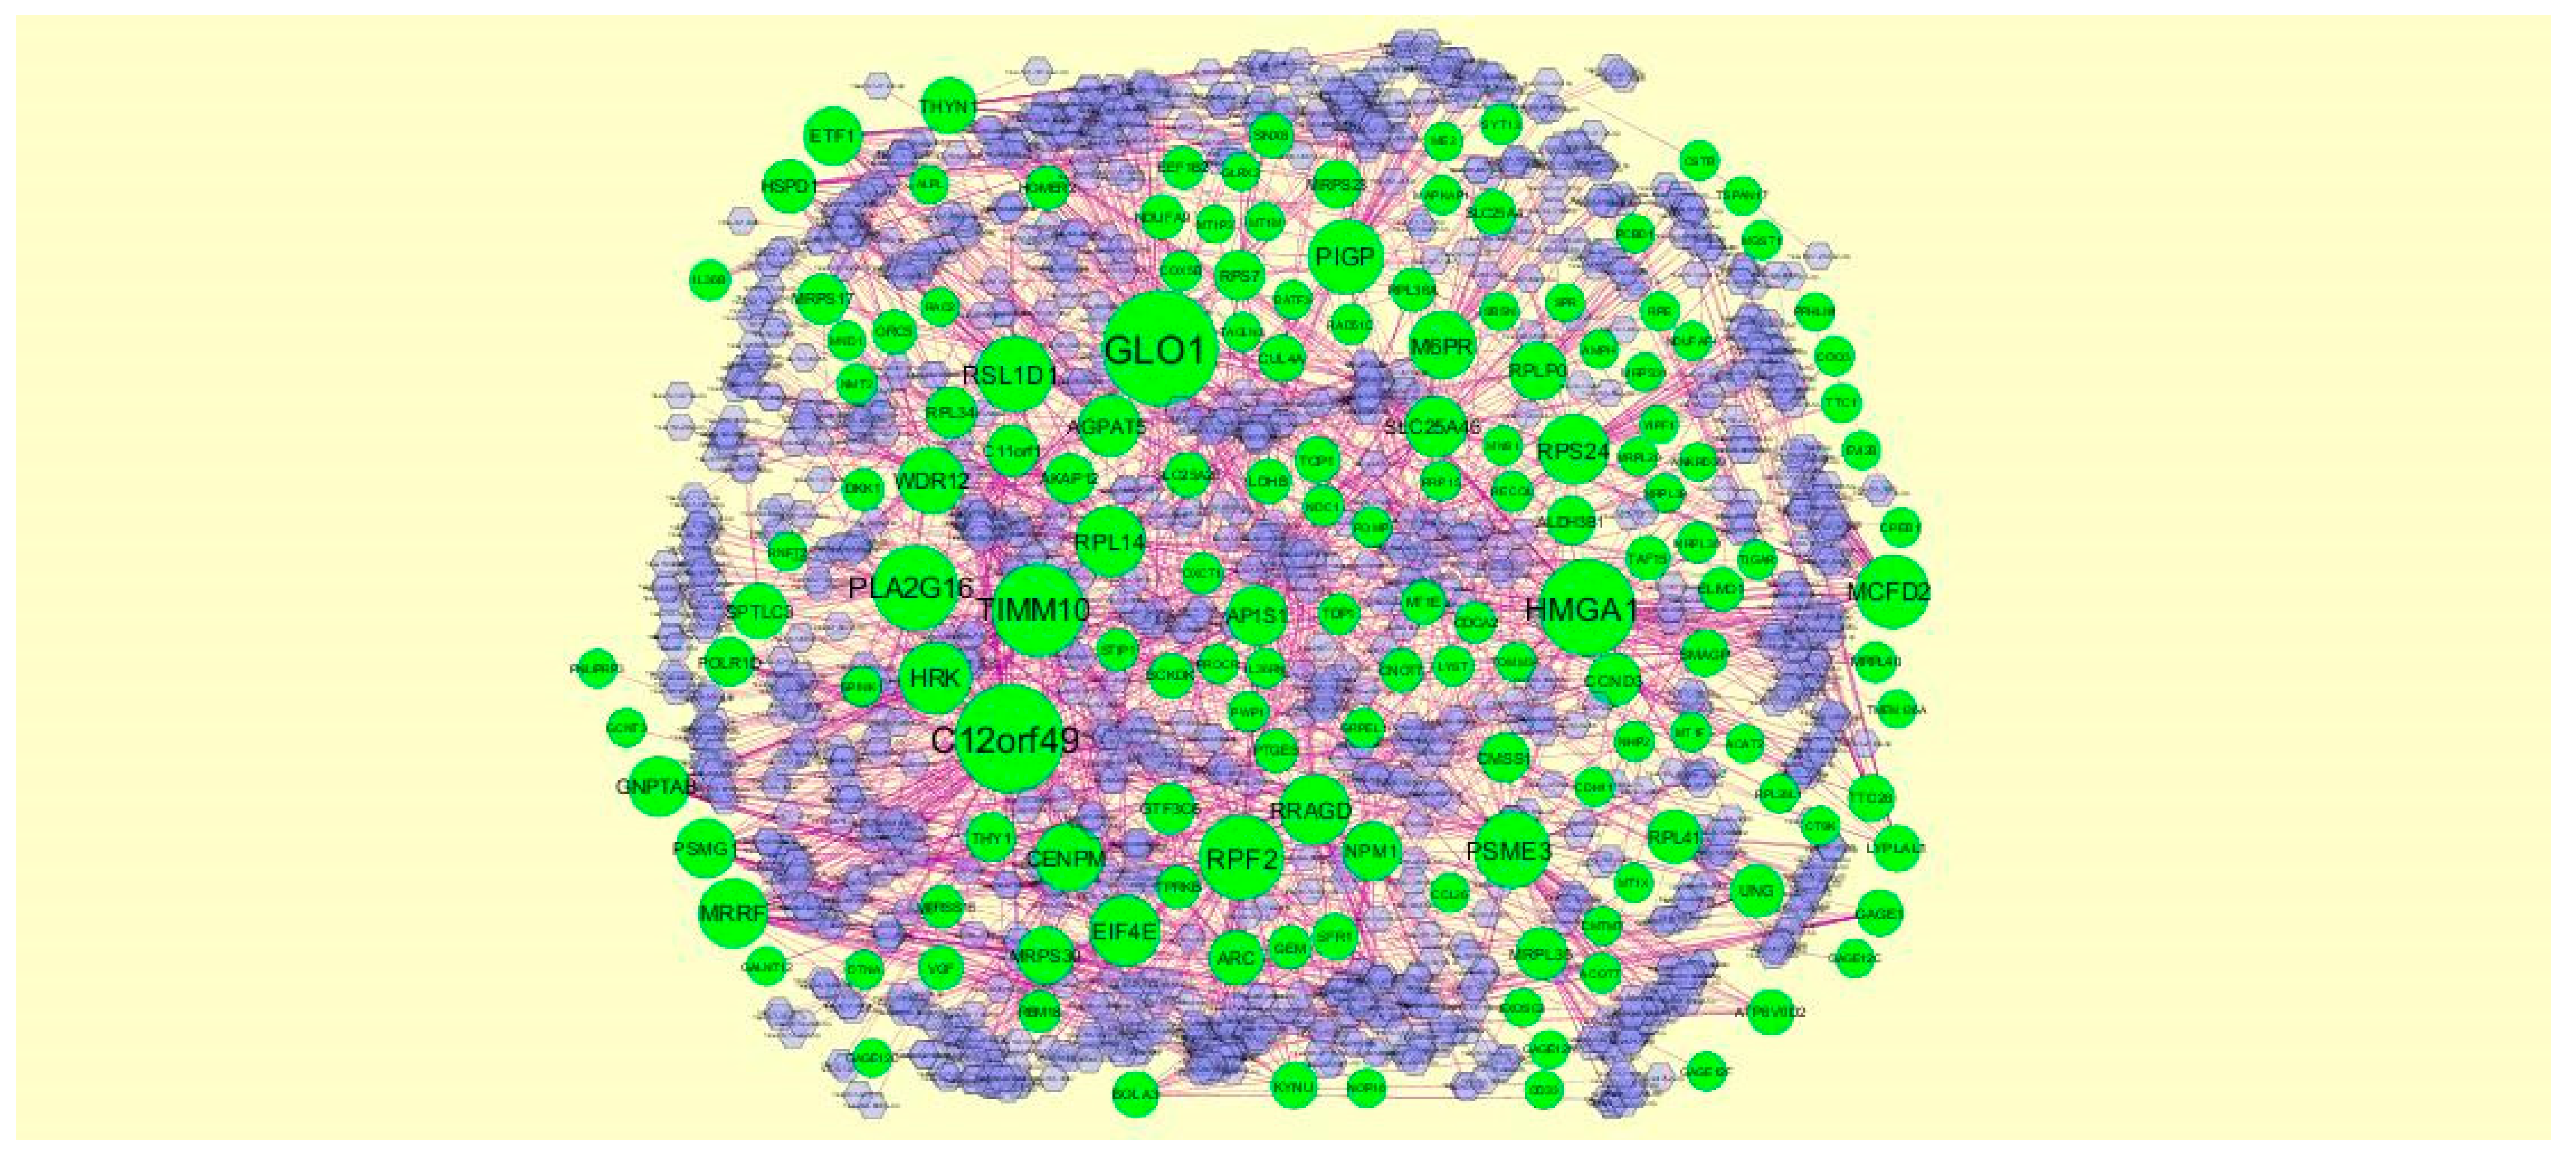
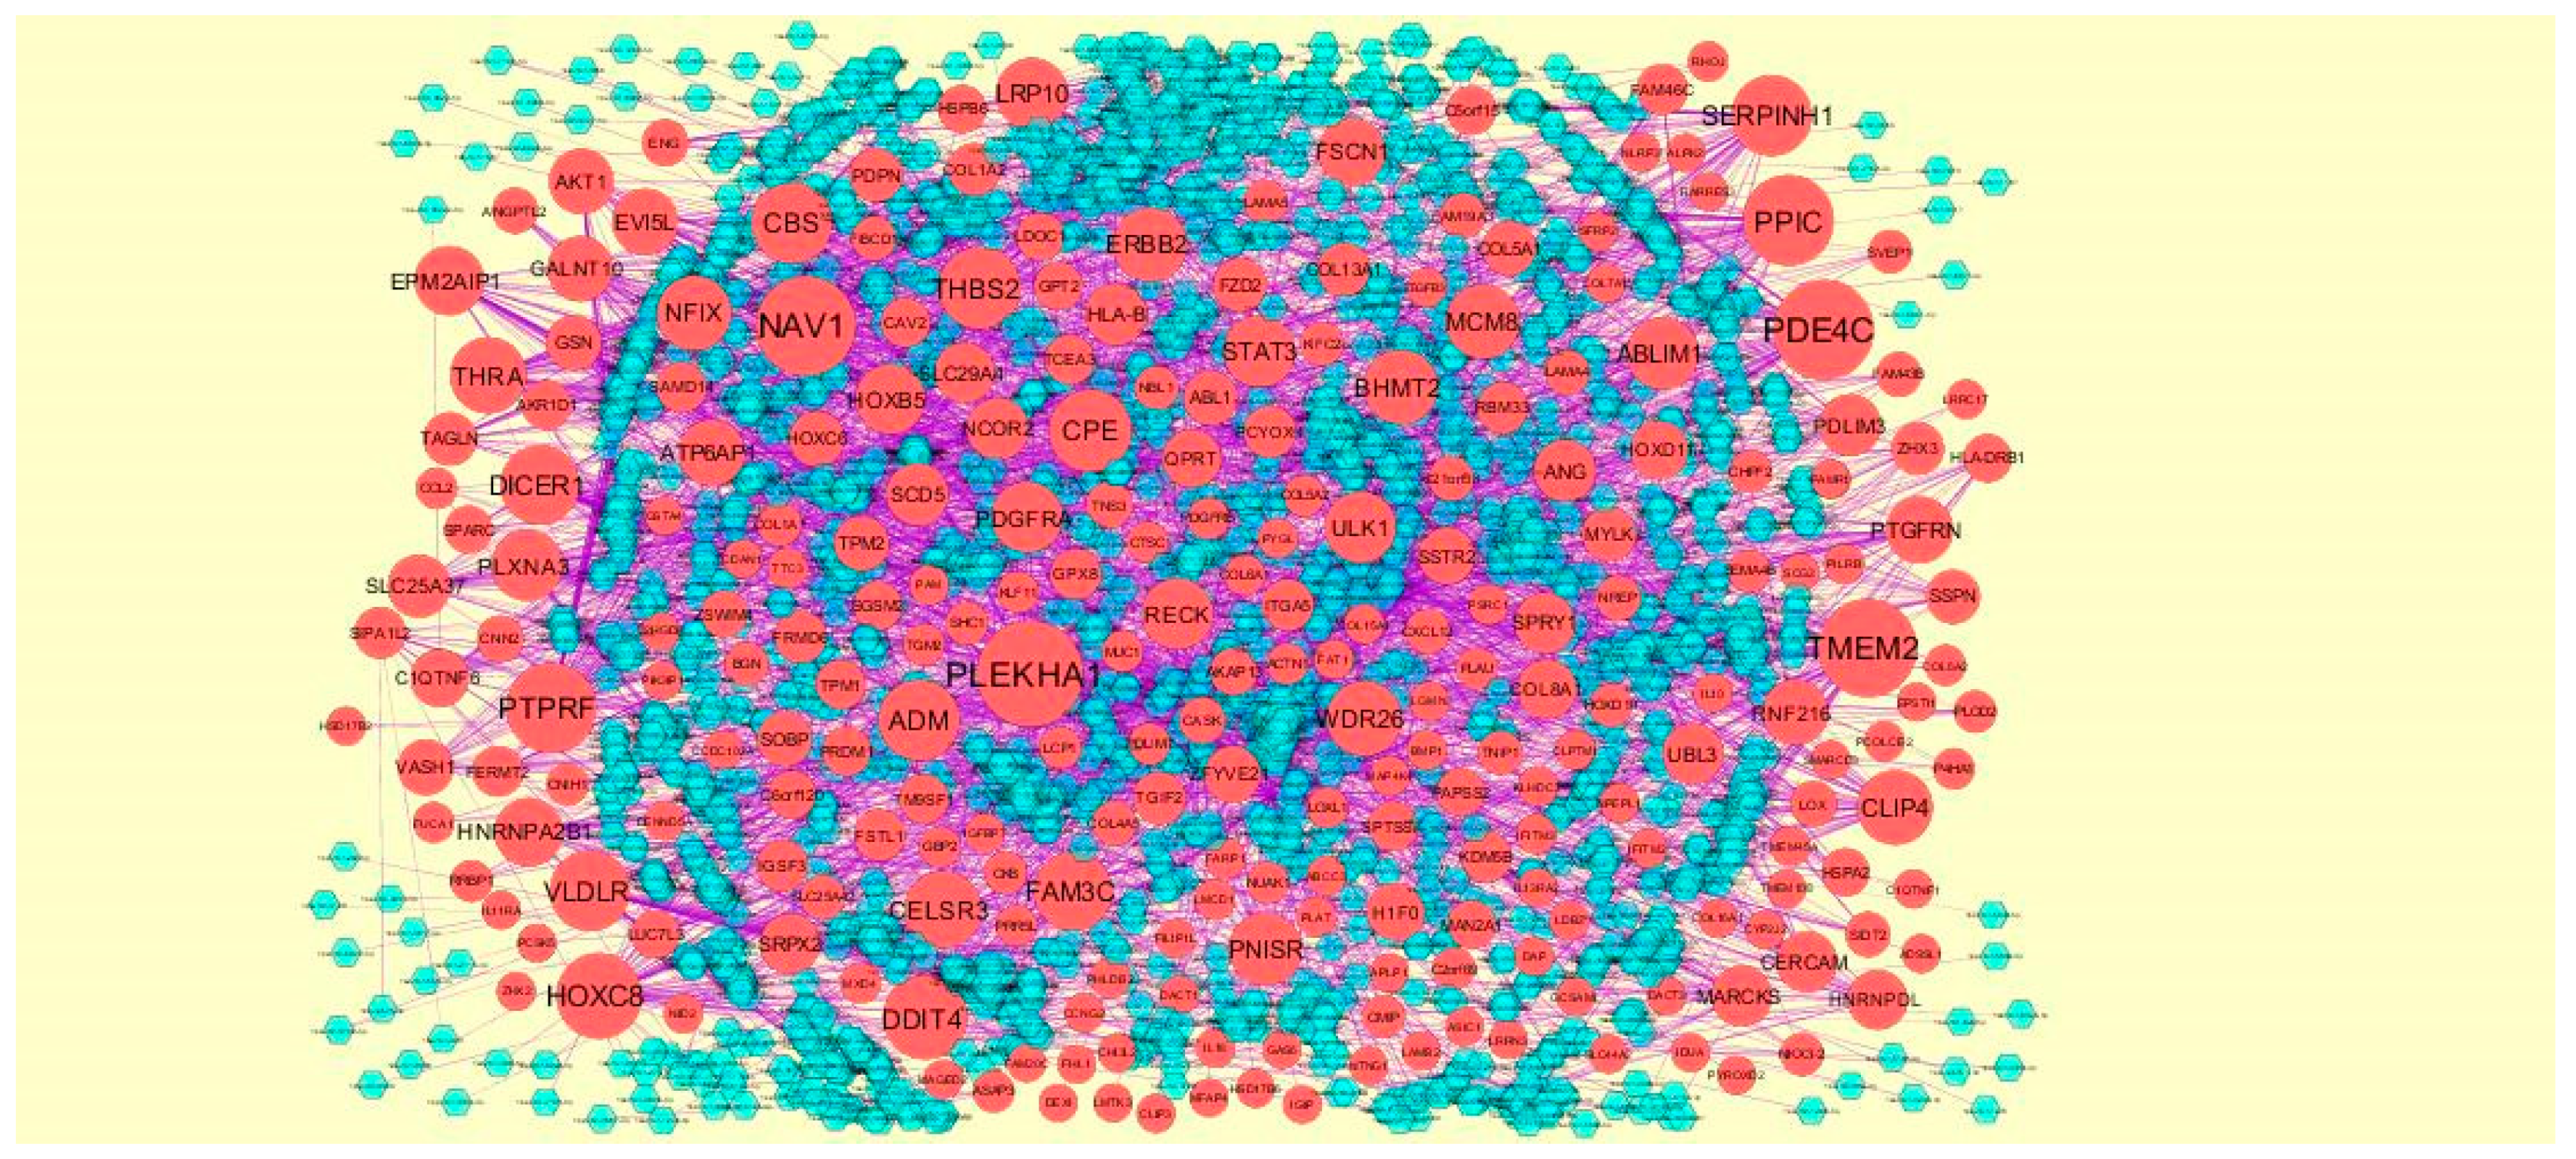
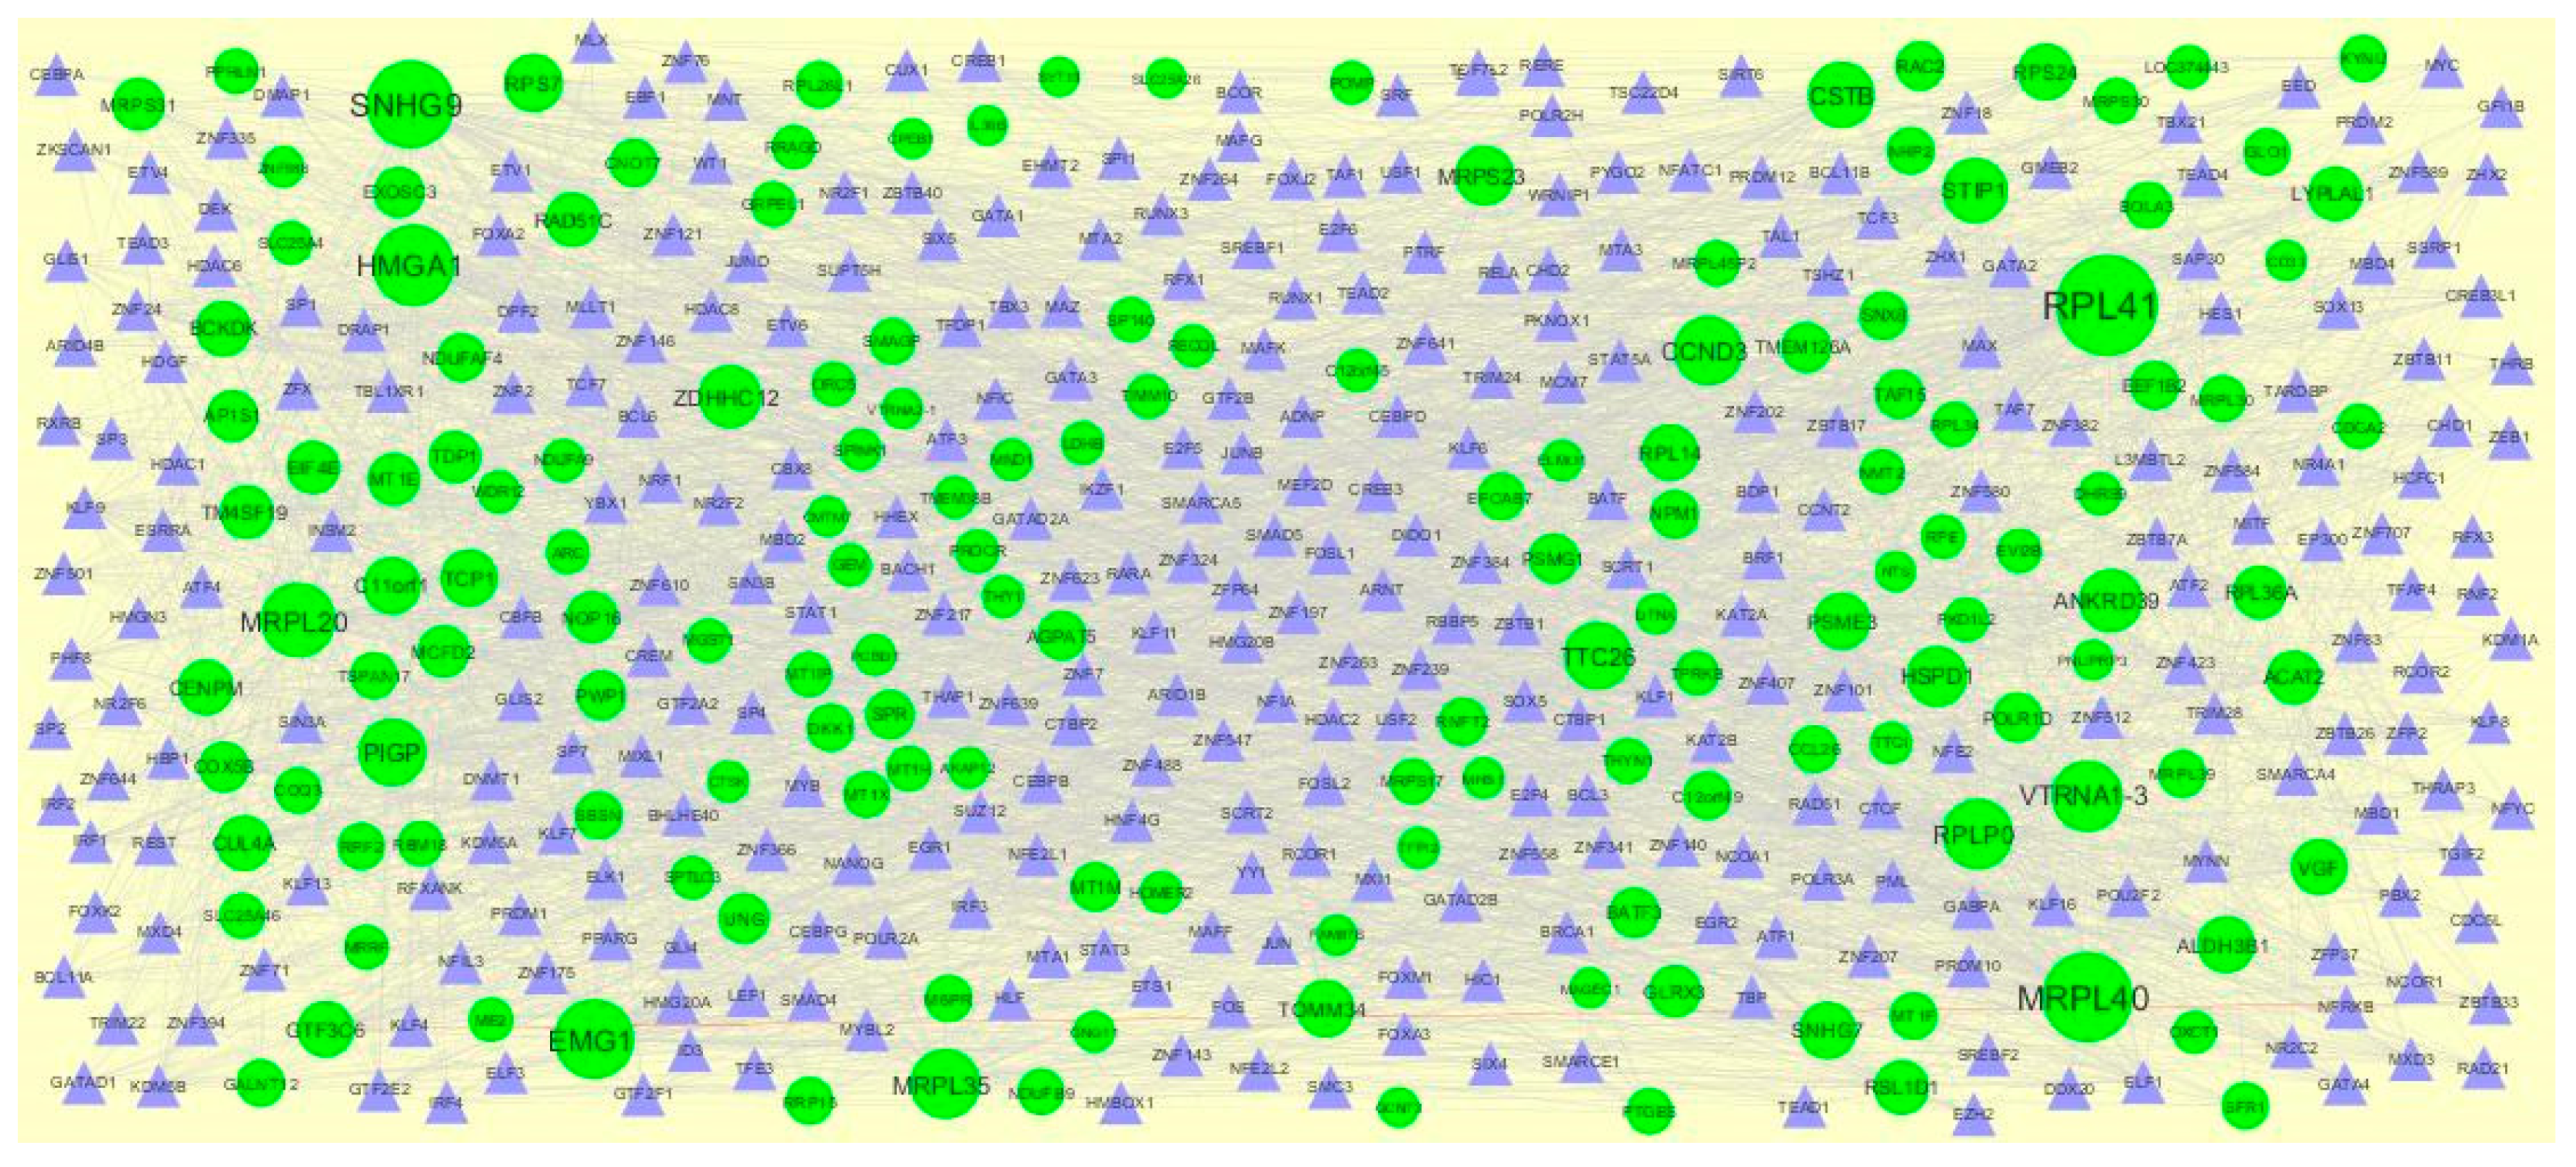
The PPI network (up regulated) had 4437 nodes and 14,519 interactions, as shown in Figure 5 and are listed in Table S6. Similarly, The PPI network (down regulated) had 4683 nodes and 21,058 interactions, as shown in Figure 6 and are listed in Table S6. Hub genes (up regulated) with a high node degree [60] such as NPM1, CUL4A, PSME3, GLRX3, and HSPD1 are listed in Table S6. R square = 0.758 and correlation coefficient = 0.983 for node degree (Figure 7A). Hub genes (up regulated) with high betweenness centrality [61] such as NPM1, CUL4A, PSME3, HEBP1, and HSPD1 are listed in Table S6. R square = 0.317 and correlation coefficient = 0.151 for betweenness (Figure 8A). Hub genes (up regulated) with high stress genes [62] such as NPM1, HSPD1, CENPM, RAC2, and CUL4A are listed in Table S6. R square = 0.039 and correlation coefficient = 0.037 for stress (Figure 8B). Hub genes (up regulated) with high closeness centrality [63] such as NPM1, CUL4A, PSME3, RPL14, and HSPD1 are listed in Table S6. R square = 0.183 and correlation coefficient = 0.312 for closeness (Figure 8C). Hub genes (up regulated) with low clustering coefficient [64] such as YIPF1, EFCAB7, SPTLC3, CPEB1, and ZNF586 are listed in Table S6. R square = 0.361 and correlation coefficient = 0.475 for clustering coefficient (Figure 8D). Meanwhile, hub genes (down regulated) with a high node degree such as SHC1, AKT1, STAT3, ABL1, and ERBB2. R square = 0.762 and correlation coefficient = 0.981 for node degree (Figure 7B). Hub genes (down regulated) with high betweenness centrality such as SHC1, AKT1, ABL1, STAT3, and HNRNPA2B1 are listed in Table S6. R square = 0.449 and correlation coefficient = 0.264 for betweenness (Figure 9A). Hub genes (down regulated) with high stress such as AKT1, ABL1), STAT3, SHC1, and SSTR2 are listed in Table S6. R square = 0.131 and correlation coefficient = −0.070 for stress (Figure 9B). Hub genes (down regulated) with high closeness centrality such as SHC1, AKT1, ABL1, ERBB2, and STAT3 are listed in Table S6. R square = 0.211 and correlation coefficient = 0.321 for closeness (Figure 9C). Hub genes (down regulated) with low clustering coefficient such as VLDLR, FIBCD1, FILIP1L, UBL3, and TCEA3 are listed in Table S6. R square = 0.387 and correlation coefficient = 0.723 for the clustering coefficient (Figure 9D).
3.5. Module Analysis
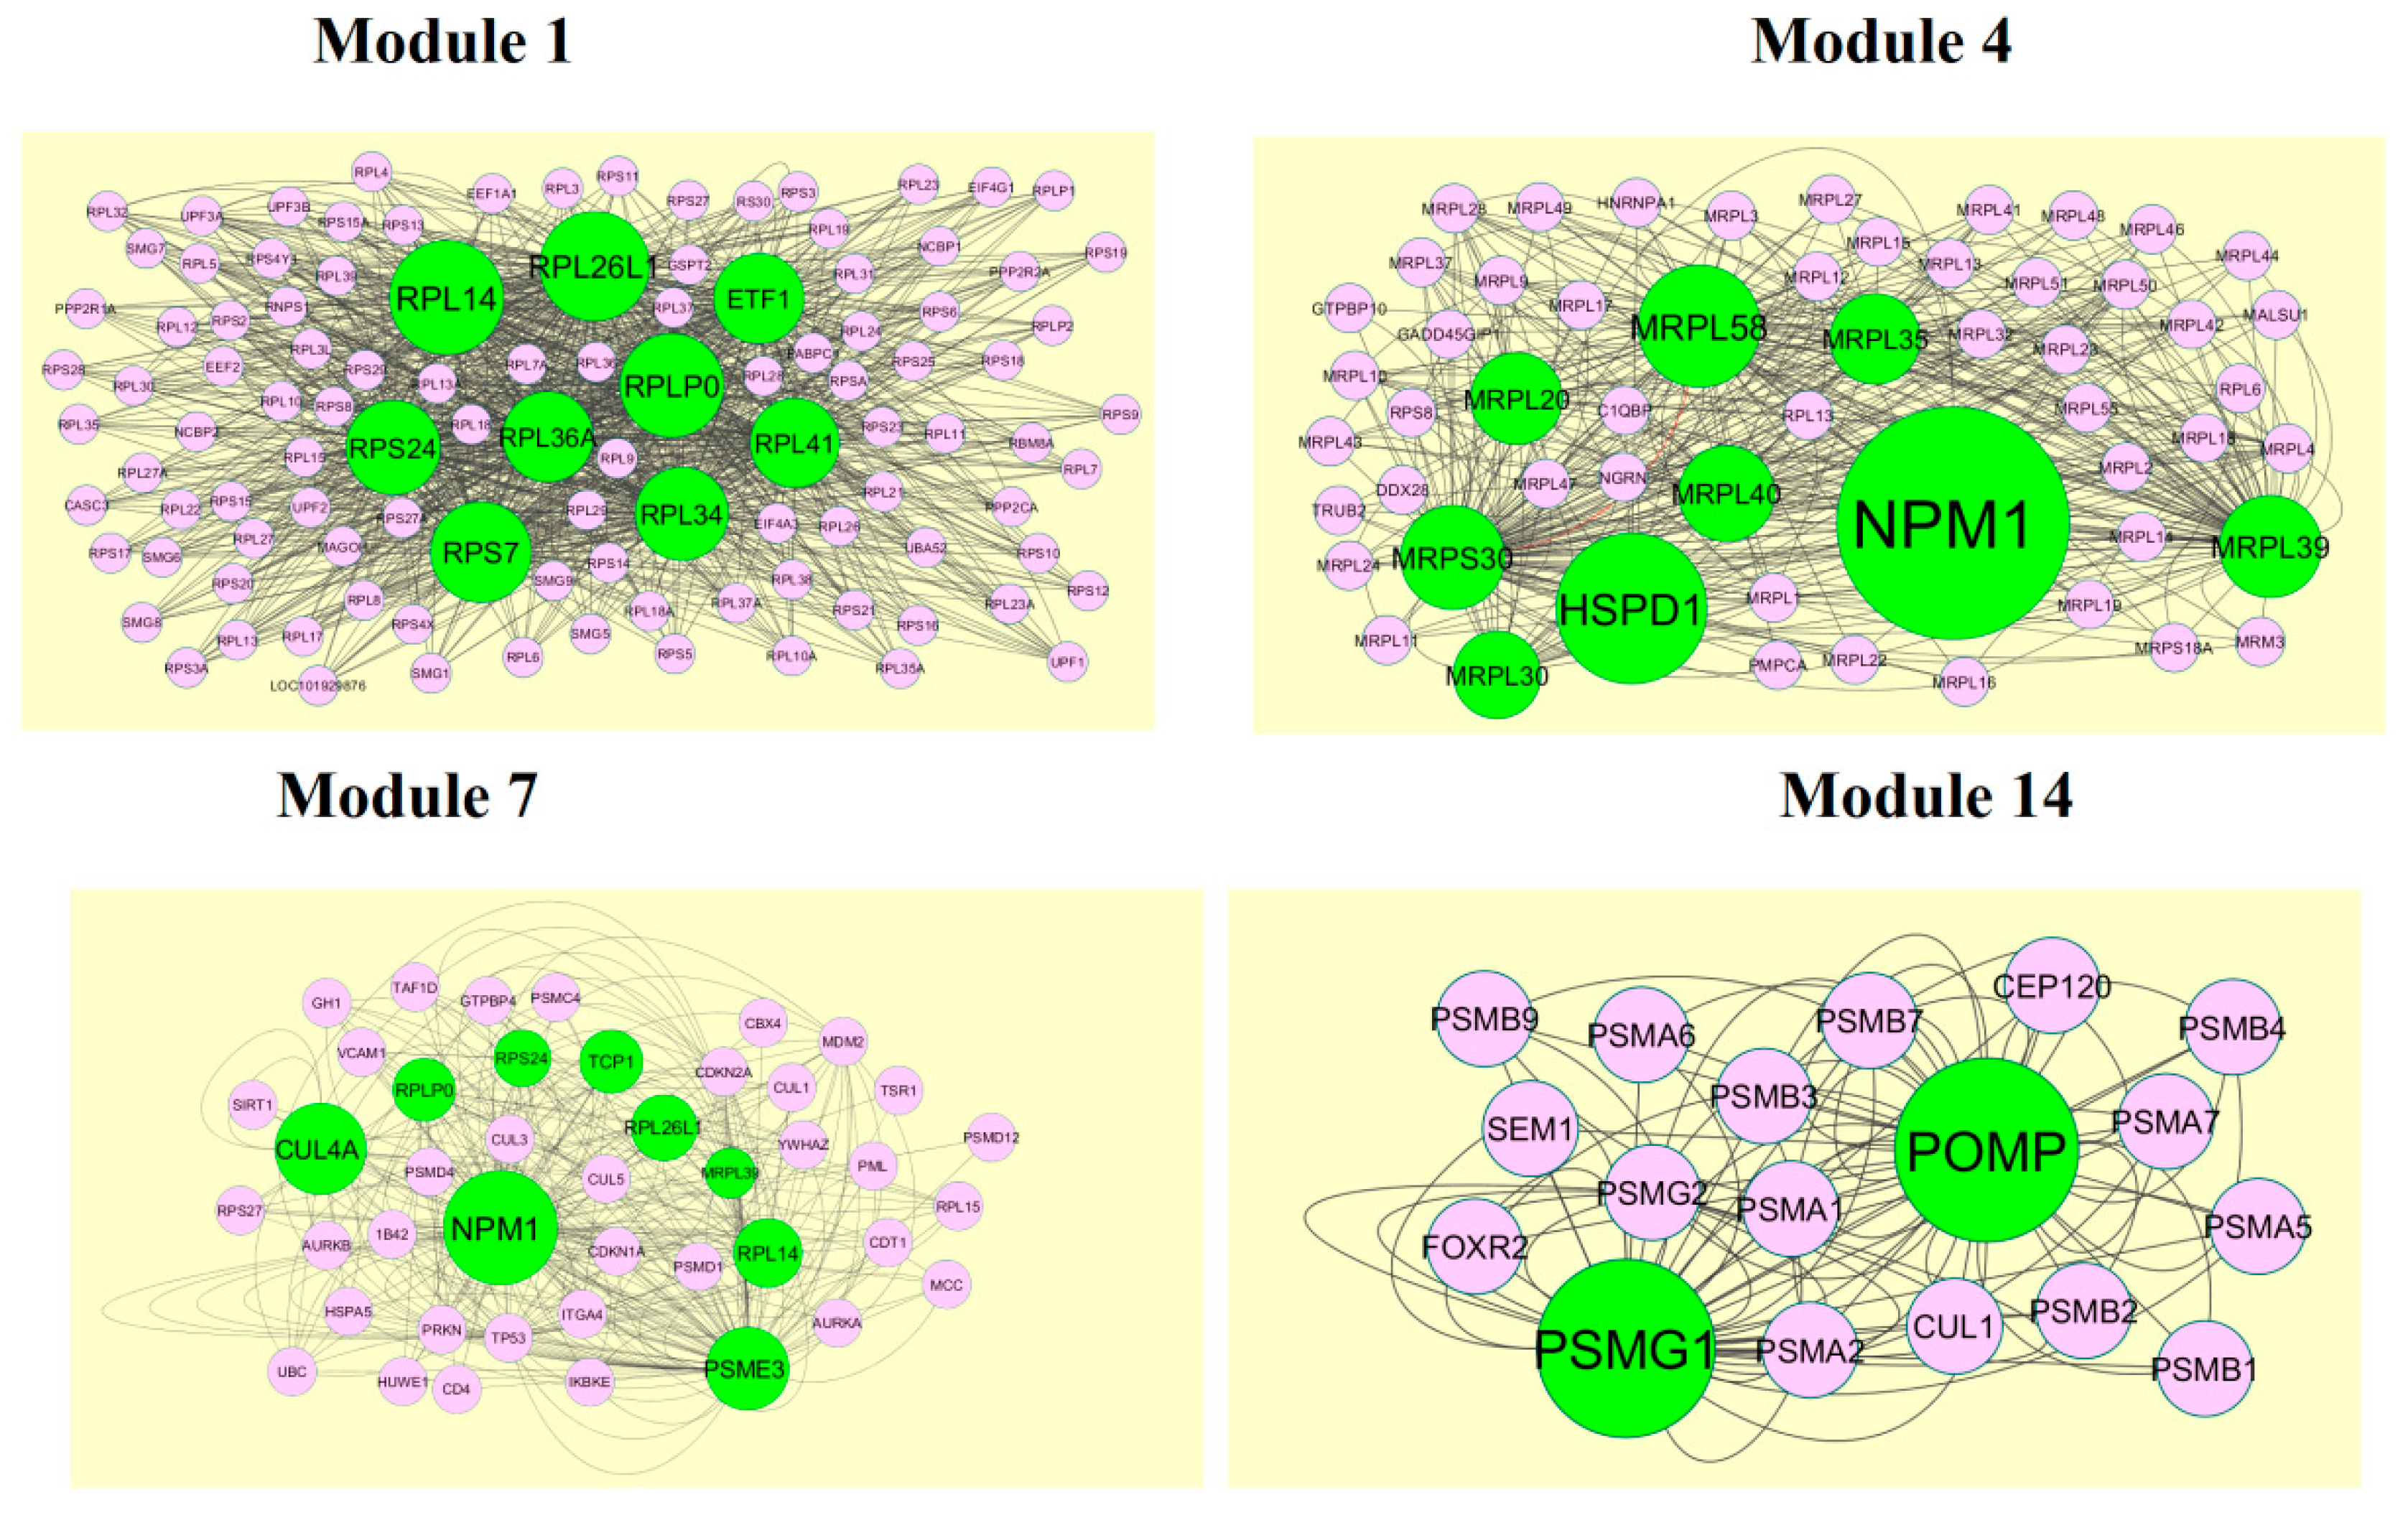
A total of 1473 modules were extracted from the PPI network (up regulated). Module 1, module 4, module 7, and module 14 were significant modules in the PPI network (Figure 10). Module 1 had 108 nodes and 1002 edges. Hub genes such as RPL14, RPL26L1, ETF1, RPS24, RPL36A, RPLP0, RPL41, RPL34, and RPS7 were involved in module 1. Module 4 had 43 nodes and 262 edges. Hub genes such as NPM1, MRPL39, MRPL35, MRPL58, MRPL20, MRPL40, MRPS30, HSPD1, and MRPL30 were involved in module 4. Module 7 had 43 nodes and 262 edges. Hub genes such as PSME3, CUL4A, TCP1, RPLP0, RPS24, RPL26L1, MRPL39, and RPL14 were involved in module 7. Module 14 had 18 nodes and 82 edges. Hub genes such as PSMG1 and POMP were involved in module 14.
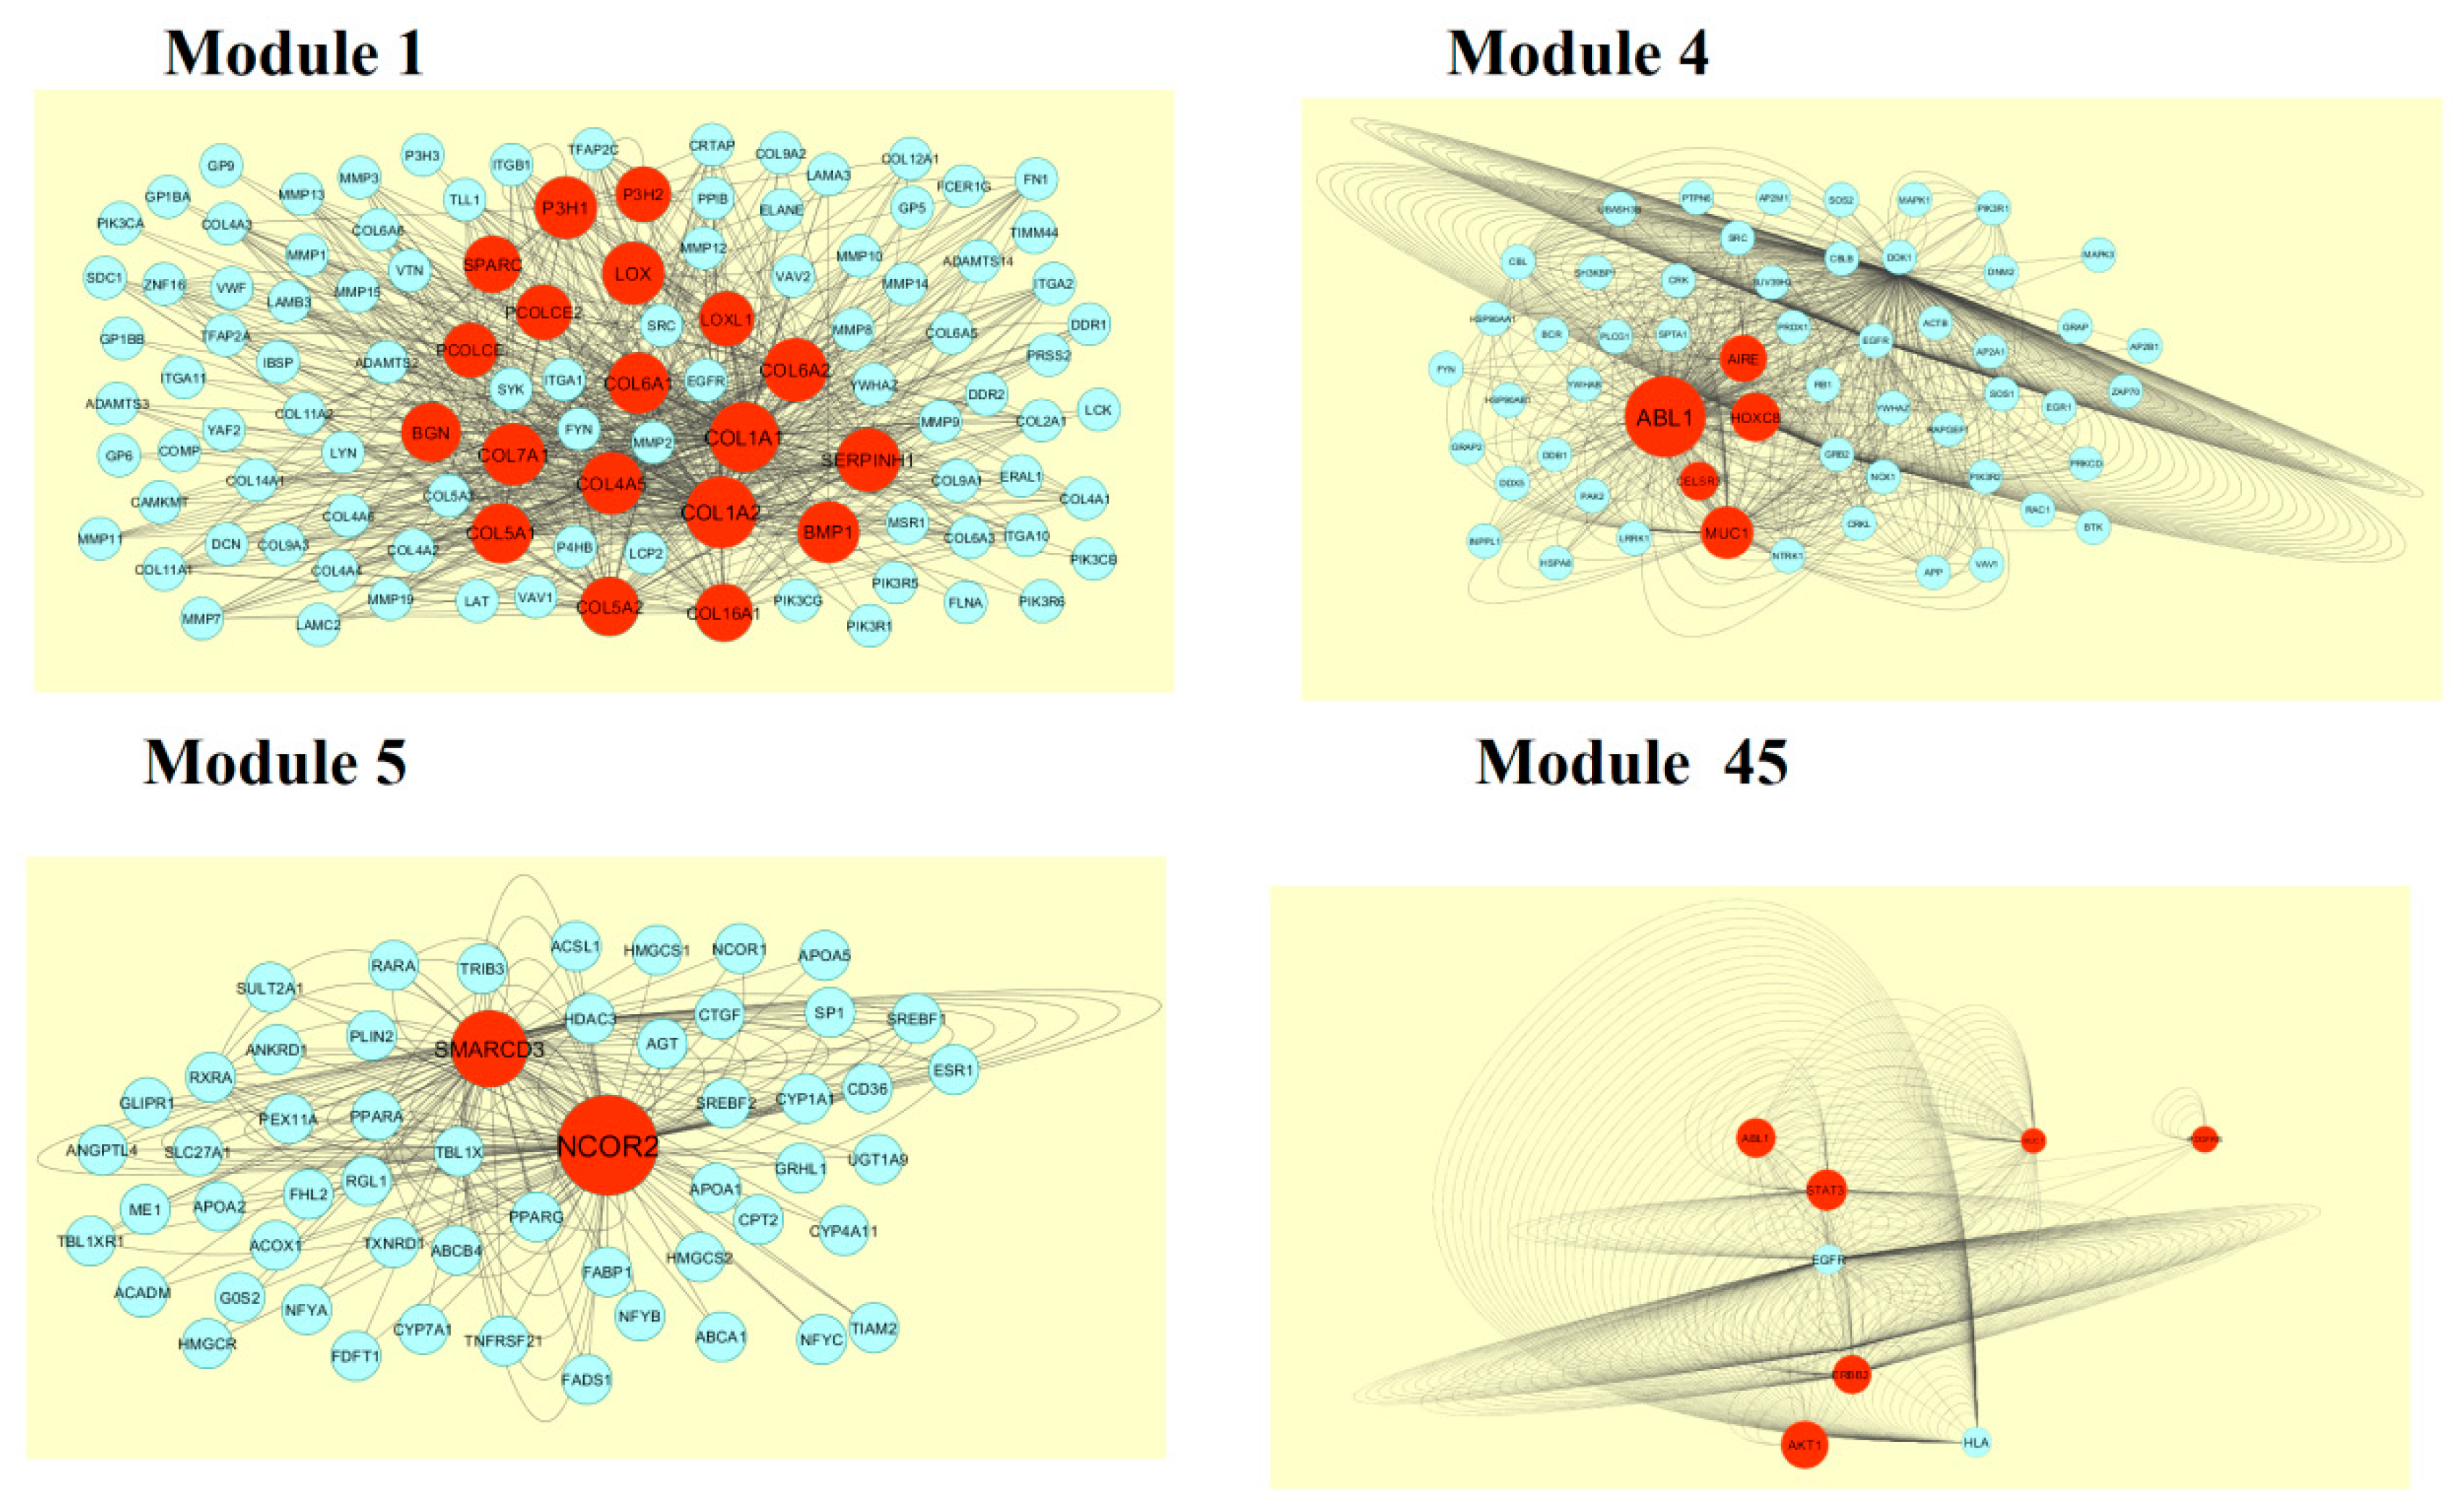
A total of 4198 modules were extracted from PPI network (down regulated). Module 1, module 4, module 5, and module 45 were significant modules in this PPI network (Figure 11). Module 1 had 108 nodes and 622 edges. Hub genes such as P3H2, P3H1, LOX, PCOLCE2, SPARC, PCOLCE, COL6A1, COL6A2, COL1A1, COL1A2, COL4A5, COL7A1, BGN, COL5A1, COL5A2, COL16A1, BMP1, and SERPINH1 were involved in module 1. Module 4 had 57 nodes and 553 edges. Hub genes such as ABL1, CELSR3, MUC1, HOXC8, and AIRE were involved in module 4. Module 5 had 55 nodes and 182 edges. Hub genes of such as NCOR2 and SMARCD3 were involved in module 5. Module 45 had 9 nodes and 346 edges. Hub genes such as AKT1, ERBB2, ABL1, STAT3, MUC1, and PDGFRB were involved in module 45.
3.6. Construction of the Target Gene-miRNA Network
MicroRNA (miRNA) expression is responsible for development of cancer progression [65]. The miRNAs that may control the DEGs were diagnosed based on the up and down regulation expressions (Figure 12 and Figure 13). Top five up regulated targeted genes such as DTNA interacts with 182 miRNAs, CNOT7 interacts with 182 miRNAs, PSME3 interacts with 163 miRNAs, CPEB1 interacts with 158 miRNAs, and EIF4E interacts with 157 miRNAs, are listed in Table S7. Meanwhile, top five down regulated targeted genes such as FAM126B interacts with 289 miRNAs, WDR26 interacts with 283 miRNAs, PRDM1 interacts with 235 miRNAs, DICER1 interacts with 233 miRNAs and PTGFRN interacts with 225 miRNAs, as listed in Table S7.
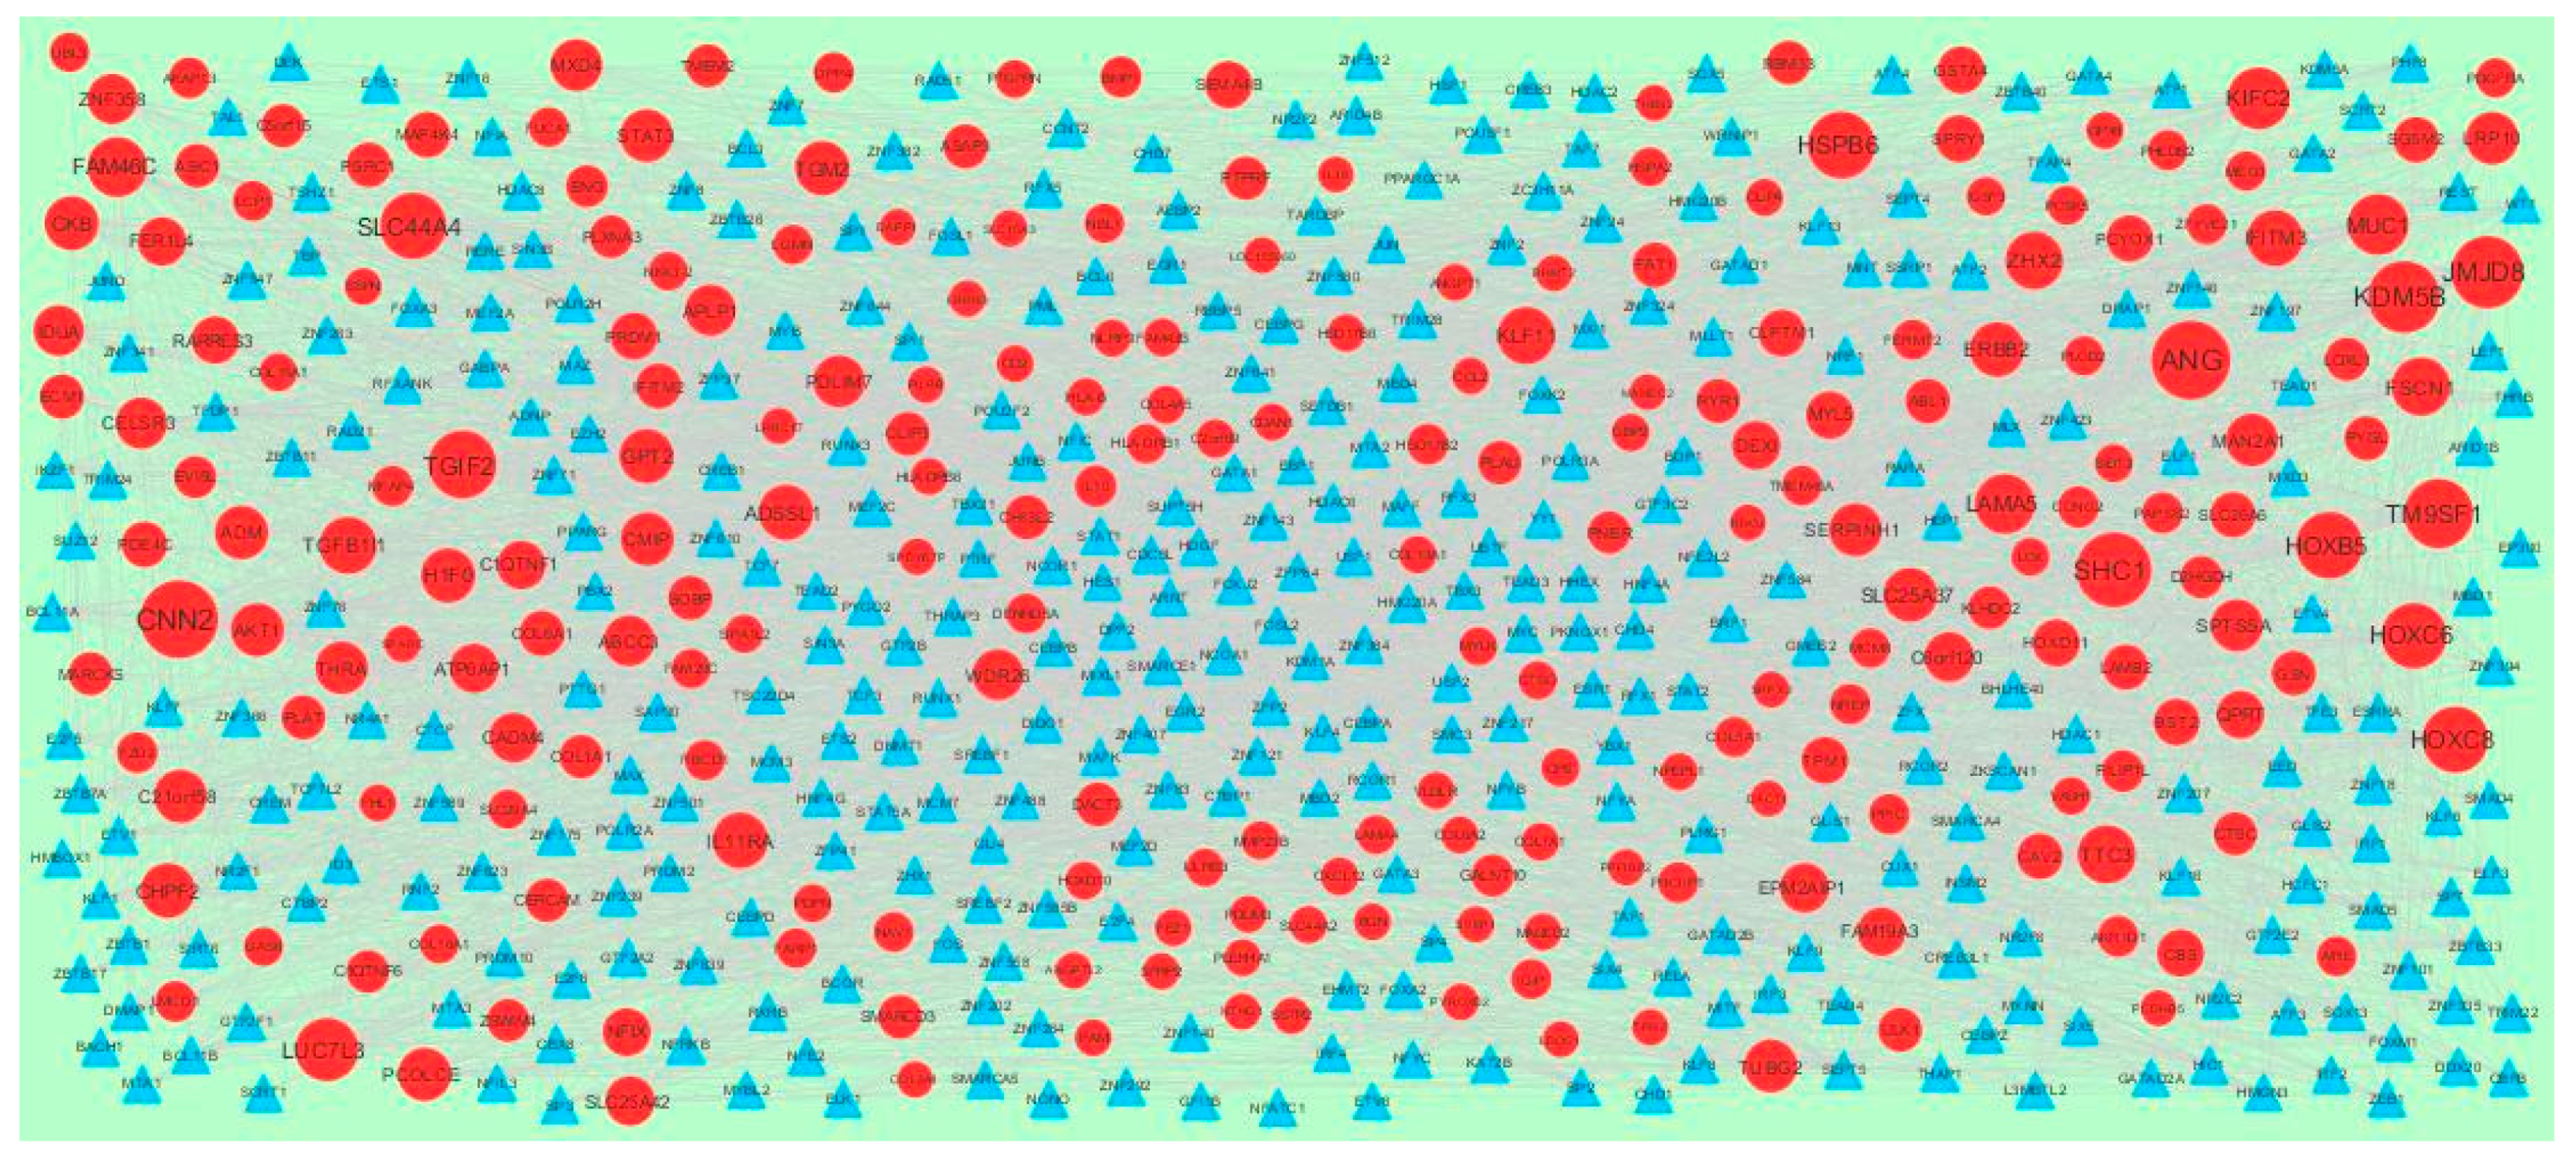
3.7. Construction of the Target Gene-TF Network
Transcription factors (TFs) were responsible for the pathogenesis of various cancers [66]. The TFs for target up and down regulated genes are presented in Figure 14 and Figure 15, respectively. Top five up regulated targeted genes such as RPL34 interacts with 47 TFs, LOC374443 interacts with 42 TFs, CENPM interacts with 41 TFs, TPRKB interacts with 37 TFs, and MRPL20 interacts with 35 TFs, which are listed in Table S8. Meanwhile the top five down regulated targeted genes such as MYL5 interacts with 64 TFs, NKX3-2 interacts with 59 TFs, BGN interacts with 55 TFs, TPM1 interacts with 50 TFs and FAT1 interacts with 47 TFs, as listed in Table S8.
3.8. Survival Curve Analysis of Hub Genes
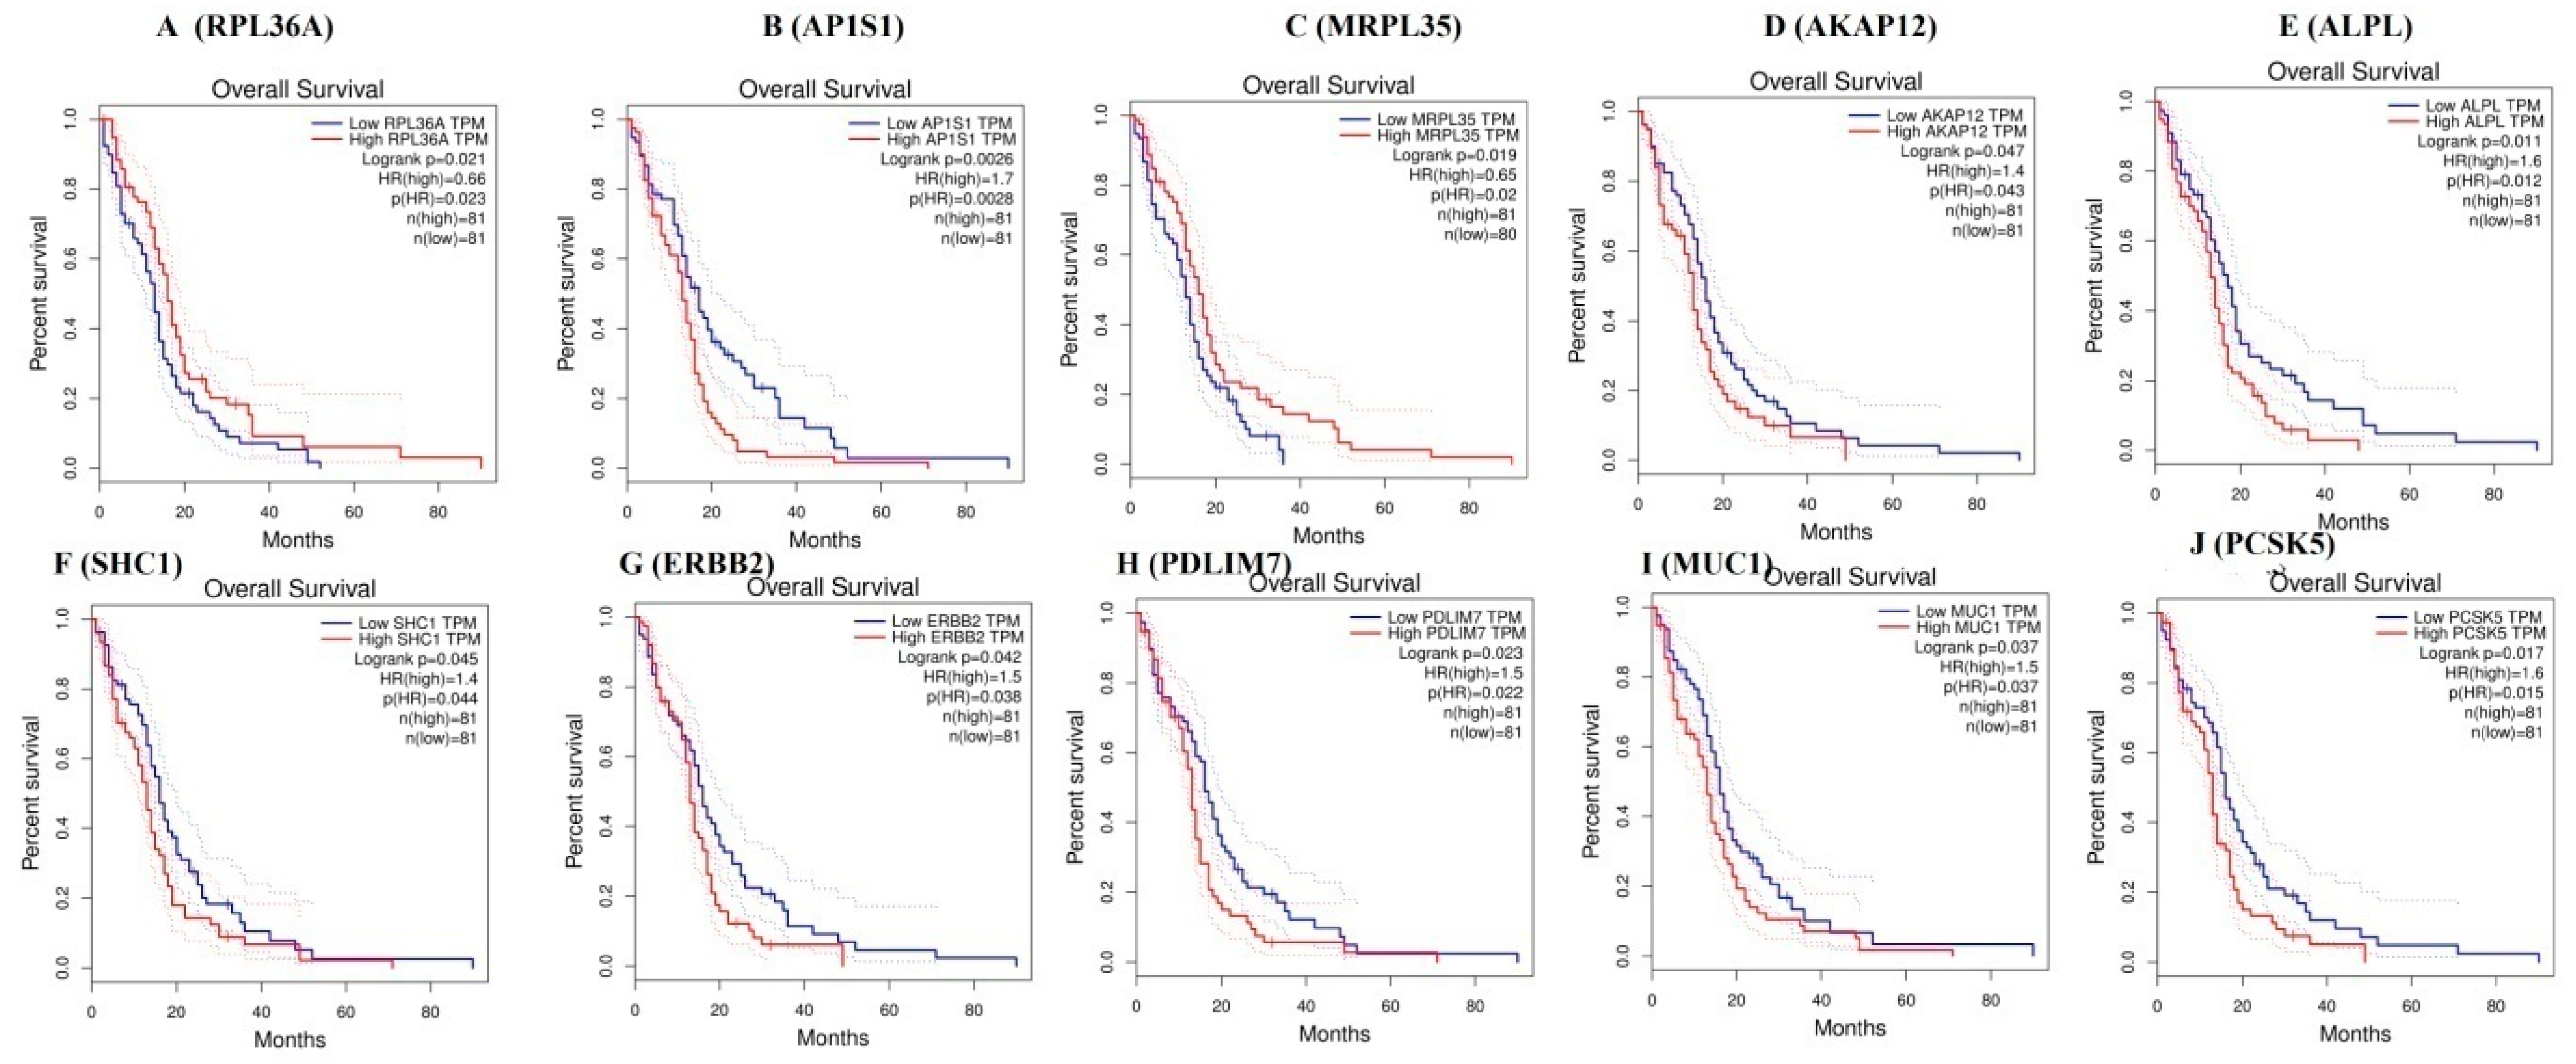
TCGA data of cervical cancer patients are used via the GEPIA data portal. The Kaplan-Meier curve for overall survival of TCGA patients with GBM is obtained according to the low and high expression of each gene. The results showed that patients in the high mRNA expression group for RPL36A had favorable overall survival than those in the low expression group (p = 0.021) (Figure 16A), the high mRNA expression group for AP1S1 had worse overall survival than those in the low expression group (p = 0.0026) (Figure 16B), the high mRNA expression group for MRPL35 had favorable overall survival than those in the low expression group (p = 0.019) (Figure 16C), the high mRNA expression group for AKAP12 had worse overall survival than those in the low expression group (p = 0.047) (Figure 16D), the high mRNA expression group for ALPL had worse overall survival than those in the low expression group (p = 0.011) (Figure 16E), the high mRNA expression group for SHC1 had worse overall survival than those in the low expression group (p = 0.011) (Figure 16F), the high mRNA expression group for ERBB2 had worse overall survival than those in the low expression group (p = 0.042) (Figure 16G), the high mRNA expression group for PDLIM7 had favorable overall survival than those in the low expression group (p = 0.023) (Figure 16H), the high mRNA expression group for MUC1 had worse overall survival than those in the low expression group (p = 0.037) (Figure 16I), and the high mRNA expression group for PCSK5 had favorable overall survival than those in the low expression group (p = 0.017) (Figure 16J).
3.9. The mRNA Expression Levels of Hub Genes in GBM
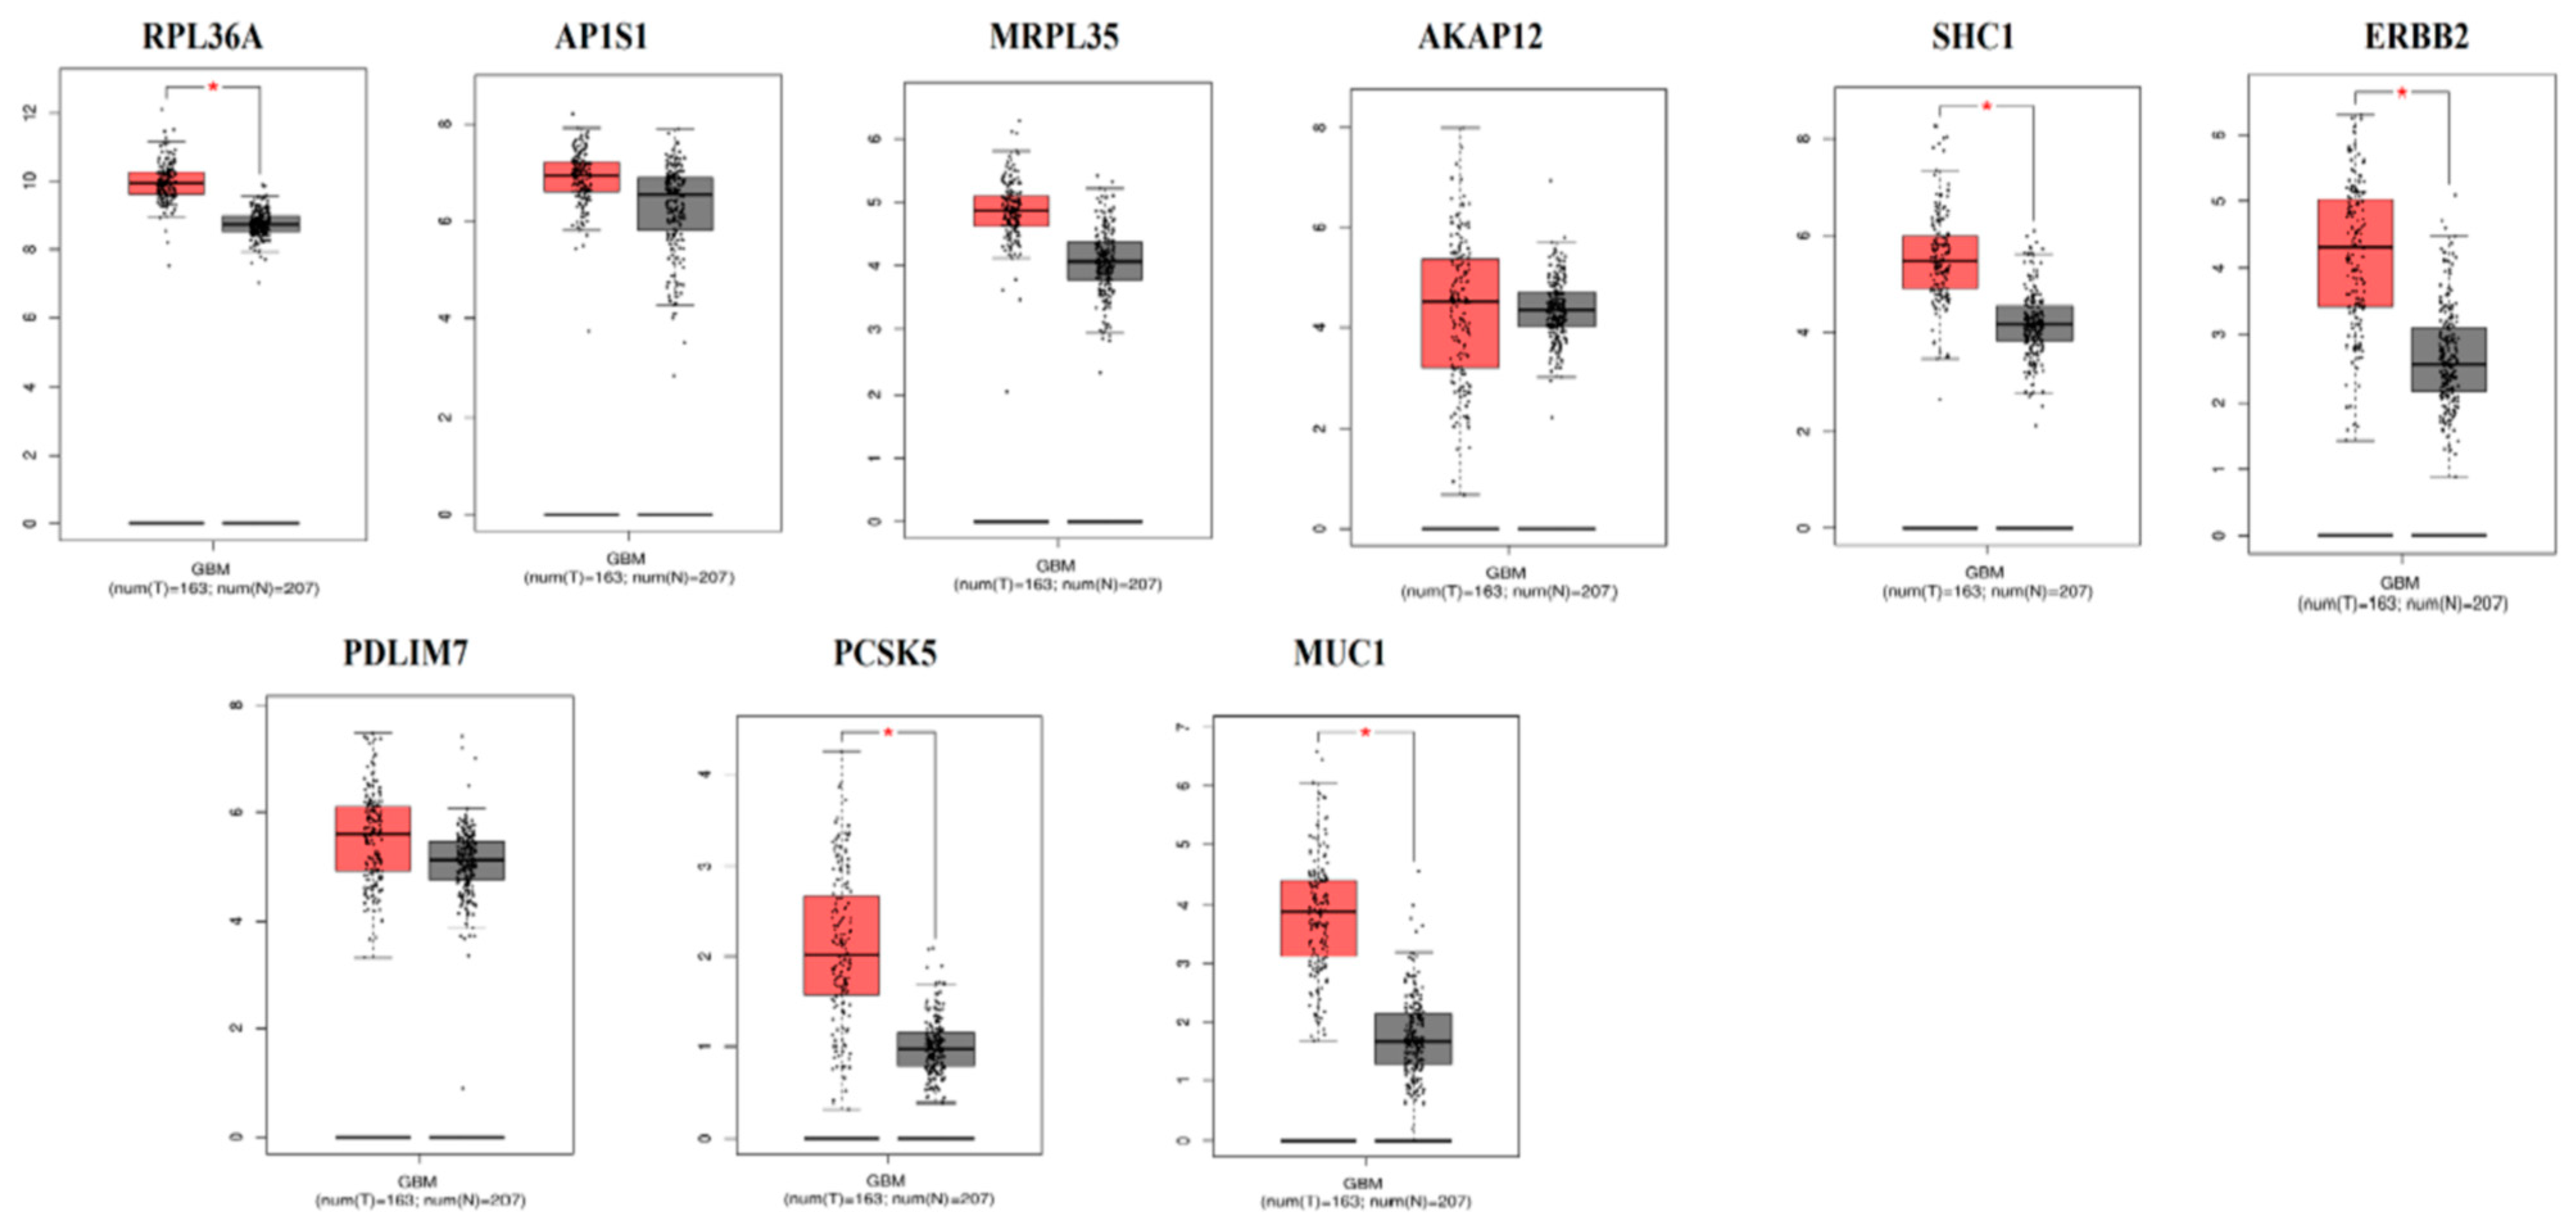
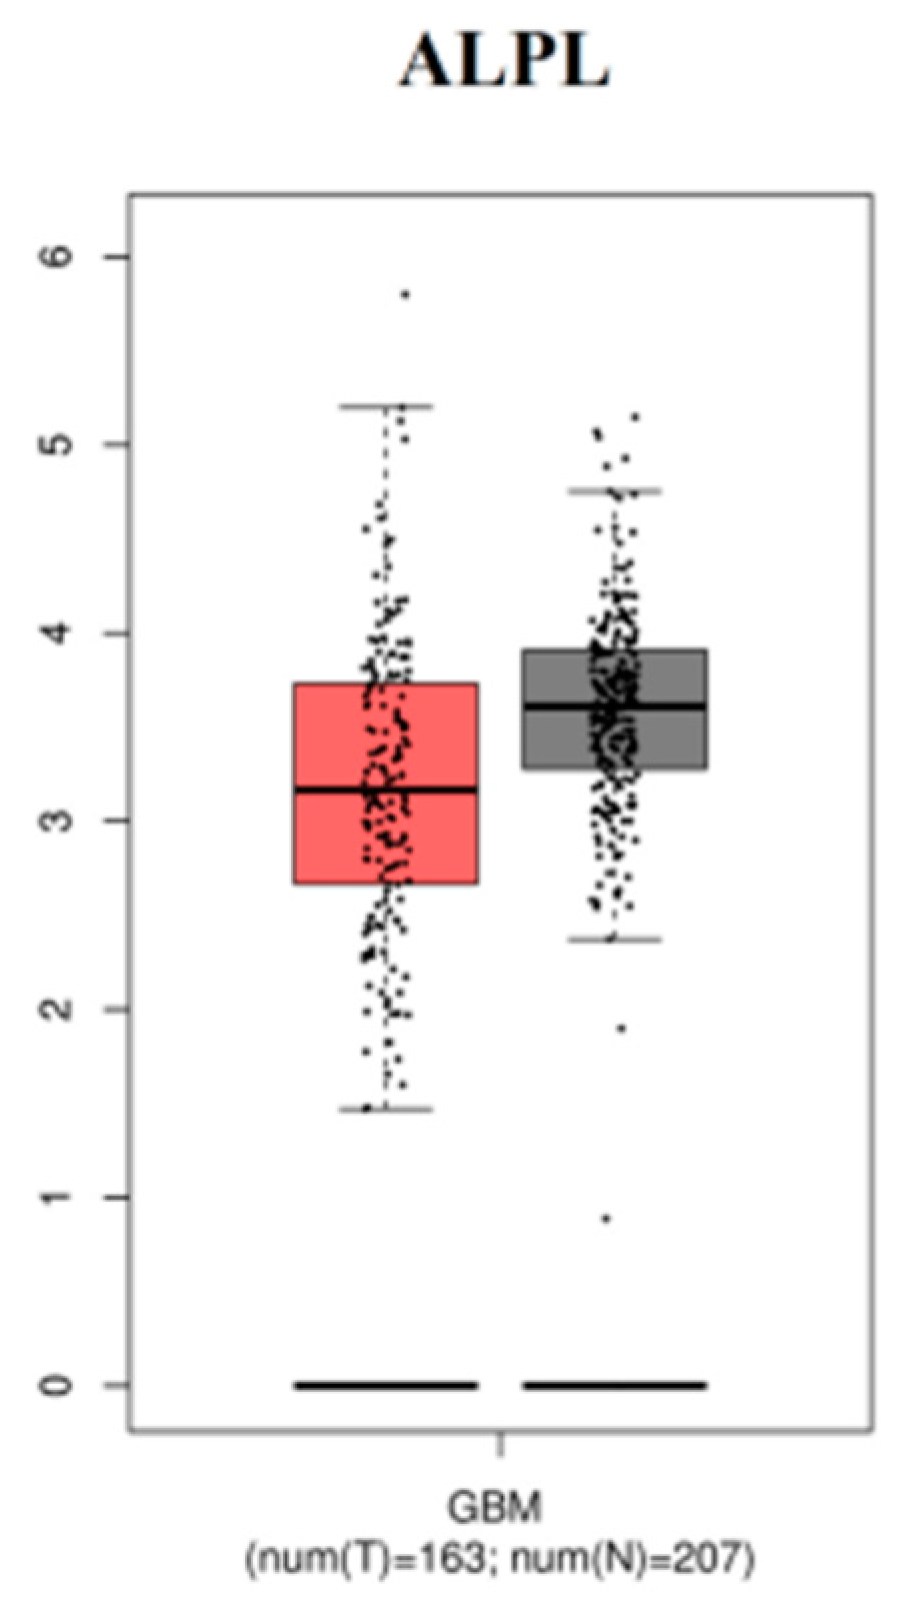
The expression level of hub genes are assessed in 163 tumor patients and 207 normal patients. The data showed that the hub gene expression of RPL36A, AP1S1, MRPL35, AKAP12, SHC1, ERBB2, PDLIM7, PCSK5, and MUC1 were increased (Figure 17), while that of expression of ALPL was reduced (Figure 18) in GBM compared with those in the normal patients.
3.10. Mutation Analysis
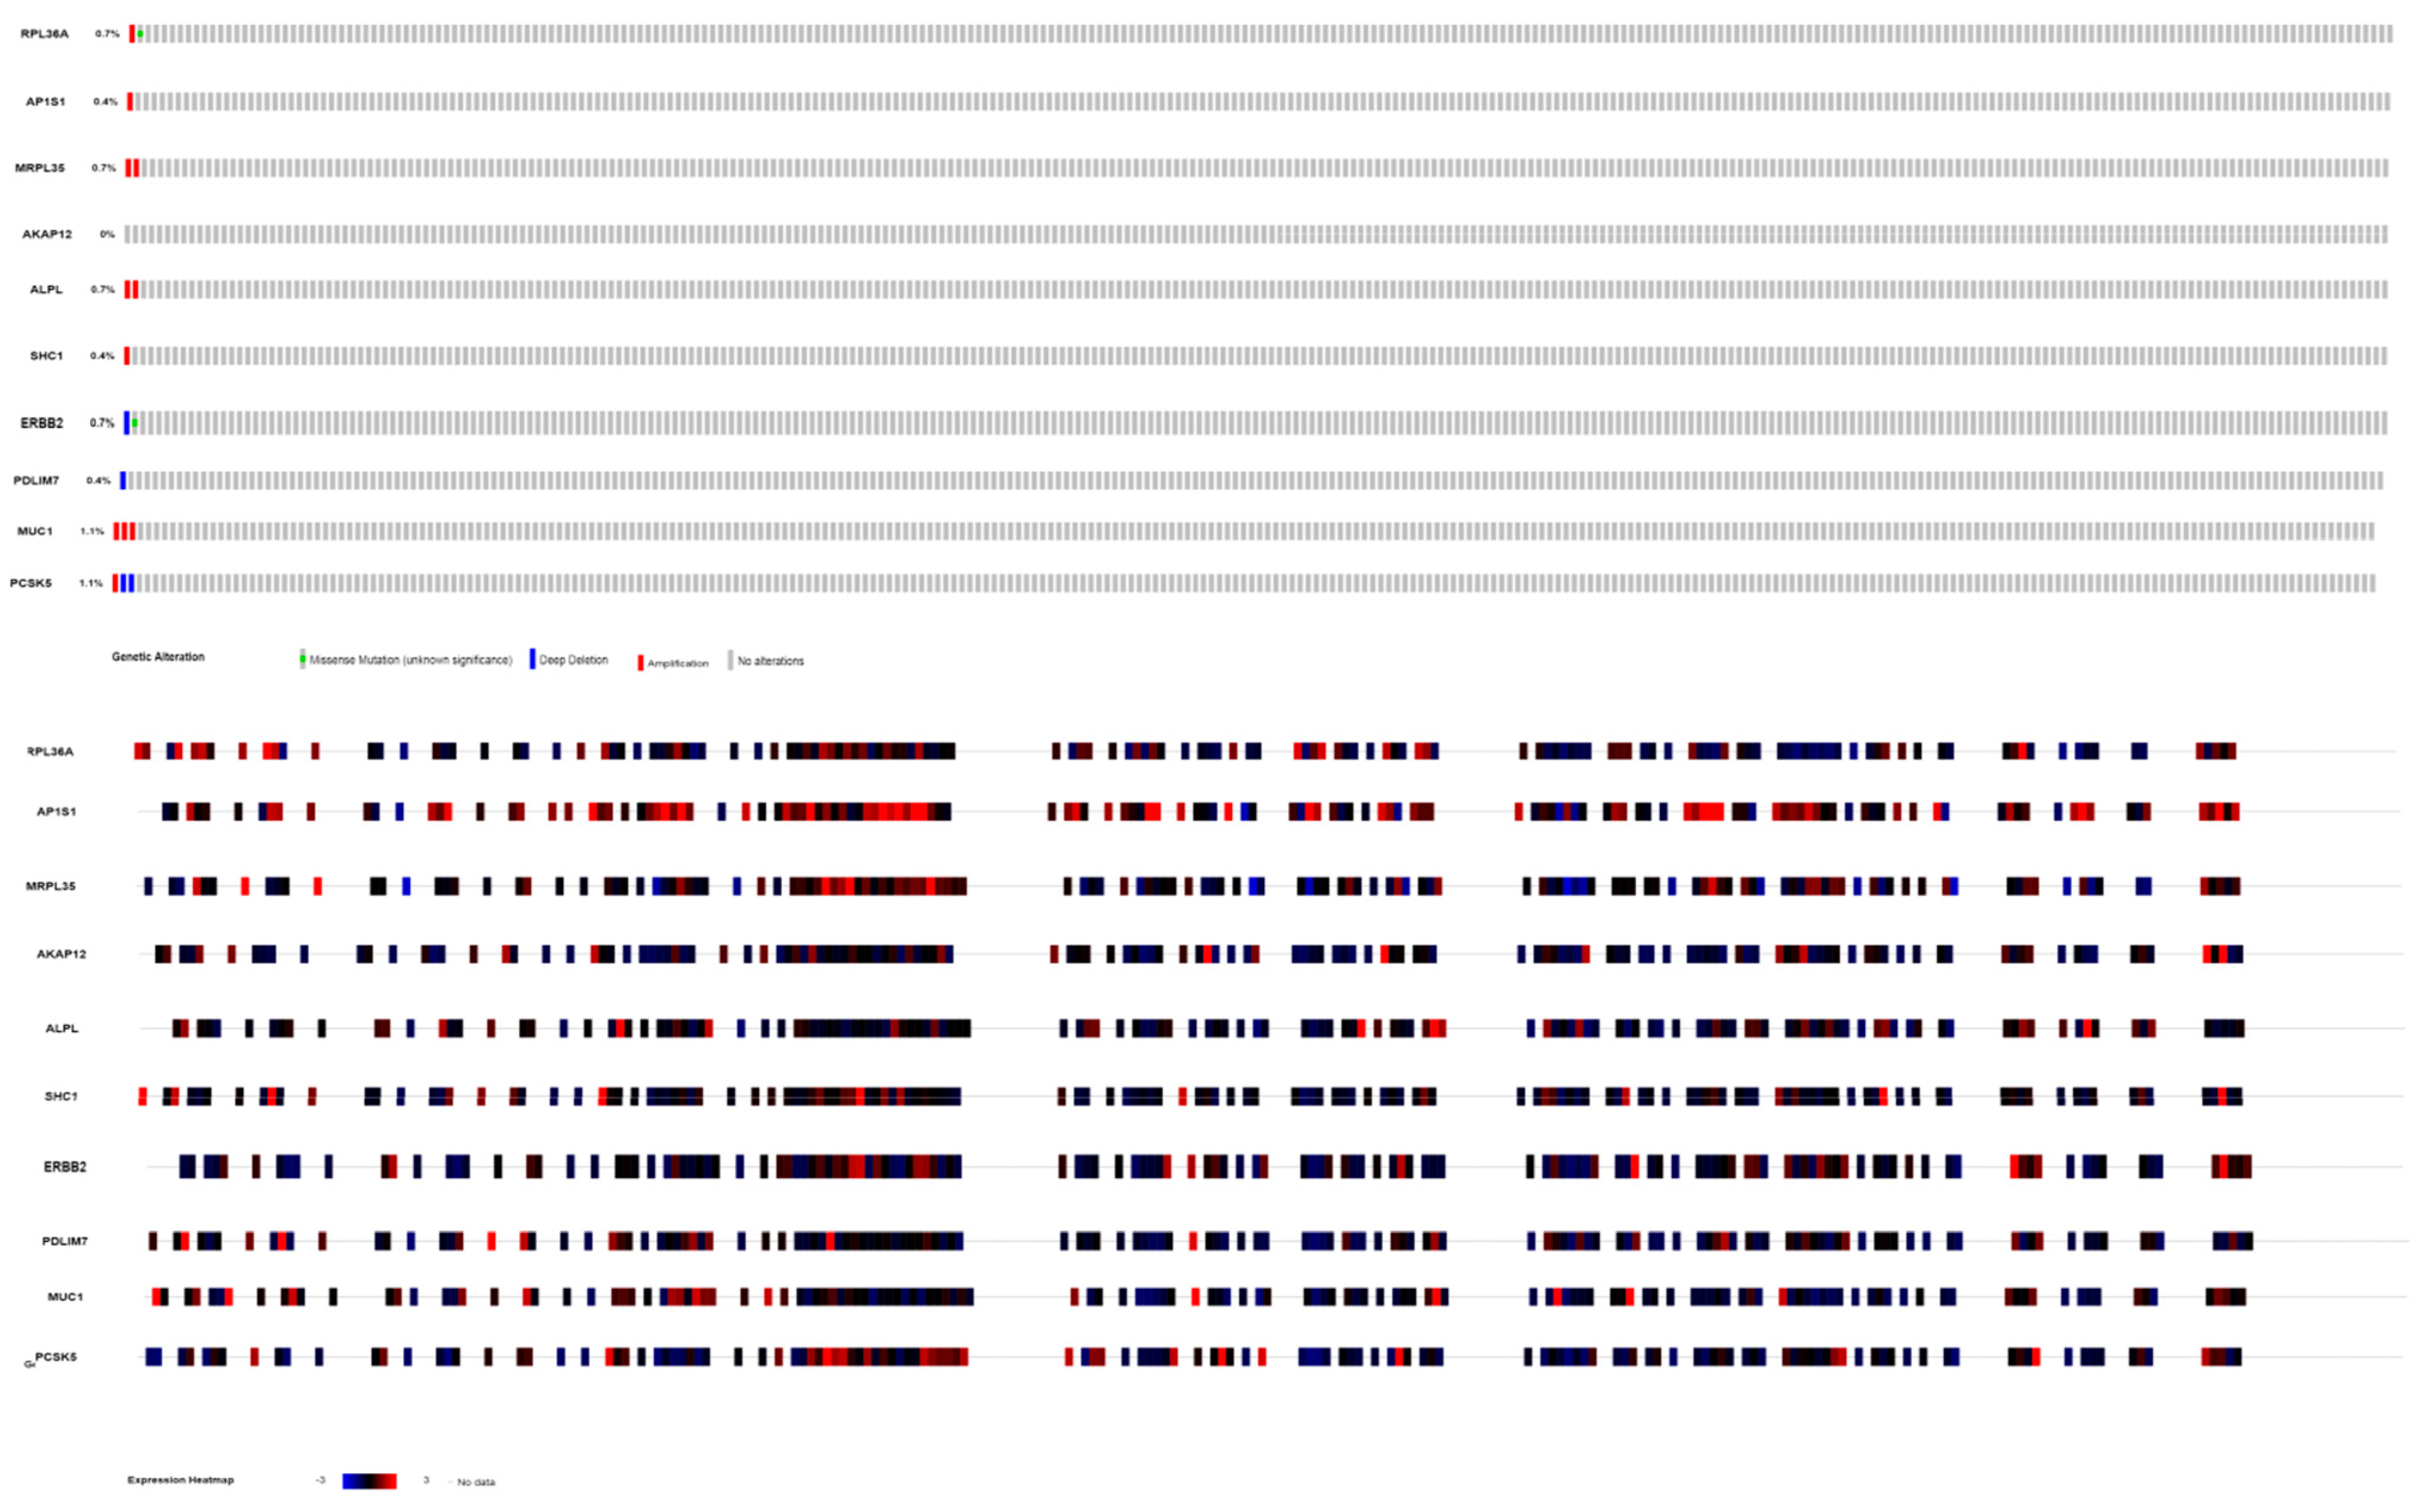
Ten hub genes’ alteration status in TCGA GBM patients were analyzed using the CbioPortal database. Hub genes such as RPL36A (0.7% amplification and missense mutation), AP1S1 (0.4% amplification), MRPL35 (0.7% amplification), AKAP12 (0% alteration), ALPL (0.7% amplification), SHC1 (0.4% amplification), ERBB2 (0.7% deep deletion and missense mutation), PDLIM7 (0.4% deep deletion), MUC1 (1.1% amplification) and PCSK5 (1.1% amplification and deep deletion) were altered in patients and the frequency of alteration of each hub gene are shown in Figure 19.
4. Discussion
The cause of GBM has not been fully enlightened. It is accepted to contain environmental and genetic factors. Genetic factors are crucial to resolve the process of GBM occurrence and advancement [67]. However, no single causal gene has been determined. Instead, multiple genes may influence a person’s chance of advancing GBM, when initiated by environmental factors [68]. Microarray analysis may be used to compute the expression levels of large numbers of genes simultaneously, combined with bioinformatics analysis, this may allow for the recognition of the linked pathways and important genes with complex diseases. In the current study, analysis of E-MTAB-5871 gene expression profiles identified a total of 590 DEGs (243 up-and 347 down-regulated DEGs) between the scrambled shRNA expression and Lin7A knock down samples.
VGF was associated with development of pulmonary neuroendocrine cancer [69], but this gene may be responsible for development of GBM. Somatic mutations in tumor suppressor CNOT7 was responsible for the development of colorectal carcinoma [70], but loss of this gene may be linked with GBM. Genes such as SYT13 [71] and BCYRN1 [72] were responsible for invasion and migration of many cancer cells such as gastric cancer and lung cancer, but these genes may be associated with invasion and migration of GBM cells. Overexpression of genes such as IL11RA [73], BST2 [74] and GAS6 [75] were important for pathogenesis of many cancer types such as gastric cancer, breast cancer, and ovarian cancer, but high expression of these genes may be responsible for advancement of GBM. FERMT2 was responsible for proliferation of esophageal squamous cancer cells [76], but this gene may be linked with proliferation of GBM. Mutations in PPFIBP2 [77] were involved in pathogenesis of prostate cancer, but alteration in this this gene may be important for the advancement of GBM. Genes such as HRK [78] and ENG [79] were responsible for the pathogenesis of GBM.
In pathway enrichment analysis for up regulated genes, genes such as RPLP0 [80] and MRPS30 [81] were associated with pathogenesis of many cancer types such as gastric cancer and breast cancer, but these genes may be responsible for advancement of GBM. Inactivation of tumor suppressor genes such as RPS7 [82], MRPL39 [83], MRPS23 [84], ME2 [85], and NDUFB9 [86] were diagnosed with the development of many cancer types such as colorectal cancer, gastric cancer, breast cancer, and pancreatic cancer, but loss of these genes may be responsible for the development of GBM. RPS24 [87] was linked with the proliferation of colon cancer cells, but this gene may be linked with the proliferation of GBM cells. Polymorphism in tumor suppressor RPL14 was associated with the pathogenesis of lung and oral cancers [88], but this polymorphic gene may be responsible for the growth of GBM. Genes such as RPL34 [89], GLO1 [90], LDHB [91], and COX5B [92] were responsible for pathogenesis of GBM. RPL41, RPL36A, MRPL30, MRPL35, MRPS17, MRPL20, RPL26L1, MRPS31, MRRF, MRPL58, MRPL40, NDUFA9, and ATP6V0D2 were identified as novel biomarkers for the pathogenesis of GBM. Meanwhile, pathway enrichment analysis for down regulated genes, genes such as MYL5 [93], CAV2 [94], BMP1 [95], COL5A1 [96], SERPINH1 [97], COL7A1 [98], COL8A1 [99], COL13A1 [100], BGN [101], SEMA4B [102], ECM1 [103], TGFB3 [104], ANGPTL2 [105], MUC1 [106], and CTSO [107] were responsible for the invasion of many cancer cells such as cervical cancer, triple-negative breast cancer, lung cancer, esophageal squamous cell carcinoma, urothelial carcinoma, gastric cancer and breast cancer, but these genes may be liable for the invasion of GBM cells. MYLK was important for pathogenesis of breast cancer through the inhibition of apoptosis [108], but this gene may be associated with the inhibition of apoptosis in GBM. Over expression of COL1A2 was important for the pathogenesis of gastric cancer [109], but high expression of this gene may be involved in development of GBM. Loss of SHC1 was answerable for the development of pancreatic cancer [110], but inactivation of this gene may be involved in the pathogenesis of GBM. Genes such as LAMA4 [111], LAMA5 [112], and C1QTNF6 [113] were involved in angiogenesis in many cancer types such as renal cell carcinoma, colorectal cancer, and hepatocellular carcinoma, but these genes may be linked with angiogenesis in GBM. Genes such as COL5A2 [114], SVEP1 [115], NID2 [116], and MMP23B [117] were responsible for the growth of many cancer types such as bladder cancer and mammary adenocarcinoma, but these genes may be involved in the pathogenesis of GBM. Methylation inactivation of tumor suppressor genes such as P3H2 [118] and PAMR1 [119] were involved in the pathogenesis of breast cancer, but loss of these genes may be important for pathogenesis of GBM. CTSC was associated with proliferation of colorectal cancer cell [120], but this gene may be responsible for the proliferation of GBM cells. Genes such as ERBB2 [121], PDGFRA [122], PDGFRB [123], ITGA5 [124], AKT1 [125], COL1A1 [126], COL6A1 [127], THBS2 [128], PLOD2 [129], P4HA1 [130], IL10 [131], SPARC [132], IL18 [133], SRPX2 [134], CCL2 [135], PLAT [136], PLAU [137], CXCL12 [138], SFRP2 [139], ANGPT1 [140], CXCL14 [141], TGM2 [142], FSTL1 [143], IGFBP5 [144], IGFBP7 [145], LOX [146], and LOXL1 [147] were diagnosed with the development of GBM. ACTN1, COL4A5, COL6A2, LAMB2, P3H1, COL15A1, COL16A1, PCOLCE2, PCOLCE, PCSK5, IK3IP1, MFAP4, FAM20C, C1QTNF1, PLXNA3, and NTNG1 were identified as novel biomarkers for the pathogenesis of GBM.
In GO enrichment analysis for up regulated genes, genes such as EIF4E [148] and RPS24 [87] were associated with cancer cell proliferation in many cancer types such as prostate cancer and colorectal cancer cells, but these genes may be responsible for the proliferation of GBM cells. Genes such as NPM1 [149] and CPEB1 [150] were diagnosed with the development of GBM. RSL1D1, ETF1, MRPL30, SLC25A26, SNU13, C8orf88, SLC25A4, NHP2, and EEF1B2 were identified as novel biomarkers for the pathogenesis of GBM. Meanwhile, for GO enrichment analysis for down regulated genes, genes such as GSN [151], FSCN1 [152], and PHLDB2 [153] were important for the invasion of many cancer types such as pancreatic cancer, bladder cancer, and colon cancer cells, but these genes may be involved in the invasion of GBM. Somatic mutation in LMCD1 is responsible for metastasis of hepatocellular carcinoma [154], but the loss of this gene may be diagnosed with metastasis of GBM. Genes such as UPAR [155] and TGFB1I1 [156] were diagnosed with the development of GBM. ABL1, RECK, DPP4, ERO1A, APLP1, LCP1, MAMDC2, and CASK were identified as novel biomarkers for the pathogenesis of GBM.
In the PPI network (up regulated), genes such as CUL4A [157] and GLRX3 [158] were responsible for the invasion of many cancer types such as prostate cancer and oral squamous cell carcinoma, but these genes may be identified with the invasion of GBM. Genes such as PSME3 [159] and HSPD1 [160] were involved in the pathogenesis of many cancer types such as colorectal cancer and colon cancer, but these genes may be important for the growth of GBM. Alteration in RAC2 was responsible for pathogenesis of GBM [161]. CENPM. HEBP1, YIPF1, EFCAB7, SPTLC3, and ZNF586 were novel biomarkers for the pathogenesis of GBM. In the PPI network (down regulated), genes such as STAT3 [162], HNRNPA2B1 [163], and SSTR2 [164] were responsible for the pathogenesis of GBM. Methylation inactivation of tumor suppressor gene FILIP1L was important for pathogenesis of prostate cancer [165], but loss of this gene may be associated with the development of GBM. Low expression of tumor suppressor TCEA3 is liable for pathogenesis of ovarian cancer [166], but decreased expression of this gene may be identified with the growth of GBM. VLDLR, FIBCD1, and UBL3 were identified as novel biomarkers for pathogenesis of GBM.
In module analysis for the PPI network (up regulated), TCP1 was responsible for the growth of GBM [167]. PSMG1 and POMP were novel biomarkers for the pathogenesis of GBM. Meanwhile module analysis for the PPI network (down regulated), methylation inactivation of tumor suppressor gene CELSR3 was identified with the development of oral squamous cell carcinoma [168], but loss of this gene may be responsible for the pathogenesis of GBM. Genes such as HOXC8 [169] and NCOR2 [170] were associated with the pathogenesis of GBM. AIRE and SMARCD3 were novel biomarkers for the pathogenesis of GBM.
In target genes-miRNA network (up regulated), DTNA was a novel biomarker for the pathogenesis of GBM. Meanwhile, in target genes-miRNA network (down regulated), WDR26 was responsible for the invasion of breast cancer cells [171], but this gene may be identified with invasion of GBM. PRDM1 was responsible for pathogenesis of GBM [172]. Modification in tumor suppressor DICER1 was liable for the pathogenesis of ovarian cancers [173], but mutation in this gene may be diagnosed with the growth of GBM. FAM126B and PTGFRN were identified as novel biomarkers for the pathogenesis of GBM.
In target genes-TF network (up regulated), LOC374443 and TPRKB were novel biomarkers for pathogenesis of GBM. Meanwhile, in target genes-TF network (down regulated), genes such as TPM1 [174] and FAT1 [175] were diagnosed with growth of GBM. NKX3-2 was a novel biomarker for pathogenesis of GBM.
Survival analysis revealed that genes such as RPL36A, MRPL35, PDLIM7, and PCSK5 were predicting longer survival of GBM, while AP1S1, AKAP12, ALPL, SHC1, ERBB2, and MUC1 were predicting shorter survival of GBM. High expression of genes such as RPL36A, AP1S1, MRPL35, AKAP12, SHC1, ERBB2, PDLIM7, PCSK5, and MUC1 were linked with GBM, while low expression of genes such as ALPL was linked with the pathogenesis of GBM. AKAP12 were associated with the development of GBM [176]. From the TCGA database, genes such as AP1S1, RPL36A, and MRPL35 were expressed in GBM.
These findings could significantly enhance our understanding of the cause and underlying molecular mechanisms in GBM, these candidate genes and pathways could serve as new prognostic biomarkers and therapeutic targets for GBM. In the future, these findings will assist in developing and designing new diagnostic and therapeutic agents for the management of GBM.
5. Conclusions
In conclusion, several hub genes and pathways diagnosed in the current study may be associated in the molecular mechanism of GBM pathogenesis. These results obtained from gene expression microarray data may improve our understanding of molecular mechanisms underlying GBM. However, further validation of these hub genes and pathways diagnosed in the current study will be required to investigate the pathogenic molecular mechanisms of GBM.
Supplementary Materials
The following are available online at https://www.mdpi.com/2218-273X/9/5/201/s1, Table S1. The statistical metrics for key differentially expressed genes (DEGs). Table S2. The enriched pathway terms of the up-regulated differentially expressed genes. Table S3. The enriched pathway terms of the down-regulated differentially expressed genes. Table S4. The enriched GO terms of the up-regulated differentially expressed genes. Table S5. The enriched GO terms of the down-regulated differentially expressed genes. Table S6. Topology table for up and down regulated genes. Table S7. Target gene- miRNA interaction table. Table S8. Target gene-TF interaction table.
Author Contributions
A.M.A. associated with project administration, methodology, and review and editing, A.M.A., I.A.S., and B.V. participated in writing the original draft and investigation, C.V. performed software, supervision, formal analysis and validation. B.V. and A.M.A. made substantial contributions to acquisition of resources, formal analysis, and validation.
Funding
This research received no external funding.
Acknowledgments
We thank Dieter Lemke Neuroonkologie, Universität Heidelberg. DeutschenKrebsforschungszentrum (DKFZ) very much, the author who deposited their microarray dataset, E-MTAB-5871, into the public Array Express database.
Conflicts of Interest
The authors declare no conflict of interest.
References
- Skog, J.; Würdinger, T.; van Rijn, S.; Meijer, D.H.; Gainche, L.; Sena-Esteves, M.; Curry, W.T.; Carter, B.S.; Krichevsky, A.M.; Breakefield, X.O. Glioblastoma microvesicles transport RNA and proteins that promote tumour growth and provide diagnostic biomarkers. Nat. Cell Biol. 2008, 10, 1470–1476. [Google Scholar] [CrossRef] [PubMed]
- Liu, Y.; Carson-Walter, E.B.; Cooper, A.; Winans, B.N.; Johnson, M.D.; Walter, K.A. Vascular gene expression patterns are conserved in primary and metastatic brain tumors. J. Neurooncol. 2010, 99, 13–24. [Google Scholar] [CrossRef] [PubMed] [Green Version]
- Lötsch, D.; Steiner, E.; Holzmann, K.; Spiegl-Kreinecker, S.; Pirker, C.; Hlavaty, J.; Petznek, H.; Hegedus, B.; Garay, T.; Mohr, T.; et al. Major vault protein supports glioblastoma survival and migration by upregulating the EGFR/PI3K signalling axis. Oncotarget 2013, 4, 1904–1918. [Google Scholar] [CrossRef] [PubMed]
- Soda, Y.; Myskiw, C.; Rommel, A.; Verma, I.M. Mechanisms of neovascularization and resistance to anti-angiogenic therapies in glioblastoma multiforme. J. Mol. Med. (Berl.) 2013, 91, 439–448. [Google Scholar] [CrossRef] [PubMed] [Green Version]
- Hochberg, F.; Toniolo, P.; Cole, P.; Salcman, M. Nonoccupational risk indicators of glioblastoma in adults. J. Neurooncol. 1990, 8, 55–60. [Google Scholar] [CrossRef]
- Srinivas, P.R.; Kramer, B.S.; Srivastava, S. Trends in biomarker research for cancer detection. Lancet. Oncol. 2001, 2, 698–704. [Google Scholar] [CrossRef]
- Mehrian-Shai, R.; Chen, C.D.; Shi, T.; Horvath, S.; Nelson, S.F.; Reichardt, J.K.; Sawyers, C.L. Insulin growth factor-binding protein 2 is a candidate biomarker for PTEN status and PI3K/Akt pathway activation in glioblastoma and prostate cancer. Proc. Natl. Acad. Sci. USA 2007, 104, 5563–5568. [Google Scholar] [CrossRef] [Green Version]
- Graff, J.R.; McNulty, A.M.; Hanna, K.R.; Konicek, B.W.; Lynch, R.L.; Bailey, S.N.; Banks, C.; Capen, A.; Goode, R.; Lewis, J.E.; et al. The protein kinase Cbeta-selective inhibitor, Enzastaurin (LY317615.HCl), suppresses signaling through the AKT pathway, induces apoptosis, and suppresses growth of human colon cancer and glioblastoma xenografts. Cancer Res. 2005, 65, 7462–7469. [Google Scholar] [CrossRef]
- Hiratsuka, M.; Inoue, T.; Toda, T.; Kimura, N.; Shirayoshi, Y.; Kamitani, H.; Watanabe, T.; Ohama, E.; Tahimic, C.G.; Kurimasa, A.; et al. Proteomics-based identification of differentially expressed genes in human gliomas: Down-regulation of SIRT2 gene. Biochem. Biophys. Res. Commun. 2003, 309, 558–566. [Google Scholar] [CrossRef]
- Groot, J.F.; Piao, Y.; Tran, H.; Gilbert, M.; Wu, H.K.; Liu, J.; Bekele, B.N.; Cloughesy, T.; Mehta, M.; Robins, H.I.; et al. Myeloid biomarkers associated with glioblastoma response to anti-VEGF therapy with aflibercept. Clin. Cancer Res. 2011, 17, 4872–4881. [Google Scholar] [CrossRef]
- Lynch, T.J.; Bell, D.W.; Sordella, R.; Gurubhagavatula, S.; Okimoto, R.A.; Brannigan, B.W.; Harris, P.L.; Haserlat, S.M.; Supko, J.G.; Haluska, F.G.; et al. Activating mutations in the epidermal growth factor receptor underlying responsiveness of non-small-cell lung cancer to gefitinib. N. Engl. J. Med. 2004, 350, 2129–2139. [Google Scholar] [CrossRef]
- Moroni, M.; Veronese, S.; Benvenuti, S.; Marrapese, G.; Sartore-Bianchi, A.; Di Nicolantonio, F.; Gambacorta, M.; Siena, S.; Bardelli, A. Gene copy number for epidermal growth factor receptor (EGFR) and clinical response to antiEGFR treatment in colorectal cancer: A cohort study. Lancet Oncol. 2005, 6, 279–286. [Google Scholar] [CrossRef]
- Kalyankrishna, S.; Grandis, J.R. Epidermal growth factor receptor biology in head and neck cancer. J. Clin. Oncol. 2006, 24, 2666–2672. [Google Scholar] [CrossRef]
- Sainsbury, J.R.; Farndon, J.R.; Needham, G.K.; Malcolm, A.J.; Harris, A.L. Epidermal-growth-factor receptor status as predictor of early recurrence of and death from breast cancer. Lancet 1987, 1, 1398–1402. [Google Scholar]
- Rossi, M.R.; La Duca, J.; Matsui, S.; Nowak, N.J.; Hawthorn, L.; Cowell, J.K. Novel amplicons on the short arm of chromosome 7 identified using high resolution array CGH contain over expressed genes in addition to EGFR in glioblastoma multiforme. Genes Chromosomes Cancer 2005, 44, 392–404. [Google Scholar] [CrossRef] [PubMed]
- Perego, C.; Vanoni, C.; Massari, S.; Raimondi, A.; Pola, S.; Cattaneo, M.G.; Francolini, M.; Vicentini, L.M.; Pietrini, G. Invasive behaviour of glioblastoma cell lines is associated with altered organisation of the cadherin-catenin adhesion system. J. Cell Sci. 2002, 115, 3331–3340. [Google Scholar]
- Maksimovic, J.; Gordon, L.; Oshlack, A. SWAN: Subset-quantile within array normalization for illumina infinium HumanMethylation450 BeadChips. Genome. Biol. 2012, 13, 44. [Google Scholar] [CrossRef] [PubMed]
- Du, P.; Kibbe, W.A.; Lin, S.M. lumi: A pipeline for processing Illumina microarray. Bioinformatics 2008, 24, 1547–1548. [Google Scholar] [CrossRef] [PubMed]
- Ritchie, M.E.; Phipson, B.; Wu, D.; Hu, Y.; Law, C.W.; Shi, W.; Smyth, G.K. limma powers differential expression analyses for RNA-sequencing and microarray studies. Nucleic Acids Res. 2015, 43, e47. [Google Scholar] [CrossRef]
- Kim, K.I.; Wiel, M.A. Effects of dependence in high-dimensional multiple testing problems. BMC Bioinform. 2008, 9, 114. [Google Scholar] [CrossRef]
- Chen, J.; Bardes, E.E.; Aronow, B.J.; Jegga, A.G. ToppGene Suite for gene list enrichment analysis and candidate gene prioritization. Nucleic Acids Res. 2009, 37, 305–311. [Google Scholar] [CrossRef] [PubMed]
- Aoki-Kinoshita, K.F.; Kanehisa, M. Gene annotation and pathway mapping in KEGG. Methods Mol. Biol. 2007, 396, 71–91. [Google Scholar] [CrossRef]
- Schaefer, C.F.; Anthony, K.; Krupa, S.; Buchoff, J.; Day, M.; Hannay, T.; Buetow, K.H. PID: The Pathway Interaction Database. Nucleic Acids Res. 2009, 37, 674–679. [Google Scholar] [CrossRef]
- Croft, D.; O’Kelly, G.; Wu, G.; Haw, R.; Gillespie, M.; Matthews, L.; Caudy, M.; Garapati, P.; Gopinath, G.; Jassal, B.; et al. Reactome: A database of reactions, pathways and biological processes. Nucleic Acids Res. 2011, 39, 691–697. [Google Scholar] [CrossRef]
- Liberzon, A.; Subramanian, A.; Pinchback, R.; Thorvaldsdóttir, H.; Tamayo, P.; Mesirov, J.P. Molecular signatures database (MSigDB) 3.0. Bioinformatics 2011, 27, 1739–1740. [Google Scholar] [CrossRef]
- Dahlquist, K.D.; Salomonis, N.; Vranizan, K.; Lawlor, S.C.; Conklin, B.R. GenMAPP, a new tool for viewing and analyzing microarray data on biological pathways. Nat. Genet. 2002, 31, 19–20. [Google Scholar] [CrossRef] [Green Version]
- Petri, V.; Jayaraman, P.; Tutaj, M.; Hayman, G.T.; Smith, J.R.; De Pons, J.; Laulederkind, S.J.; Lowry, T.F.; Nigam, R.; Wang, S.J.; et al. The pathway ontology - updates and applications. J. Biomed. Semantics. 2014, 5, 7. [Google Scholar] [CrossRef]
- Mi, H.; Muruganujan, A.; Thomas, P.D. PANTHER in 2013: Modeling the evolution of gene function, and other gene attributes, in the context of phylogenetic trees. Nucleic Acids Res. 2013, 41, 377–386. [Google Scholar] [CrossRef]
- Harris, M.A.; Clark, J.; Ireland, A.; Lomax, J.; Ashburner, M.; Foulger, R.; Eilbeck, K.; Lewis, S.; Marshall, B.; Mungall, C.; et al. The Gene Ontology (GO) database and informatics resource. Nucleic Acids Res. 2004, 32, 258–261. [Google Scholar] [CrossRef]
- Alfarano, C.; Andrade, C.E.; Anthony, K.; Bahroos, N.; Bajec, M.; Bantoft, K.; Betel, D.; Bobechko, B.; Boutilier, K.; Burgess, E.; et al. The Biomolecular Interaction Network Database and related tools 2005 update. Nucleic Acids Res. 2005, 33, 418–424. [Google Scholar] [CrossRef]
- Keshava Prasad, T.S.; Goel, R.; Kandasamy, K.; Keerthikumar, S.; Kumar, S.; Mathivanan, S.; Telikicherla, D.; Raju, R.; Shafreen, B.; Venugopal, A.; et al. Human Protein Reference Database--2009 update. Nucleic Acids Res. 2009, 37, 767–772. [Google Scholar] [CrossRef] [PubMed]
- Chatr-Aryamontri, A.; Oughtred, R.; Boucher, L.; Rust, J.; Chang, C.; Kolas, N.K.; O’Donnell, L.; Oster, S.; Theesfeld, C.; Sellam, A.; et al. The BioGRID interaction database: 2017 update. Nucleic Acids Res. 2017, 45, D369–D379. [Google Scholar] [CrossRef]
- Giurgiu, M.; Reinhard, J.; Brauner, B.; Dunger-Kaltenbach, I.; Fobo, G.; Frishman, G.; Montrone, C.; Ruepp, A. CORUM: The comprehensive resource of mammalian protein complexes-2019. Nucleic Acids Res. 2019, 47, D559–D563. [Google Scholar] [CrossRef] [PubMed]
- Salwinski, L.; Miller, C.S.; Smith, A.J.; Pettit, F.K.; Bowie, J.U.; Eisenberg, D. The Database of Interacting Proteins: 2004 update. Nucleic Acids Res. 2004, 32, D449–D451. [Google Scholar] [CrossRef]
- Kerrien, S.; Aranda, B.; Breuza, L.; Bridge, A.; Broackes-Carter, F.; Chen, C.; Duesbury, M.; Dumousseau, M.; Feuermann, M.; Hinz, U.; et al. The IntAct molecular interaction database in 2012. Nucleic Acids Res. 2012, 40, D841–D846. [Google Scholar] [CrossRef]
- Licata, L.; Briganti, L.; Peluso, D.; Perfetto, L.; Iannuccelli, M.; Galeota, E.; Sacco, F.; Palma, A.; Nardozza, A.P.; Santonico, E.; et al. MINT, the molecular interaction database: 2012 update. Nucleic Acids Res. 2012, 40, D857–D861. [Google Scholar] [CrossRef]
- Güldener, U.; Münsterkötter, M.; Oesterheld, M.; Pagel, P.; Ruepp, A.; Mewes, H.W.; Stümpflen, V. MPact: The MIPS protein interaction resource on yeast. Nucleic Acids Res. 2006, 34, D436–D441. [Google Scholar] [CrossRef]
- Pagel, P.; Kovac, S.; Oesterheld, M.; Brauner, B.; Dunger-Kaltenbach, I.; Frishman, G.; Montrone, C.; Mark, P.; Stümpflen, V.; Mewes, H.W.; et al. The MIPS mammalian protein-protein interaction database. Bioinformatics 2005, 21, 832–834. [Google Scholar] [CrossRef]
- Brown, K.R.; Jurisica, I. Online predicted human interaction database. Bioinformatics 2005, 21, 2076–2082. [Google Scholar] [CrossRef] [PubMed]
- Razick, S.; Magklaras, G.; Donaldson, I.M. iRefIndex: A consolidated protein interaction database with provenance. BMC Bioinform. 2008, 9, 405. [Google Scholar] [CrossRef] [PubMed]
- Pritykin, Y.; Singh, M. Simple topological features reflect dynamics and modularity in protein interaction networks. PLoS Comput. Biol. 2013, 9, e1003243. [Google Scholar] [CrossRef] [PubMed]
- Kohl, M.; Wiese, S.; Warscheid, B. Cytoscape: Software for visualization and analysis of biological networks. Methods Mol. Biol. 2011, 696, 291–303. [Google Scholar] [CrossRef] [PubMed]
- Ning, K.; Ng, H.K.; Srihari, S.; Leong, H.W.; Nesvizhskii, A.I. Examination of the relationship between essential genes in PPI network and hub proteins in reverse nearest neighbor topology. BMC Bioinform. 2010, 11, 505. [Google Scholar] [CrossRef] [PubMed]
- Zaki, N.; Efimov, D.; Berengueres, J. Protein complex detection using interaction reliability assessment and weighted clustering coefficient. BMC Bioinform. 2013, 14, 163. [Google Scholar] [CrossRef]
- Fan, Y.; Siklenka, K.; Arora, S.K.; Ribeiro, P.; Kimmins, S.; Xia, J. miRNet - dissecting miRNA-target interactions and functional associations through network-based visual analysis. Nucleic Acids Res. 2016, 44, W135–W141. [Google Scholar] [CrossRef]
- Vlachos, I.S.; Paraskevopoulou, M.D.; Karagkouni, D.; Georgakilas, G.; Vergoulis, T.; Kanellos, I.; Anastasopoulos, I.L.; Maniou, S.; Karathanou, K.; Kalfakakou, D.; et al. DIANA-TarBase v7.0: Indexing more than half a million experimentally supported miRNA:mRNA interactions. Nucleic Acids Res. 2015, 43, D153–D159. [Google Scholar] [CrossRef]
- Chou, C.H.; Shrestha, S.; Yang, C.D.; Chang, N.W.; Lin, Y.L.; Liao, K.W.; Huang, W.C.; Sun, T.H.; Tu, S.J.; Lee, W.H.; et al. miRTarBase update 2018: A resource for experimentally validated microRNA-target interactions. Nucleic Acids Res. 2018, 46, D296–D302. [Google Scholar] [CrossRef]
- Xiao, F.; Zuo, Z.; Cai, G.; Kang, S.; Gao, X.; Li, T. miRecords: An integrated resource for microRNA-target interactions. Nucleic Acids Res. 2009, 37, D105–D110. [Google Scholar] [CrossRef]
- Jiang, Q.; Wang, Y.; Hao, Y.; Juan, L.; Teng, M.; Zhang, X.; Li, M.; Wang, G.; Liu, Y. miR2Disease: A manually curated database for microRNA deregulation in human disease. Nucleic Acids Res. 2009, 37, D98–D104. [Google Scholar] [CrossRef] [PubMed]
- Huang, Z.; Shi, J.; Gao, Y.; Cui, C.; Zhang, S.; Li, J.; Zhou, Y.; Cui, Q. HMDD v3.0: A database for experimentally supported human microRNA-disease associations. Nucleic Acids Res. 2019, 47, D1013–D1017. [Google Scholar] [CrossRef]
- Ruepp, A.; Kowarsch, A.; Schmidl, D.; Buggenthin, F.; Brauner, B.; Dunger, I.; Fobo, G.; Frishman, G.; Montrone, C.; Theis, F.J. PhenomiR: A knowledgebase for microRNA expression in diseases and biological processes. Genome Biol. 2010, 11, R6. [Google Scholar] [CrossRef]
- Liu, X.; Wang, S.; Meng, F.; Wang, J.; Zhang, Y.; Dai, E.; Yu, X.; Li, X.; Jiang, W. SM2miR: A database of the experimentally validated small molecules’ effects on microRNA expression. Bioinformatics 2013, 29, 409–411. [Google Scholar] [CrossRef]
- Rukov, J.L.; Wilentzik, R.; Jaffe, I.; Vinther, J.; Shomron, N. Pharmaco-miR: Linking microRNAs and drug effects. Brief. Bioinform. 2014, 15, 648–659. [Google Scholar] [CrossRef]
- Dai, E.; Yu, X.; Zhang, Y.; Meng, F.; Wang, S.; Liu, X.; Liu, D.; Wang, J.; Li, X.; Jiang, W. EpimiR: A database of curated mutual regulation between miRNAs and epigenetic modifications. Database (Oxf.) 2014, 2014, 23. [Google Scholar] [CrossRef]
- Li, J.H.; Liu, S.; Zhou, H.; Qu, L.H.; Yang, J.H. starBase v2.0: Decoding miRNA-ceRNA, miRNA-ncRNA and protein-RNA interaction networks from large-scale CLIP-Seq data. Nucleic Acids Res. 2014, 42, D92–D97. [Google Scholar] [CrossRef]
- Zhou, G.; Soufan, O.; Ewald, J.; Hancock, R.E.W.; Basu, N.; Xia, J. NetworkAnalyst 3.0: A visual analytics platform for comprehensive gene expression profiling and meta-analysis. Nucleic Acids Res. 2019. [Google Scholar] [CrossRef] [PubMed]
- Auerbach, R.K.; Chen, B.; Butte, A.J. Relating genes to function: Identifying enriched transcription factors using the ENCODE ChIP-Seq significance tool. Bioinformatics 2013, 29, 1922–1924. [Google Scholar] [CrossRef] [PubMed]
- Tang, Z.; Li, C.; Kang, B.; Gao, G.; Li, C.; Zhang, Z. GEPIA: A web server for cancer and normal gene expression profiling and interactive analyses. Nucleic Acids Res. 2017, 45, W98–W102. [Google Scholar] [CrossRef]
- Gao, J.; Aksoy, B.A.; Dogrusoz, U.; Dresdner, G.; Gross, B.; Sumer, S.O.; Sun, Y.; Jacobsen, A.; Sinha, R.; Larsson, E.; et al. Integrative analysis of complex cancer genomics and clinical profiles using the cBioPortal. Sci. Signal. 2013, 6, l1. [Google Scholar] [CrossRef]
- Yook, S.H.; Oltvai, Z.N.; Barabási, A.L. Functional and topological characterization of protein interaction networks. Proteomics 2004, 4, 928–942. [Google Scholar] [CrossRef]
- Girvan, M.; Newman, M.E. Community structure in social and biological networks. Proc. Natl. Acad. Sci. USA 2002, 99, 7821–7826. [Google Scholar] [CrossRef] [PubMed] [Green Version]
- Deng, Y.; Jiang, Y.H.; Yang, Y.; He, Z.; Luo, F.; Zhou, J. Molecular ecological network analyses. BMC Bioinform. 2012, 13, 113. [Google Scholar] [CrossRef]
- Koschützki, D.; Schreiber, F. Centrality analysis methods for biological networks and their application to gene regulatory networks. Gene. Regul. Syst. Bio. 2008, 2, 193–201. [Google Scholar] [CrossRef]
- Barrat, A.; Barthélemy, M.; Pastor-Satorras, R.; Vespignani, A. The architecture of complex weighted networks. Proc. Natl. Acad. Sci. USA 2004, 101, 3747–3752. [Google Scholar] [CrossRef] [Green Version]
- Baer, C.; Claus, R.; Plass, C. Genome-wide epigenetic regulation of miRNAs in cancer. Cancer Res. 2013, 73, 473–477. [Google Scholar] [CrossRef]
- Yang, J.Y.; Hung, M.C. A new fork for clinical application: Targeting forkhead transcription factors in cancer. Clin. Cancer Res. 2009, 15, 752–757. [Google Scholar] [CrossRef] [PubMed]
- Sugawa, N.; Ekstrand, A.J.; James, C.D.; Collins, V.P. Identical splicing of aberrant epidermal growth factor receptor transcripts from amplified rearranged genes in human glioblastomas. Proc. Natl. Acad. Sci. USA 1990, 87, 8602–8606. [Google Scholar] [CrossRef] [PubMed]
- Lang, F.F.; Miller, D.C.; Koslow, M.; Newcomb, E.W. Pathways leading to glioblastoma multiforme: A molecular analysis of genetic alterations in 65 astrocytic tumors. J. Neurosurg. 1994, 81, 427–436. [Google Scholar] [CrossRef]
- Matsumoto, T.; Kawashima, Y.; Nagashio, R.; Kageyama, T.; Kodera, Y.; Jiang, S.X.; Okayasu, I.; Kameya, T.; Sato, Y. A new possible lung cancer marker: VGF detection from the conditioned medium of pulmonary large cell neuroendocrine carcinoma-derived cells using secretome analysis. Int. J. Biol. Markers 2009, 24, 282–285. [Google Scholar] [CrossRef]
- Flanagan, J.; Healey, S.; Young, J.; Whitehall, V.; Chenevix-Trench, G. Analysis of the transcription regulator, CNOT7, as a candidate chromosome 8 tumor suppressor gene in colorectal cancer. Int. J. Cancer 2003, 106, 505–509. [Google Scholar] [CrossRef]
- Kanda, M.; Shimizu, D.; Tanaka, H.; Tanaka, C.; Kobayashi, D.; Hayashi, M.; Takami, H.; Niwa, Y.; Yamada, S.; Fujii, T.; et al. Synaptotagmin XIII expression and peritoneal metastasis in gastric cancer. Br. J. Surg. 2018, 105, 1349–1358. [Google Scholar] [CrossRef] [PubMed]
- Hu, T.; Lu, Y.R. BCYRN1, a c-MYC-activated long non-coding RNA, regulates cell metastasis of non-small-cell lung cancer. Cancer Cell Int. 2015, 15, 36. [Google Scholar] [CrossRef]
- Calcagno, D.Q.; Takeno, S.S.; Gigek, C.O.; Leal, M.F.; Wisnieski, F.; Chen, E.S.; Araújo, T.M.; Lima, E.M.; Melaragno, M.I.; Demachki, S.; et al. Identification of IL11RA and MELK amplification in gastric cancer by comprehensive genomic profiling of gastric cancer cell lines. World J. Gastroenterol. 2016, 22, 9506–9514. [Google Scholar] [CrossRef]
- Cai, D.; Cao, J.; Li, Z.; Zheng, X.; Yao, Y.; Li, W.; Yuan, Z. Up-regulation of bone marrow stromal protein 2 (BST2) in breast cancer with bone metastasis. BMC Cancer 2009, 9, 102. [Google Scholar] [CrossRef]
- Sun, W.; Fujimoto, J.; Tamaya, T. Coexpression of Gas6/Axl in human ovarian cancers. Oncology 2004, 66, 450–457. [Google Scholar] [CrossRef] [PubMed]
- Lin, W.C.; Chen, L.H.; Hsieh, Y.C.; Yang, P.W.; Lai, L.C.; Chuang, E.Y.; Lee, J.M.; Tsai, M.H. miR-338-5p inhibits cell proliferation, colony formation, migration, and cisplatin resistance in esophageal squamous cancer cells by targeting FERMT2. Carcinogenesis 2018. [Google Scholar] [CrossRef]
- Wu, Y.; Yu, H.; Zheng, S.L.; Feng, B.; Kapron, A.L.; Na, R.; Boyle, J.L.; Shah, S.; Shi, Z.; Ewing, C.M.; et al. Germline mutations in PPFIBP2 are associated with lethal prostate cancer. Prostate 2018, 78, 1222–1228. [Google Scholar] [CrossRef]
- Nakamura, M.; Ishida, E.; Shimada, K.; Nakase, H.; Sakaki, T.; Konishi, N. Frequent HRK inactivation associated with low apoptotic index in secondary glioblastomas. Acta Neuropathol. 2005, 110, 402–410. [Google Scholar] [CrossRef] [PubMed]
- Sica, G.; Lama, G.; Anile, C.; Geloso, M.C.; La Torre, G.; De Bonis, P.; Maira, G.; Lauriola, L.; Jhanwar-Uniyal, M.; Mangiola, A. Assessment of angiogenesis by CD105 and nestin expression in peritumor tissue of glioblastoma. Int. J. Oncol. 2011, 38, 41–49. [Google Scholar] [CrossRef] [PubMed]
- Teller, A.; Jechorek, D.; Hartig, R.; Adolf, D.; Reißig, K.; Roessner, A.; Franke, S. Dysregulation of apoptotic signaling pathways by interaction of RPLP0 and cathepsin X/Z in gastric cancer. Pathol. Res. Pract. 2015, 211, 62–70. [Google Scholar] [CrossRef]
- Quigley, D.A.; Fiorito, E.; Nord, S.; Van Loo, P.; Alnæs, G.G.; Fleischer, T.; Tost, J.; Moen Vollan, H.K.; Tramm, T.; Overgaard, J.; et al. The 5p12 breast cancer susceptibility locus affects MRPS30 expression in estrogen-receptor positive tumors. Mol. Oncol. 2014, 8, 273–284. [Google Scholar] [CrossRef] [PubMed]
- Zhang, W.; Tong, D.; Liu, F.; Li, D.; Li, J.; Cheng, X.; Wang, Z. RPS7 inhibits colorectal cancer growth via decreasing HIF-1α-mediated glycolysis. Oncotarget 2016, 7, 5800–5814. [Google Scholar] [CrossRef]
- Yu, M.J.; Zhao, N.; Shen, H.; Wang, H. Long Noncoding RNA MRPL39 Inhibits Gastric Cancer Proliferation and Progression by Directly Targeting miR-130. Genet. Test. Mol. Biomarkers 2018, 22, 656–663. [Google Scholar] [CrossRef]
- Gao, Y.; Li, F.; Zhou, H.; Yang, Y.; Wu, R.; Chen, Y.; Li, W.; Li, Y.; Xu, X.; Ke, C.; et al. Down-regulation of MRPS23 inhibits rat breast cancer proliferation and metastasis. Oncotarget 2017, 8, 71772–71781. [Google Scholar] [CrossRef]
- Dey, P.; Baddour, J.; Muller, F.; Wu, C.C.; Wang, H.; Liao, W.T.; Lan, Z.; Chen, A.; Gutschner, T.; Kang, Y.; et al. Genomic deletion of malic enzyme 2 confers collateral lethality in pancreatic cancer. Nature 2017, 542, 119–123. [Google Scholar] [CrossRef]
- Li, L.D.; Sun, H.F.; Liu, X.X.; Gao, S.P.; Jiang, H.L.; Hu, X.; Jin, W. Down-Regulation of NDUFB9 Promotes Breast Cancer Cell Proliferation, Metastasis by Mediating Mitochondrial Metabolism. PLoS ONE 2015, 10, e0144441. [Google Scholar] [CrossRef]
- Wang, Y.; Sui, J.; Li, X.; Cao, F.; He, J.; Yang, B.; Zhu, X.; Sun, Y.; Pu, Y.D. RPS24 knockdown inhibits colorectal cancer cell migration and proliferation in vitro. Gene 2015, 571, 286–291. [Google Scholar] [CrossRef]
- Shriver, S.P.; Shriver, M.D.; Tirpak, D.L.; Bloch, L.M.; Hunt, J.D.; Ferrell, R.E.; Siegfried, J.M. Trinucleotide repeat length variation in the human ribosomal protein L14 gene (RPL14): Localization to 3p21.3 and loss of heterozygosity in lung and oral cancers. Mutat. Res. 1998, 406, 9–23. [Google Scholar] [CrossRef]
- Ji, P.; Wang, L.; Liu, J.; Mao, P.; Li, R.; Jiang, H.; Lou, M.; Xu, M.; Yu, X. Knockdown of RPL34 inhibits the proliferation and migration of glioma cells through the inactivation of JAK/STAT3 signaling pathway. J. Cell Biochem. 2019, 120, 3259–3267. [Google Scholar] [CrossRef]
- Jandial, R.; Neman, J.; Lim, P.P.; Tamae, D.; Kowolik, C.M.; Wuenschell, G.E.; Shuck, S.C.; Ciminera, A.K.; De Jesus, L.R.; Ouyang, C.; et al. Inhibition of GLO1 in Glioblastoma Multiforme Increases DNA-AGEs, Stimulates RAGE Expression, and Inhibits Brain Tumor Growth in Orthotopic Mouse Models. Int. J. Mol. Sci. 2018, 19, 406. [Google Scholar] [CrossRef]
- Li, J.; Zhu, S.; Tong, J.; Hao, H.; Yang, J.; Liu, Z.; Wang, Y. Suppression of lactate dehydrogenase A compromises tumor progression by downregulation of the Warburg effect in glioblastoma. Neuroreport 2016, 27, 110–115. [Google Scholar] [CrossRef] [Green Version]
- Hu, T.; Xi, J. Identification of COX5B as a novel biomarker in high-grade glioma patients. Onco Targets Ther. 2017, 10, 5463–5470. [Google Scholar] [CrossRef]
- Zhang, L.; Huang, S.T.; Feng, Y.L.; Wan, T.; Gu, H.F.; Xu, J.; Yuan, L.J.; Zhou, Y.; Yu, X.J.; Huang, L.; et al. The Bidirectional Regulation between MYL5 and HIF-1α Promotes Cervical Carcinoma Metastasis. Theranostics 2017, 7, 3768–3780. [Google Scholar] [CrossRef]
- Elsheikh, S.E.; Green, A.R.; Rakha, E.A.; Samaka, R.M.; Ammar, A.A.; Powe, D.; Reis-Filho, J.S.; Ellis, I.O. Caveolin 1 and Caveolin 2 are associated with breast cancer basal-like and triple-negative immunophenotype. Br. J. Cancer 2008, 99, 327–334. [Google Scholar] [CrossRef] [Green Version]
- Wu, X.; Liu, T.; Fang, O.; Leach, L.; Hu, X.; Luo, Z. miR-194 suppresses metastasis of non-small cell lung cancer through regulating expression of BMP1 and p27(kip1). Oncogene 2014, 33, 1506–1514. [Google Scholar] [CrossRef] [PubMed]
- Liu, W.; Wei, H.; Gao, Z.; Chen, G.; Liu, Y.; Gao, X.; Bai, G.; He, S.; Liu, T.; Xu, W.; et al. COL5A1 may contribute the metastasis of lung adenocarcinoma. Gene 2018, 665, 57–66. [Google Scholar] [CrossRef] [PubMed]
- Kamikawaji, K.; Seki, N.; Watanabe, M.; Mataki, H.; Kumamoto, T.; Takagi, K.; Mizuno, K.; Inoue, H. Regulation of LOXL2 and SERPINH1 by antitumor microRNA-29a in lung cancer with idiopathic pulmonary fibrosis. J. Hum. Genet. 2016, 61, 985–993. [Google Scholar] [CrossRef] [PubMed]
- Kita, Y.; Mimori, K.; Tanaka, F.; Matsumoto, T.; Haraguchi, N.; Ishikawa, K.; Matsuzaki, S.; Fukuyoshi, Y.; Inoue, H.; Natsugoe, S.; et al. Clinical significance of LAMB3 and COL7A1 mRNA in esophageal squamous cell carcinoma. Eur. J. Surg. Oncol. 2009, 35, 52–58. [Google Scholar] [CrossRef]
- Zhao, Y.; Jia, L.; Mao, X.; Xu, H.; Wang, B.; Liu, Y. siRNA-targeted COL8A1 inhibits proliferation, reduces invasion and enhances sensitivity to D-limonence treatment in hepatocarcinoma cells. IUBMB Life 2009, 61, 74–79. [Google Scholar] [CrossRef]
- Miyake, M.; Hori, S.; Morizawa, Y.; Tatsumi, Y.; Toritsuka, M.; Ohnishi, S.; Shimada, K.; Furuya, H.; Khadka, V.S.; Deng, Y.; et al. Collagen type IV alpha 1 (COL4A1) and collagen type XIII alpha 1 (COL13A1) produced in cancer cells promote tumor budding at the invasion front in human urothelial carcinoma of the bladder. Oncotarget 2017, 8, 36099–36114. [Google Scholar] [CrossRef] [Green Version]
- Hu, L.; Duan, Y.T.; Li, J.F.; Su, L.P.; Yan, M.; Zhu, Z.G.; Liu, B.Y.; Yang, Q.M. Biglycan enhances gastric cancer invasion by activating FAK signaling pathway. Oncotarget 2014, 5, 1885–1896. [Google Scholar] [CrossRef]
- Jian, H.; Zhao, Y.; Liu, B.; Lu, S. SEMA4b inhibits MMP9 to prevent metastasis of non-small cell lung cancer. Tumour. Biol. 2014, 35, 11051–11056. [Google Scholar] [CrossRef] [PubMed]
- Lal, G.; Hashimi, S.; Smith, B.J.; Lynch, C.F.; Zhang, L.; Robinson, R.A.; Weigel, R.J. Extracellular matrix 1 (ECM1) expression is a novel prognostic marker for poor long-term survival in breast cancer: A Hospital-based Cohort Study in Iowa. Ann. Surg. Oncol. 2009, 16, 2280–2287. [Google Scholar] [CrossRef]
- Ghellal, A.; Li, C.; Hayes, M.; Byrne, G.; Bundred, N.; Kumar, S. Prognostic significance of TGF beta 1 and TGF beta 3 in human breast carcinoma. Anticancer Res. 2000, 20, 4413–4418. [Google Scholar] [PubMed]
- Endo, M.; Yamamoto, Y.; Nakano, M.; Masuda, T.; Odagiri, H.; Horiguchi, H.; Miyata, K.; Kadomatsu, T.; Motokawa, I.; Okada, S.; et al. Serum ANGPTL2 levels reflect clinical features of breast cancer patients: Implications for the pathogenesis of breast cancer metastasis. Int. J. Biol. Markers 2014, 29, e239–e245. [Google Scholar] [CrossRef]
- Pandey, P.; Kharbanda, S.; Kufe, D. Association of the DF3/MUC1 breast cancer antigen with Grb2 and the Sos/Ras exchange protein. Cancer Res. 1995, 55, 4000–4003. [Google Scholar]
- Cairns, J.; Ingle, J.N.; Wickerham, L.D.; Weinshilboum, R.; Liu, M.; Wang, L. SNPs near the cysteine proteinase cathepsin O gene (CTSO) determine tamoxifen sensitivity in ERα-positive breast cancer through regulation of BRCA1. PLoS Genet. 2017, 13, e1007031. [Google Scholar] [CrossRef] [PubMed]
- Cui, W.J.; Liu, Y.; Zhou, X.L.; Wang, F.Z.; Zhang, X.D.; Ye, L.H. Myosin light chain kinase is responsible for high proliferative ability of breast cancer cells via anti-apoptosis involving p38 pathway. Acta Pharmacol. Sin. 2010, 31, 725–732. [Google Scholar] [CrossRef] [Green Version]
- Li, J.; Ding, Y.; Li, A. Identification of COL1A1 and COL1A2 as candidate prognostic factors in gastric cancer. World J. Surg. Oncol. 2016, 14, 297. [Google Scholar] [CrossRef]
- Hamada, S.; Masamune, A.; Miura, S.; Satoh, K.; Shimosegawa, T. MiR-365 induces gemcitabine resistance in pancreatic cancer cells by targeting the adaptor protein SHC1 and pro-apoptotic regulator BAX. Cell Signal. 2014, 26, 179–185. [Google Scholar] [CrossRef]
- Wragg, J.W.; Finnity, J.P.; Anderson, J.A.; Ferguson, H.J.; Porfiri, E.; Bhatt, R.I.; Murray, P.G.; Heath, V.L.; Bicknell, R. MCAM and LAMA4 Are Highly Enriched in Tumor Blood Vessels of Renal Cell Carcinoma and Predict Patient Outcome. Cancer Res. 2016, 76, 2314–2326. [Google Scholar] [CrossRef]
- Bartolini, A.; Cardaci, S.; Lamba, S.; Oddo, D.; Marchiò, C.; Cassoni, P.; Amoreo, C.A.; Corti, G.; Testori, A.; Bussolino, F.; et al. BCAM and LAMA5 Mediate the Recognition between Tumor Cells and the Endothelium in the Metastatic Spreading of KRAS-Mutant Colorectal Cancer. Clin. Cancer Res. 2016, 22, 4923–4933. [Google Scholar] [CrossRef] [PubMed]
- Takeuchi, T.; Adachi, Y.; Nagayama, T. Expression of a secretory protein C1qTNF6, a C1qTNF family member, in hepatocellular carcinoma. Anal. Cell. Pathol. (Amst.) 2011, 34, 113–121. [Google Scholar] [CrossRef] [PubMed]
- Zeng, X.T.; Liu, X.P.; Liu, T.Z.; Wang, X.H. The clinical significance of COL5A2 in patients with bladder cancer: A retrospective analysis of bladder cancer gene expression data. Med. (Baltim.) 2018, 97, e0091. [Google Scholar] [CrossRef]
- Glait-Santar, C.; Benayahu, D. Regulation of SVEP1 gene expression by 17β-estradiol and TNFα in pre-osteoblastic and mammary adenocarcinoma cells. J. Steroid Biochem. Mol. Biol. 2012, 130, 36–44. [Google Scholar] [CrossRef] [PubMed]
- Renard, I.; Joniau, S.; Cleynenbreugel, B.; Collette, C.; Naômé, C.; Vlassenbroeck, I.; Nicolas, H.; Leval, J.; Straub, J.; Criekinge, W.; et al. Identification and validation of the methylated TWIST1 and NID2 genes through real-time methylation-specific polymerase chain reaction assays for the noninvasive detection of primary bladder cancer in urine samples. Eur. Urol. 2010, 58, 96–104. [Google Scholar] [CrossRef] [PubMed]
- Allione, A.; Pardini, B.; Viberti, C.; Giribaldi, G.; Turini, S.; Di Gaetano, C.; Guarrera, S.; Cordero, F.; Oderda, M.; Allasia, M.; et al. MMP23B expression and protein levels in blood and urine are associated with bladder cancer. Carcinogenesis 2018, 39, 1254–1263. [Google Scholar] [CrossRef] [PubMed]
- Shah, R.; Smith, P.; Purdie, C.; Quinlan, P.; Baker, L.; Aman, P.; Thompson, A.M.; Crook, T. The prolyl 3-hydroxylases P3H2 and P3H3 are novel targets for epigenetic silencing in breast cancer. Br. J. Cancer 2009, 100, 1687–1696. [Google Scholar] [CrossRef]
- Lo, P.H.; Tanikawa, C.; Katagiri, T.; Nakamura, Y.; Matsuda, K. Identification of novel epigenetically inactivated gene PAMR1 in breast carcinoma. Oncol. Rep. 2015, 33, 267–273. [Google Scholar] [CrossRef]
- Khaket, T.P.; Singh, M.P.; Khan, I.; Bhardwaj, M.; Kang, S.C. Targeting of cathepsin C induces autophagic dysregulation that directs ER stress mediated cellular cytotoxicity in colorectal cancer cells. Cell Signal. 2018, 46, 92–102. [Google Scholar] [CrossRef]
- Zhang, C.; Burger, M.C.; Jennewein, L.; Genßler, S.; Schönfeld, K.; Zeiner, P.; Hattingen, E.; Harter, P.N.; Mittelbronn, M.; Tonn, T.; et al. ERBB2/HER2-Specific NK Cells for Targeted Therapy of Glioblastoma. J. Natl. Cancer Inst. 2015, 108. [Google Scholar] [CrossRef] [PubMed]
- Szerlip, N.J.; Pedraza, A.; Chakravarty, D.; Azim, M.; McGuire, J.; Fang, Y.; Ozawa, T.; Holland, E.C.; Huse, J.T.; Jhanwar, S.; et al. Intratumoral heterogeneity of receptor tyrosine kinases EGFR and PDGFRA amplification in glioblastoma defines subpopulations with distinct growth factor response. Proc. Natl. Acad. Sci. USA 2012, 109, 3041–3046. [Google Scholar] [CrossRef] [Green Version]
- Plate, K.H.; Breier, G.; Farrell, C.L.; Risau, W. Platelet-derived growth factor receptor-beta is induced during tumor development and upregulated during tumor progression in endothelial cells in human gliomas. Lab. Investig. 1992, 67, 529–534. [Google Scholar]
- Feng, L.; Ma, J.; Ji, H.; Liu, Y.; Hu, W. miR-330-5p suppresses glioblastoma cell proliferation and invasiveness through targeting ITGA5. Biosci. Rep. 2017, 37. [Google Scholar] [CrossRef] [PubMed]
- Bleeker, F.E.; Lamba, S.; Zanon, C.; Tilborg, A.A.; Leenstra, S.; Troost, D.; Hulsebos, T.; Vandertop, W.P.; Bardelli, A. Absence of AKT1 mutations in glioblastoma. PLoS ONE 2009, 4, e5638. [Google Scholar] [CrossRef]
- Sun, S.; Wang, Y.; Wu, Y.; Gao, Y.; Li, Q.; Abdulrahman, A.A.; Liu, X.F.; Ji, G.Q.; Gao, J.; Li, L.; et al. Identification of COL1A1 as an invasion-related gene in malignant astrocytoma. Int. J. Oncol. 2018, 53, 2542–2554. [Google Scholar] [CrossRef]
- Fujita, A.; Sato, J.R.; Festa, F.; Gomes, L.R.; Oba-Shinjo, S.M.; Marie, S.K.; Ferreira, C.E.; Sogayar, M.C. Identification of COL6A1 as a differentially expressed gene in human astrocytomas. Genet. Mol. Res. 2008, 7, 371–378. [Google Scholar] [CrossRef] [PubMed]
- Kazuno, M.; Tokunaga, T.; Oshika, Y.; Tanaka, Y.; Tsugane, R.; Kijima, H.; Yamazaki, H.; Ueyama, Y.; Nakamura, M. Thrombospondin-2 (TSP2) expression is inversely correlated with vascularity in glioma. Eur. J. Cancer 1999, 35, 502–506. [Google Scholar] [CrossRef]
- Song, Y.; Zheng, S.; Wang, J.; Long, H.; Fang, L.; Wang, G.; Li, Z.; Que, T.; Liu, Y.; Li, Y.; et al. Hypoxia-induced PLOD2 promotes proliferation, migration and invasion via PI3K/Akt signaling in glioma. Oncotarget 2017, 8, 41947–41962. [Google Scholar] [CrossRef] [Green Version]
- Zhou, Y.; Jin, G.; Mi, R.; Zhang, J.; Zhang, J.; Xu, H.; Cheng, S.; Zhang, Y.; Song, W.; Liu, F. Knockdown of P4HA1 inhibits neovascularization via targeting glioma stem cell-endothelial cell transdifferentiation and disrupting vascular basement membrane. Oncotarget 2017, 8, 35877–35889. [Google Scholar] [CrossRef] [PubMed] [Green Version]
- Wagner, S.; Czub, S.; Greif, M.; Vince, G.H.; Süss, N.; Kerkau, S.; Rieckmann, P.; Roggendorf, W.; Roosen, K.; Tonn, J.C. Microglial/macrophage expression of interleukin 10 in human glioblastomas. Int. J. Cancer 1999, 82, 12–16. [Google Scholar] [CrossRef]
- Gagliano, N.; Moscheni, C.; Torri, C.; Magnani, I.; Bertelli, A.A.; Gioia, M. Effect of resveratrol on matrix metalloproteinase-2 (MMP-2) and Secreted Protein Acidic and Rich in Cysteine (SPARC) on human cultured glioblastoma cells. Biomed. Pharmacother. 2005, 59, 359–364. [Google Scholar] [CrossRef] [PubMed]
- Kast, R.E. The role of interleukin-18 in glioblastoma pathology implies therapeutic potential of two old drugs-disulfiram and ritonavir. Chin. J. Cancer 2015, 34, 161–165. [Google Scholar] [CrossRef] [PubMed]
- Tang, H.; Zhao, J.; Zhang, L.; Zhao, J.; Zhuang, Y.; Liang, P. SRPX2 Enhances the Epithelial-Mesenchymal Transition and Temozolomide Resistance in Glioblastoma Cells. Cell. Mol. Neurobiol. 2016, 36, 1067–1076. [Google Scholar] [CrossRef]
- Vakilian, A.; Khorramdelazad, H.; Heidari, P.; Sheikh Rezaei, Z.; Hassanshahi, G. CCL2/CCR2 signaling pathway in glioblastoma multiforme. Neurochem Int. 2017, 103, 1–7. [Google Scholar] [CrossRef]
- Yamashita, D.; Kondo, T.; Ohue, S.; Takahashi, H.; Ishikawa, M.; Matoba, R.; Suehiro, S.; Kohno, S.; Harada, H.; Tanaka, J.; et al. miR340 suppresses the stem-like cell function of glioma-initiating cells by targeting tissue plasminogen activator. Cancer Res. 2015, 75, 1123–1133. [Google Scholar] [CrossRef] [PubMed]
- Mishima, K.; Mazar, A.P.; Gown, A.; Skelly, M.; Ji, X.D.; Wang, X.D.; Jones, T.R.; Cavenee, W.K.; Huang, H.J. A peptide derived from the non-receptor-binding region of urokinase plasminogen activator inhibits glioblastoma growth and angiogenesis in vivo in combination with cisplatin. Proc. Natl. Acad. Sci. USA 2000, 97, 8484–8489. [Google Scholar] [CrossRef]
- Sciaccaluga, M.; Fioretti, B.; Catacuzzeno, L.; Pagani, F.; Bertollini, C.; Rosito, M.; Catalano, M.; D’Alessandro, G.; Santoro, A.; Cantore, G.; et al. CXCL12-induced glioblastoma cell migration requires intermediate conductance Ca2+-activated K+ channel activity. Am. J. Physiol. Cell Physiol. 2010, 299, C175–C184. [Google Scholar] [CrossRef] [PubMed]
- Majchrzak-Celińska, A.; Słocińska, M.; Barciszewska, A.M.; Nowak, S.; Baer-Dubowska, W. Wnt pathway antagonists, SFRP1, SFRP2, SOX17, and PPP2R2B, are methylated in gliomas and SFRP1 methylation predicts shorter survival. J. Appl. Genet. 2016, 57, 189–197. [Google Scholar] [CrossRef]
- Sie, M.; Wagemakers, M.; Molema, G.; Mooij, J.J.; Bont, E.S.; Dunnen, W.F. The angiopoietin 1/angiopoietin 2 balance as a prognostic marker in primary glioblastoma multiforme. J. Neurosurg. 2009, 110, 147–155. [Google Scholar] [CrossRef]
- Zeng, A.; Yin, J.; Wang, Z.; Zhang, C.; Li, R.; Zhang, Z.; Yan, W.; You, Y. miR-17-5p-CXCL14 axis related transcriptome profile and clinical outcome in diffuse gliomas. Oncoimmunology 2018, 7, e1510277. [Google Scholar] [CrossRef] [Green Version]
- Fu, J.; Yang, Q.Y.; Sai, K.; Chen, F.R.; Pang, J.C.; Ng, H.K.; Kwan, A.L.; Chen, Z.P. TGM2 inhibition attenuates ID1 expression in CD44-high glioma-initiating cells. Neuro Oncol. 2013, 15, 1353–1365. [Google Scholar] [CrossRef] [Green Version]
- Nie, E.; Miao, F.; Jin, X.; Wu, W.; Zhou, X.; ZENG, A.; Yu, T.; Zhi, T.; Shi, Z.; Wang, Y.; et al. Fstl1/DIP2A/MGMT signaling pathway plays important roles in temozolomide resistance in glioblastoma. Oncogene 2018. [Google Scholar] [CrossRef]
- Santosh, V.; Arivazhagan, A.; Sreekanthreddy, P.; Srinivasan, H.; Thota, B.; Srividya, M.R.; Vrinda, M.; Sridevi, S.; Shailaja, B.C.; Samuel, C.; et al. Grade-specific expression of insulin-like growth factor-binding proteins-2,-3, and -5 in astrocytomas: IGFBP-3 emerges as a strong predictor of survival in patients with newly diagnosed glioblastoma. Cancer Epidemiol. Biomarkers Prev. 2010, 19, 1399–1408. [Google Scholar] [CrossRef] [PubMed]
- Pen, A.; Moreno, M.J.; Durocher, Y.; Deb-Rinker, P.; Stanimirovic, D.B. Glioblastoma-secreted factors induce IGFBP7 and angiogenesis by modulating Smad-2-dependent TGF-beta signaling. Oncogene 2008, 27, 6834–6844. [Google Scholar] [CrossRef]
- Laczko, R.; Szauter, K.M.; Jansen, M.K.; Hollosi, P.; Muranyi, M.; Molnar, J.; Fong, K.S.; Hinek, A.; Csiszar, K. Active lysyl oxidase (LOX) correlates with focal adhesion kinase (FAK)/paxillin activation and migration in invasive astrocytes. Neuropathol. Appl. Neurobiol. 2007, 33, 631–643. [Google Scholar] [CrossRef] [PubMed]
- Wang, H.; Li, L.; Yin, L. Silencing LncRNA LOXL1-AS1 attenuates mesenchymal characteristics of glioblastoma via NF-κB pathway. Biochem. Biophys. Res. Commun. 2018, 500, 518–524. [Google Scholar] [CrossRef] [PubMed]
- Atala, A. eIF4E Phosphorylation Promotes Tumorigenesis and is Associated with Prostate Cancer Progression. J. Urol. 2011, 185, 1533. [Google Scholar] [CrossRef]
- Holmberg Olausson, K.; Elsir, T.; Moazemi Goudarzi, K.; Nistér, M.; Lindström, M.S. NPM1 histone chaperone is upregulated in glioblastoma to promote cell survival and maintain nucleolar shape. Sci. Rep. 2015, 5, 16495. [Google Scholar] [CrossRef]
- Kochanek, D.M.; Wells, D.G. CPEB1 regulates the expression of MTDH/AEG-1 and glioblastoma cell migration. Mol. Cancer Res. 2013, 11, 149–160. [Google Scholar] [CrossRef]
- Ni, X.G.; Zhou, L.; Wang, G.Q.; Liu, S.M.; Bai, X.F.; Liu, F.; Peppelenbosch, M.P.; Zhao, P. The ubiquitin-proteasome pathway mediates gelsolin protein downregulation in pancreatic cancer. Mol. Med. 2008, 14, 582–589. [Google Scholar] [CrossRef] [PubMed]
- Chiyomaru, T.; Enokida, H.; Tatarano, S.; Kawahara, K.; Uchida, Y.; Nishiyama, K.; Fujimura, L.; Kikkawa, N.; Seki, N.; Nakagawa, M. miR-145 and miR-133a function as tumour suppressors and directly regulate FSCN1 expression in bladder cancer. Br. J. Cancer 2010, 102, 883–891. [Google Scholar] [CrossRef] [Green Version]
- Chen, G.; Zhou, T.; Li, Y.; Yu, Z.; Sun, L. p53 target miR-29c-3p suppresses colon cancer cell invasion and migration through inhibition of PHLDB2. Biochem. Biophys. Res. Commun. 2017, 487, 90–95. [Google Scholar] [CrossRef]
- Chang, C.Y.; Lin, S.C.; Su, W.H.; Ho, C.M.; Jou, Y.S. Somatic LMCD1 mutations promoted cell migration and tumor metastasis in hepatocellular carcinoma. Oncogene 2012, 31, 2640–2652. [Google Scholar] [CrossRef]
- Raghu, H.; Lakka, S.S.; Gondi, C.S.; Mohanam, S.; Dinh, D.H.; Gujrati, M.; Rao, J.S. Suppression of uPA and uPAR attenuates angiogenin mediated angiogenesis in endothelial and glioblastoma cell lines. PLoS ONE 2010, 5, e12458. [Google Scholar] [CrossRef]
- Liu, Y.; Hu, H.; Wang, K.; Zhang, C.; Wang, Y.; Yao, K.; Yang, P.; Han, L.; Kang, C.; Zhang, W.; et al. Multidimensional analysis of gene expression reveals TGFB1I1-induced EMT contributes to malignant progression of astrocytomas. Oncotarget 2014, 5, 12593–12606. [Google Scholar] [CrossRef]
- Ren, S.; Xu, C.; Cui, Z.; Yu, Y.; Xu, W.; Wang, F.; Lu, J.; Wei, M.; Lu, X.; Gao, X.; et al. Oncogenic CUL4A determines the response to thalidomide treatment in prostate cancer. J. Mol. Med. (Berl.) 2012, 90, 1121–1132. [Google Scholar] [CrossRef]
- Li, B.; Chen, M.; Lu, M.; Xin-Xiang, J.; Meng-Xiong, P.; Jun-Wu, M. Glutaredoxin 3 promotes migration and invasion via the Notch signalling pathway in oral squamous cell carcinoma. Free Radic. Res. 2018, 52, 390–401. [Google Scholar] [CrossRef] [PubMed]
- Roessler, M.; Rollinger, W.; Mantovani-Endl, L.; Hagmann, M.L.; Palme, S.; Berndt, P.; Engel, A.M.; Pfeffer, M.; Karl, J.; Bodenmüller, H.; et al. Identification of PSME3 as a novel serum tumor marker for colorectal cancer by combining two-dimensional polyacrylamide gel electrophoresis with a strictly mass spectrometry-based approach for data analysis. Mol. Cell Proteomics 2006, 5, 2092–2101. [Google Scholar] [CrossRef]
- Li, G.; Li, M.; Liang, X.; Xiao, Z.; Zhang, P.; Shao, M.; Peng, F.; Chen, Y.; Li, Y.; Chen, Z. Identifying DCN and HSPD1 as Potential Biomarkers in Colon Cancer Using 2D-LC-MS/MS Combined with iTRAQ Technology. J. Cancer 2017, 8, 479–489. [Google Scholar] [CrossRef]
- Idbaih, A.; Paris, S.; Boisselier, B.; Marie, Y.; Sanson, M.; Thillet, J.; Hoang-Xuan, K.; Delattre, J.Y. Mutational analysis of RAC2 in gliomas. J. Neurooncol. 2008, 87, 365–366. [Google Scholar] [CrossRef]
- Gray, G.K.; McFarland, B.C.; Nozell, S.E.; Benveniste, E.N. NF-κB and STAT3 in glioblastoma: Therapeutic targets coming of age. Expert Rev. Neurother. 2014, 14, 1293–1306. [Google Scholar] [CrossRef] [PubMed]
- Golan-Gerstl, R.; Cohen, M.; Shilo, A.; Suh, S.S.; Bakàcs, A.; Coppola, L.; Karni, R. Splicing factor hnRNP A2/B1 regulates tumor suppressor gene splicing and is an oncogenic driver in glioblastoma. Cancer Res. 2011, 71, 4464–4472. [Google Scholar] [CrossRef]
- Kiviniemi, A.; Gardberg, M.; Kivinen, K.; Posti, J.P.; Vuorinen, V.; Sipilä, J.; Rahi, M.; Sankinen, M.; Minn, H. Somatostatin receptor 2A in gliomas: Association with oligodendrogliomas and favourable outcome. Oncotarget 2017, 8, 49123–49132. [Google Scholar] [CrossRef] [PubMed] [Green Version]
- Desotelle, J.; Truong, M.; Ewald, J.; Weeratunga, P.; Yang, B.; Huang, W.; Jarrard, D. CpG island hypermethylation frequently silences FILIP1L isoform 2 expression in prostate cancer. J. Urol. 2013, 189, 329–335. [Google Scholar] [CrossRef]
- Cha, Y.; Kim, D.K.; Hyun, J.; Kim, S.J.; Park, K.S. TCEA3 binds to TGF-beta receptor I and induces Smad-independent, JNK-dependent apoptosis in ovarian cancer cells. Cell Signal. 2013, 25, 1245–1251. [Google Scholar] [CrossRef]
- Hallal, S.; Russell, B.P.; Wei, H.; Lee, M.Y.T.; Toon, C.W.; Sy, J.; Shivalingam, B.; Buckland, M.E.; Kaufman, K.L. Extracellular Vesicles from Neurosurgical Aspirates Identifies Chaperonin Containing TCP1 Subunit 6A as a Potential Glioblastoma Biomarker with Prognostic Significance. Proteomics 2019, 19, e1800157. [Google Scholar] [CrossRef]
- Khor, G.H.; Froemming, G.R.; Zain, R.B.; Abraham, T.M.; Lin, T.K. Involvement of CELSR3 Hypermethylation in Primary Oral Squamous Cell Carcinoma. Asian Pac. J. Cancer Prev. 2016, 17, 219–223. [Google Scholar] [CrossRef]
- Sibin, M.K.; Harshitha, S.M.; Narasingarao, K.V.; Dhananjaya, I.B.; Dhaval, P.S.; Chetan, G.K. Effect of rs11614913 Polymorphism on Mature miR196a2 Expression and its Target Gene HOXC8 Expression in Human Glioma. J. Mol. Neurosci. 2017, 61, 144–151. [Google Scholar] [CrossRef]
- Alrfaei, B.M.; Vemuganti, R.; Kuo, J.S. microRNA-100 targets SMRT/NCOR2, reduces proliferation, and improves survival in glioblastoma animal models. PLoS ONE 2013, 8, e80865. [Google Scholar] [CrossRef]
- Ye, Y.; Tang, X.; Sun, Z.; Chen, S. Upregulated WDR26 serves as a scaffold to coordinate PI3K/AKT pathway-driven breast cancer cell growth, migration, and invasion. Oncotarget 2016, 7, 17854–17869. [Google Scholar] [CrossRef]
- Wang, X.; Wang, K.; Han, L.; Zhang, A.; Shi, Z.; Zhang, K.; Zhang, H.; Yang, S.; Pu, P.; Shen, C.; et al. PRDM1 is directly targeted by miR-30a-5p and modulates the Wnt/β-catenin pathway in a Dkk1-dependent manner during glioma growth. Cancer Lett. 2013, 331, 211–219. [Google Scholar] [CrossRef] [PubMed]
- Heravi-Moussavi, A.; Anglesio, M.S.; Cheng, S.W.; Senz, J.; Yang, W.; Prentice, L.; Fejes, A.P.; Chow, C.; Tone, A.; Kalloger, S.E.; et al. Recurrent somatic DICER1 mutations in nonepithelial ovarian cancers. N. Engl. J. Med. 2012, 366, 234–242. [Google Scholar] [CrossRef]
- Du, H.Q.; Wang, Y.; Jiang, Y.; Wang, C.H.; Zhou, T.; Liu, H.Y.; Xiao, H. Silencing of the TPM1 gene induces radioresistance of glioma U251 cells. Oncol. Rep. 2015, 33, 2807–2814. [Google Scholar] [CrossRef]
- Srivastava, C.; Irshad, K.; Dikshit, B.; Chattopadhyay, P.; Sarkar, C.; Gupta, D.K.; Sinha, S.; Chosdol, K. FAT1 modulates EMT and stemness genes expression in hypoxic glioblastoma. Int. J. Cancer 2018, 142, 805–812. [Google Scholar] [CrossRef] [PubMed]
- Hoelzinger, D.B.; Mariani, L.; Weis, J.; Woyke, T.; Berens, T.J.; McDonough, W.S.; Sloan, A.; Coons, S.W.; Berens, M.E. Gene expression profile of glioblastoma multiforme invasive phenotype points to new therapeutic targets. Neoplasia 2005, 7, 7–16. [Google Scholar] [CrossRef] [PubMed]
Figure 1.
Box plots of the gene expression data before (A) and after normalization (B). The horizontal axis represents the sample symbol and the vertical axis represents the gene expression values. The black line in the box plot represents the median value of gene expression. (A1, A2, A3 = scrambled shRNA expression samples; B1, B2, B3 = Lin7A knock down samples; C1, C2, C3 = Lin7A knock down complemented by wild type Lin7A samples).

Figure 2.
Volcano plot of differentially expressed genes. Genes with a significant change of more than two-fold were selected.
Figure 2.
Volcano plot of differentially expressed genes. Genes with a significant change of more than two-fold were selected.

Figure 3.
Heat map of up regulated differentially expressed genes. Legend on the top left indicates the log fold change of the genes. (A1, A2, A3 = scrambled shRNA expression samples; B1, B2, B3 = Lin7A knock down samples; C1, C2, C3 = Lin7A knock down complemented by wild type Lin7A samples).
Figure 3.
Heat map of up regulated differentially expressed genes. Legend on the top left indicates the log fold change of the genes. (A1, A2, A3 = scrambled shRNA expression samples; B1, B2, B3 = Lin7A knock down samples; C1, C2, C3 = Lin7A knock down complemented by wild type Lin7A samples).

Figure 4.
Heat map of down regulated differentially expressed genes. Legend on the top left indicates the log fold change of the genes. (A1, A2, A3 = scrambled shRNA expression samples; B1, B2, B3 = Lin7A knock down samples; C1, C2, C3 = Lin7A knock down complemented by wild type Lin7A samples).
Figure 4.
Heat map of down regulated differentially expressed genes. Legend on the top left indicates the log fold change of the genes. (A1, A2, A3 = scrambled shRNA expression samples; B1, B2, B3 = Lin7A knock down samples; C1, C2, C3 = Lin7A knock down complemented by wild type Lin7A samples).

Figure 5.
Protein–protein interaction network of differentially expressed genes (DEGs). Green nodes denotes up regulated genes.
Figure 5.
Protein–protein interaction network of differentially expressed genes (DEGs). Green nodes denotes up regulated genes.

Figure 6.
Protein–protein interaction network of differentially expressed genes (DEGs). Red nodes denotes down regulated genes.
Figure 6.
Protein–protein interaction network of differentially expressed genes (DEGs). Red nodes denotes down regulated genes.

Figure 7.
Node degree distribution (A—up regulated genes; B—down regulated genes).

Figure 8.
Regression diagrams for up regulated genes (A—betweenness centrality; B—stress centrality; C—closeness centrality; D—clustering coefficient).
Figure 8.
Regression diagrams for up regulated genes (A—betweenness centrality; B—stress centrality; C—closeness centrality; D—clustering coefficient).

Figure 9.
Regression diagrams for down regulated genes (A—betweenness centrality; B—stress centrality; C—closeness centrality; D—clustering coefficient).
Figure 9.
Regression diagrams for down regulated genes (A—betweenness centrality; B—stress centrality; C—closeness centrality; D—clustering coefficient).

Figure 10.
Modules in the protein-protein interaction (PPI) network. The green nodes denote the up-regulated genes.
Figure 10.
Modules in the protein-protein interaction (PPI) network. The green nodes denote the up-regulated genes.

Figure 11.
Modules in the PPI network. The red nodes denote the down-regulated genes.

Figure 12.
The network of up-regulated DEGs and their related miRNAs. The green circles nodes are the up-regulated DEGs, and purple diamond nodes are the miRNAs.
Figure 12.
The network of up-regulated DEGs and their related miRNAs. The green circles nodes are the up-regulated DEGs, and purple diamond nodes are the miRNAs.

Figure 13.
The network of down-regulated DEGs and their related miRNAs. The red circle nodes are the down-regulated DEGs, and blue diamond nodes are the miRNAs.
Figure 13.
The network of down-regulated DEGs and their related miRNAs. The red circle nodes are the down-regulated DEGs, and blue diamond nodes are the miRNAs.

Figure 14.
Transcription factor (TF)-gene network of predicted target up regulated genes. (Blue triangle—TFs and green circles—target up regulated genes).
Figure 14.
Transcription factor (TF)-gene network of predicted target up regulated genes. (Blue triangle—TFs and green circles—target up regulated genes).

Figure 15.
TF-gene network of predicted target down regulated genes. (Blue triangle—TFs and red circles—target down regulated genes).
Figure 15.
TF-gene network of predicted target down regulated genes. (Blue triangle—TFs and red circles—target down regulated genes).

Figure 16.
Kaplan-Meier survival curves using The Cancer Genome Atlas TCGA database validate the prognostic value of genes expressed in glioblastoma (blue—low risk; red—high risk).
Figure 16.
Kaplan-Meier survival curves using The Cancer Genome Atlas TCGA database validate the prognostic value of genes expressed in glioblastoma (blue—low risk; red—high risk).

Figure 17.
High expression levels of selected genes in glioblastoma multiform (GBM) using TCGA database.
Figure 17.
High expression levels of selected genes in glioblastoma multiform (GBM) using TCGA database.

Figure 18.
Low expression levels of selected gene in GBM using TCGA database.

Figure 19.
Mutation analysis (genetic mutation towards these ten hub genes).

© 2019 by the authors. Licensee MDPI, Basel, Switzerland. This article is an open access article distributed under the terms and conditions of the Creative Commons Attribution (CC BY) license (http://creativecommons.org/licenses/by/4.0/).
Share and Cite
MDPI and ACS Style
Alshabi, A.M.; Vastrad, B.; Shaikh, I.A.; Vastrad, C. Identification of Crucial Candidate Genes and Pathways in Glioblastoma Multiform by Bioinformatics Analysis. Biomolecules 2019, 9, 201. https://doi.org/10.3390/biom9050201
AMA Style
Alshabi AM, Vastrad B, Shaikh IA, Vastrad C. Identification of Crucial Candidate Genes and Pathways in Glioblastoma Multiform by Bioinformatics Analysis. Biomolecules. 2019; 9(5):201. https://doi.org/10.3390/biom9050201
Chicago/Turabian StyleAlshabi, Ali Mohamed, Basavaraj Vastrad, Ibrahim Ahmed Shaikh, and Chanabasayya Vastrad. 2019. "Identification of Crucial Candidate Genes and Pathways in Glioblastoma Multiform by Bioinformatics Analysis" Biomolecules 9, no. 5: 201. https://doi.org/10.3390/biom9050201
Note that from the first issue of 2016, this journal uses article numbers instead of page numbers. See further details here.