
Plant Uptake of Lactate-Bound Metals: A Sustainable Alternative to Metal Chlorides
by
 ,
,
Lee J. Opdahl
1, 
Ricky W. Lewis
2,
Lee A. Kalcsits
3,
Tarah S. Sullivan
1,* and
Karen A. Sanguinet
1,* 1
Department of Crop and Soil Sciences, Washington State University, Pullman, WA 99164, USA
2
Department of Tropical Plant and Soil Sciences, University of Hawai’i at Mānoa, Honolulu, HI 96822, USA
3
Tree Fruit Research and Extension Center, Washington State University, Wenatchee, WA 98801, USA
*
Authors to whom correspondence should be addressed.
Biomolecules 2021, 11(8), 1085; https://doi.org/10.3390/biom11081085
Submission received: 28 May 2021
/
Revised: 17 July 2021
/
Accepted: 21 July 2021
/
Published: 23 July 2021
(This article belongs to the Special Issue Recent Advances and Applications of Biostimulants for Plant Growth Promotion and Environmental Stress Adaptation)
Abstract
:Global agricultural intensification has prompted investigations into biostimulants to enhance plant nutrition and soil ecosystem processes. Metal lactates are an understudied class of organic micronutrient supplement that provide both a labile carbon source and mineral nutrition for plant and microbial growth. To gain a fundamental understanding of plant responses to metal lactates, we employed a series of sterile culture-vessel experiments to compare the uptake and toxicity of five metals (Zn, Mn, Cu, Ni, and Co) supplied in lactate and chloride salt form. Additionally, primary root growth in plate-grown Arabidopsis thaliana seedlings was used to determine optimal concentrations of each metal lactate. Our results suggest that uptake and utilization of metals in wheat (Triticum aestivum L.) when supplied in lactate form is comparable to that of metal chlorides. Metal lactates also have promotional growth effects on A. thaliana seedlings with optimal concentrations identified for Zn (0.5–1.0 µM), Mn (0.5–1.0 µM), Cu (0.5 µM), Ni (1.0 µM), and Co (0.5 µM) lactate. These findings present foundational evidence to support the use of metal lactates as potential crop biostimulants due to their ability to both supply nutrients and stimulate plant growth.
Keywords:
metal lactates; hydroponics; micronutrients; biostimulants; organic acids; wheat; A. thaliana1. Introduction
Agricultural intensification to meet growing global food demand has prompted investigations into sustainable management practices, including alternative fertilization and application of biostimulants to enhance both crop growth and soil health, particularly in the face of global climate change [1,2,3,4]. In conventional agriculture, fertilization is largely focused on the three macronutrients nitrogen (N), phosphorus (P) and potassium (K), which has led to soil acidification and soils that are deficient in a range of micronutrients [5,6]. Micronutrients are essential for plant growth and development and often function as enzyme cofactors [7]. Micronutrient fertilizers are typically supplied in inorganic forms, such as chlorides or sulfate salts, to ameliorate deficiencies, but it is often unclear how such fertilizers impact additional processes within the soil ecosystem (e.g., microbial activity). While inorganic nutrients are rapidly available for plant uptake, they do not provide the additional benefits provided by organic fertilizers (e.g., green and livestock manure) through increased carbon (C) inputs. These valuable organic inputs from soil additions rich in a variety of C compounds have proven benefits such as increased overall soil health, soil water holding capacity, cation exchange capacity (CEC), aggregation and infiltration, pH stabilization, and enhanced microbial activities [8,9,10,11].
Organic amendments generally require microbial degradation to release nutrients into the soil solution for plant uptake, which is a relatively slow process, and the benefits are only realized long-term (a year, to several years past the current growing season). Thus, conventional chemical fertilizers are still required to obtain optimal yields [12,13]. A plausible alternative may be to supply micronutrients chelated to labile C compounds that can be rapidly metabolized by soil microbes and released into soil solution, thus stimulating microbial activity and providing readily available elements for plant nutrition. Furthermore, several studies have proven the ability of plant roots to directly take up small organic molecules such as low molecular weight organic acids (LMWOA), sugars, or amino acids, indicating that organic fertilizers of this nature could represent a direct source of nutrients for plant uptake [14,15,16,17,18].
When extracellular metal concentrations are high, they are preferentially accumulated in the roots or translocated to aerial tissues via xylem; the tendency to accumulate in the roots or shoots is primarily dependent on the specific metal and plant species [7]. For example, Cu is preferentially accumulated in the roots when external Cu concentrations are high, and thus plants under Cu toxicity usually exhibit reduced root growth [19]. However, high external Mn concentrations may manifest stress symptoms in aboveground tissues due to preferential accumulation of Mn in the shoots and leaves [7]. Thus, achieving the balance between micronutrient deficiency and toxicity is crucial to support optimal plant growth.
Metal lactates are an understudied class of organic micronutrient supplement that show potential to supply micronutrients and trace metals directly for plant uptake, in addition to providing a labile C source for soil and rhizosphere microbial populations. Previous work has shown lactic acid addition to soil enhances microbial activity [20,21], while foliar applications of lactic acid in hydroponically grown cucumber improves shoot development and yield [22,23]. In fact, lactic acid showed the greatest potential to enhance soil microbial activity in comparison to other LMWOA [20,24]. Lactic acid and lactate-conjugated metals are a common additive to vitamin supplements and widely used for food science applications [25]. However, little is known about the capacity of crops to uptake and translocate metals bound to lactate. In Arabidopsis thaliana, there are nine nodulin 26 intrinsic proteins (NIPs) that are highly conserved water and solute transport proteins. One of them, NIP2;1, was identified as a lactate transporter in roots induced particularly during periods of hypoxia and likely functioning in efflux [26]. Additionally, Zn/Fe permeases (ZIPs), heavy metal ATPases (HMAs), and Yellow Stripe Like (YSL) transporters, all have shown the ability to transport a range of metals [27,28,29].
The influence of lactate complexation on metal uptake and toxicity was assessed using five metals (Zn, Mn, Cu, Ni, and Co). The metals were supplied at toxic levels as either a lactate or a chloride salt form in aseptic hydroponic culture vessels, which allowed for comparison of the two forms of metals in the absence of microbial activity. Importantly, both metal chlorides and metal lactates have similar stability constants, making them suitable forms to compare on a chemical level [30,31,32]. The uptake capacity and subsequent toxicity of metal lactates was compared with that of metal chlorides to investigate the importance of plant uptake of the organic ligand-bound metals. Zn, Mn, Cu, Ni, and Co concentrations were measured in root and shoot tissues using MP-AES to validate uptake of each metal. To further investigate optimal metal lactate concentrations for plant growth, we generated dose−response curves for individual metal lactates by quantifying primary root growth rates in A. thaliana grown in a range of concentrations that more closely reflect physiologically relevant micronutrient levels according to previous reports [33].
2. Materials and Methods
2.1. Wheat Seed Sterilization and Pre-Germination
Wheat seedlings were cultivated under aseptic conditions, starting with seed sterilization prior to sewing in sterile culture vessels, and using sterile nutrient solutions. ”Louise” (Triticum aestivum L.) wheat seeds were chosen for this study due to the importance of this variety in the state of Washington [34]. Seeds were surface sterilized through a series of rinse steps adapted from Speakman and Kruger (1983) [35]. Briefly, 35 seeds were placed into 50 mL conical tubes and immersed in 40 mL of a 0.001% terramycin (CAS: 2058-46-0, Alfa Aesar, Haverhill, MA, USA) solution with 60 µL of 50% Tween 20 (23336-0010, Acros Organics, Fair Lawn, MA, USA) for 20 h at room temperature in the dark. Then, seeds were immersed in 40 mL of a 0.1% AgNO3 (CAS: 7761-88-8, Alfa Aesar, Haverhill, MA, USA) solution with 0.84 mL of 50% Tween 20 for 10 min. The AgNO3 solution was decanted and seeds were immersed in 40 mL of a 0.5% NaCl solution with 0.84 mL of 50% Tween 20 for 30 s. Seeds were rinsed five times with 40 mL of sterile Milli-Q (Milli-Q Advantage A10 System, Millipore Sigma, Burlington, MA, USA) water. After this sterilization procedure, seeds were placed on sterile Phytagel plates (0.4% Phytagel: P8169-250G, Sigma Life Science, St. Louis, MO, USA; 0.036% MgSO4: M63-500, Fischer Scientific; 0.018% CaCl2 dihydrate: C79-500, Alfa Aesar, Haverhill, MA, USA) and stored in the dark, at room temperature (~23 °C) for three days. After three days, pre-germinated seedlings were inspected for microbial contaminants, and only non-contaminated seedlings of approximately equivalent developmental stage were used in the study.
2.2. Wheat Cultivation Vessels and Media
To remove any possible residual and trace metals from experimental materials, all culture vessels, glass beads, and polypropylene pellets were acid-washed in a 100 mM HNO3 and HCl solution for a minimum of two hours and subsequently rinsed with ultrapure Milli-Q water eight times. Sterilized and pre-germinated wheat seedlings were grown for 13 days in 946 mL glass culture vessels (Phyto Technology Laboratories #C607, Lenexa, KS, USA) with vented screw caps (0.5 µm pore size; Phyto Technology Laboratories #C2055, Lenexa, KS, USA) to allow for gas exchange (Figure S1). Within each culture vessel, 250 g of 6 mm diameter glass beads were added and used as the physical plant growth support matrix. MilliQ water was then added according to volumes shown in Table S1, and each culture vessel was sterilized under 15 PSI at 121 °C for 30 min. A 0.25× modified Hoagland’s nutrient solution (pH 5.9) described in Table S2 was added to each culture vessel in the volumes indicated in Table S1 [36]. Metals and nutrients that were added as a part of the experimental design in the form of either lactate or chloride treatments that would normally be included in a complete Hoagland’s nutrient solution (i.e., Zn, Cu, and Mn), were excluded from the Hoagland’s solution for that treatment. A 0.229 M stock solution of each metal lactate (Zn, Cu, Mn, Ni, and Co lactate) and metal chloride (Zn, Cu, Mn, Ni, and Co chloride) was prepared. Metal chloride solutions were sterilized by autoclaving at 15 PSI, 121 °C for 30 min, while the metal lactate solutions were filter sterilized (Millipore Sigma #SCVPU11RE, Burlington, MA, USA; 0.1 µm pore size). Metal lactate and metal chloride solutions were each added in the volumes shown in Table S1 to bring total solution volumes in each vessel to 50 mL to create the final treatment concentrations also shown in Table S1. The treatment concentrations used in this study were chosen to reflect concentrations that are several orders of magnitude higher than the original concentration of Mn, Cu, and Zn in Hoagland’s nutrient solution. Since Co and Ni are not included in a complete Hoagland’s nutrient solution, the same concentrations were used across all treatments. Control culture vessels did not receive the metal added via metal lactate and metal chloride treatments.
Following the nutrient solution preparation, each sterile wheat seedling was carefully placed into the glass beads, and the surface of the glass beads in each vessel was then covered by a layer of sterile, black polypropylene pellets to prevent excessive light exposure on seedling roots. Additionally, black plastic covers (ShuBee, Macon, GA, USA) were placed on the bottom exterior portion of each culture vessel to further inhibit light exposure on roots. Wheat seedlings were grown in culture vessels at room temperature under growth lights (Ecolux w/Starcoat, F32T8 SPX35 Eco, GE, Boston, MA, USA; photon flux of 55 µmol m−2 s−1) with a photoperiod of 16 h for 13 days.
2.3. Microbial Contamination Analysis
Prior to collecting each wheat seedling for growth and tissue analysis, a 100 mL aliquot of nutrient solution from each culture vessel was inoculated onto sterile 0.8% tryptone yeast agar (tryptone: 0123-17, Difco Laboratories, Detroit, MI, USA; yeast extract: J850-500G, Amresco Inc., Solon, OH, USA; agar: J637-500G, VWR International, Radnor, PA, USA) plates to detect culturable microorganisms. The plates were stored in the dark at room temperature for a minimum of six days and visually inspected for any microbial colonies. Plates displaying microbial growth represented culture vessels that were contaminated, and those vessels were not included in the plant growth parameter results.
2.4. Wheat Growth and Metal Response
At the conclusion of the 13-day growth period, each wheat seedling was carefully removed from the culture vessel, and the roots were washed in a 0.01 M CaCl2 solution to remove loosely bound metals from the root surface. The seedlings were then cut above the seed crown to separate the shoot and root tissues, and shoot tissues were measured for total length (cm), and both the shoot and root tissues were weighed to obtain fresh weights (FW). Tissues were then stored in 50 mL conical tubes, flash-frozen in liquid nitrogen, and subsequently stored at −80 °C. Frozen tissues from the control (0 mM), 0.343, and 3.43 mM treatments were lyophilized using a Labconco FreeZone 6 freeze dryer (Labconco Corporation, Kansas City, MO, USA) for at least 72 h and subsequently weighed to obtain dry weights (DW).
2.5. Wheat Tissue Analysis
Below and above ground lyophilized tissue were weighed into PTFE digestion tubes. Because these were small samples, the entire sample (1–30 mg) was added to the tubes and acid digested using 1 mL of HNO3. After digestion, 1 mL of ultrapure water was added to each vial. The solutions were filtered with a 0.45 µm PTFE filter (Thermo Fisher Scientific, Waltham, MA, USA). Filtered digests were then diluted 25× and analyzed using an Agilent 4200 microwave plasma-atomic emission spectrometer (MP-AES) (Agilent, Santa Clara, CA, USA) and run in combination with Zn, Cu, Mn, Co, and Ni ICP standards ranging from 0–500 ng g−1 for validation.
2.6. Plate-Growth Assays
A series of plate-growth assays were used to determine optimal concentrations for each individual metal lactate. Arabidopsis thaliana (ecotype Columbia-0) seeds were surface sterilized in a 10% (v/v) bleach and 0.02% (v/v) Triton X-100 solution for 5 min followed by a 1-min wash in 70% (v/v) ethanol. Seeds were rinsed with sterile nanopure water before and after the ethanol wash. Sterilized seeds were transferred onto 1% Bacto agar plates (pH 5.8) containing 0, 0.5, 1, 50, and 75 µM of individual metal lactate and 0.25× modified Hoagland’s nutrient solution. Metals that were added as metal lactates that would normally be included in a complete Hoagland’s nutrient solution (i.e., Zn, Cu, and Mn), were excluded from the Hoagland’s solution for that treatment. Each concentration was represented by 8–10 sterilized seeds per plate on four plates. Plates were sealed with micropore tape and placed in a dark 4 °C refrigerator for 2–4 days for cold stratification. The trial was repeated in triplicate for each metal lactate.
Following cold stratification, plates were transferred to a Percival Model CU22L growth chamber (~100 µmol m−2 s−1) where they were maintained at 24 °C. After the first 24 h of incubation, an initial mark was made on the exterior of the plate just over the top of the tip of the primary root (PR). Plate marking was repeated every 24 h for a total of 5 days after the initial mark to monitor daily PR growth. Plates were scanned using an Epson V700 flatbed scanner, and the scanned images were imported into ImageJ software (Java 8.0) to quantify daily PR growth.
2.7. Statistical Analyses
In the wheat cultivation vessel experiment, a t-test was used to identify differences between metal chloride and metal lactate treatments within each concentration for each plant growth parameter (Excel Version 2104, Microsoft, Redmond, WA, USA). A Fischer’s Least Significant Difference test was used to discern differences in nutrient content between concentrations within the same metal delivery treatment using the R statistical computing environment (R Development Core Team, 2017). Correlations between treatment and tissue metal concentrations were analyzed using a Pearson correlation test in the R statistical computing environment. In the plate-based assay experiment, differences in daily PR growth between metal lactate concentrations were assessed using a Tukey’s Honest Significant Difference test in the R statistical computing environment.
3. Results
3.1. Wheat Cultivation Vessel Experiment and Arabidopsis thaliana Plate-Growth Assays
To test the hypothesis that wheat seedlings can utilize metal lactates as effectively as metal chlorides, and therefore experience metal toxicity at the same rate, a series of sterile culture-vessel experiments were employed. Wheat seedlings were exposed to varying levels of each of the metal lactates and metal chlorides, and growth parameters as well as tissue metal concentrations were analyzed. Plant growth and tissue metal content were analyzed to evaluate the degree of toxicity as an indicator of total metal uptake in wheat. In accordance with our hypothesis, plant growth generally decreased as the metal concentrations increased regardless of lactate or chloride metal (Tables 1, 3, 5, 7 and 9). Increasing metal concentrations led to an increase in tissue metal content (Tables 2, 4, 6, 8 and 10) at the 0.343 mM and 3.43 mM concentrations. Tissue metal content was not calculated for the 34.3 mM and 100 mM concentrations due to the level of toxicity and insufficient amounts of tissue required for reliable MP-AES analysis. Moreover, although the mean metal content increases at higher metal concentrations, this increase was in some cases non-significant due to the high variance of uptake between individual plants at these toxic concentrations. Furthermore, primary root growth measurements of Arabidopsis thaliana seedlings grown on plates varying in metal lactate concentrations allowed us to identify optimal concentration ranges for each individual metal lactate. This is a necessary step to inform future work in characterizing metal lactates since no data on the subject has been published to date.
3.1.1. Zinc
Typically, concentrations of Zn in plant tissues range from 10–120 µg g−1 dw, whereas critical toxicity concentrations range from 100–300 µg g−1 dw depending on plant species, age, and other nutrient concentrations [7,37,38]. Overall, we found that all plant growth parameters generally decreased with increasing Zn concentrations, regardless of the form of metal ligand, lactate or chloride (Figure S2). Within each treatment level, no significant differences between ZnCl2 and Zn lactate were observed in any of the plant growth parameters, with the exception of shoot length at 34.3 mM. Mean shoot growth was 4.5 ± 1.4 cm and 2.8 ± 0.7 cm for Zn lactate and ZnCl2, respectively (Table 1). Uptake of Zn from both delivery methods is supported by the linear increase of Zn in root and shoot tissues corresponding with the increased Zn in the nutrient solution (Table 2). Two significant negative trends were observed between Mn and Zn in which Mn tissue concentrations decreased in the roots with increasing ZnCl2 supply (R = −0.53, p = 0.042), and in the shoots with increased Mn lactate (R = −0.61, p = 0.015). ZnCl2 supply resulted in significantly higher root tissue accumulation of Zn at 11,975.6 ng g−1 while Zn lactate was lower at 6729.1 ng g−1, when both were applied at 3.43 mM.
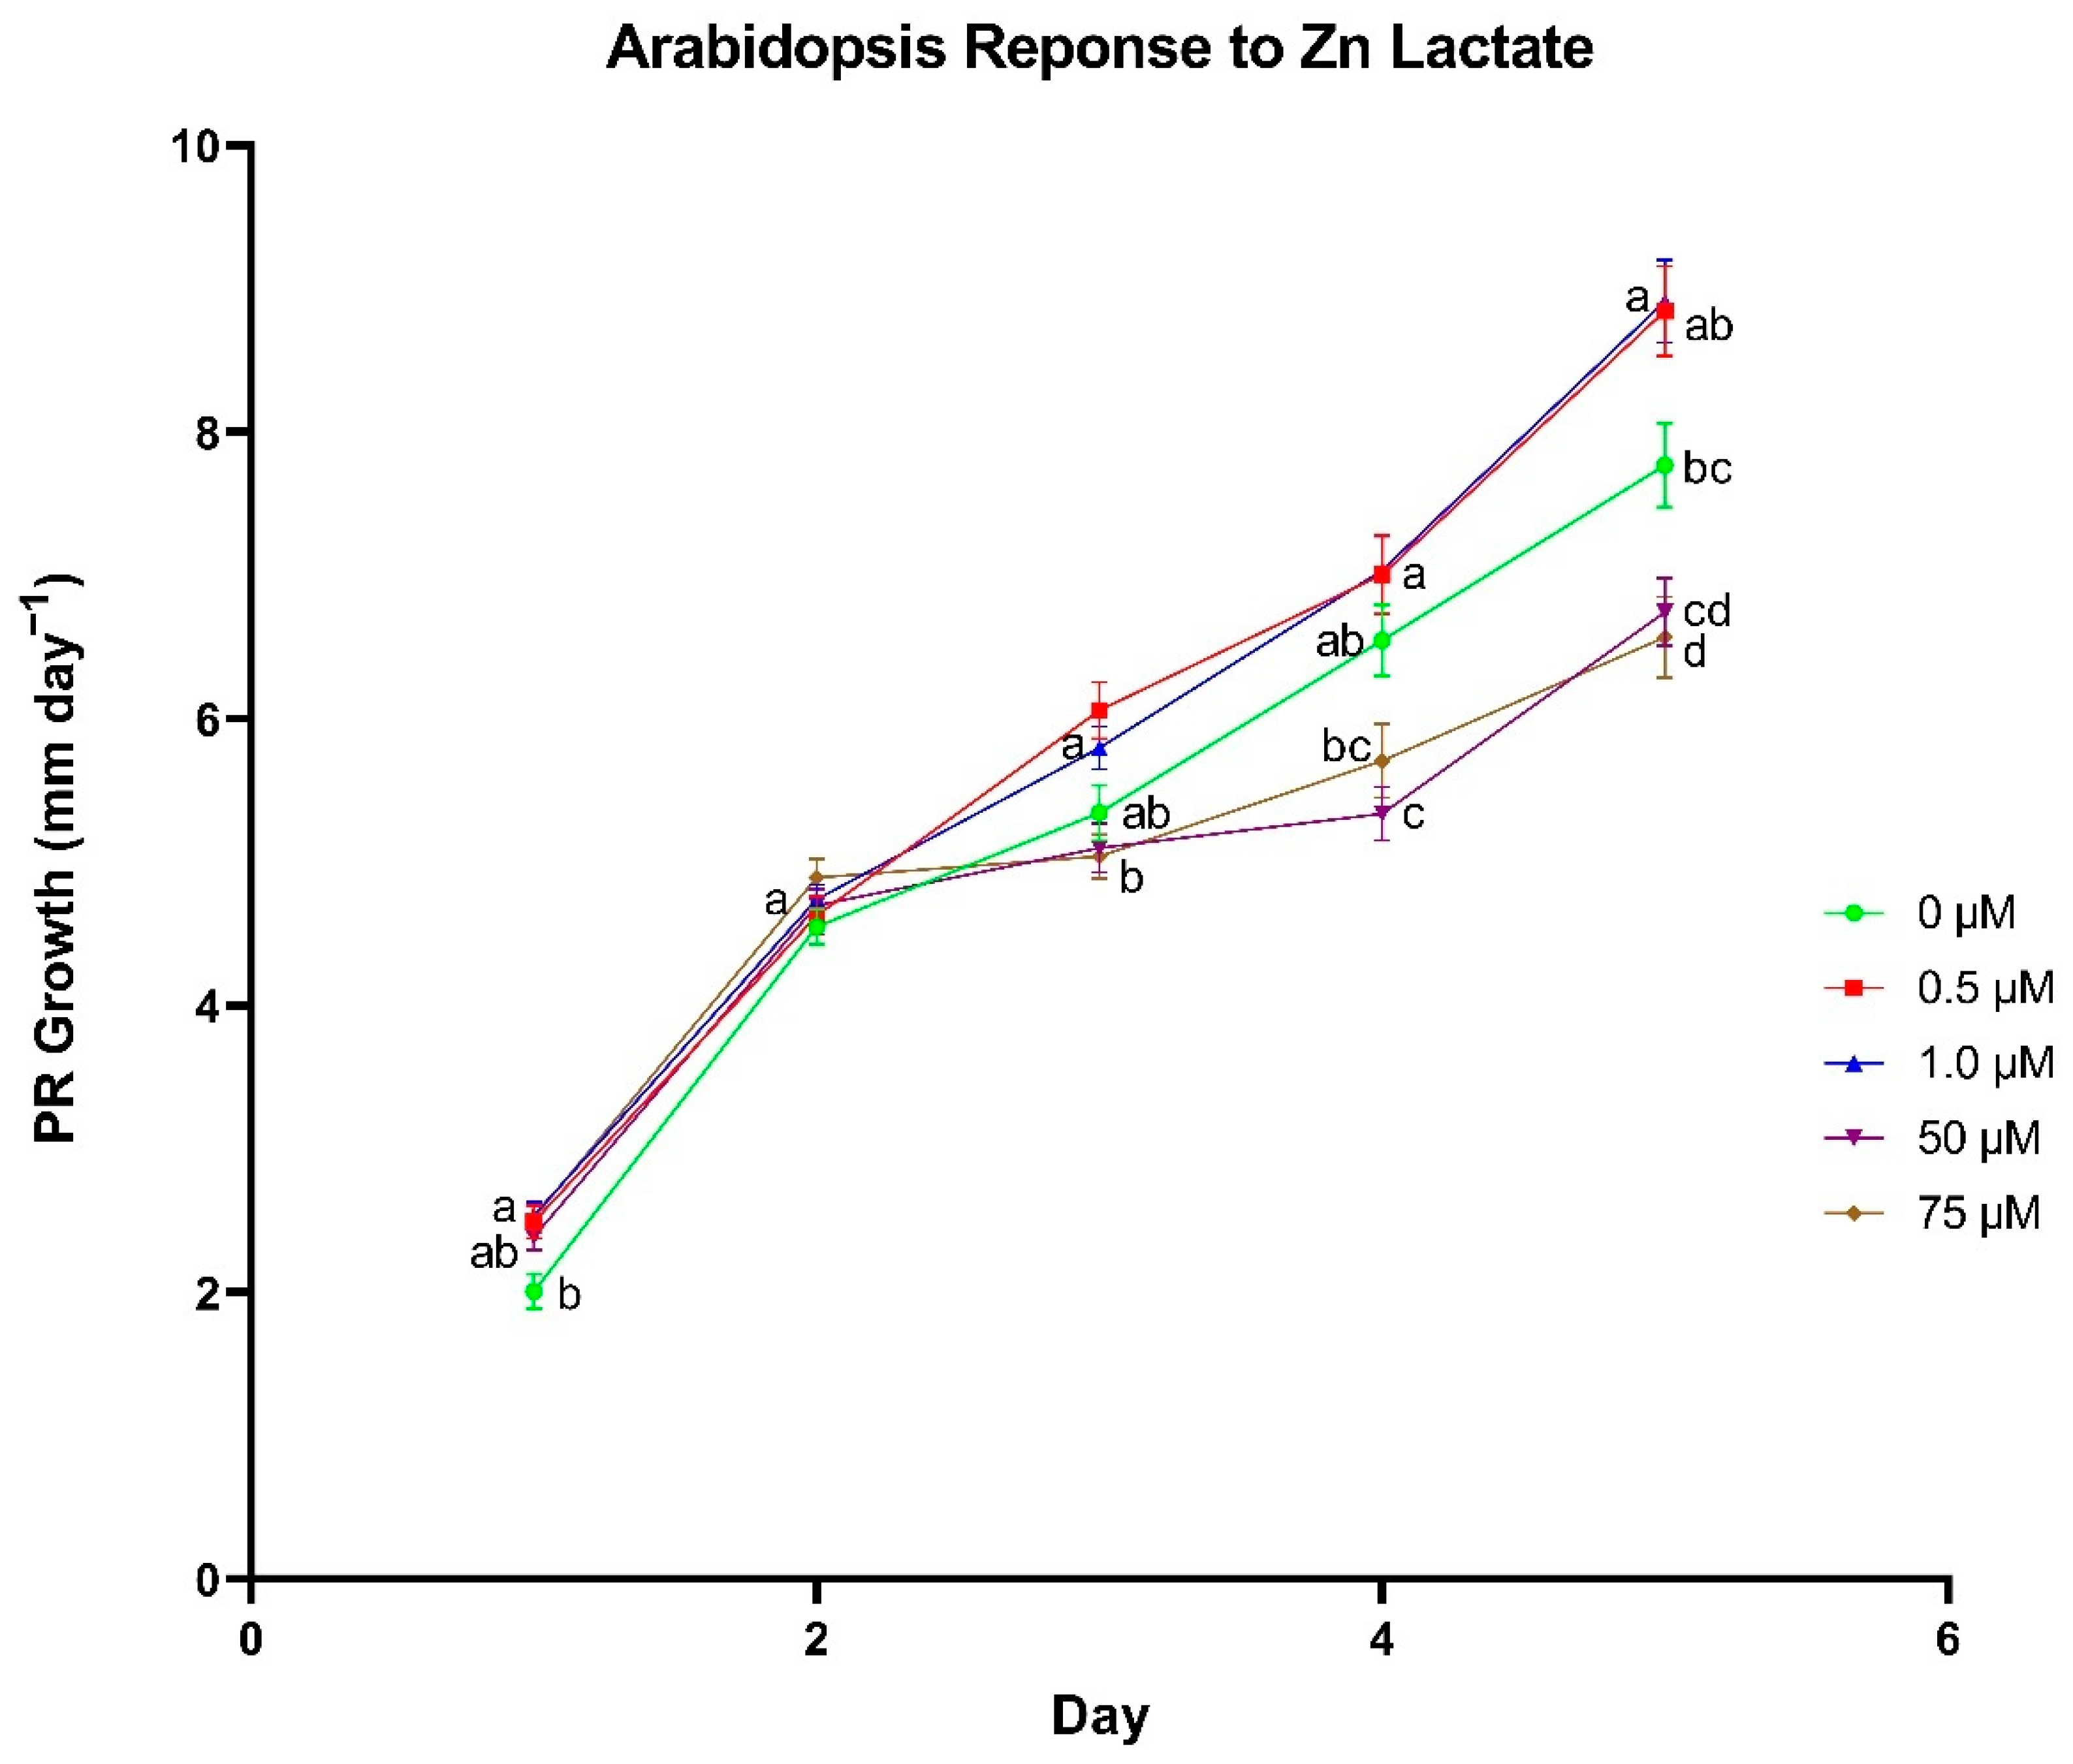
To further assess the potential growth promoting effects of Zn lactate, we used primary root growth in A. thaliana as an indicator of plant responsiveness to Zn lactate. A range of 0.5–1 µm Zn lactate was found to promote root growth (Figure 1). The response to Zn lactate supplementation was observed in the first day of growth, where 0.5 and 1.0 µm led to an average PR growth rate of 2.49 and 2.53 mm day−1, respectively, whereas seedlings that did not receive Zn lactate averaged 2.0 mm day−1. Beginning on day 3 of growth, seedlings treated with 50 and 75 µm had significantly reduced growth rates compared to those treated with 0.5 and 1.0 µm. For example, we see the greatest difference on the fifth day of growth where seedlings treated with 50 µm averaged 6.74 mm day−1 and those treated with 75 µm were slightly lower at 6.57 mm day−1, while 0.5 and 1.0 µm treatments averaged 8.84 and 8.91 mm day−1, respectively. Furthermore, both 0.5 and 1.0 µm treatments on day 5 conferred significantly greater growth compared to seedlings that did not receive Zn lactate with an average root growth rate of 7.77 mm day−1.
3.1.2. Manganese
Adequate Mn concentrations in plant tissues typically range from 90–200 µg g−1 dw, whereas critical toxicity concentrations of Mn range from 200–5300 µg g−1 dw depending on a variety of plant factors [7,38]. Our results show that growth decreased as MnCl2 and Mn lactate supply increased. Only one significant difference was identified in shoot FW at the 3.43 mM treatment level where shoot FW was 209.8 ± 21.7 mg when Mn lactate was added compared to an average of 147.6 ± 46.1 mg from MnCl2 supplementation (Table 3). Tissue metal analysis confirmed an increase in Mn uptake with increasing Mn supply from both ligand forms (Table 4). No significant differences in tissue metal concentrations were detected between MnCl2 and Mn lactate at any concentration for any metal analyzed.
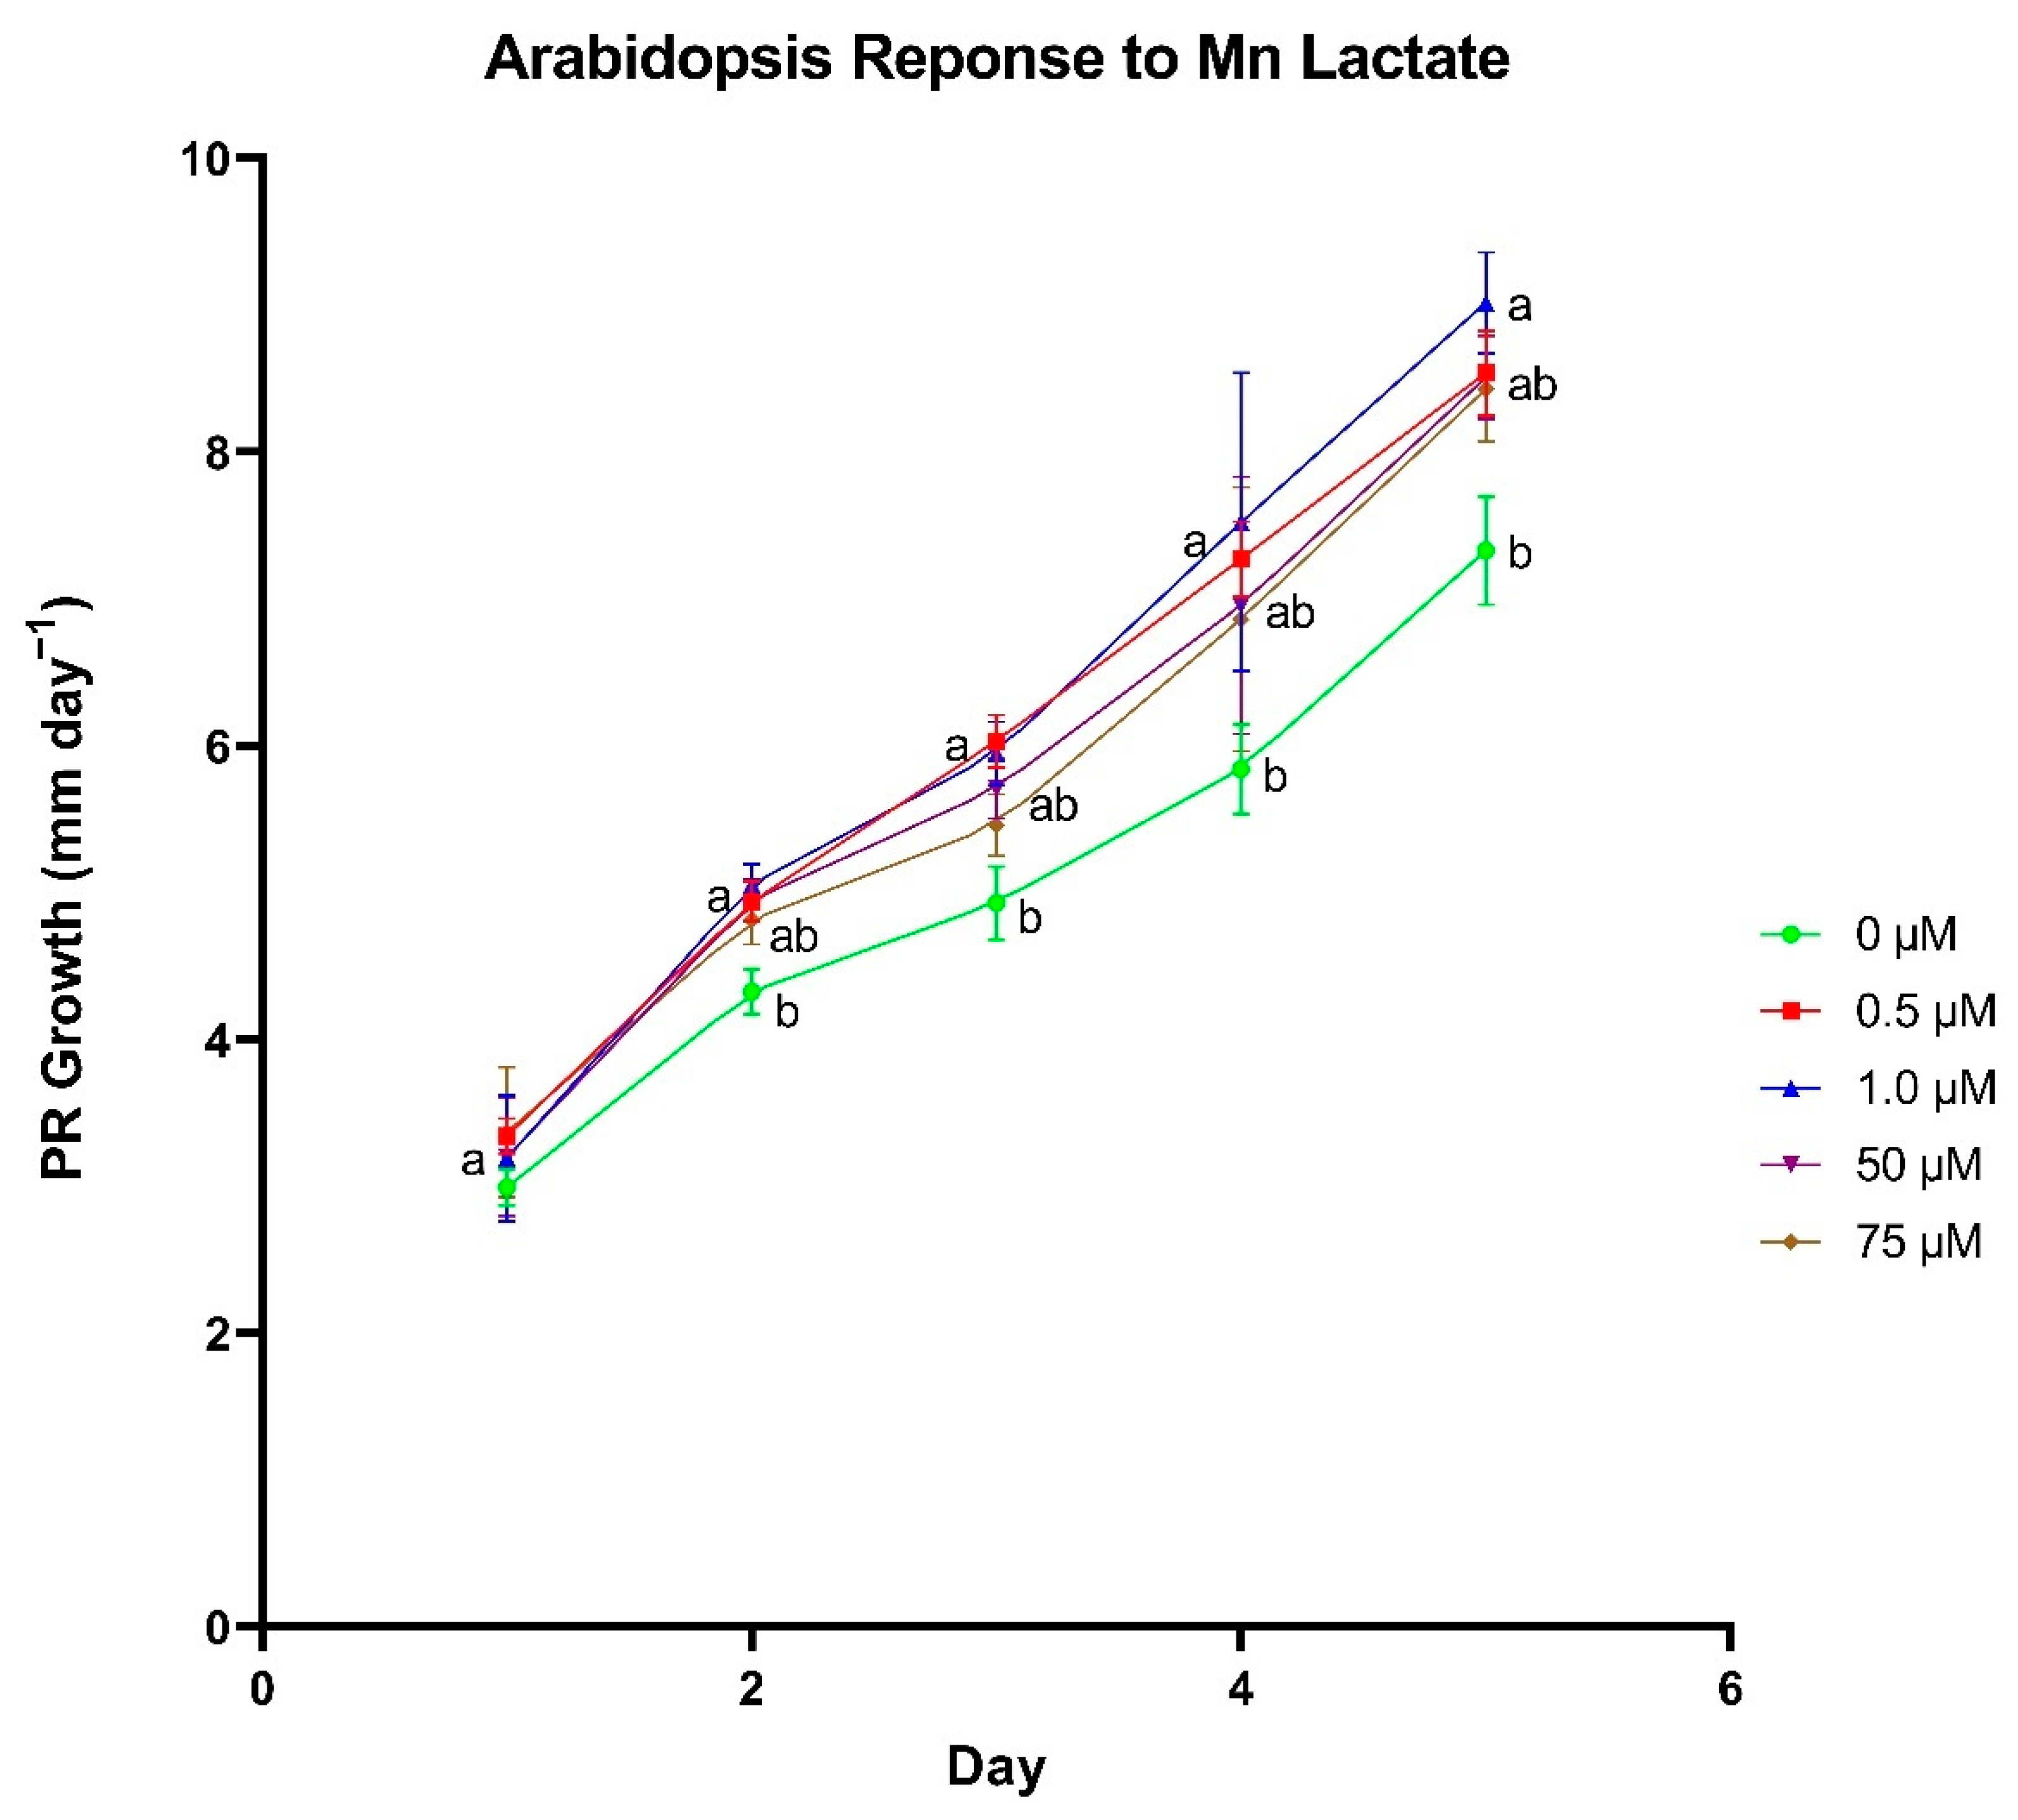
Primary root (PR) growth rates of A. thaliana seedlings were highest when 0.5 and 1.0 µm Mn lactate was added (Figure 2). While no differences in growth rates were observed after the first day, we observed differential growth rates in seedlings on day 2. Seedlings treated with 0.5, 1.0 and 50 µm Mn lactate averaged 4.93, 5.05 and 4.95 mm day−1, respectively. PR growth rates were the lowest at 4.32 mm day−1 when seedlings did not receive Mn lactate. The difference in PR growth rates between seedlings not supplemented with Mn lactate and those treated with 0.5 and 1 µm Mn lactate increased in days 3−5. For example, on day 4, seedlings treated with 0.5 and 1.0 µm averaged 7.27 and 7.52 mm day−1, whereas PR growth rates averaged just 5.84 mm day−1 in seedlings with no Mn lactate supplementation. PR growth rates on day 5 were similar to day 4; however, there was no statistical difference between the 0.5 µm treatment and the 0 µm control. Although no difference was identified, seedlings supplemented with 0.5 µm Mn lactate grew approximately 1.5 mm more on average compared to the control.
3.1.3. Copper
Compared to Zn and Mn, normal tissue concentrations of Cu are generally lower at around 10–25 µg g−1 dw depending on factors such as plant species, age, and other nutrient levels [7,38]. In light of this, we saw greater plant growth inhibition with increasing treatment concentrations of both Cu delivery forms compared to Zn and Mn treatments. No differences in growth parameter measurements were observed between CuCl2 and Cu lactate treatments except for root DW at the 3.43 mM treatment. At that concentration, root DW was lower when CuCl2 was applied (2.0 ± 1.0 mg) compared to Cu lactate (3.3 ± 0.4 mg) (Table 5). Increasing solution concentrations of both Cu forms led to an increase in tissue Cu levels in both roots and shoots. No significant differences in tissue metal concentrations were detected between CuCl2 and Cu lactate at any solution concentration for any metal analyzed (Table 6).
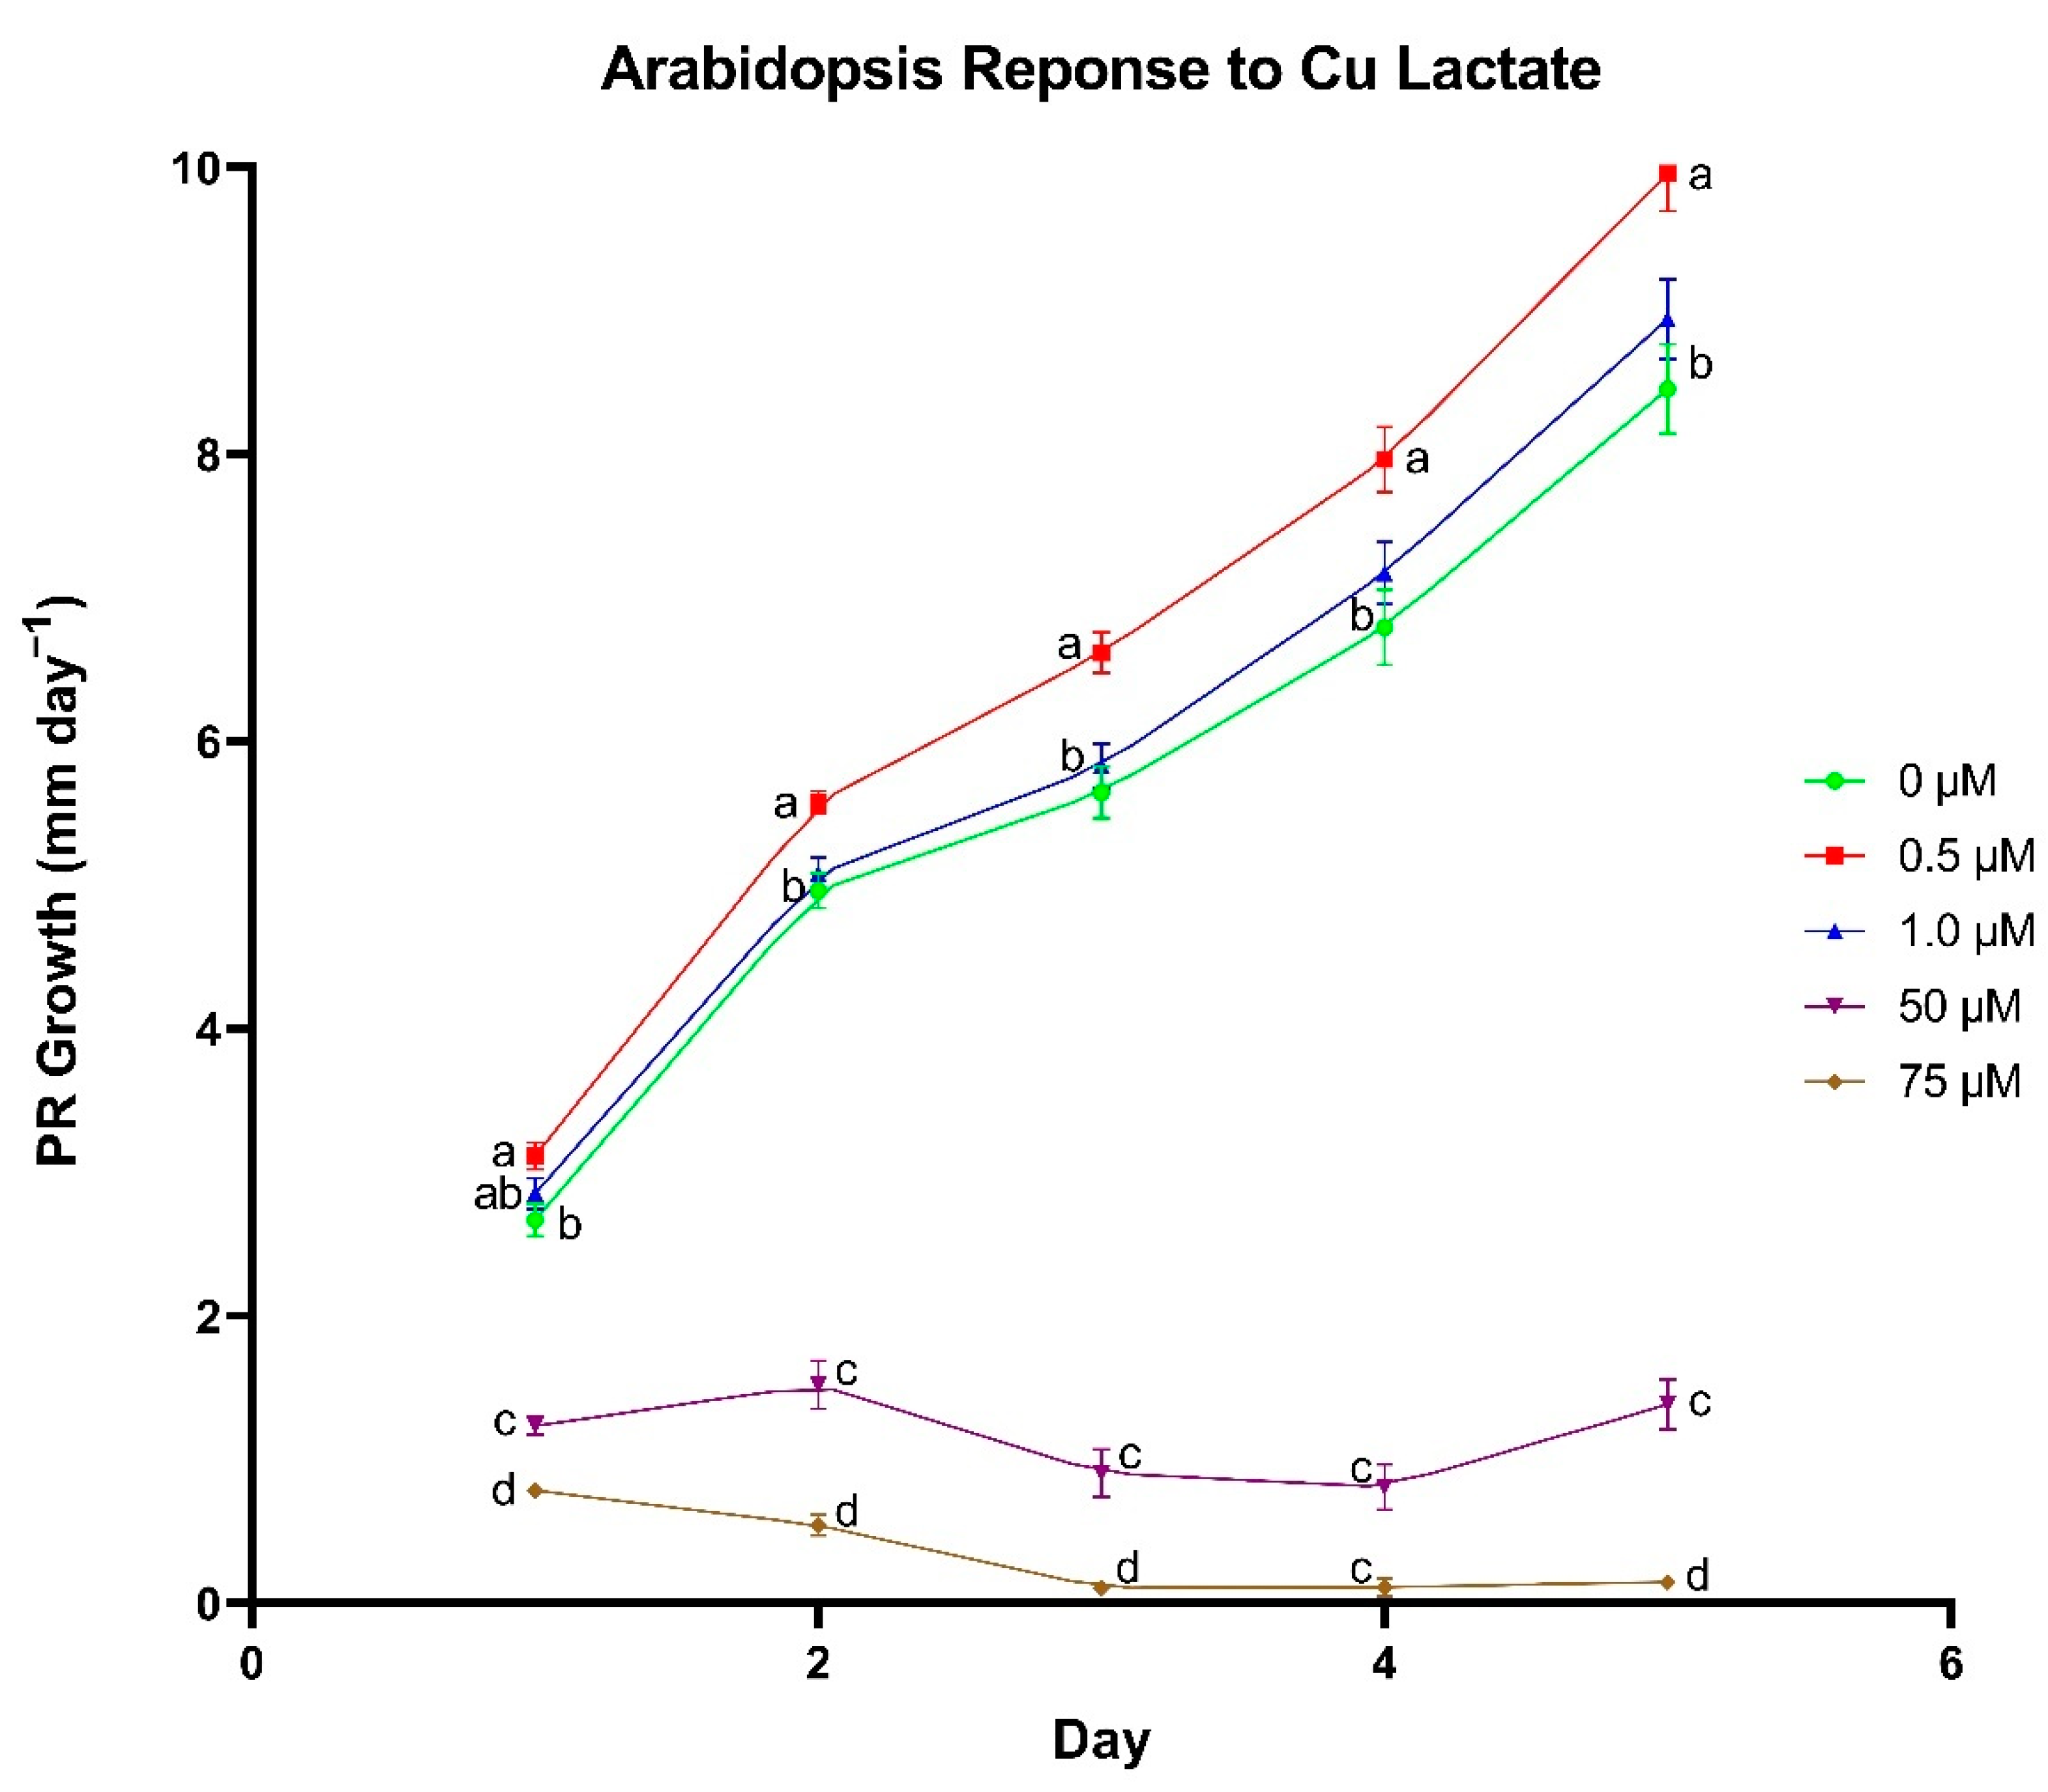
At a concentration of 0.5 µm, Cu lactate significantly enhanced primary root growth rate in A. thaliana in each of the first 5 days of growth compared to seedlings grown in 0 µm conditions (Figure 3). In addition, the difference in growth rate between seedlings treated with 0.5 µm and those treated with 0 µm increased as the length of growing time increased, where the growth rate difference for days 1–5 was 0.45, 0.62, 0.97, 1.17 and 1.5 mm day−1, respectively. Supplementing Cu lactate at a concentration of 1.0 µm had no difference in PR growth rates compared to the control, and 50 and 75 µm treatments yielded a negative effect on PR growth.
3.1.4. Nickel
The adequate range for Ni in plant tissue is typically between 0.05–10 µg g−1 dw with critical levels being as high as 100 µg g−1 dw [7]. Plant growth parameter results revealed five differences between Ni ligand forms. At the 0.343 mM treatment level, Ni lactate supplementation averaged 27.1 cm of shoot growth and 221.7 mg of shoot FW, but averaged 19.5 cm and 139.4 mg, respectively, with NiCl2 (Table 7). Similarly, we observed differences in shoot length and shoot FW between Ni forms at a solution concentration of 100 mM, where shoot length (3.3 ± 0.4 cm) and FW (22.9 ± 1.7 mg) were higher when Ni lactate was used compared to NiCl2 (2.3 ± 0.4 cm and 12.6 ± 2.1 mg, respectively). Shoot growth was higher at the 34.3 mM treatment level when Ni lactate was applied (3.4 ± 0.8 cm) compared to NiCl2 (2.1 ± 0.6 cm). Differences in Ni tissue concentrations between Ni delivery forms were observed in roots at a solution concentration of 3.43 mM and in shoots at 0.343 mM. In the root at 3.43 mM, Ni content from Ni lactate was approximately five times less than Ni supplied via NiCl2; however, no significant differences were observed in plant growth metrics at this treatment level (Table 8). Seedlings supplemented with 0.343 mM Ni lactate had lower Ni content (252.0 ± 28.4 ng g−1) in the shoots compared to NiCl2 (598.6 ± 32.9 ng g−1).
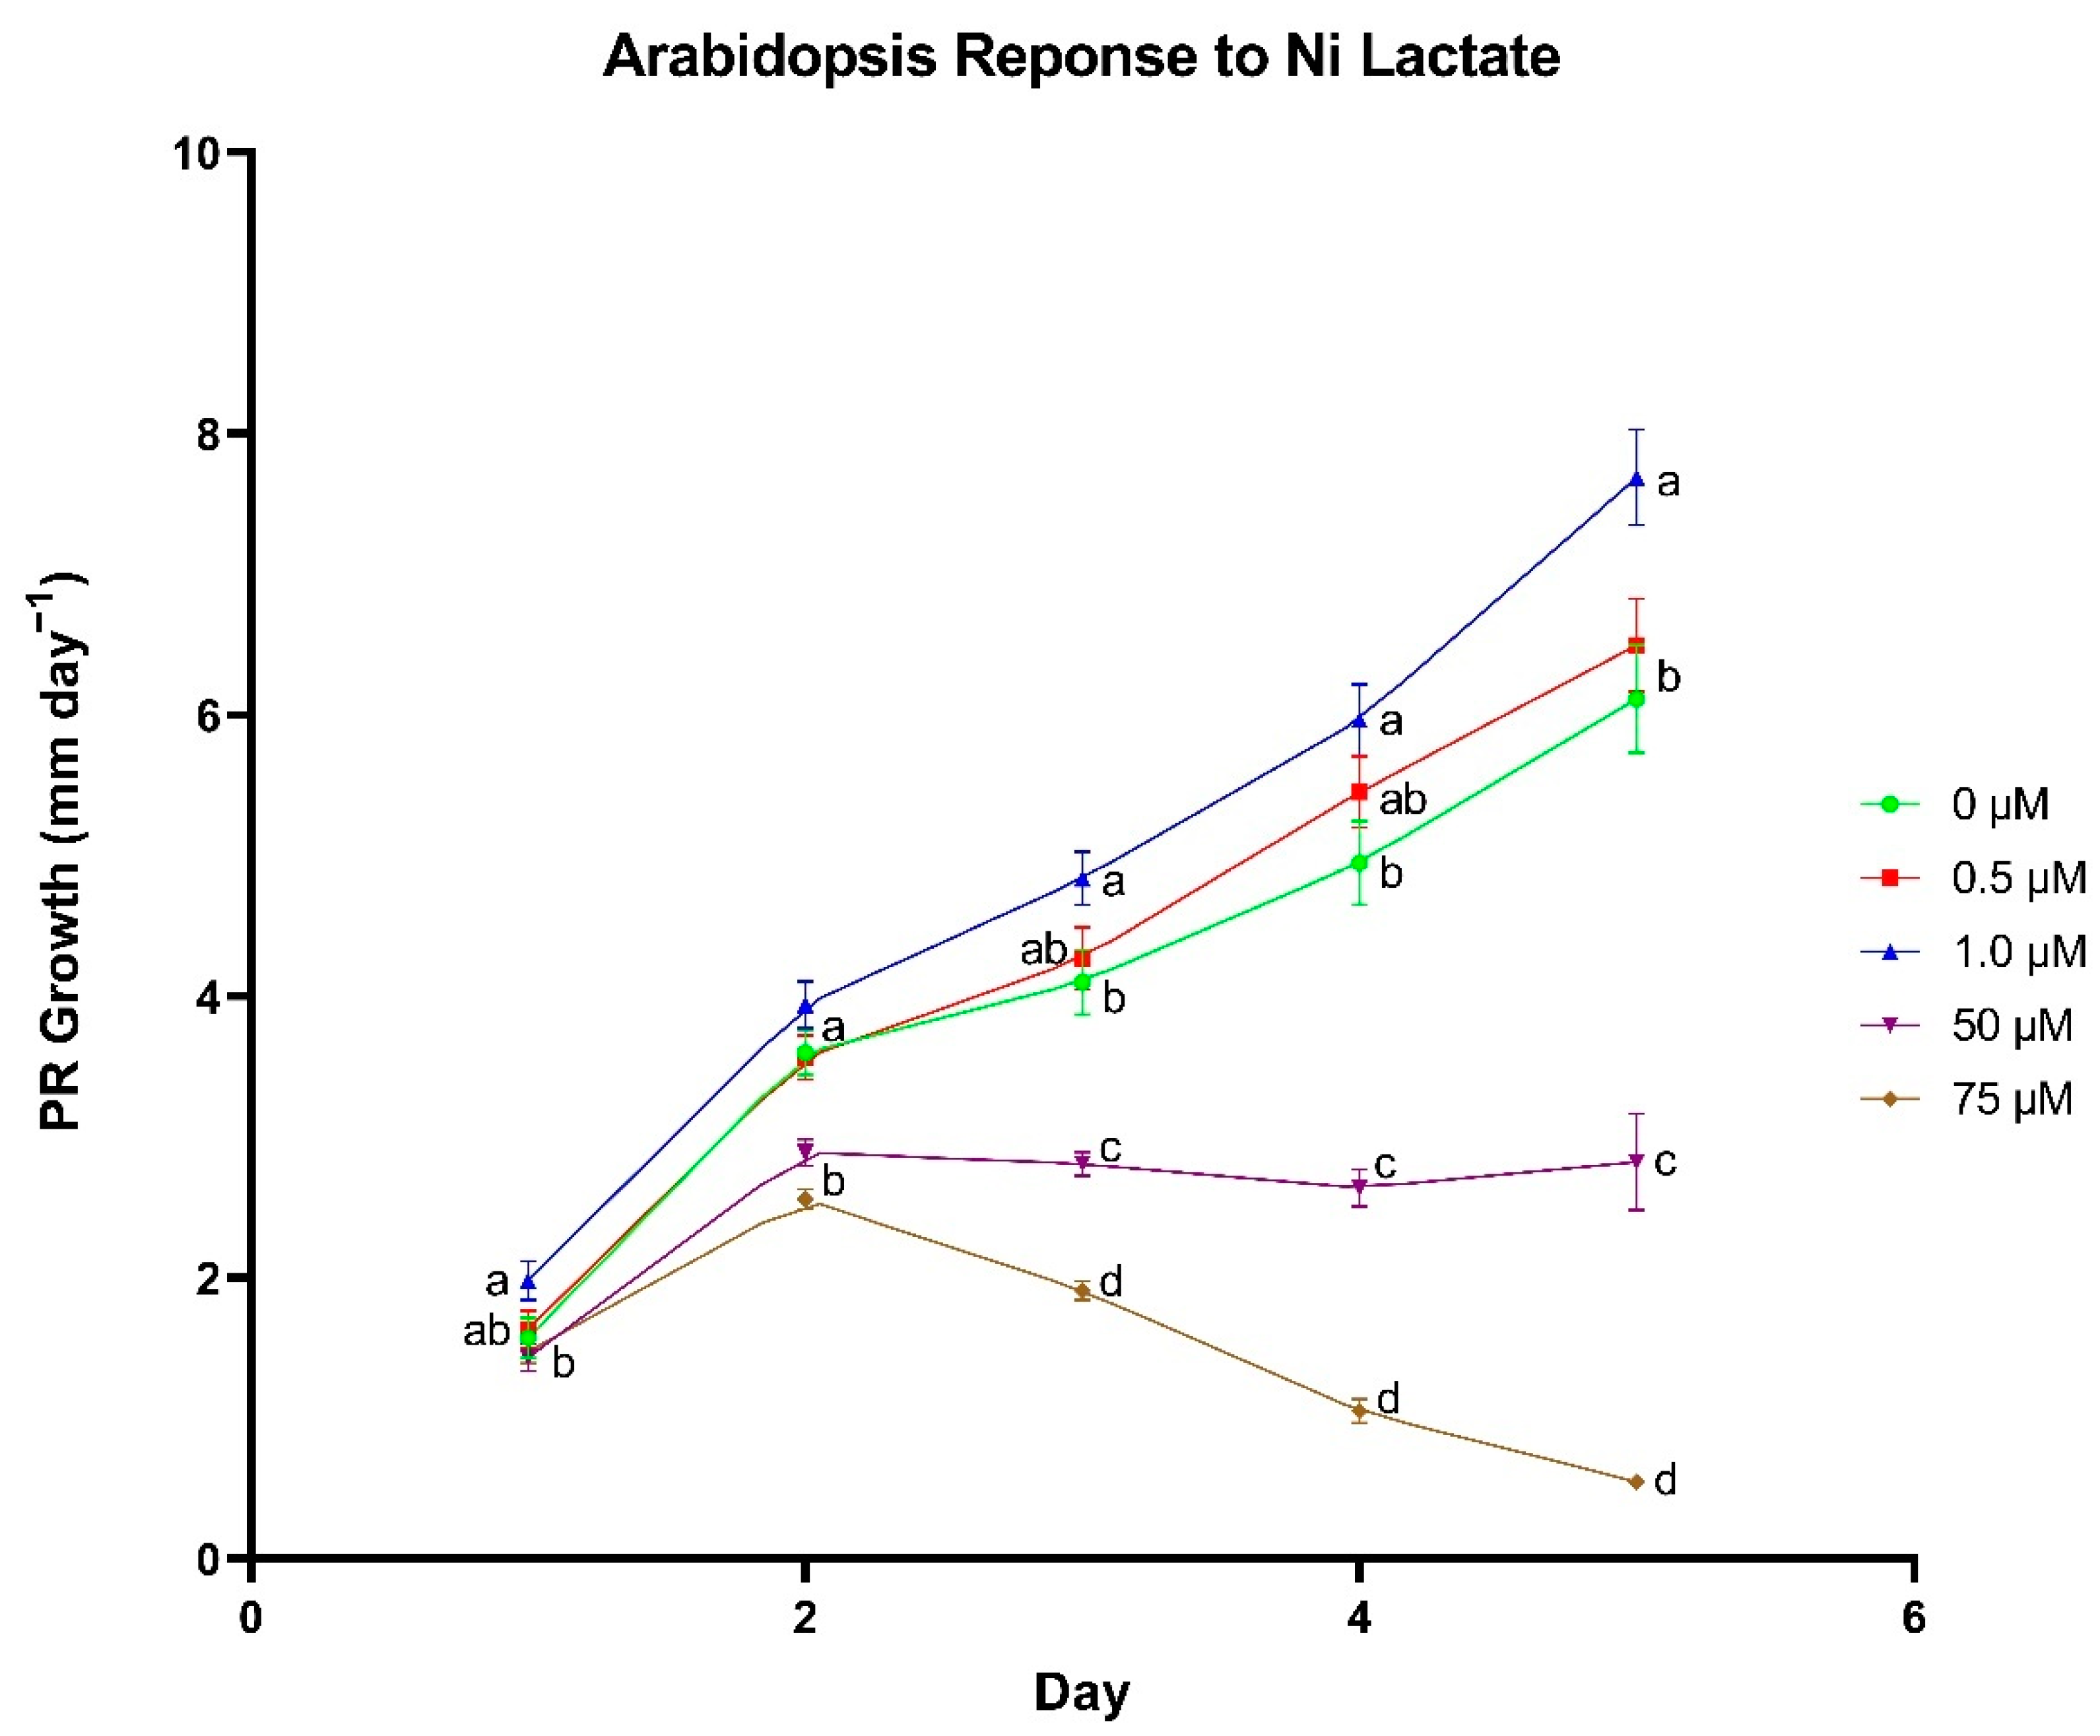
PR growth rates for A. thaliana were the highest when nickel lactate was supplied at 1.0 µm (Figure 4). In the first two days no difference in PR growth was observed between control seedlings and seedlings treated with 1.0 µm Ni lactate. Starting on day 3, root growth rates slowed when nickel was applied at higher concentrations (50 and 75 µm). Seedlings treated with 1.0 µm Ni lactate had a significantly higher growth rate at 4.83 mm day−1 compared to mean growth rates for control seedlings (4.10 mm day−1). The differences between treatments continued to increase on days 4 and 5. No difference was observed in daily PR growth rate between control seedlings and seedlings grown in 0.5 µm Ni lactate, and 50 and 75 µm treated seedlings had a negative effect on PR growth.
3.1.5. Cobalt
The majority of studies investigating Co concentrations in plant tissues have been done on Co hyperaccumulating plants to better understand tolerance mechanisms in metalliferous soils [39]; however, the critical toxicity concentration of Co in crop and pasture species (e.g., clover, bean and cabbage) has shown to range from 0.4 µg g−1 dw to a few µg g−1 dw depending on the plant species [7,40,41]. Significant differences between the Co lactate and CoCl2 treatments were identified in the shoot length and root DW parameters (Table 9). Shoot length was greater when Co lactate was applied at 34.3 mM and 100 mM (2.6 ± 0.4 cm and 1.4 ± 0.2 cm, respectively) compared to when CoCl2 was applied (2.1 ± 0.3 cm and 1.0 ± 0.3 cm, respectively). Root DW was greater when Co lactate was applied at 3.43 mM concentrations (6.4 ± 1.4 mg) compared to 4.3 ± 1.1 mg for CoCl2 at the same concentration. While no significant differences in tissue metal concentrations were detected between Co ligand forms at any concentration for any metal analyzed, there is a general decrease in the uptake and concentration of Cu, Mn, Ni, and Zn in the root and shoot tissues as Co solution concentration increases from both Co forms (Table 10).
A. thaliana primary root growth rate was enhanced by the addition of 0.5 µm Co lactate (Figure 5). On day 2, 0.5 µm treated seedlings had a significantly higher growth rate at 3.47 mm day−1 compared to 3.01 mm day−1 in control seedlings for a difference of 0.46 mm day−1. The difference in growth rate between control seedlings and 0.5 µm treated seedlings increased slightly on days 3–5 of growth to 0.62, 0.74 and 0.78 mm day−1; however, the difference between these two groups was not significant on day 5. There was no difference in primary root growth rate between the control and seedlings supplemented with 1.0 µm Co lactate, whereas 50 and 75 µm treatments appeared to have a significant inhibitory effect on root growth.
4. Discussion
This study provides the first investigation characterizing metal lactates as a potential plant biostimulant. To the authors’ knowledge, metal lactates have only previously been studied as a feed additive for ruminants to determine their effects on nutrient digestibility, in which Co lactate has been shown to enhance bacterial fiber digestion compared to CoCO3 and promote microbial volatile fatty acid production in cattle [42,43]. The proven enhancement of microbial activity driven by metal lactates in the digestive tract of ruminants suggests a similar phenomenon might be observed in the soil ecosystem; however, there is no information on plant uptake or optimal concentration of lactate-bound metals. This information is not only essential for further studies on metal lactates, but it also provides baseline evidence that metal lactates have biostimulatory effects on plants. Furthermore, when characterizing novel crop biostimulants it is apropos to first define the plant response, especially for micronutrient-containing biostimulants, since the range between deficiency and toxicity in plant micronutrient levels tends to be narrow [7]. The current study was conducted to address the dearth of information regarding metal lactate−plant interactions.
The first objective was to compare the uptake and toxicity range of five metals (Zn, Mn, Cu, Ni, and Co) supplied as either a lactate or a chloride salt form, to determine uptake in the absence of microbial breakdown processes using wheat grown in sterile culture vessels. Based on plant growth metrics and tissue metal content, metals supplied in lactate form appear to have a similar affinity for plant uptake compared to metals in chloride form. A previous study by Neocleous et al. (2020) found similar results when comparing the impact of chelated and inorganic forms of Mn and Zn on plant performance metrics and nutrient uptake in hydroponically grown bean crops [44]. In their study, bean plants receiving Mn and Zn chelated with ethylenediaminetetra acetic acid (EDTA) showed negligible differences in tissue micronutrient content compared to those receiving sulfate mineral forms. Chelating agents such as EDTA are often used to enhance plant micronutrient uptake in both soil and soilless growing systems by protecting them from redox changes and/or precipitation, thereby making them more available in solution [45]. Similarly, LMWOA (e.g., acetic, malic, and oxalic acid) also serve as small, organic complexing molecules and have been shown to increase heavy metal uptake in hydroponically grown wheat [46,47,48]. Although the precise mechanism by which complexed metals are taken up by plant roots is still under investigation, the data indicate they do play a beneficial role in facilitating metal uptake in plants. Based on the work from Neocleous et al. (2020), as well as the findings from the present study, it appears that organometallic complexes may be as effective in delivering metal nutrients compared to mineral forms, at least in hydroponic systems [44]. Further investigation is required to determine the efficacy of metal lactates to supply plants with metal nutrients in more complex soil systems.
A negative trend was observed between Mn and Zn where Mn tissue concentrations decreased with increasing ZnCl2 and Zn lactate concentrations. Lewis et al. (2012) observed Zn treatment increased Mn translocation in nodulated Medicago truncatula plants [49], and others have observed that increased Zn treatment is associated with decreased Mn tissue concentrations in various plants including sunflower, wheat, and lemon balm (Melissa officinalis) [50,51,52]. In peanut (Arachis hypogaea L.), Zn and Mn uptake are facilitated by the transporter AhNRAMP1, which could indicate that excessive Zn supply may suppress Mn uptake as a result of competition for transporters in root cells, thus providing a potential explanation for the findings presented above [53]. Interestingly, our findings suggest there is a difference in translocation of Zn depending on the form in which it is supplied. This could indicate that Zn supplied in lactate form may be regulated by different transporters than Zn ions from chloride forms once inside the plant; however, further investigation is needed to elucidate potential differences and mechanisms involved in the translocation and partitioning of metals in plants when supplied these two forms.
To further investigate the physiological responses to metal lactates beyond uptake capacity and toxicity thresholds, we identified concentrations for each individual metal lactate that yielded optimal root growth in plate-grown A. thaliana seedlings. This allowed us to gauge nutrient status and concentration as a result of plant uptake as has been described previously [33]. Root growth measurements have frequently been used as an indicator for responsiveness to fertilizer treatments in a variety of plant species [54,55]. While root growth can be quantified in different ways (e.g., growth rates, density, and biomass), root growth promotion in any aspect generally correlates to increased plant vigor through numerous mechanisms including enhanced nutrient and water acquisition and heightened tolerance to abiotic and biotic stressors [56,57,58]. Our finding that metal lactates delivered at specific concentrations can enhance primary root growth in A. thaliana seedlings shows promise in their ability to promote overall plant health.
The ability of metal lactates to improve primary root growth in A. thaliana seedlings may be attributed, at least in part, to enhanced activity in the enzymes and cellular processes that require micronutrients. Likewise, microbial growth and activity may also be stimulated by metal lactates by providing metal nutrients required for metabolic processes. For example, Zn in plants and microbes is primarily involved in the functionality and structural integrity of enzymes and proteins. Some of the more well-characterized plant enzymes and proteins requiring Zn include carbonic anhydrase, the Zn-containing superoxide dismutase (SOD), and ribosomal proteins, which have roles in C fixation, detoxification of reactive oxygen species, and protein synthesis, respectively [59,60,61,62,63]. Zinc supplementation has been shown to enhance the activity of carbonic anhydrase [61] and the Zn-containing SOD [64], as well as increase protein synthesis by mitigating ribosomal disintegration [65], and in each case plants receiving Zn had greater overall growth compared to Zn-deficient plants. Microbial alkaline phosphatase is particularly important in crop production settings due to its catalytic function in cleaving assimilable phosphate from organic P sources [66]. Zinc is a cofactor required for microbial alkaline phosphatase activity; however, a report by Łukowski and Dec (2018) found acid-soluble and exchangeable fractions of Zn to be negatively correlated with alkaline phosphatase activity [67]. Interestingly, the same study found a significant positive correlation between Zn and dehydrogenase activity, which is generally used as an indicator of overall biological activity [68].
Manganese mainly serves as a cofactor, activating about 35 different enzymes primarily involved in oxidation-reduction, decarboxylation, and hydrolytic reactions [7,69]. For example, Mn is a cofactor for phenylalanine ammonia-lyase and peroxidase which are enzymes involved in lignin biosynthesis [70]. Manganese deficiency is shown to reduce lignin content in plant roots [71], which has been linked to decreased resistance against root-infecting pathogens due to the role of lignin in pathogen defense [72]. Microbial Mn peroxidase also has an absolute requirement for Mn and is an ecologically important enzyme involved in the degradation of lignin, and thereby contributes to the recycling of more recalcitrant plant-derived C in soils [73,74]. The activity of Mn peroxidase appears to be enhanced by high concentrations of Mn which subsequently leads to greater lignin breakdown [75].
Currently, more than 100 different Cu-containing proteins have been identified in plants including polyphenol oxidase and diamine oxidase [76]. Polyphenol oxidases catalyze the oxygenation reactions converting plant phenols to orthoquinones, which are important precursors in the biosynthesis of lignin and in the production of melanotic substances that are formed from tissue damage in crops such as in potatoes and apples [77]. In addition to the role of lignin in pathogen defense, melanotic compounds act as inhibitors of spore germination and fungal growth [7]. Diamine oxidase is involved in the degradation of the nitrogen-containing compounds putrescine and spermidine, producing hydrogen peroxide and ammonia as byproducts of catalysis [78]. Hydrogen peroxide produced during these reactions is thought to be involved in cell signaling, pathogen defense, and increasing the activity of peroxidases associated with lignification [79,80]. The activity of both polyphenol oxidase and diamine oxidase have shown clear responses to Cu supplementation, wherein Cu-sufficient plants had higher activities of the enzymes and greater plant biomass compared to plants grown in Cu-deficient conditions [81]. In microbes, Cu is required by several enzymes including laccase and polysaccharide oxygenase which function in the breakdown of lignin and cellulose, respectively [82,83]. The activity of both enzymes can be enhanced by Cu supplementation in culture-based setups [82,84]; however, further investigation is needed to determine how Cu amendments may improve lignin and cellulose degradation in soils.
To date, only two plant proteins are known to require Ni for proper functioning: urease and Ni-urease accessory protein (Eu3). Urease catalyzes the hydrolytic reaction converting urea into ammonia and carbon dioxide, and Ni-urease accessory protein is essential for urease activity [85,86]. In studies using urea as the major or sole source of nitrogen, Ni-sufficient plants showed a significant increase in growth and urease activity compared to Ni-deficient plants [87,88,89]. Likewise, Ni is required for urease function in microbes and the activity of the enzyme can be inhibited in Ni-deficient soils as well as stimulated upon Ni supplementation [90].
Cobalt, although not required for plant growth, is considered a beneficial element that can enhance growth, particularly in leguminous plants, due to its requirement by nitrogen-fixing symbionts [39]. For example, in Rhizobium and Bradyrhizobium, Co-dependent cobalamin is required for the synthesis of methyl malonyl-coA mutase which is involved in leghemoglobin synthesis in root nodules, wherein leghemoglobin is crucial to the protection of nitrogenase from oxygen [91]. The absence of Co in nodule-forming plants can lead to reduced bacteroid numbers in root nodules and reduced nodule formation, ultimately decreasing nitrogen fixation [7,92]. This is particularly important in plants relying on microbial nitrogen fixation as a source of N when mineral or other forms are in low abundance or unavailable.
The importance of micronutrients in crop production is gaining awareness as micronutrient-deficient soils are becoming increasingly prominent across the globe [5]. Generally, conventionally managed soils tend to have lower micronutrient availability compared to soils under organic management which can disrupt or inhibit plant metabolic processes. Organic cropping systems tend to procure sufficient levels of soil micronutrients which is likely due, in part, to the use of organic fertilizers and amendments that supply C to soil microbial communities. Organic C availability in soils is directly linked to soil microbial activity, wherein soils with high amounts of available C generally favor microbial growth and plant growth promoting functions such as P solubilization, siderophore production, phytohormone production, and biocontrol activities [93,94]. A variety of C amendments have been applied to soils with the goal of enhancing microbial functions including C supplied in the form of rhizospheric organic acids. In their report, Macias-Benitez et al. (2020) determined that organic acids, particularly lactic and citric acid, are effective in stimulating soil microbial activity and enhancing bacterial taxa described as plant growth promoting bacteria [24]. Along with our work, the findings by Macias-Benitez et al. (2020) provide substantial evidence supporting the use of metal lactates as potential biostimulants.
In addition to serving as a C source of microbial nutrition, lactate is a key primary metabolite and may serve a beneficial role in early seedling growth and development. In our study, we identified several differences in plant growth between metal lactate and metal chloride treatments at similar concentrations, and in each case, metal lactates had less of an inhibitory effect (Tables 1, 3, 5, 7 and 9). For example, Ni lactate supplied at a rate of 0.343 mM led to significantly higher shoot FW compared to NiCl2 treatments at the same concentration (Table 7). Carbon sources are often used in in vitro plant cultures and serve as an energy and C source for highly demanding developmental processes such as embryogenesis, organogenesis, shoot proliferation, and root induction since developing seedlings grown in culture are not entirely autotrophic [95]. The most widely used C source for growing in vitro plants is the disaccharide sucrose; however, a variety of other carbohydrates including other disaccharides, monosaccharides, trisaccharides, and sugar alcohols are also applied depending on the plant species and growth stage. Organic acids are typically not used for this purpose, but rather they have been incorporated in in vitro culture to facilitate metal nutrient uptake due to their role as a complexing agent. For example, lactic acid salts in hydroponic solution have been shown to significantly improve cucumber development and yield in nutrient-deficient conditions compared to non-deficient conditions without lactic acid salts [22]. In addition to its role in enhancing metallonutrient uptake, the finding that Co lactate enhanced A. thaliana root growth in our study suggests that lactate may fulfill the same role as carbohydrates to supply A. thaliana seedlings with the C and energy, considering they were grown in nutrient sufficient conditions and the unlikelihood that Co supplementation benefitted growth and development.
5. Conclusions
We present here an initial characterization of metal lactates as a potential plant biostimulant. Our data shows a comparable ability for wheat seedlings to utilize metals (i.e., Zn, Mn, Cu, Ni, and Co) delivered in lactate form compared to mineral chloride forms. Moreover, metal lactates promote root growth on plate-grown A. thaliana seedlings in the first five days of growth with optimal concentrations for Zn (0.5–1.0 µM), Mn (0.5–1.0 µM), Cu (0.5 µM), Ni (1.0 µM), and Co (0.5 µM) lactate being identified. In a push for sustainable fertilization alternatives in the face global climate change, metal lactates show promise as a novel class of biostimulants that may provide additional benefits to cropping systems that are not offered by conventional fertilizers. Previous work showed metal lactates can promote microbial activities in animals. Given that crop micronutrient deficiency often occurs in areas where soils have been heavily degraded, metal lactates might provide a unique solution by providing adequate micronutrient fertilization while also promoting soil health. To further characterize metal lactates as a potential plant biostimulant, future studies will work toward describing the distribution of metals provided by metal lactates in soil systems, the effect of metal lactates on gene expression in plants, as well as their effects on soil microbial communities and activity. The findings presented here lay the foundation for such studies as well as subsequent investigations on the ability of metal lactates to enhance plant growth and nutrition.
Supplementary Materials
The following are available online at https://www.mdpi.com/article/10.3390/biom11081085/s1, Table S1: Volume of modified Hoagland’s nutrient solution (NS), water, and 0.229 M metal lactate or metal chloride solution added to each culture vessel for each selected treatment, Table S2: Final nutrient concentrations in modified Hoagland’s nutrient solution, Figure S1: Set up and growth of the wheat cultivation vessel experiment to measure uptake and toxicity of metal chlorides and metal lactates, Figure S2: Representative dose response of 16-day old wheat (Triticum aestivum) plants to zinc chloride (ZnCl2) and zinc lactate.
Author Contributions
Conceptualization, L.J.O., R.W.L., T.S.S. and K.A.S.; methodology, L.J.O., R.W.L. and K.A.S.; formal analysis, L.J.O.; investigation, L.J.O. and L.A.K.; writing—original draft preparation, L.J.O., T.S.S. and K.A.S.; writing—review and editing, L.J.O., R.W.L., L.A.K., T.S.S. and K.A.S. All authors have read and agreed to the published version of the manuscript.
Funding
This research was supported by Ralco Nutrition Inc. (Marshall, MN, USA) and start-up funding to K.A.S. from the Washington State University Department of Crop and Soil Sciences. Funding was also provided to K.A.S. and T.S.S. by USDA/NIFA through Hatch project 1014527.
Institutional Review Board Statement
Not applicable.
Informed Consent Statement
Not applicable.
Acknowledgments
The authors would like to thank Rebeca Gisselle Velasquez Morales and Kalista Wales at Washington State University for assistance with experimental preparation and data collection as well as Michelle Reid for assistance with elemental analysis.
Conflicts of Interest
This research was supported by Ralco Nutrition Inc. (Marshall, MN, USA) who supplied the metal lactates used in this study. Ralco Nutrition Inc. (Marshall, MN, USA) had no role in the design, execution, interpretation, or writing of the study.
References
- Hugo, V.; Sands, R.D.; van der Mensbrugghe, D.; Nelson, G.C.; Ahammad, H.; Blanc, E.; Bodirsky, B.; Fujimori, S.; Hasegawa, T.; Havlik, P.; et al. The future of food demand: Understanding differences in global economic models. Agric. Econ. 2014, 45, 51–67. [Google Scholar]
- Dawson, I.G.J.; Johnson, J.E.V. Growing pains: How risk perception and risk communication research can help to manage the challenges of global population growth. Risk Anal. 2014, 34, 1378–1390. [Google Scholar] [CrossRef] [PubMed] [Green Version]
- Del Buono, D. Can biostimulants be used to mitigate the effect of anthropogenic climate change on agriculture? It is time to respond. Sci. Total Environ. 2021, 751, 141763. [Google Scholar] [CrossRef] [PubMed]
- Mrid, R.B.; Benmrid, B.; Hafsa, J.; Boukcim, H.; Sobeh, M.; Yasri, A. Secondary metabolites as biostimulant and bioprotective agents: A review. Sci. Total Environ. 2021, 777, 146204. [Google Scholar] [CrossRef]
- White, J.G.; Zasoski, R.J. Mapping soil micronutrients. Field Crops Res. 1999, 60, 11–26. [Google Scholar] [CrossRef]
- Bolan, N.S.; Hedley, M.J.; White, R.E. Processes of soil acidification during nitrogen cycling with emphasis on legume based pastures. Plant Soil 1991, 134, 53–63. [Google Scholar] [CrossRef]
- Marschner, H. Marschner’s Mineral Nutrition of Higher Plants, 3rd ed.; Academic Press: London, UK; Cambridge, MA, USA, 2012. [Google Scholar]
- Drinkwater, L.E.; Letourneau, D.K.; Workneh, F.; van Bruggen, A.H.C.; Shennan, C. Fundamental differences between conventional and organic tomato agroecosystems in California. Ecol. Appl. 1995, 5, 1098–1112. [Google Scholar] [CrossRef]
- Bulluck III, L.R.; Brosius, M.; Evanylo, G.K.; Ristaino, J.B. Organic and synthetic fertility amendments influence soil microbial, physical and chemical properties on organic and conventional farms. Appl. Soil Ecol. 2002, 19, 147–160. [Google Scholar] [CrossRef]
- Stamatiadis, S.; Werner, M.; Buchanan, M. Field assessment of soil quality as affected by compost and fertilizer application in a broccoli field (San Benito County, California). Appl. Soil Ecol. 1999, 12, 217–225. [Google Scholar] [CrossRef]
- Gunapala, N.; Scow, K.M. Dynamics of soil microbial biomass and activity in conventional and organic farming systems. Soil Biol. Biochem. 1998, 30, 805–816. [Google Scholar] [CrossRef]
- Dawe, D.; Dobermann, A.; Ladha, J.K.; Yadav, R.L.; Bao, L.; Gupta, R.K.; Lal, P.; Panaullah, G.; Sariam, O.; Singh, Y.; et al. Do organic amendments improve yield trends and profitability in intensive rice systems? Field Crops Res. 2003, 83, 191–213. [Google Scholar] [CrossRef]
- Yadav, R.L.; Dwivedi, B.S.; Prasad, K.; Tomar, O.K.; Shurpali, N.J.; Pandey, P.S. Yield trends, and changes in soil organic-C and available NPK in a long-term rice–wheat system under integrated use of manures and fertilisers. Field Crops Res. 2000, 68, 219–246. [Google Scholar] [CrossRef]
- Jones, D.L.; Darrah, P.R. Re-sorption of organic components by roots of Zea mays L. and its consequences in the rhizosphere. Plant Soil 1992, 143, 259–266. [Google Scholar] [CrossRef]
- Jones, D.L.; Darrah, P.R. Re-absorption of organic compounds by roots of Zea mays L. and its consequences in the rhizosphere. II. Experimental and model evidence for simultaneous exudation and re-absorption of soluble C compounds. Plant Soil 1993, 153, 47–59. [Google Scholar] [CrossRef]
- Jones, D.L.; Darrah, P.R. Amino-acid influx at the soil-root interface of Zea mays L. and its implications in the rhizosphere. Plant Soil 1994, 163, 1–12. [Google Scholar] [CrossRef]
- Jones, D.L.; Darrah, P.R. Influx and efflux of organic acids across the soil-root interface of Zea mays L. and its implications in rhizosphere C flow. Plant Soil 1995, 173, 103–109. [Google Scholar] [CrossRef]
- Sacchi, G.A.; Abruzzese, A.; Lucchini, G.; Fiorani, F.; Cocucci, S. Efflux and active re-absorption of glucose in roots of cotton plants grown under saline conditions. Plant Soil 2000, 220, 1–11. [Google Scholar] [CrossRef]
- Sheldon, A.R.; Menzies, N.W. The effect of copper toxicity on the growth and root morphology of Rhodes grass (Chloris gayana Knuth.) in resin buffered solution culture. Plant Soil 2005, 278, 341–349. [Google Scholar] [CrossRef]
- Shi, S.; Richardson, A.E.; O’Callaghan, M.; DeAngelis, K.M.; Jones, E.E.; Stewart, A.; Firestone, M.K.; Condron, L.M. Effects of selected root exudate components on soil bacterial communities. FEMS Microbiol. Ecol. 2011, 77, 600–610. [Google Scholar] [CrossRef] [Green Version]
- Rodríguez-Morgado, B.; Jiménez, P.C.; Moral, M.T.; Rubio, J.P. Effect of l-lactic acid from whey wastes on enzyme activities and bacterial diversity of soil. Biol. Fertil. Soils 2017, 53, 389–396. [Google Scholar] [CrossRef]
- Bohme, M.H.; Hoang, L.T.; Vorwerk, R. Effect of different substrates and mineral as well as organic nutrition on the growth of cucumber in closed substrate systems. Acta Hortic. 2001, 548, 165–172. [Google Scholar] [CrossRef]
- Bohme, M.H.; Schevchenko, J.; Pinker, I. Effect of biostimulators on growth of vegetables in hydroponic systems. Acta Hortic. 2005, 697, 337–344. [Google Scholar] [CrossRef]
- Macias-Benitez, S.; Garcia-Martinez, A.M.; Caballero Jimenez, P.; Gonzalez, J.M.; Tejada Moral, M.; Parrado Rubio, J. Rhizospheric organic acids as biostimulants: Monitoring feedbacks on soil microorganisms and biochemical properties. Front. Plant Sci. 2020, 11, 633. [Google Scholar] [CrossRef] [PubMed]
- Datta, R.; Tsai, S.-P.; Bonsignore, P.; Moon, S.-H.; Frank, J.R. Technological and economic potential of poly(lactic acid) and lactic acid derivatives. FEMS Microbiol. Rev. 1995, 16, 221–231. [Google Scholar] [CrossRef]
- Choi, W.; Roberts, D.M. Arabidopsis NIP2;1, a major intrinsic protein transporter of lactic acid induced by anoxic stress. J. Biol. Chem. 2007, 282, 24209–24218. [Google Scholar] [CrossRef] [Green Version]
- Claus, J.; Bohmann, A.; Chavarría-Krauser, A. Zinc uptake and radial transport in roots of Arabidopsis thaliana: A modelling approach to understand accumulation. Ann. Bot. 2012, 112, 369–380. [Google Scholar] [CrossRef] [Green Version]
- Kajala, K.; Walker, K.L.; Mitchell, G.S.; Krämer, U.; Cherry, S.R.; Brady, S.M. Real-time whole-plant dynamics of heavy metal transport in Arabidopsis halleri and Arabidopsis thaliana by gamma-ray imaging. Plant Direct 2019, 3, e00131. [Google Scholar] [CrossRef] [Green Version]
- Kumar, A.; Kaur, G.; Goel, P.; Bhati, K.K.; Kaur, M.; Shukla, V.; Pandey, A.K. Genome-wide analysis of oligopeptide transporters and detailed characterization of yellow stripe transporter genes in hexaploid wheat. Funct. Integr. Genom. 2018, 19, 75–90. [Google Scholar] [CrossRef]
- Portanova, R.; Lajunen, L.H.J.; Tolazzi, M.; Piispanen, J. Critical evaluation of stability constants for alpha-hydroxycarboxylic acid complexes with protons and metal ions and the accompanying enthalpy changes. Part II. Aliphatic 2-hydroxycarboxylic acids. Pure Appl. Chem. 2003, 75, 495–540. [Google Scholar] [CrossRef]
- Doe, H.; Kitagawa, T. Studies of formation of some metal(II) chloride complexes in methanol using a chloride ion selective electrode. Inorg. Chem. 1982, 21, 2272–2276. [Google Scholar] [CrossRef]
- Morris, D.F.C.; Short, E.L. Manganese(II) chloride complexes. Part I. Stability constants. J. Chem. Soc. 1961, 5148–5153. [Google Scholar] [CrossRef]
- Gruber, B.D.; Giehl, R.F.; Friedel, S.; von Wirén, N. Plasticity of the Arabidopsis root system under nutrient deficiencies. Plant Physiol. 2013, 163, 161–179. [Google Scholar] [CrossRef] [PubMed] [Green Version]
- Kidwell, K.K.; Shelton, G.B.; Demacon, V.L.; Burns, J.W.; Carter, B.P.; Chen, X.M.; Morris, C.F.; Bosque Perez, N.A. Registration of ‘Louise’ wheat. Crop Sci. 2006, 46, 1384–1386. [Google Scholar] [CrossRef] [Green Version]
- Speakman, J.B.; Kruger, W. A comparison of methods to surface sterilize wheat seeds. Trans. Brit. Mycol. Soc. 1983, 80, 374–376. [Google Scholar] [CrossRef]
- Hoagland, D.R.; Arnon, D.I. The Water-Culture Method for Growing Plants without Soil; Agricultural Experiment Station, College of Agriculture, University of California: Berkeley, CA, USA, 1938. [Google Scholar]
- Ruano, A.; Poschenrieder, C.; Barcelo, J. Growth and biomass partitioning in zinc-toxic bush beans. J. Plant Nutr. 1988, 11, 577–588. [Google Scholar] [CrossRef]
- Bergmann, W. Nutritional Disorders of Plants—Development, Visual and Analytical Diagnosis; Gustav Fischer: Verlag Jena, Germany, 1992. [Google Scholar]
- Lange, B.; van der Ent, A.; Baker, A.J.M.; Echevarria, G.; Mahy, G.; Malaisse, F.; Meerts, P.; Pourret, O.; Verbruggen, N.; Faucon, M.-P. Copper and cobalt accumulation in plants: A critical assessment of the current state of knowledge. New Phytol. 2017, 213, 537–551. [Google Scholar] [CrossRef] [PubMed]
- Ozanne, P.; Greenwood, E.; Shaw, T. The cobalt requirement of subterranean clover in the field. Aust. J. Agric. Res. 1963, 14, 39–50. [Google Scholar] [CrossRef]
- Bollard, E.G. Involvement of unusual elements in plant growth and nutrition. In Encyclopedia of Plant Physiology, New Series; Lauchli, A., Bieleski, R.L., Eds.; Springer: Berlin, Germany, 1983; Volume 15B, pp. 695–755. [Google Scholar]
- Poudel, P. An Evaluation of Rumen Modifiers for Lactational Performance and Nutrient Digestibility by Cows. Ph.D. Dissertation, South Dakota State University, Brookings, SD, USA, 2016. [Google Scholar]
- Lei, Z.; Zhang, K.; Li, C.; Jiao, T.; Wu, J.; Wei, Y.; Tian, K.; Li, C.; Tang, D.; Davis, D.I.; et al. Ruminal metagenomic analyses of goat data reveals potential functional microbiota by supplementation with essential oil-cobalt complexes. BMC Microbiol. 2019, 19, 30. [Google Scholar] [CrossRef] [Green Version]
- Neocleous, D.; Nikolaou, G.; Ntatsi, G.; Savvas, D. Impact of chelated or inorganic manganese and zinc applications in closed hydroponic bean crops on growth, yield, photosynthesis, and nutrient uptake. Agronomy 2020, 10, 881. [Google Scholar] [CrossRef]
- Gianquinto, G.; Munoz, P.; Pardossi, A.; Ramazzotti, S.; Savvas, D. Soil Fertility and Plant Nutrition; FAO: Rome, Italy, 2013. [Google Scholar]
- Wang, H.; Shan, X.; Liu, T.; Xie, Y.; Wen, B.; Zhang, S.; Han, F.; van Genuchten, M.T. Organic acids enhance the uptake of lead by wheat roots. Planta 2007, 225, 1483–1494. [Google Scholar] [CrossRef]
- Wang, Z.; Zhang, S.; Shan, X.-Q. Effects of low-molecular-weight organic acids on uptake of lanthanum by wheat roots. Plant Soil 2004, 261, 163–170. [Google Scholar] [CrossRef]
- Srivastava, S.; Nigam, R.; Prakash, S.; Srivastava, M.M. Mobilization of trivalent chromium in presence of organic acids: A hydroponic study of wheat plant (Triticum vulgare). Bull. Environ. Contam. Toxicol. 1999, 63, 524–530. [Google Scholar] [CrossRef] [PubMed]
- Lewis, R.W.; Tang, G.; McNear, D.H. Morphological and genetic changes induced by excess Zn in roots of Medicago truncatula A17 and a Zn accumulating mutant. BMC Res. Notes 2012, 5, 1–14. [Google Scholar] [CrossRef] [Green Version]
- El-Fouly, M.M.; Nofal, O.A.; Mobarak, Z.M. Effects of soil treatment with iron, manganese and zinc on growth and micronutrient uptake of sunflower plants grown in high-pH soil. J. Agron. Crop Sci. 2001, 186, 245–251. [Google Scholar] [CrossRef]
- Imtiaz, M.; Alloway, B.J.; Shah, K.H.; Siddiqui, S.H.; Memon, M.Y.; Aslam, M.; Khan, P. Zinc nutrition of wheat: II: Interaction of zinc with other trace elements. Asian J. Plant Sci. 2003, 2, 156–160. [Google Scholar] [CrossRef] [Green Version]
- Adamczyk-Szabela, D.; Lisowska, K.; Romanowska-Duda, Z.; Wolf, W.M. Combined cadmium-zinc interactions alter manganese, lead, copper uptake by Melissa officinalis. Sci. Rep. 2020, 10, 1675. [Google Scholar] [CrossRef] [PubMed] [Green Version]
- Wang, N.; Qiu, W.; Dai, J.; Guo, X.; Lu, Q.; Wang, T.; Li, S.; Liu, T.; Zuo, Y. AhNRAMP1 enhances manganese and zinc uptake in plants. Front. Plant Sci. 2020, 10, 415. [Google Scholar] [CrossRef] [Green Version]
- Hansel, F.D.; Amado, T.J.C.; Ruiz Diaz, D.A.; Rosso, L.H.M.; Nicoloso, F.T.; Schorr, M. Phosphorus fertilizer placement and tillage affect soybean root growth and drought tolerance. Agron. J. 2017, 109, 2936–2944. [Google Scholar] [CrossRef] [Green Version]
- Backer, R.G.M.; Saeed, W.; Seguin, P.; Smith, D.L. Root traits and nitrogen fertilizer recovery efficiency of corn grown in biochar-amended soil under greenhouse conditions. Plant Soil 2017, 415, 465–477. [Google Scholar] [CrossRef]
- Atkinson, D. Root Characteristics: Why and what to measure. In Root Methods: A Handbook, 1st ed.; Smit, A.L., Bengough, A.G., Engels, C., van Noordwijk, M., Pellerin, S., van de Geijn, S.C., Eds.; Springer: Berlin/Heidelberg, Germany, 2000; pp. 1–32. [Google Scholar]
- Eissenstat, D.M. Costs and benefits of constructing roots of small diameter. J. Plant Nutr. 1992, 15, 763–782. [Google Scholar] [CrossRef]
- Pandey, P.; Irulappan, V.; Bagavathiannan, M.V.; Senthil-Kumar, M. Impact of combined abiotic and biotic stresses on plant growth and avenues for crop improvement by exploiting physio-morphological traits. Front. Plant Sci. 2017, 8, 537. [Google Scholar] [CrossRef] [PubMed] [Green Version]
- Broadley, M.R.; White, P.J.; Hammond, J.P.; Zelko, I.; Lux, A. Zinc in plants. New Phytol. 2007, 173, 677–702. [Google Scholar] [CrossRef]
- Coleman, J.R. Carbonic anhydrase and its role in photosynthesis. In Photosynthesis: Physiology and Metabolism; Leegood, R.C., Sharkey, T.D., von Caemmerer, S., Eds.; Springer: Dordrecht, The Netherlands, 2000; Volume 9, pp. 353–367. [Google Scholar]
- Ohki, K. Effect of zinc nutrition on photosynthesis and carbonic anhydrase activity in cotton. Physiol. Plant. 1976, 38, 300–304. [Google Scholar] [CrossRef]
- Kröniger, W.; Rennenberg, H.; Polle, A. Purification of two superoxide dismutase isozymes and their subcellular localization in needles and roots of norway spruce (Picea abies L.) trees. Plant Physiol. 1992, 100, 334–340. [Google Scholar] [CrossRef] [PubMed] [Green Version]
- Morales, L.; Gutierrez, N.; Maya, V.; Parra, C.; Martinez-Barajas, E.; Coello, P. Purification and characterization of an alkaline phosphatase induced by phosphorus starvation in comm bean (Phaseolus vulgaris L.) roots. J. Mex. Chem. Soc. 2012, 56, 80–84. [Google Scholar]
- Cakmak, I.; Marschner, H. Enhanced superoxide radical production in roots of zinc-deficient plants. J. Exp. Bot. 1988, 39, 1449–1460. [Google Scholar] [CrossRef]
- Cakmak, I.; Marschner, H.; Bangerth, F. Effect of zinc nutritional status on growth, protein metabolism and levels of indole-3-acetic acid and other phytohormones in bean (Phaseolus vulgaris L.). J. Exp. Bot. 1989, 40, 405–412. [Google Scholar] [CrossRef]
- Margalef, O.; Sardans, J.; Fernández-Martínez, M.; Molowny-Horas, R.; Janssens, I.A.; Ciais, P.; Goll, D.; Richter, A.; Obersteiner, M.; Asensio, D.; et al. Global patterns of phosphatase activity in natural soils. Sci. Rep. 2017, 7, 1337. [Google Scholar] [CrossRef] [Green Version]
- Łukowski, A.; Dec, D. Influence of Zn, Cd, and Cu fractions on enzymatic activity of arable soils. Environ. Monit. Assess. 2018, 190, 278. [Google Scholar] [CrossRef] [Green Version]
- Kaczynski, P.; Lozowicka, B.; Hrynko, I.; Wolejko, E. Behaviour of mesotrione in maize and soil system and its influence on soil dehydrogenase activity. Sci. Total Environ. 2016, 571, 1079–1088. [Google Scholar] [CrossRef]
- Burnell, J.N. The biochemistry of manganese in plants. In Manganese in Soils and Plants; Graham, R.D., Hannam, R.J., Uren, N.C., Eds.; Springer: Dordrecht, The Netherlands, 1988; pp. 125–137. [Google Scholar]
- Onnerud, H.; Zhang, L.; Gellerstedt, G.; Henriksson, G. Polymerization of monolignols by redox shuttle–mediated enzymatic oxidation. Plant Cell 2002, 14, 1953–1962. [Google Scholar] [CrossRef]
- Brown, P.H.; Graham, R.D.; Nicholas, D.J.D. The effects of manganese and nitrate supply on the levels of phenolics and lignin in young wheat plants. Plant Soil 1984, 81, 437–440. [Google Scholar] [CrossRef]
- Rengel, Z. Heavy Metals as Essential Nutrients, 2nd ed.; Springer: Berlin, Germany, 2003. [Google Scholar]
- Kehres, D.G.; Maguire, M.E. Emerging themes in manganese transport, biochemistry and pathogenesis in bacteria. FEMS Microbiol. Rev. 2003, 27, 263–290. [Google Scholar] [CrossRef] [Green Version]
- Janusz, G.; Pawlik, A.; Sulej, J.; Świderska-Burek, U.; Jarosz-Wilkołazka, A.; Paszczyński, A. Lignin degradation: Microorganisms, enzymes involved, genomes analysis and evolution. FEMS Microbiol. Rev. 2017, 41, 941–962. [Google Scholar] [CrossRef] [Green Version]
- Rothschild, N.; Levkowitz, A.; Hadar, Y.; Dosoretz, C.G. Manganese deficiency can replace high oxygen levels needed for lignin peroxidase formation by Phanerochaete chrysosporium. Appl. Environ. Microbiol. 1999, 65, 483–488. [Google Scholar] [CrossRef] [Green Version]
- Yruela, I. Copper in plants. Braz. J. Plant Physiol. 2005, 17, 145–156. [Google Scholar] [CrossRef] [Green Version]
- Parveen, I.; Threadgill, M.D.; Moorby, J.M.; Winters, A. Oxidative phenols in forage crops containing polyphenol oxidase enzymes. J. Agric. Food Chem. 2010, 58, 1371–1382. [Google Scholar] [CrossRef]
- Maccarrone, M.; Rossi, A.; Avigliano, L.; Agro, A.F. Activity and expression of diamine oxidase in lentil seedling under different growth conditions. Plant Sci. 1991, 79, 51–55. [Google Scholar] [CrossRef]
- Walters, D. Resistance to plant pathogens: Possible roles for free polyamines and polyamine catabolism. New Phytol. 2003, 159, 109–115. [Google Scholar] [CrossRef] [PubMed]
- Angelini, R.; Manes, F.; Federico, R. Spatial and functional correlation between diamine-oxidase and peroxidase activities and their dependence upon de-etiolation and wounding in chick-pea stems. Planta 1990, 182, 89–96. [Google Scholar] [CrossRef] [PubMed]
- Delhaize, E.; Loneragan, J.F.; Webb, J. Development of three copper metalloenzymes in clover leaves. Plant Physiol. 1985, 78, 4–7. [Google Scholar] [CrossRef]
- Gomaa, O.M.; Momtaz, O.A. Copper induction and differential expression of laccase in Aspergillus flavus. Braz. J. Microbiol. 2015, 46, 285–292. [Google Scholar] [CrossRef] [PubMed] [Green Version]
- Levasseur, A.; Drula, E.; Lombard, V.; Coutinho, P.M.; Henrissat, B. Expansion of the enzymatic repertoire of the CAZy database to integrate auxiliary redox enzymes. Biotechnol. Biofuels 2013, 6, 41. [Google Scholar] [CrossRef] [PubMed] [Green Version]
- Palmieri, G.; Giardina, P.; Bianco, C.; Fontanella, B.; Sannia, G. Copper induction of laccase isoenzymes in the ligninolytic fungus Pleurotus ostreatus. Appl. Environ. Microbiol. 2000, 66, 920–924. [Google Scholar] [CrossRef] [Green Version]
- Eskew, D.L.; Welch, R.M.; Norvell, W.A. Nickel in higher plants: Further evidence for an essential role. Plant Physiol. 1984, 76, 691–693. [Google Scholar] [CrossRef] [PubMed] [Green Version]
- Freyermuth, S.K.; Bacanamwo, M.; Polacco, J.C. The soybean Eu3 gene encodes an Ni-binding protein necessary for urease activity. Plant J. 2000, 21, 53–60. [Google Scholar] [CrossRef]
- Shimada, N.; Ando, T. Role of nickel in plant nutrition (2). Effect of nickel on the assimilation of urea by plants. Jpn. J. Soil Sci. Plant Nutr. 1980, 51, 493–496. [Google Scholar]
- Shimada, H.; Matsuo, A. Role of nickel in plant nutrition (3). Effects of nickel on the growth of plants and the assimilation of urea by cucumber and barley. Jpn. J. Soil Sci. Plant Nutr. 1985, 51, 257–263. [Google Scholar]
- Krogmeier, M.J.; McCarty, G.W.; Shogren, D.R.; Bremner, J.M. Effect of nickel deficiency in soybeans on the phytotoxicity of foliar-applied urea. Plant Soil 1991, 135, 283–286. [Google Scholar] [CrossRef]
- Dalton, D.A.; Evans, H.J.; Hanus, F.J. Stimulation by nickel of soil microbial urease activity and urease and hydrogenase activities in soybeans grown in a low-nickel soil. Plant Soil 1985, 88, 245–258. [Google Scholar] [CrossRef]
- Dilworth, M.J.; Bisseling, T. Cobalt and nitrogen fixation in Lupinus angustifolius L. New Phytol. 1984, 98, 311–316. [Google Scholar] [CrossRef]
- Dilworth, M.J.; Robson, A.D.; Chatel, D.L. Cobalt and nitrogen fixation in Lupinus angustifolius L. II. Nodule formation and function. New Phytol. 1979, 83, 63–79. [Google Scholar] [CrossRef] [Green Version]
- Bender, S.F.; Wagg, C.; van der Heijden, M.G.A. An underground revolution: Biodiversity and soil ecological engineering for agricultural sustainability. Trends Ecol. Evol. 2016, 31, 440–452. [Google Scholar] [CrossRef] [PubMed]
- Backer, R.; Rokem, J.S.; Ilangumaran, G.; Lamont, J.; Praslickova, D.; Ricci, E.; Subramanian, S.; Smith, D.L. Plant growth-promoting rhizobacteria: Context, mechanisms of action, and roadmap to commercialization of biostimulants for sustainable agriculture. Front. Plant Sci. 2018, 9, 1473. [Google Scholar] [CrossRef] [Green Version]
- Yaseen, M.; Ahmad, T.; Sablok, G.; Standardi, A.; Hafiz, I.A. Review: Role of carbon sources for in vitro plant growth and development. Mol. Biol. Rep. 2013, 40, 2837–2849. [Google Scholar] [CrossRef] [PubMed]
Figure 1.
The effect of zinc (Zn) lactate concentration on primary root (PR) growth rate in Arabidopsis thaliana. Differences between means were compared using Tukey’s Honest Significant Difference test, where different letters indicate a statistically significant difference between treatment concentrations in their respective day of growth. Error bars denote means ± SE (n = 53–78).

Figure 2.
The effect of manganese (Mn) lactate concentration on primary root (PR) growth rate in Arabidopsis thaliana. Differences between means were compared using Tukey’s Honest Significant Difference test, where different letters indicate a statistically significant difference between treatment concentrations in their respective day of growth. Error bars denote means ± SE (n = 51–63).

Figure 3.
The effect of copper (Cu) lactate concentration on primary root (PR) growth rate in Arabidopsis thaliana. Differences between means were compared using Tukey’s Honest Significant Difference test, where different letters indicate a statistically significant difference between treatment concentrations in their respective day of growth. Error bars denote means ± SE (n = 60–82).

Figure 4.
The effect of nickel (Ni) lactate concentration on primary root (PR) growth rate in Arabidopsis thaliana. Differences between means were compared using Tukey’s Honest Significant Difference test, where different letters indicate a statistically significant difference between treatment concentrations in their respective day of growth. Error bars denote means ± SE (n = 34–95).

Figure 5.
The effect of cobalt (Co) lactate concentration on primary root (PR) growth rate in Arabidopsis thaliana. Differences between means were compared using Tukey’s Honest Significant Difference test, where different letters indicate a statistically significant difference between treatment concentrations in their respective day of growth. Error bars show means ± SE (n = 40–74).


Table 1.
Plant growth parameter results for zinc (Zn) treatments. After 13 days of growth, wheat seedlings were harvested, and shoot length was measured along with fresh weight (FW) and dry weight (DW) of both root and shoot tissue. A t-test was used to identify differences between zinc chloride and zinc lactate treatments within each treatment level for each plant growth parameter, where superscripts “a” and “b” denote treatment differences of p < 0.05. ±: standard deviation.
| Treatment Conc. | Treatment | Shoot Length (cm) | Shoot FW (mg) | Shoot DW (mg) | Root FW (mg) | Root DW (mg) |
|---|---|---|---|---|---|---|
| 0 mM | Control | 35.7 ± 19.4 | 358.6 ± 48.0 | 36.6 ± 5.9 | 186.7 ± 45.6 | 11.4 ± 2.4 |
| 0.343 mM | ZnCl2 | 35.2 ± 0.7 | 303.0 ± 53.6 | 33.2 ± 3.9 | 155.6 ± 33.2 | 13.5 ± 3.8 |
| Zn Lactate | 34.7 ± 1.5 | 299.3 ± 54.1 | 32.1 ± 7.6 | 140.3 ± 52.5 | 10.2 ± 5.4 | |
| 3.43 mM | ZnCl2 | 14.6 ± 7.4 | 104.6 ± 52.9 | 17.9 ± 9.1 | 47.1 ± 14.1 | 6.9 ± 0.7 |
| Zn Lactate | 18.5 ± 2.8 | 149.6 ± 19.3 | 26.9 ± 6.5 | 42.1 ± 10.2 | 9.4 ± 5.6 | |
| 34.3 mM | ZnCl2 | 2.8 ± 0.7 a | 17.4 ± 4.8 | 26.0 ± 4.7 | ||
| Zn Lactate | 4.5 ± 1.4 b | 24.7 ± 5.6 | 21.0 ± 9.0 | |||
| 100 mM | ZnCl2 | 1.3 ± 0.4 | 9.6 ± 5.0 | 16.7 ± 7.5 | ||
| Zn Lactate | 0.9 ± 0.3 | 5.1 ± 1.6 | 12.4 ± 5.6 |
Table 2.
Mean concentration of Co, Cu, Mn, Ni and Zn in the root and shoot tissues of wheat grown with zinc chloride or zinc lactate. Control samples did not receive any zinc supplementation. Different letters indicate a statistically significant difference between treatment concentrations and control (p < 0.05; Fisher’s LSD Test). The “†” symbol indicates that the mean was derived from one or more replicates with metal concentrations below the instrument detection limit (DL) and were substituted with values equal to the DL/2. Superscripts “x” and “y” denote a significant difference between zinc chloride and zinc lactate (p < 0.05; simple t-test). Standard error is denoted in parenthesis; n = 5. NS: not significant.
| Metal | Root | Shoot | ||
|---|---|---|---|---|
| ZnCl2 | Zn Lactate | ZnCl2 | Zn Lactate | |
| Cobalt (ng g−1) | ||||
| Control | 35.0 (0.0) a † | 35.0 (0.0) a † | 30.0 (5.0) a † | 30.0 (5.0) a † |
| 0.343 mM | 35.0 (0.0) a † | 102.8 (67.8) a † | 36.9 (1.9) a † | 43.2 (6.0) a † |
| 3.43 mM | 71.7 (36.7) a † | 173.3 (138.3) a † | 468.8 (403.4) a † | 54.8 (25.9) a † |
| p value | NS | NS | NS | NS |
| LSD0.05 | 65.3 | 274.0 | 717.7 | 48.2 |
| Copper (ng g−1) | ||||
| Control | 2.3 (0.2) a † | 2.3 (0.2) a † | 6.0 (1.4) a † | 6.0 (1.4) a † |
| 0.343 mM | 5.0 (1.9) a † | 4.9 (1.7) a † | 3.2 (0.8) ab † | 2.4 (0.7) b † |
| 3.43 mM | 2.5 (0.0) a † | 3.7 (1.2) a † | 2.5 (0.0) b † | 2.5 (0.0) b † |
| p value | NS | NS | 0.04 | 0.02 |
| LSD0.05 | 3.4 | 3.8 | 2.9 | 2.8 |
| Manganese (ng g−1) | ||||
| Control | 181.2 (25.4) a | 181.2 (25.4) a | 71.5 (8.3) a | 71.5 (8.3) a |
| 0.343 mM | 57.6 (5.3) b | 44.6 (3.1) b | 43.0 (2.0) a | 39.4 (2.5) b |
| 3.43 mM | 53.0 (9.7) b | 60.7 (11.2) b | 52.0 (18.1) a | 31.7 (2.6) b |
| p value | <0.001 | <0.001 | NS | <0.001 |
| LSD0.05 | 49.3 | 49.7 | 35.6 | 16.2 |
| Nickel (ng g−1) | ||||
| Control | 3.3 (2.0) a † | 3.3 (2.0) a † | 1.3 (0.6) a † | 1.3 (0.6) a † |
| 0.343 mM | 3.5 (1.9) a † | 10.2 (4.8) a † | 0.8 (0.5) a † | 1.8 (0.7) a † |
| 3.43 mM | 5.7 (3.5) a † | 5.6 (2.9) a † | 20.9 (17.8) a † | 2.6 (1.1) a † |
| p value | NS | NS | NS | NS |
| LSD0.05 | 7.9 | 10.6 | 31.7 | 2.6 |
| Zinc (ng g−1) | ||||
| Control | 670.3 (42.6) c | 670.3 (42.6) b | 101.2 (12.7) b | 101.2 (12.7) b |
| 0.343 mM | 5576.6 (438.1) b | 8129.7 (1089.1) a | 717.3 (122.0) ab | 1409.2 (720.4) ab |
| 3.43 mM | 11,975.6 (1131.3) ay | 6729.1 (1842.2) ax | 5329.2 (2908.2) a | 2157.0 (448.9) a |
| p value | <0.001 | 0.002 | NS | 0.03 |
| LSD0.05 | 2159.6 | 3807.9 | 5178.4 | 1510.2 |
Table 3.
Plant growth parameter results for manganese (Mn) treatments. After 13 days of growth, wheat seedlings were harvested, and shoot length was measured along with fresh weight (FW) and dry weight (DW) of both root and shoot tissue. A t-test was used to identify differences between manganese chloride and manganese lactate treatments within each treatment level for each plant growth parameter, where superscripts “a” and “b” denote treatment differences of p < 0.05. ±: standard deviation.
| Treatment Conc. | Treatment | Shoot Length (cm) | Shoot FW (mg) | Shoot DW (mg) | Root FW (mg) | Root DW (mg) |
|---|---|---|---|---|---|---|
| 0 mM | Control | 34.0 ± 2.0 | 297.4 ± 64.6 | 32.1 ± 7.5 | 122.4 ± 29.3 | 8.2 ± 2.8 |
| 0.343 mM | MnCl2 | 24.5 ± 12.7 | 202.0 ± 105.4 | 22.4 ± 11.4 | 81.0 ± 34.6 | 5.5 ± 2.8 |
| Mn Lactate | 28.9 ± 2.0 | 262.8 ± 47.1 | 26.9 ± 4.5 | 114.88 ± 23.3 | 8.3 ± 2.1 | |
| 3.43 mM | MnCl2 | 18.3 ± 7.7 | 147.6 ± 46.1 a | 21.5 ±8.1 | 80.2 ± 18.2 | 5.5 ± 1.6 |
| Mn Lactate | 22.9 ± 2.9 | 209.8 ± 21.7 b | 29.2 ± 3.8 | 66.6 ± 14.8 | 4.1 ± 0.9 | |
| 34.3 mM | MnCl2 | 12.9 ± 4.1 | 51.4 ± 27.7 | 22.0 ± 6.2 | ||
| Mn Lactate | 11.2 ± 3.2 | 41.8 ± 12.3 | 24.5 ± 8.1 | |||
| 100 mM | MnCl2 | 2.8 ± 0.5 | 11.6 ± 5.6 | 14.8 ± 7.7 | ||
| Mn Lactate | 4.9 ± 2.4 | 19.0 ± 9.9 | 24.8 ± 9.9 |
Table 4.
Mean concentration of Co, Cu, Mn, Ni and Zn in the root and shoot tissues of wheat grown with manganese chloride or manganese lactate. Control samples did not receive any manganese supplementation. Different letters indicate a statistically significant difference between treatment concentrations and control (p < 0.05; Fisher’s LSD Test). The “†” symbol indicates that the mean was derived from one or more replicates with metal concentrations below the instrument detection limit (DL) and were substituted with values equal to the DL/2. No significant differences in tissue metal concentrations were detected between manganese chloride and manganese lactate at any concentration for any metal analyzed (p < 0.05; simple t-test). Standard error is denoted in parenthesis; n = 5. NS: not significant.
| Metal | Root | Shoot | ||
|---|---|---|---|---|
| MnCl2 | Mn Lactate | MnCl2 | Mn Lactate | |
| Cobalt (ng g−1) | ||||
| Control | 356.4 (87.2) a † | 356.4 (87.2) a † | 104.6 (29.3) a | 104.6 (29.3) a |
| 0.343 mM | 383.5 (168.0) a † | 414.3 (93.5) a | 210.2 (131.1) a † | 127.3 (28.9) a |
| 3.43 mM | 388.0 (51.0) a | 493.0 (221.6) a † | 187.8 (55.8) a | 136.2 (32.1) a † |
| p value | NS | NS | NS | NS |
| LSD0.05 | 348.8 | 455.1 | 258.8 | 92.9 |
| Copper (ng g−1) | ||||
| Control | 2.5 (0.0) a † | 2.5 (0.0) a † | 2.5 (0.0) a † | 2.5 (0.0) a † |
| 0.343 mM | 2.5 (0.0) a † | 2.5 (0.0) a † | 2.6 (0.1) a † | 2.8 (0.3) a † |
| 3.43 mM | 70.5 (68.0) a † | 2.5 (0.0) a † | 2.1 (0.4) a † | 3.8 (1.3) a † |
| p value | NS | 0.01 | NS | NS |
| LSD0.05 | 121.0 | <0.001 | 0.7 | 2.3 |
| Manganese (ng g−1) | ||||
| Control | 59.6 (7.5) c | 59.6 (7.5) c | 34.8 (3.1) b | 34.8 (3.1) b |
| 0.343 mM | 2536.3 (399.5) b | 2260.8 (412.6) b | 1648.8 (181.1) b | 1251.8 (74.5) b |
| 3.43 mM | 9364.0 (965.5) a | 11,235.9 (1025.4) a | 8076.7 (3230.5) a | 3248.9 (995.3) a † |
| p value | <0.001 | <0.001 | 0.02 | 0.006 |
| LSD0.05 | 1858.9 | 1966.3 | 5756.1 | 1775.6 |
| Nickel (ng g−1) | ||||
| Control | 16.5 (3.2) a | 16.5 (3.2) a | 5.3 (1.1) a | 5.3 (1.1) a |
| 0.343 mM | 21.6 (4.1) a | 14.9 (4.0) a | 8.5 (6.6) a † | 3.8 (0.3) a |
| 3.43 mM | 46.1 (31.7) a | 16.9 (5.1) a | 4.4 (1.2) a | 4.0 (0.6) a |
| p value | NS | NS | NS | NS |
| LSD0.05 | 57.1 | 12.8 | 12.1 | 2.3 |
| Zinc (ng g−1) | ||||
| Control | 407.9 (62.1) a | 407.9 (62.1) a | 56.4 (7.1) a | 56.4 (7.1) ab |
| 0.343 mM | 287.4 (125.3) a † | 336.6 (84.5) a | 165.4 (130.2) a † | 64.6 (11.4) a |
| 3.43 mM | 456.8 (204.1) a | 99.3 (62.3) b † | 58.5 (27.1) a | 30.8 (8.4) b |
| p value | NS | 0.02 | NS | NS |
| LSD0.05 | 440.2 | 217.0 | 440.2 | 28.2 |
Table 5.
Plant growth parameter results for copper (Cu) treatments. After 13 days of growth, wheat seedlings were harvested, and shoot length was measured along with fresh weight (FW) and dry weight (DW) of both root and shoot tissue. A t-test was used to identify differences between copper chloride and copper lactate within each treatment level for each plant growth parameter, where superscripts “a” and “b” denote treatment differences of p < 0.05. ±: standard deviation.
| Treatment Conc. | Treatment | Shoot Length (cm) | Shoot FW (mg) | Shoot DW (mg) | Root FW (mg) | Root DW (mg) |
|---|---|---|---|---|---|---|
| 0 mM | Control | 35.1 ± 1.7 | 336.8 ± 66.5 | 32.2 ± 5.7 | 151.2 ± 46.6 | 9.2 ± 2.8 |
| 0.343 mM | CuCl2 | 22.2 ± 4.0 | 177.0 ± 36.9 | 22.6 ± 6.4 | 50.3 ± 6.7 | 5.4 ± 0.6 |
| Cu Lactate | 24.3 ± 3.7 | 166.4 ± 47.5 | 22.9 ± 7.2 | 42.8 ± 16.2 | 4.8 ± 1.8 | |
| 3.43 mM | CuCl2 | 2.3 ± 0.8 | 12.0 ± 5.2 | 3.2 ± 2.5 | 20.6 ± 6.7 | 2.0 ± 1.0 a |
| Cu Lactate | 4.2 ± 3.0 | 23.2 ± 21.1 | 4.5 ± 5.0 | 22.7 ± 6.7 | 3.3 ± 0.4 b | |
| 34.3 mM | CuCl2 | 1.5 ±0.5 | 9.9 ± 4.2 | 18.6 ± 2.5 | ||
| Cu Lactate | 1.4 ± 0.5 | 6.4 ± 2.2 | 16.2 ± 6.5 | |||
| 100 mM | CuCl2 | 1.2 ± 0.3 | 7.7 ± 4.8 | 16.7 ± 5.0 | ||
| Cu Lactate | 0.9 ± 0.2 | 7.0 ± 2.9 | 8.0 ± 8.4 |
Table 6.
Mean concentration of Co, Cu, Mn, Ni and Zn in the root and shoot tissues of wheat grown with copper chloride or copper lactate. Control samples did not receive any copper supplementation. Different letters indicate a statistically significant difference between treatment concentrations and control (p < 0.05; Fisher’s LSD Test). The “†” symbol indicates that the mean was derived from one or more replicates with metal concentrations below the instrument detection limit (DL) and were substituted with values equal to the DL/2. No significant differences in tissue metal concentrations were detected between copper chloride and copper lactate of any concentration for any metal analyzed (p < 0.05; simple t-test). Standard error is denoted in parenthesis; n = 5 (“‡” indicates n = 4). NS: not significant; NA: not available.
| Metal | Root | Shoot | ||
|---|---|---|---|---|
| CuCl2 | Cu Lactate | CuCl2 | Cu Lactate | |
| Cobalt (ng g−1) | ||||
| Control | 761.3 (215.9) b † | 761.3 (215.9) b † | 159.5 (50.6) b † | 159.5 (50.6) b † |
| 0.343 mM | 783.0 (260.8) ab † | 738.6 (353.0) b † | 298.1 (99.9) ab † | 239.8 (90.4) b † |
| 3.43 mM | 4372.1 (1994.7) a | 2291.5 (390.4) a | 2540.0 (1287.0) a † | 1419.2 (370.1) a ‡ |
| p value | NS | 0.008 | NS | 0.001 |
| LSD0.05 | 3599.4 | 1012.1 | 2298.3 | NA |
| Copper (ng g−1) | ||||
| Control | 2.5 (0.0) b † | 2.5 (0.0) b † | 5.8 (1.8) b † | 5.8 (1.8) b † |
| 0.343 mM | 1801.2 (146.4) b | 1846.5 (373.8) b | 56.9 (2.4) b | 70.4 (16.0) b |
| 3.43 mM | 29,219.0 (9319.8) a | 14,115.1 (1048.5) a | 15,002.2 (4947.8) a | 2309.6 (765.8) a ‡ |
| p value | 0.004 | <0.001 | 0.004 | 0.002 |
| LSD0.05 | 16,581.9 | 1980.3 | 8802.0 | NA |
| Manganese (ng g−1) | ||||
| Control | 181.0 (40.1) a | 181.0 (40.1) a | 82.0 (8.4) a | 82.0 (8.4) a |
| 0.343 mM | 57.1 (7.8) b | 56.9 (7.3) b | 37.4 (2.3) b | 40.1 (3.0) b |
| 3.43 mM | 95.0 (25.7) b | 62.9 (8.5) b | 104.7 (19.4) a | 58.5 (8.7) b ‡ |
| p value | 0.02 | 0.005 | 0.007 | 0.005 |
| LSD0.05 | 85.8 | 74.0 | 37.8 | NA |
| Nickel (ng g−1) | ||||
| Control | 12.9 (5.5) b | 12.9 (5.5) ab | 1.7 (0.3) a | 1.7 (0.3) a |
| 0.343 mM | 7.3 (2.1) b † | 3.5 (2.1) b † | 2.4 (0.6) a † | 2.2 (0.8) a † |
| 3.43 mM | 40.2 (11.2) a | 20.8 (5.0) a | 20.2 (12.9) a † | 9.1 (4.6) a †‡ |
| p value | 0.017 | 0.05 | NS | NS |
| LSD0.05 | 22.5 | 13.8 | 22.9 | NA |
| Zinc (ng g−1) | ||||
| Control | 1013.2 (124.0) a | 1013.2 (124.0) a | 148.6 (6.1) a | 148.6 (6.1) ab |
| 0.343 mM | 245.9 (61.2) b † | 230.0 (84.4) b † | 81.2 (10.7) a | 75.3 (16.8) b |
| 3.43 mM | 581.7 (182.1) b | 269.0 (14.1) b | 190.8 (82.2) a † | 183.7 (60.6) a ‡ |
| p value | 0.005 | <0.001 | NS | NS |
| LSD0.05 | 406.8 | 268.0 | 147.8 | NA |
Table 7.
Plant growth parameter results for nickel (Ni) treatments. After 13 days of growth, wheat seedlings were harvested, and shoot length was measured along with fresh weight (FW) and dry weight (DW) of both root and shoot tissue. A t-test was used to identify differences between nickel chloride and nickel lactate treatments within each treatment level for each plant growth parameter, where superscripts “a” and “b” denote treatment differences of p < 0.05. ±: standard deviation.
| Treatment Conc. | Treatment | Shoot Length (cm) | Shoot FW (mg) | Shoot DW (mg) | Root FW (mg) | Root DW (mg) |
|---|---|---|---|---|---|---|
| 0 mM | Control | 32.4 ± 3.4 | 353.7 ± 41.8 | 35.6 ± 5.8 | 165.9 ± 36.5 | 10.6 ± 2.2 |
| 0.343 mM | NiCl2 | 19.5 ± 4.5 a | 139.4 ± 39.9 a | 22.9 ± 7.4 | 46.5 ± 15.5 | 5.4 ± 1.4 |
| Ni Lactate | 27.1 ± 4.1 b | 221.7 ± 63.4 b | 27.8 ± 5.6 | 73.3 ± 25.7 | 6.3 ± 1.8 | |
| 3.43 mM | NiCl2 | 3.5 ± 1.1 | 29.2 ± 14.7 | 6.8 ± 2.3 | 23.2 ± 9.7 | 3.9 ± 1.5 |
| Ni Lactate | 3.9 ± 1.3 | 25.4 ± 7.2 | 6.7 ± 2.9 | 23.3 ± 6.3 | 4.1 ± 0.8 | |
| 34.3 mM | NiCl2 | 2.1 ± 0.6 a | 12.8 ± 4.9 | 24.7 ± 11.2 | ||
| Ni Lactate | 3.4 ± 0.8 b | 26.9 ± 11.2 | 36.3 ± 11.9 | |||
| 100 mM | NiCl2 | 2.3 ± 0.3 a | 12.6 ± 2.1 a | 22.7 ± 3.5 | ||
| Ni Lactate | 3.3 ± 0.4 b | 22.9 ± 1.7 b | 30.1 ± 12.3 |
Table 8.
Mean concentration of Co, Cu, Mn, Ni and Zn in the root and shoot tissues of wheat grown with nickel chloride or nickel lactate. Control samples did not receive any nickel supplementation. Different letters indicate a statistically significant difference between treatment concentrations and control (p < 0.05; Fisher’s LSD Test). The “†” symbol indicates that the mean was derived from one or more replicates with metal concentrations below the instrument detection limit (DL) and were substituted with values equal to the DL/2. Superscripts “x” and “y” denote a significant difference between nickel chloride and nickel lactate at the specified concentration (p < 0.05; simple t-test). Standard error is denoted in parenthesis; n = 5. NS: not significant; NA: not available.
| Metal | Root | Shoot | ||
|---|---|---|---|---|
| NiCl2 | Ni Lactate | NiCl2 | Ni Lactate | |
| Cobalt (ng g−1) | ||||
| Control | 183.2 (29.6) a | 183.2 (29.6) a | 35.0 (0.0) a † | 35.0 (0.0) a † |
| 0.343 mM | 35.0 (0.0) b † | 35.0 (0.0) b † | 35.0 (0.0) a † | 35.0 (0.0) a † |
| 3.43 mM | 35.0 (0.0) b † | 35.0 (0.0) b † | 35.0 (0.0) a † | 35.0 (0.0) a † |
| p value | <0.001 | <0.001 | NA | NA |
| LSD0.05 | 52.6 | 52.6 | NA | NA |
| Copper (ng g−1) | ||||
| Control | 2.5 (0.0) a † | 2.5 (0.0) a † | 2.5 (0.0) a † | 2.5 (0.0) a † |
| 0.343 mM | 2.5 (0.0) a † | 6.5 (4.0) a † | 2.5 (0.0) a † | 2.5 (0.0) a † |
| 3.43 mM | 2.5 (0.0) a † | 2.5 (0.0) a † | 2.5 (0.0) a † | 2.5 (0.0) a † |
| p value | NA | NS | NA | NA |
| LSD0.05 | NA | 7.1 | NA | NA |
| Manganese (ng g−1) | ||||
| Control | 134.3 (12.1) a | 134.3 (12.1) a | 57.9 (4.6) a | 57.9 (4.6) a |
| 0.343 mM | 32.6 (7.9) b | 95.8 (22.4) ab | 60.6 (29.1) a | 66.9 (16.5) a |
| 3.43 mM | 10.4 (3.0) b † | 38.7 (23.6) b | 17.9 (3.5) a | 21.9 (2.7) b |
| p value | <0.001 | 0.02 | NS | 0.02 |
| LSD0.05 | 26.3 | 61.8 | 52.8 | 30.8 |
| Nickel (ng g−1) | ||||
| Control | 0.25 (0.0) b † | 0.25 (0.0) b † | 0.25 (0.0) b † | 0.25 (0.0) b † |
| 0.343 mM | 1086.9 (64.7) b | 1286.1 (192.3) a | 598.6 (32.9) by | 252.0 (28.4) bx |
| 3.43 mM | 4956.9 (662.7) ay | 993.7 (132.4) ax | 4340.3 (961.6) a | 2287.1 (531.1) a |
| p value | <0.001 | <0.001 | <0.001 | <0.001 |
| LSD0.05 | 1184.5 | 415.3 | 1711.8 | 946.2 |
| Zinc (ng g−1) | ||||
| Control | 385.1 (29.5) a | 385.1 (29.5) a | 90.8 (7.7) a | 90.8 (7.7) a |
| 0.343 mM | 330.8 (29.5) a | 360.1 (42.5) a | 62.7 (4.9) a | 61.0 (3.9) a |
| 3.43 mM | 415.6 (90.7) a | 291.1 (12.9) a | 120.8 (48.8) a | 89.3 (15.4) a |
| p value | NS | NS | NS | NS |
| LSD0.05 | 177.7 | 94.9 | 88.4 | 31.4 |
Table 9.
Plant growth parameter results for cobalt (Co) treatments. After 13 days of growth, wheat seedlings were harvested, and shoot length was measured along with fresh weight (FW) and dry weight (DW) of both root and shoot tissue. A t-test was used to identify differences between cobalt chloride and cobalt lactate treatments within each treatment level for each plant growth parameter, where superscripts “a” and “b” denote treatment differences of p < 0.05. ±: standard deviation.
| Treatment Conc. | Treatment | Shoot Length (cm) | Shoot FW (mg) | Shoot DW (mg) | Root FW (mg) | Root DW (mg) |
|---|---|---|---|---|---|---|
| 0 mM | Control | 28.6 ± 8.6 | 272.2 ± 64.5 | 28.1 ± 5.3 | 91.3 ± 2.9 | 8.1 ± 2.9 |
| 0.343 mM | CoCl2 | 16.5 ± 4.0 | 132.4 ± 47.1 | 16.7 ± 5.0 | 58.7 ± 12.3 | 6.3 ± 1.3 |
| Co Lactate | 20.1 ± 2.7 | 177.9 ± 40.1 | 20.6 ± 4.3 | 70.8 ± 17.9 | 6.5 ± 1.8 | |
| 3.43 mM | CoCl2 | 8.1 ± 1.5 | 46.6 ± 10.9 | 7.8 ± 2.9 | 28.5 ± 5.9 | 4.3 ± 1.1 a |
| Co Lactate | 7.0 ± 1.5 | 46.5 ± 7.6 | 8.8 ± 2.3 | 29.3 ± 4.6 | 6.4 ± 1.4 b | |
| 34.3 mM | CoCl2 | 2.1 ± 0.3 a | 10.7 ± 2.5 | 21.3 ± 2.2 | ||
| Co Lactate | 2.6 ± 0.4 b | 11.4 ± 3.7 | 19.6 ± 7.9 | |||
| 100 mM | CoCl2 | 1.0 ± 0.3 a | 7.9 ± 1.5 | 18.3 ± 5.7 | ||
| Co Lactate | 1.4 ± 0.2 b | 8.0 ± 2.2 | 19.6 ± 4.4 |
Table 10.
Mean concentration of Co, Cu, Mn, Ni and Zn in the root and shoot tissues of wheat grown with cobalt chloride or cobalt lactate. Control samples did not receive any cobalt supplementation. Different letters indicate a statistically significant difference between treatment concentrations and control (p < 0.05; Fisher’s LSD Test). The “†” symbol indicates that the mean was derived from one or more replicates with metal concentrations below the instrument detection limit (DL) and were substituted with values equal to the DL/2. No significant differences in tissue metal concentrations were detected between cobalt chloride and cobalt lactate at any concentration for any metal analyzed (p < 0.05; simple t-test). Standard error is denoted in parenthesis; n = 5. NS: not significant.
| Metal | Root | Shoot | ||
|---|---|---|---|---|
| CoCl2 | Co Lactate | CoCl2 | Co Lactate | |
| Cobalt (ng g−1) | ||||
| Control | 380.5 (181.9) b † | 380.5 (181.9) c † | 50.2 (15.2) b † | 50.2 (15.2) b † |
| 0.343 mM | 2578.7 (204.5) b | 1984.7 (188.2) b | 836.8 (95.5) b | 799.0 (103.6) b |
| 3.43 mM | 9365.0 (1340.5) a | 7800.2 (678.3) a | 3560.0 (1053.4) a | 4398.3 (1063.5) a |
| p value | <0.001 | <0.001 | 0.004 | <0.001 |
| LSD0.05 | 2433.9 | 1293.4 | 1881.8 | 1901.1 |
| Copper (ng g−1) | ||||
| Control | 28.0 (10.0) a | 28.0 (10.0) a | 5.5 (2.1) a † | 5.5 (2.1) a † |
| 0.343 mM | 16.4 (8.6) ab † | 3.3 (0.8) b † | 2.5 (0.0) a † | 2.1 (0.4) a † |
| 3.43 mM | 2.5 (0.0) b † | 2.5 (0.0) b † | 2.5 (0.0) a † | 2.5 (0.0) a † |
| p value | NS | 0.01 | NS | NS |
| LSD0.05 | 23.4 | 17.8 | 3.8 | 3.9 |
| Manganese (ng g−1) | ||||
| Control | 145.7 (26.5) a | 145.7 (26.5) a | 69.0 (4.9) a | 69.0 (4.9) a |
| 0.343 mM | 54.3 (9.7) a | 46.2 (6.5) b | 48.6 (3.9) b | 51.0 (2.6) b |
| 3.43 mM | 40.4 (8.8) b † | 48.6 (6.7) b | 38.8 (2.9) b | 50.9 (4.7) b |
| p value | 0.002 | 0.001 | <0.001 | 0.01 |
| LSD0.05 | 52.5 | 49.9 | 12.2 | 12.9 |
| Nickel (ng g−1) | ||||
| Control | 119.4 (41.1) a | 119.4 (41.1) a | 6.0 (1.2) a | 6.0 (1.2) a |
| 0.343 mM | 43.3 (43.0) ab † | 0.25 (0.0) b † | 6.2 (5.9) a † | 0.25 (0.0) b † |
| 3.43 mM | 0.25 (0.0) b † | 0.25 (0.0) b † | 0.25 (0.0) a † | 0.25 (0.0) b † |
| p value | NS | 0.005 | NS | <0.001 |
| LSD0.05 | 105.8 | 73.1 | 10.7 | 2.1 |
| Zinc (ng g−1) | ||||
| Control | 249.6 (91.8) a † | 249.6 (91.8) a † | 69.7 (14.6) a | 69.7 (14.6) a |
| 0.343 mM | 98.8 (14.5) ab | 117.0 (16.1) ab | 45.5 (8.8) ab | 61.5 (7.5) ab |
| 3.43 mM | 60.7 (26.9) b | 58.5 (16.5) b † | 20.5 (7.8) b † | 30.9 (9.5) b † |
| p value | NS | NS | 0.02 | NS |
| LSD0.05 | 172.2 | 168.4 | 33.3 | 33.7 |
Publisher’s Note: MDPI stays neutral with regard to jurisdictional claims in published maps and institutional affiliations. |
© 2021 by the authors. Licensee MDPI, Basel, Switzerland. This article is an open access article distributed under the terms and conditions of the Creative Commons Attribution (CC BY) license (https://creativecommons.org/licenses/by/4.0/).
Share and Cite
MDPI and ACS Style
Opdahl, L.J.; Lewis, R.W.; Kalcsits, L.A.; Sullivan, T.S.; Sanguinet, K.A. Plant Uptake of Lactate-Bound Metals: A Sustainable Alternative to Metal Chlorides. Biomolecules 2021, 11, 1085. https://doi.org/10.3390/biom11081085
AMA Style
Opdahl LJ, Lewis RW, Kalcsits LA, Sullivan TS, Sanguinet KA. Plant Uptake of Lactate-Bound Metals: A Sustainable Alternative to Metal Chlorides. Biomolecules. 2021; 11(8):1085. https://doi.org/10.3390/biom11081085
Chicago/Turabian StyleOpdahl, Lee J., Ricky W. Lewis, Lee A. Kalcsits, Tarah S. Sullivan, and Karen A. Sanguinet. 2021. "Plant Uptake of Lactate-Bound Metals: A Sustainable Alternative to Metal Chlorides" Biomolecules 11, no. 8: 1085. https://doi.org/10.3390/biom11081085
Note that from the first issue of 2016, this journal uses article numbers instead of page numbers. See further details here.