
Untargeted Metabolomics Reveals Antidepressant Effects in a Marine Photosynthetic Organism: The Diatom Phaeodactylum tricornutum as a Case Study

 ,
,  , , , , ,
  , ,
, , 
Abstract
:Simple Summary
Abstract
1. Introduction
2. Materials and Methods
2.1. Diatom Growth and Fluoxetine Exposure
2.2. Metabolite Extraction and Fourier-Transform Ion Cyclotron-Resonance Mass Spectrometer (FT-ICR-MS) Analysis
2.3. Data Analysis
3. Results
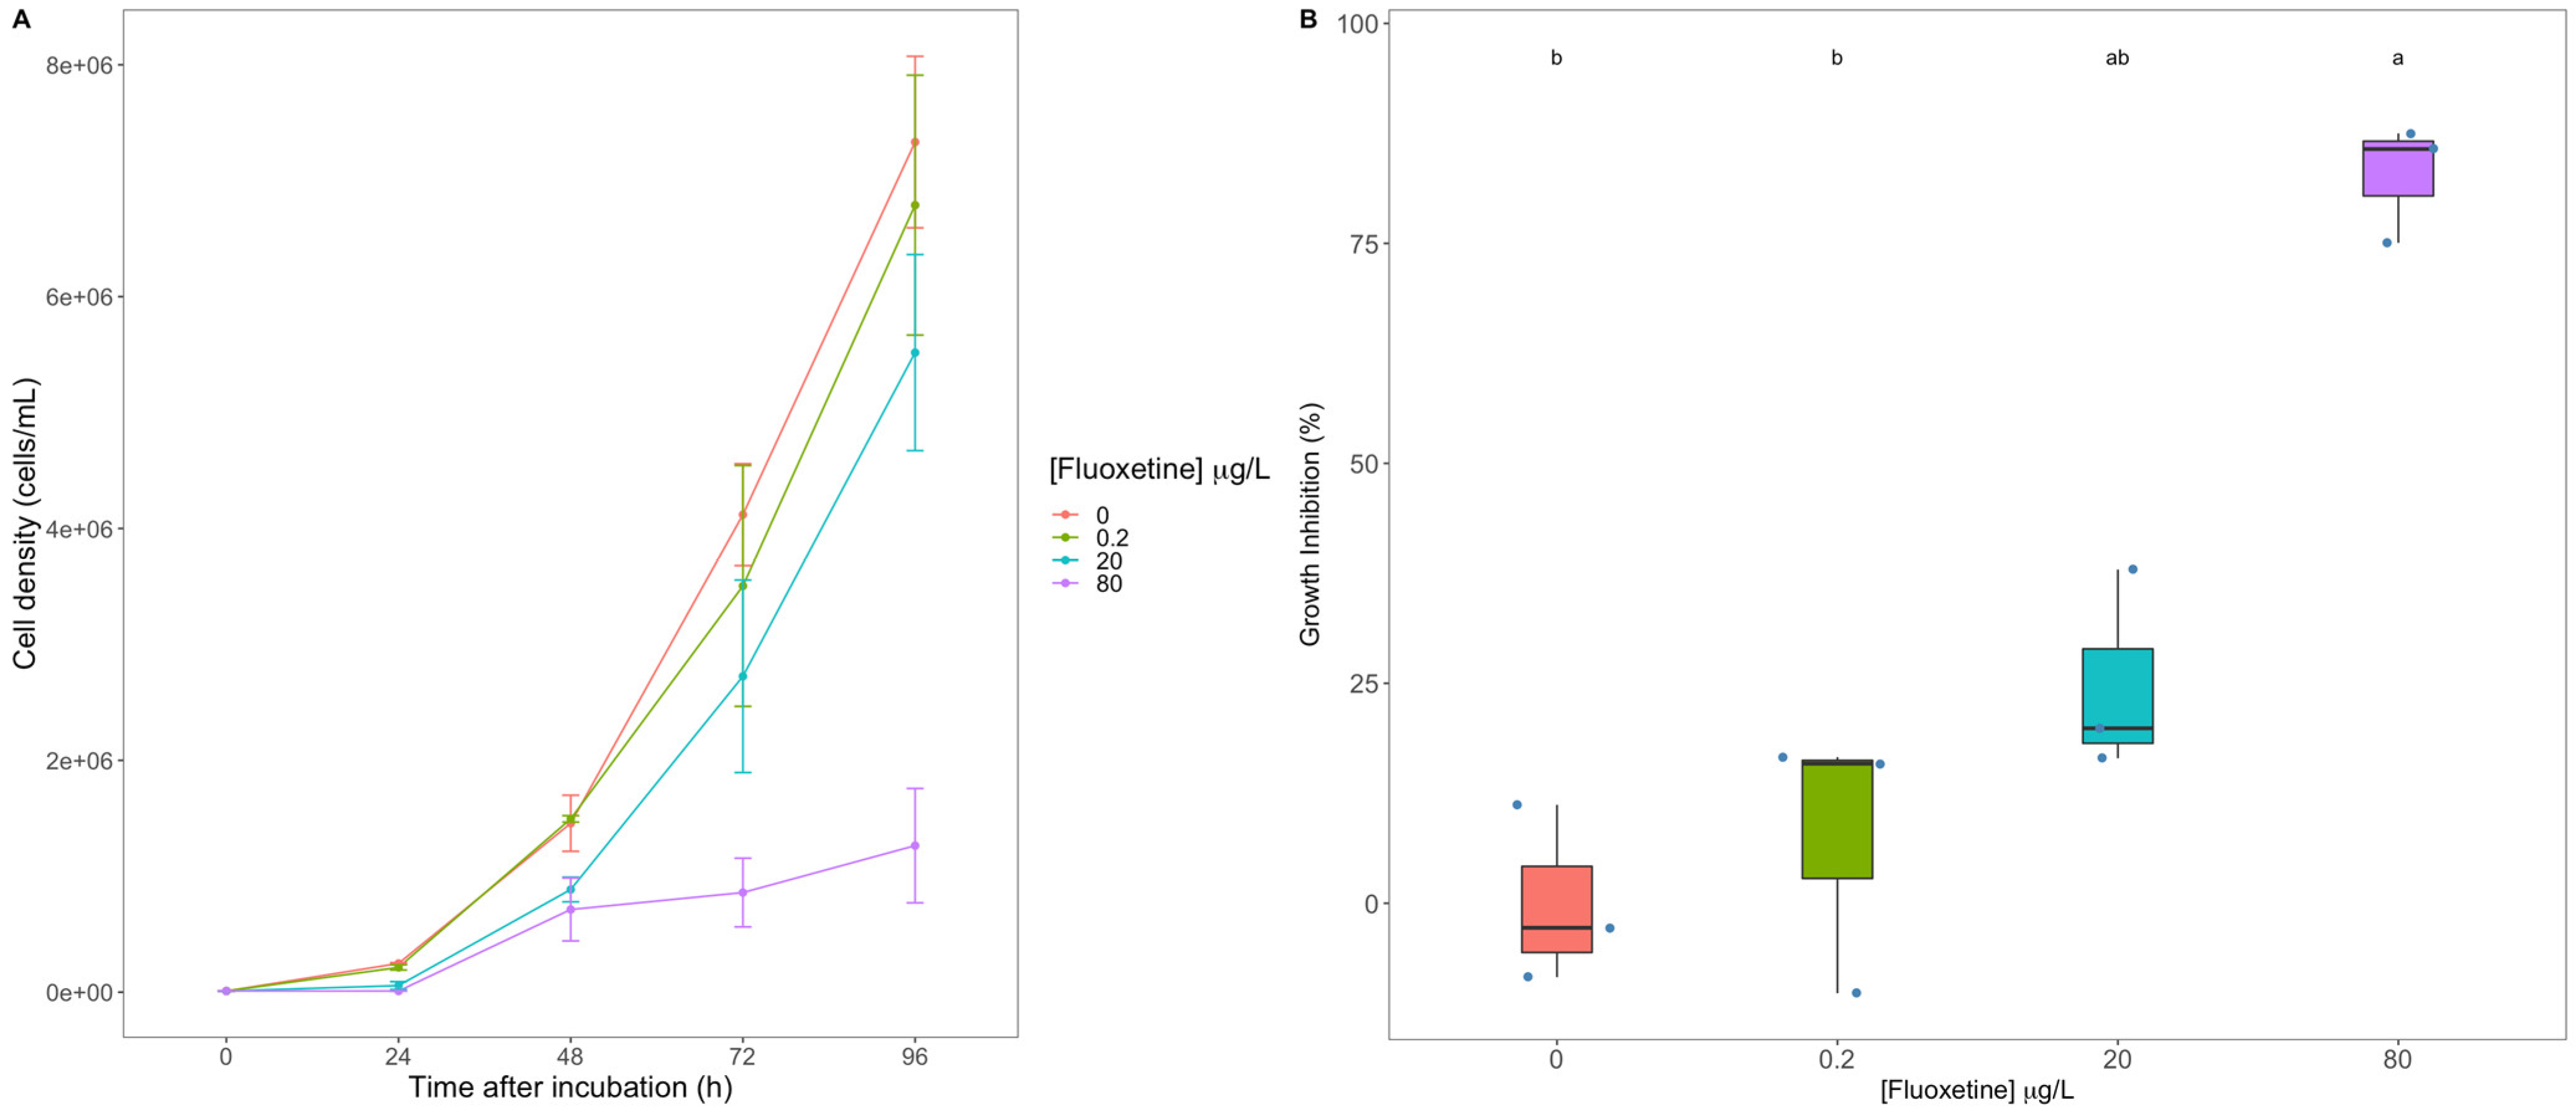
3.1. Diatom Growth
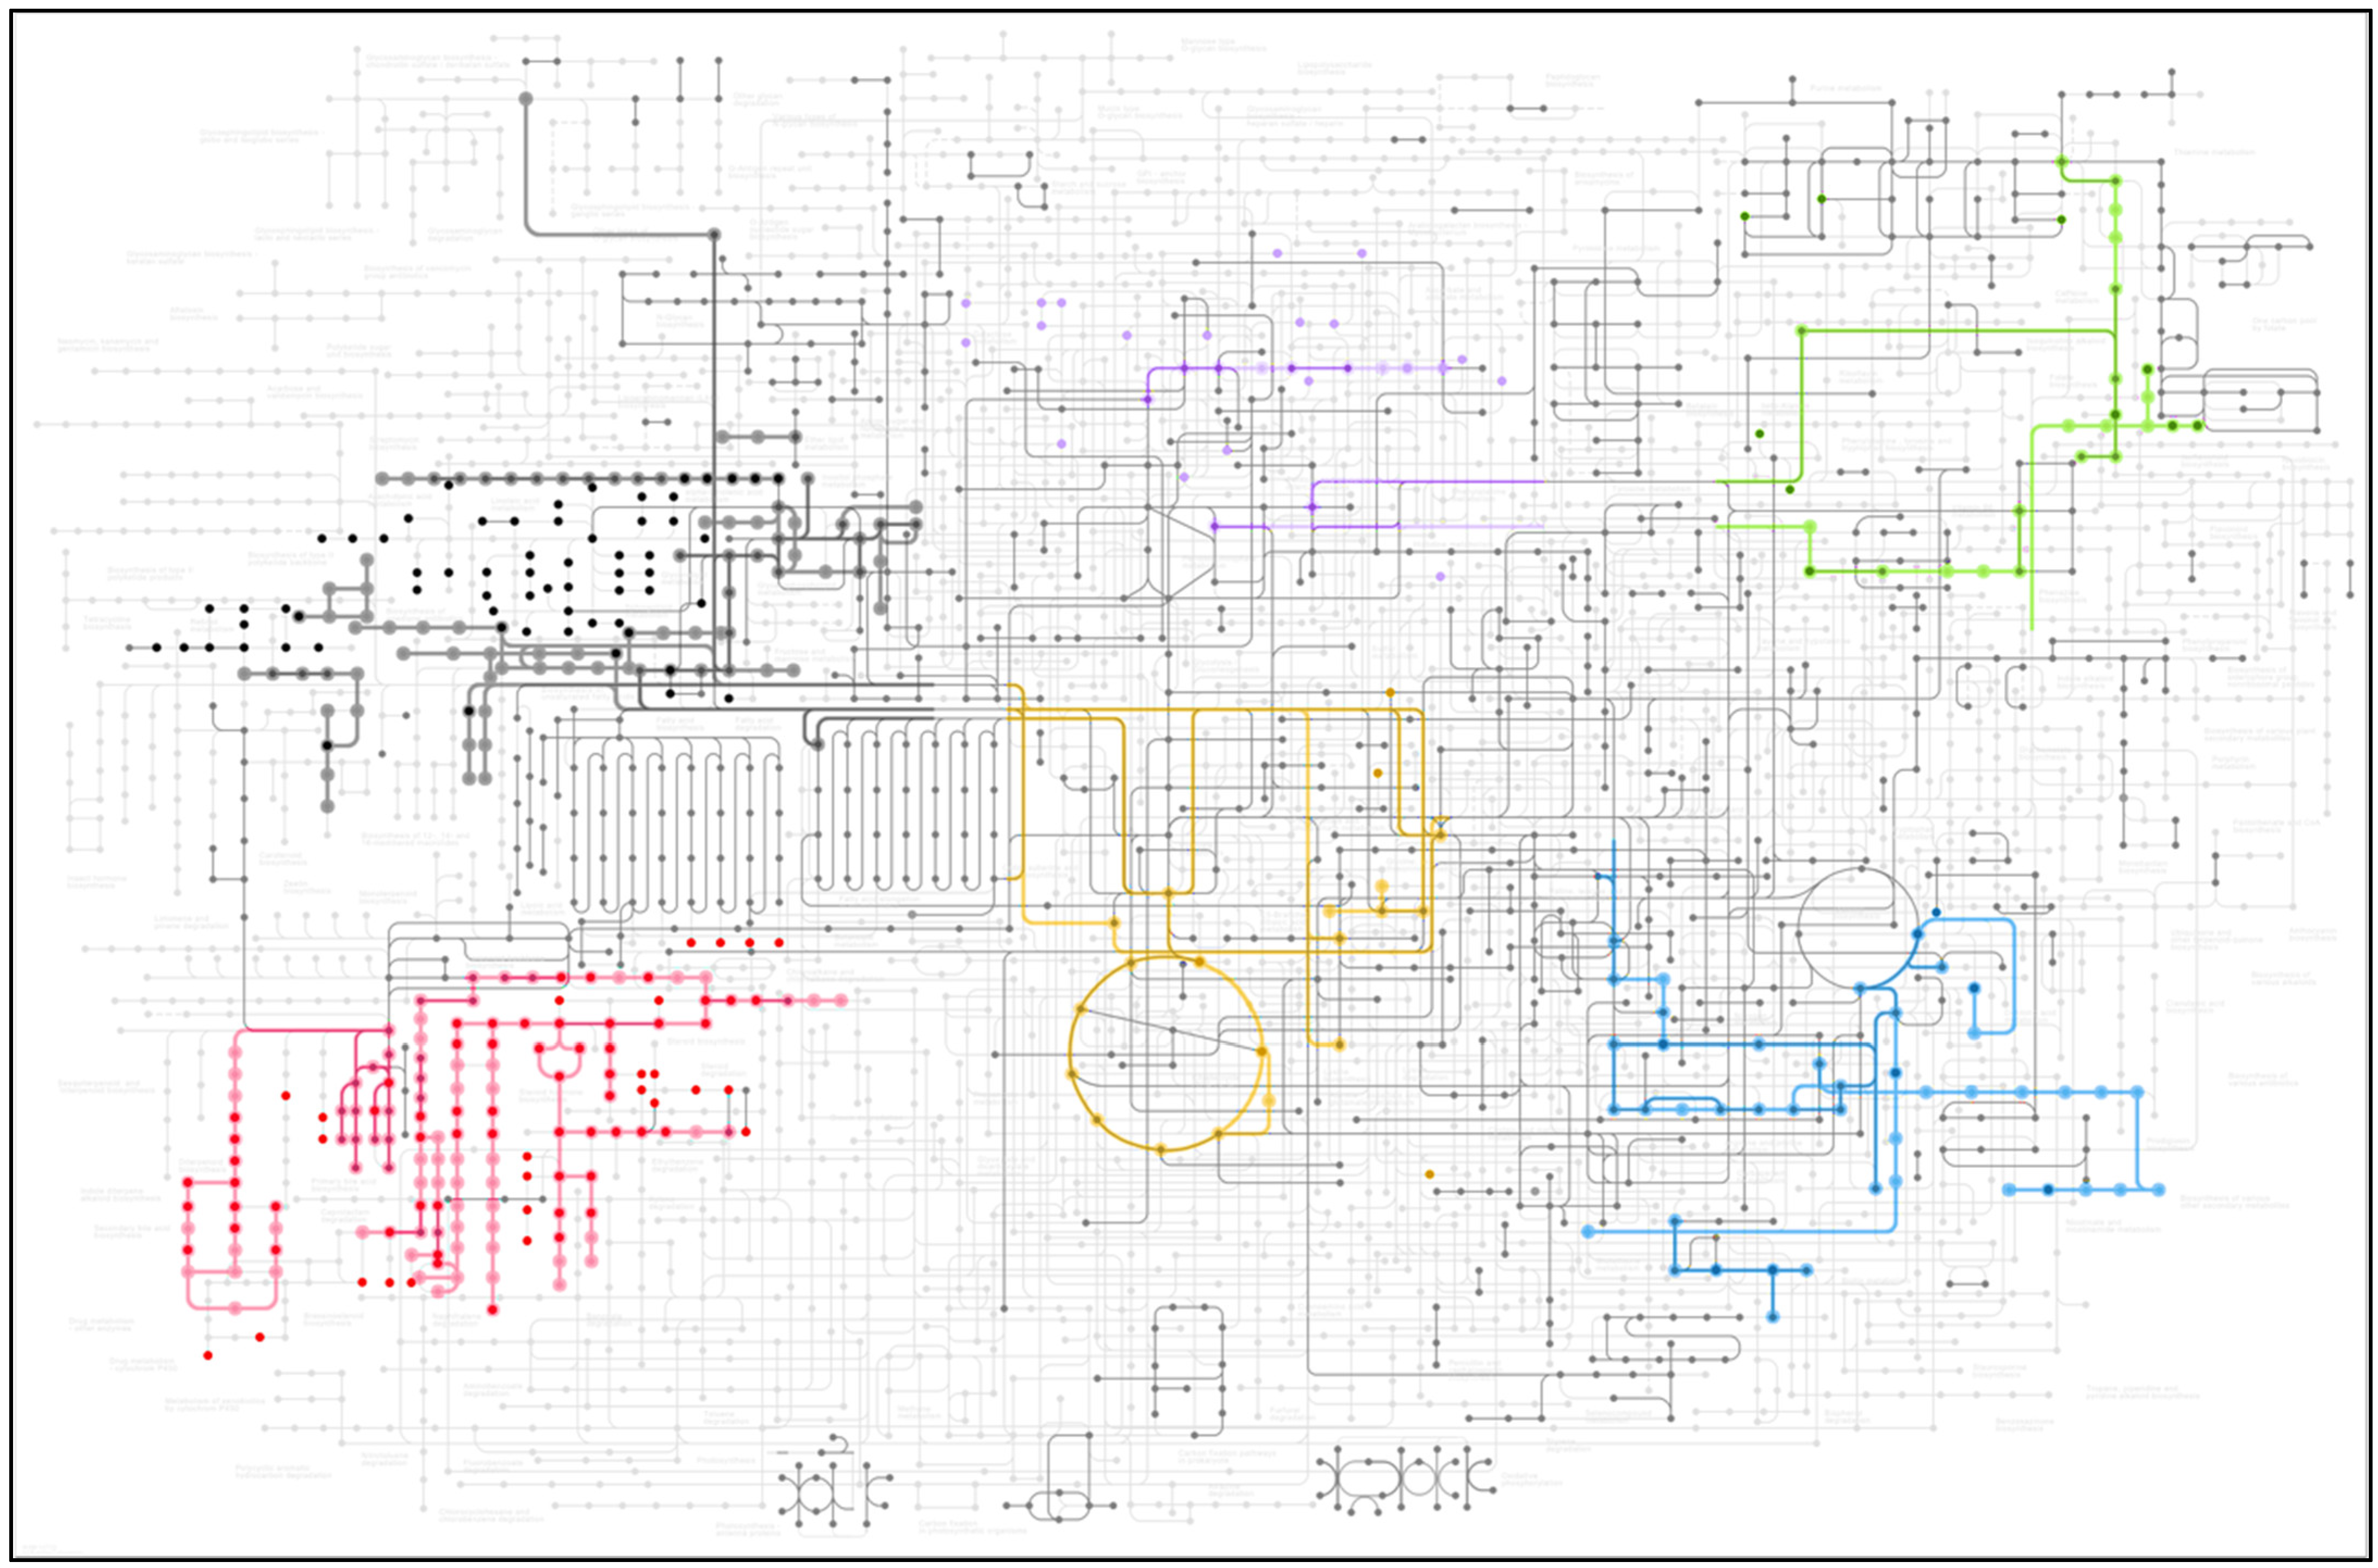
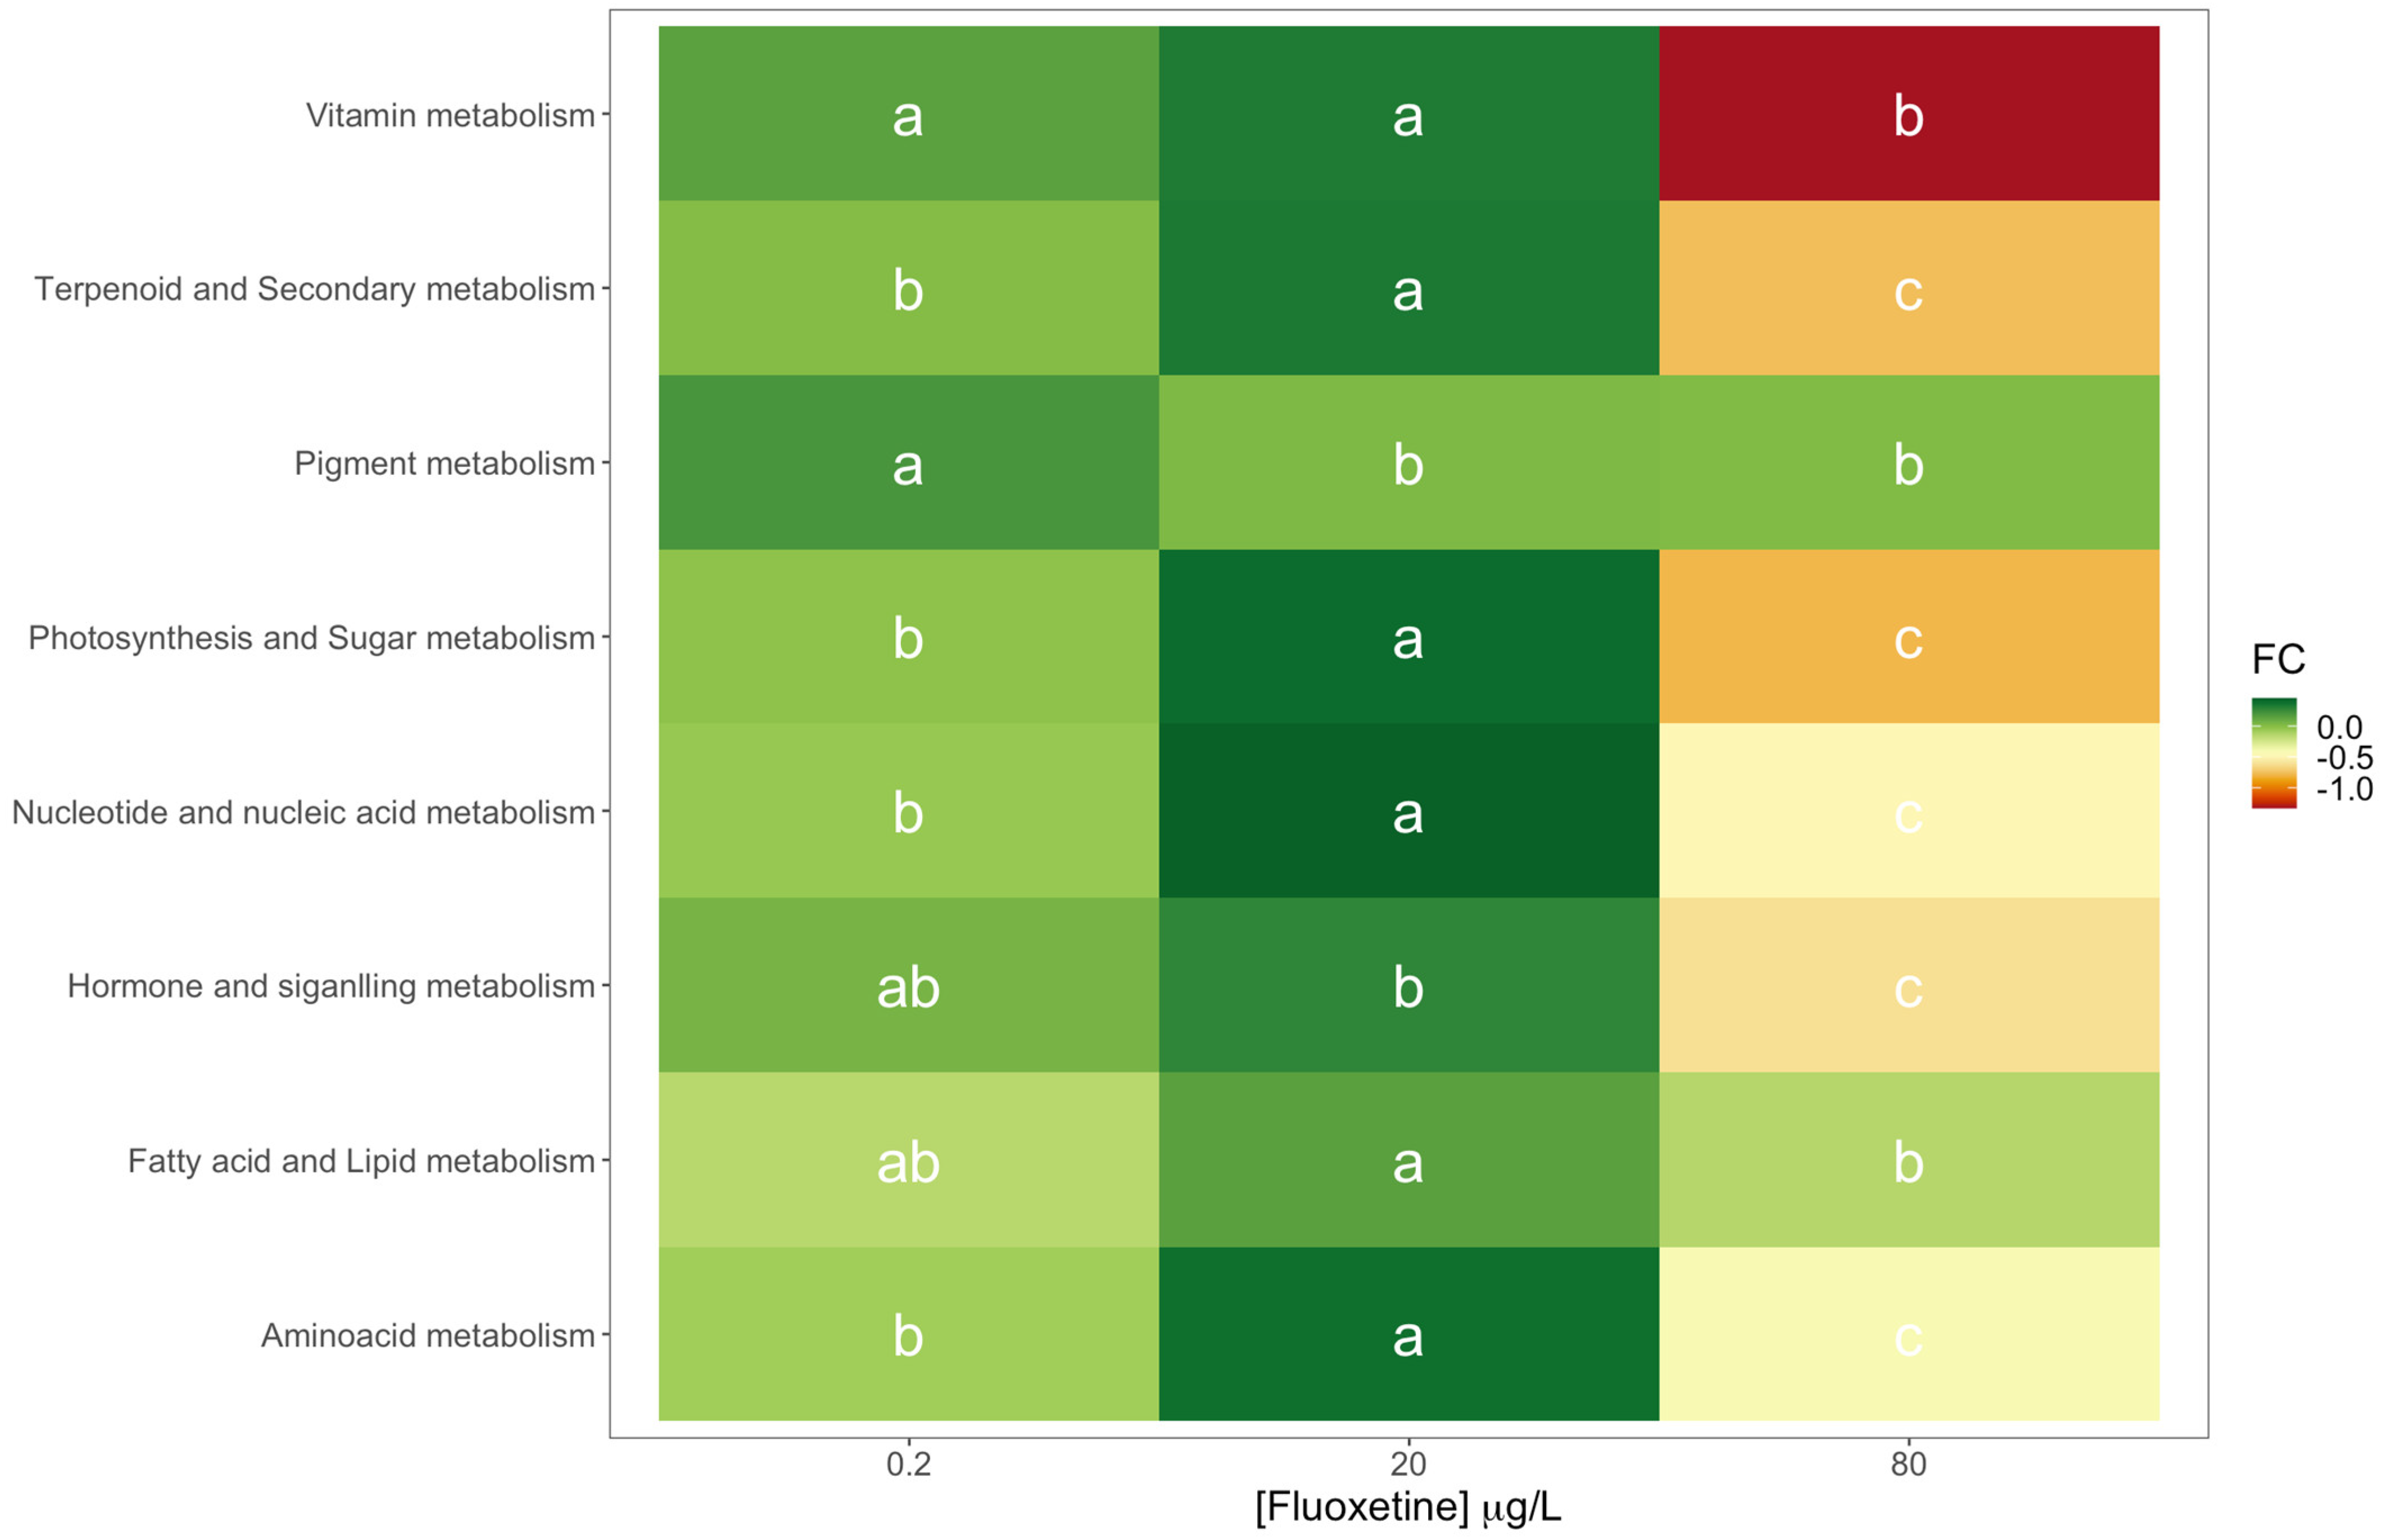
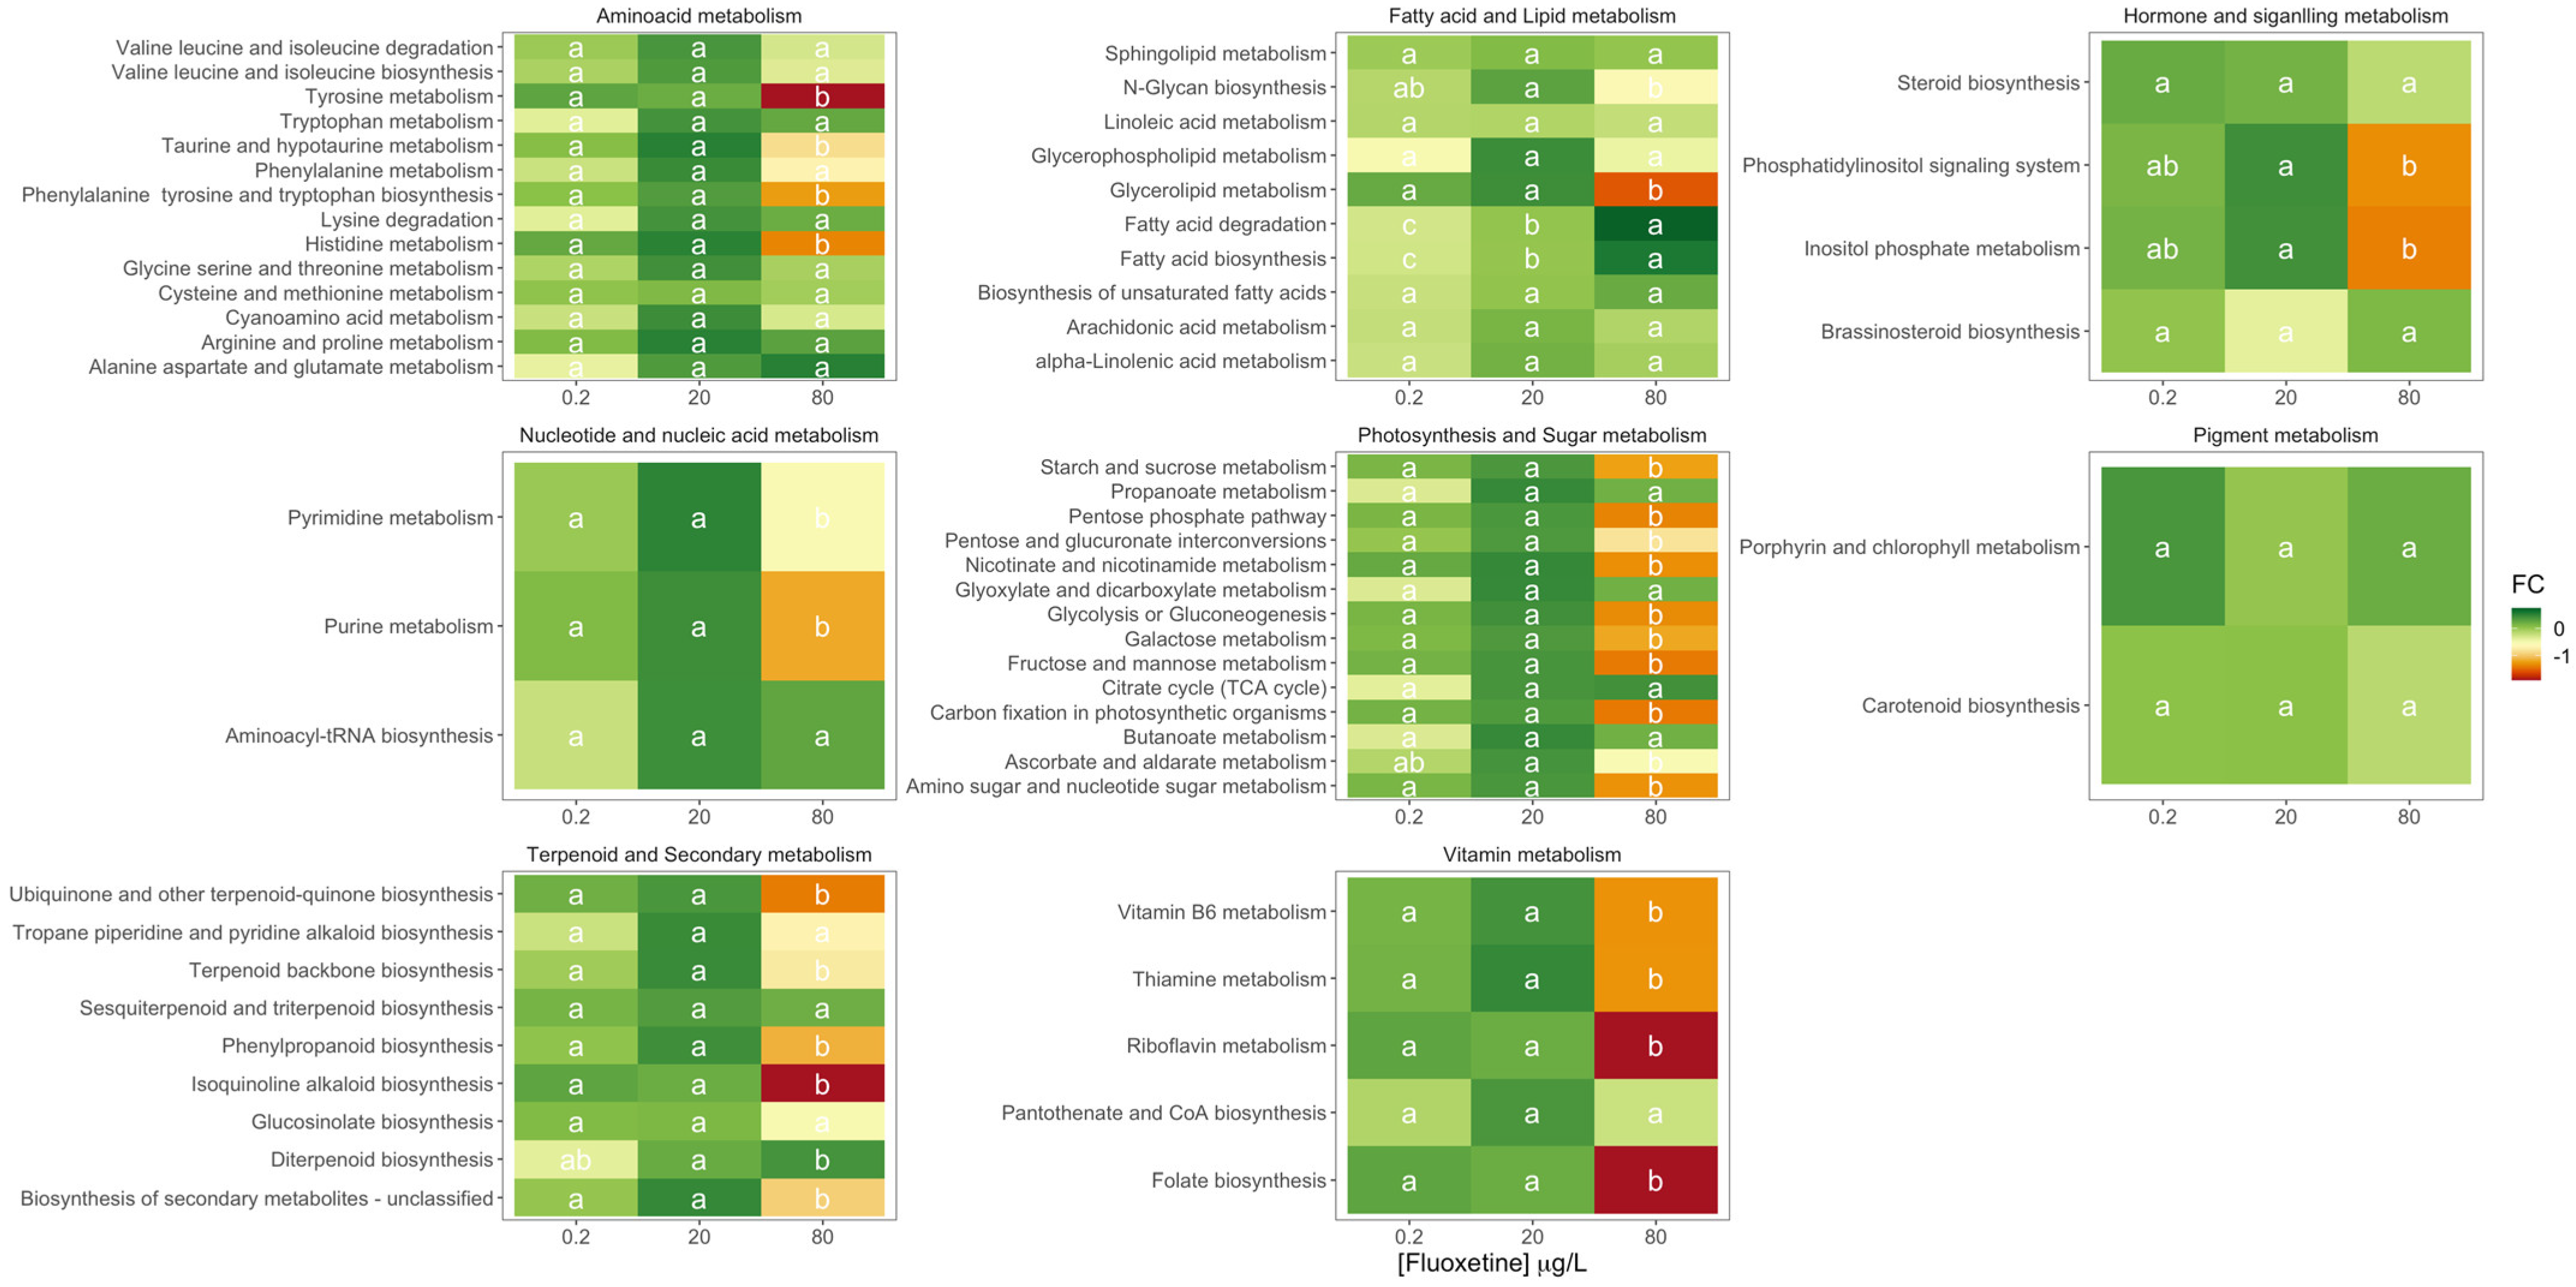
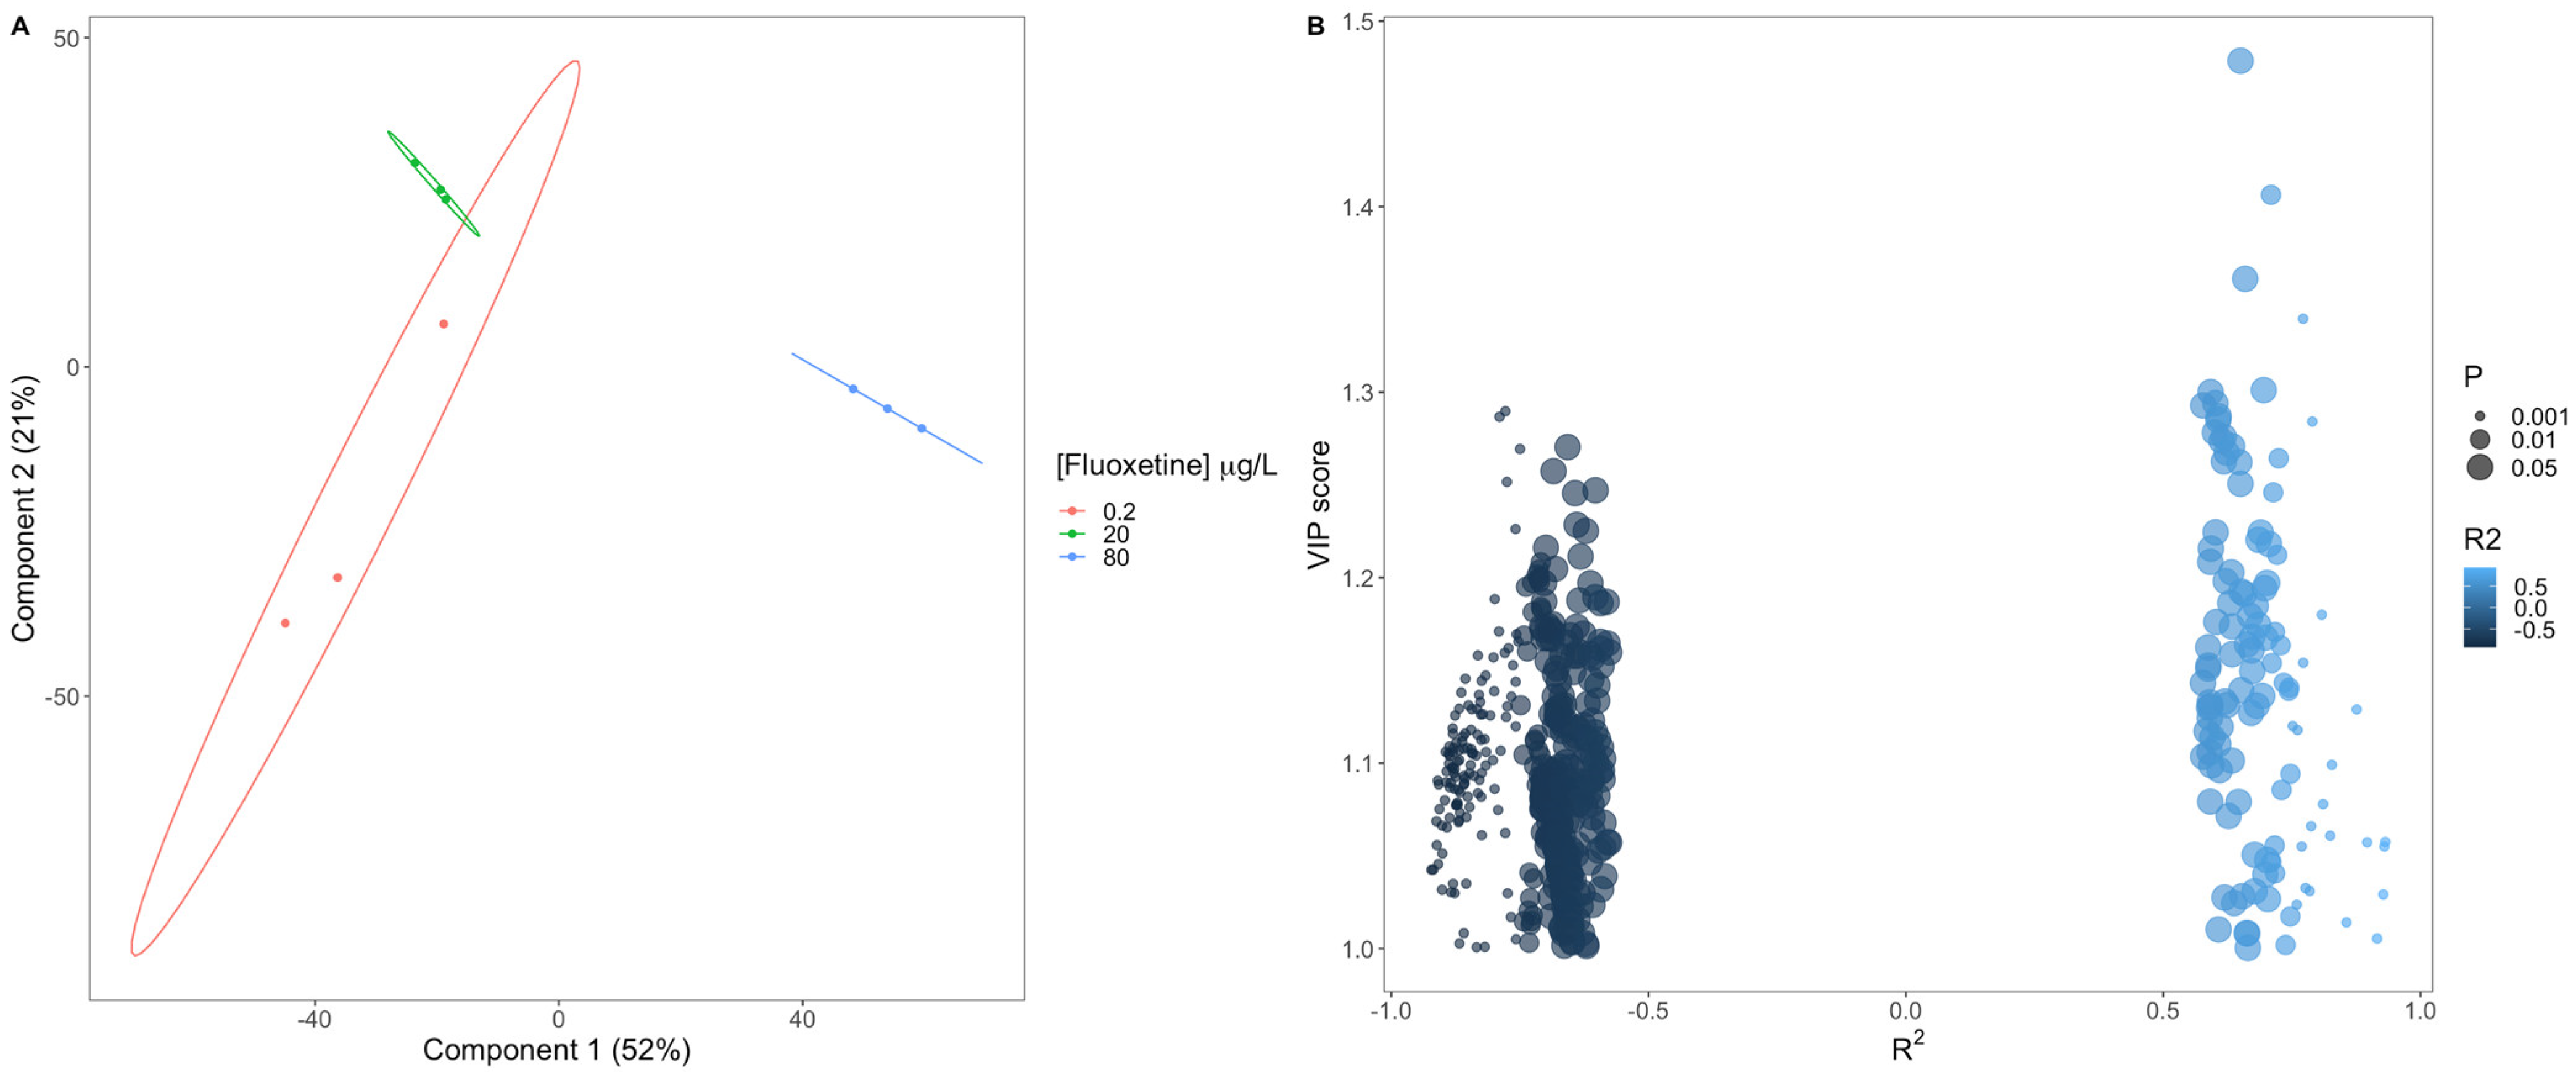
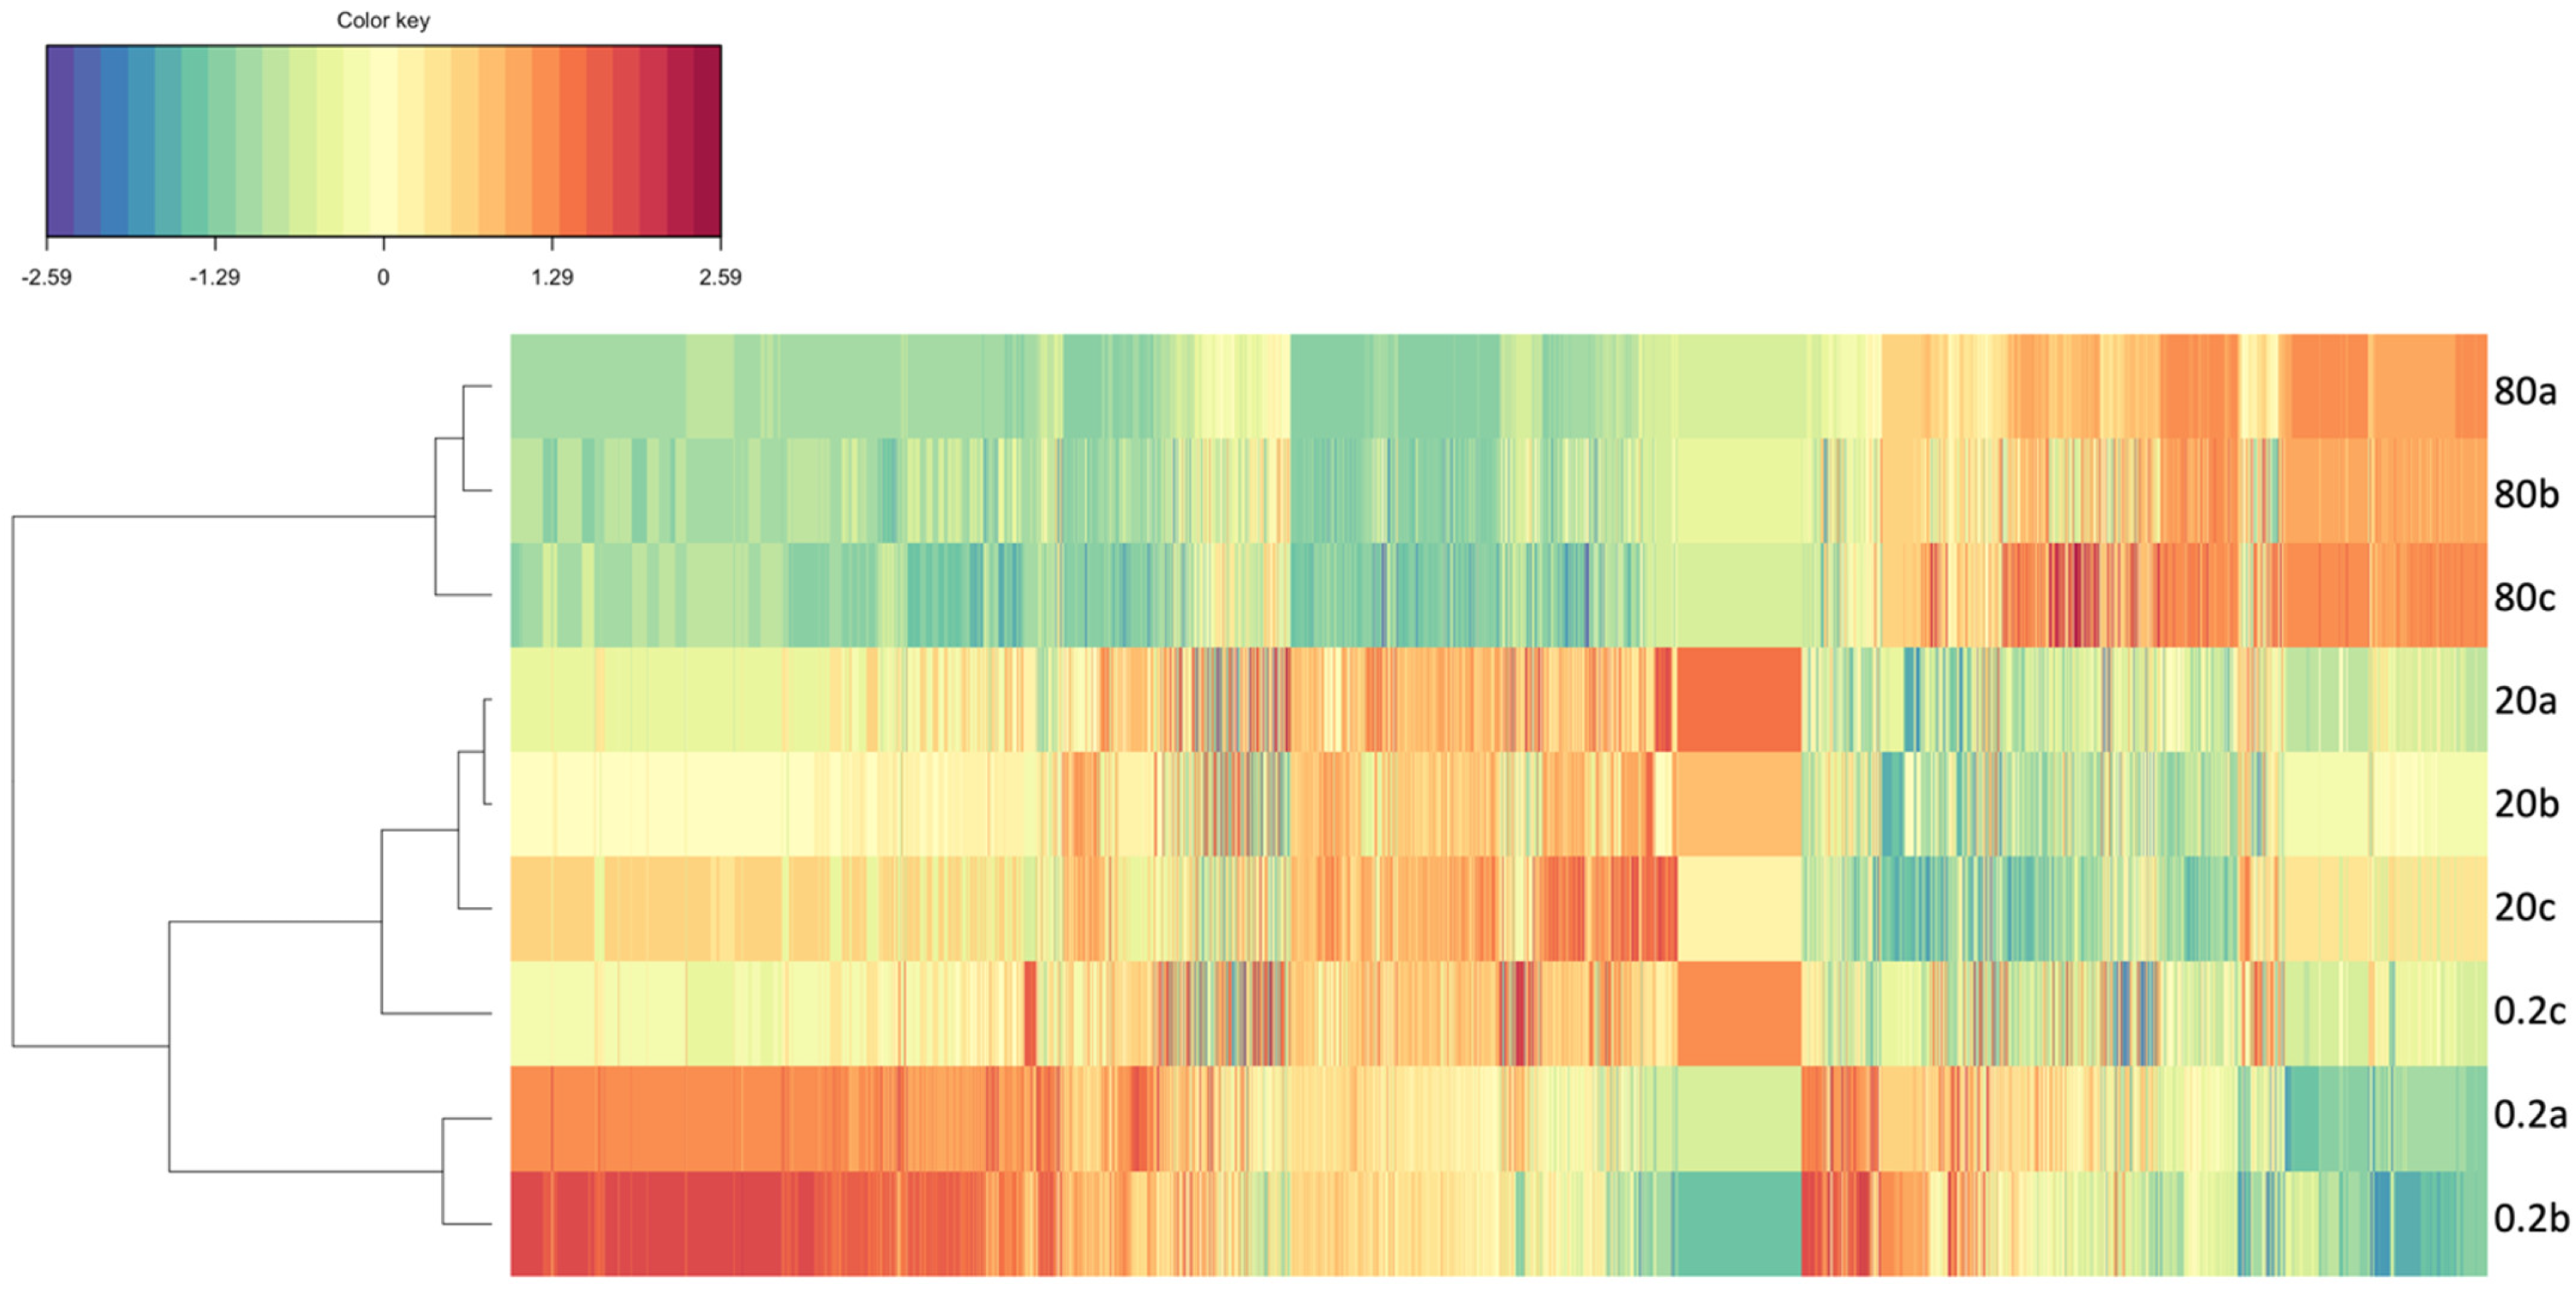
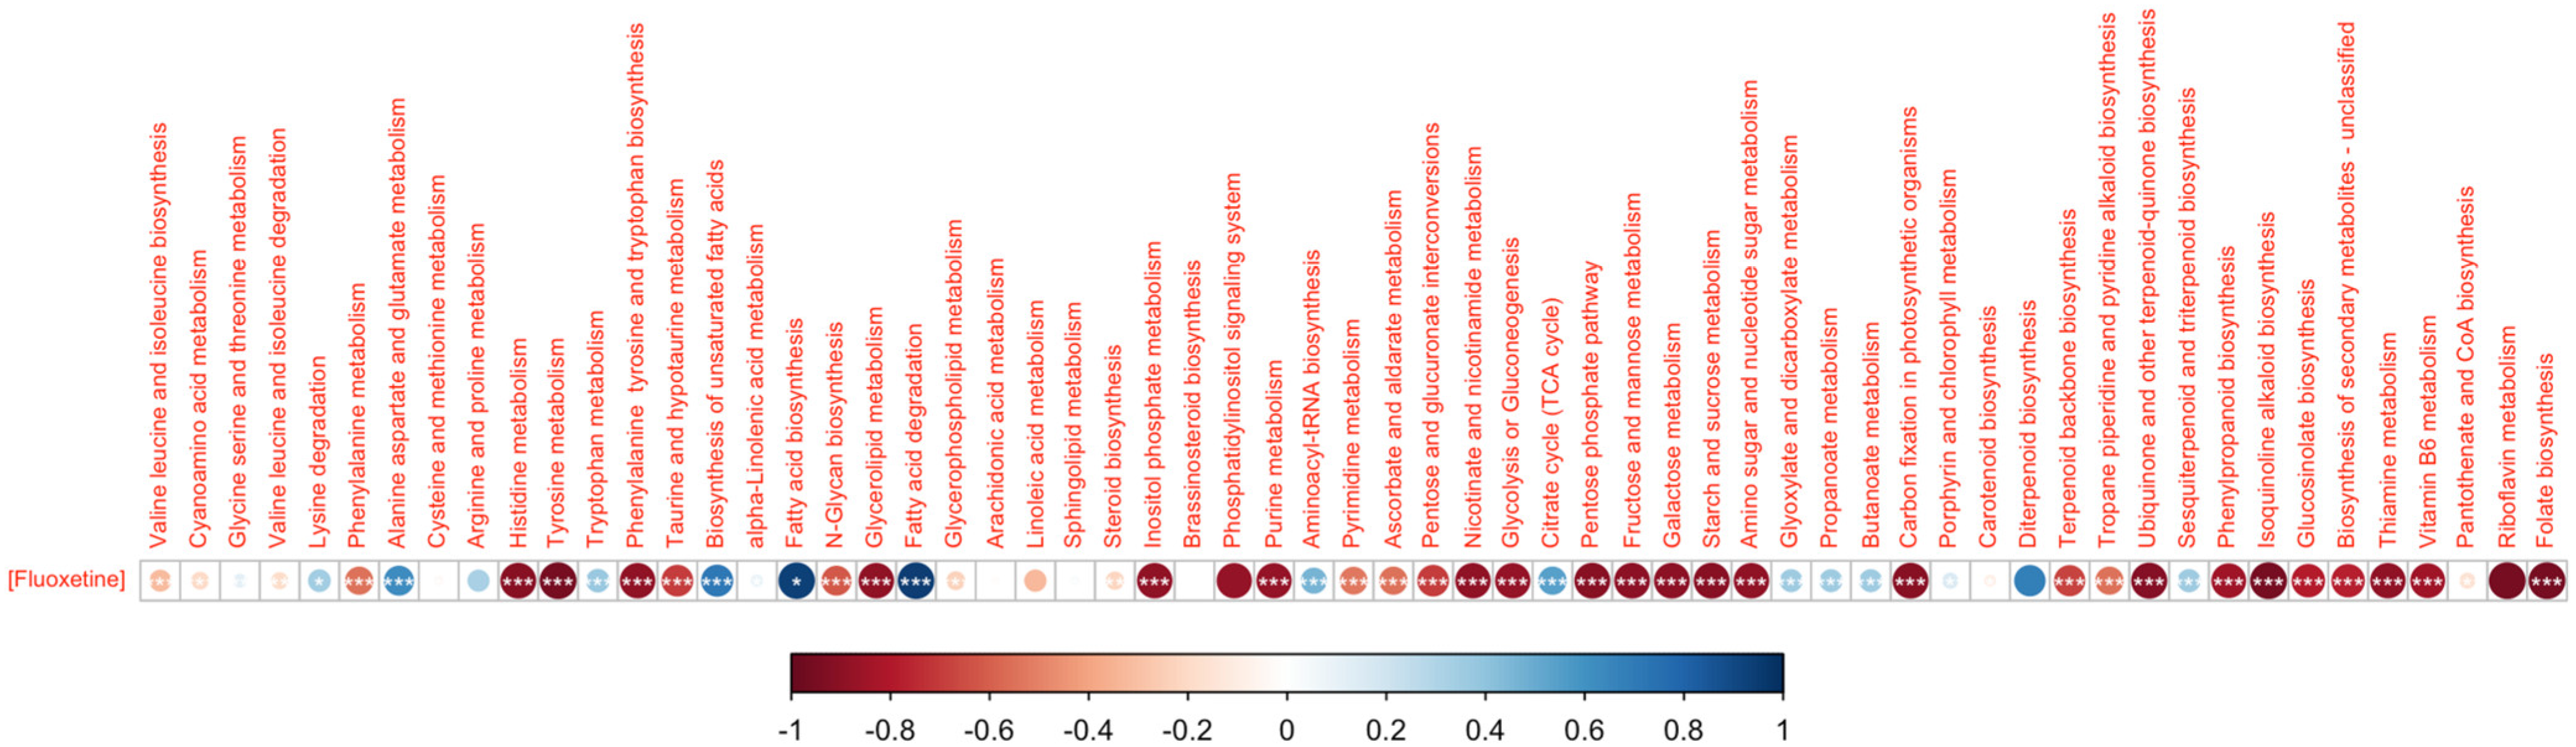
3.2. Fluoxetine Impacts on Diatom Metabolisms and Pathways
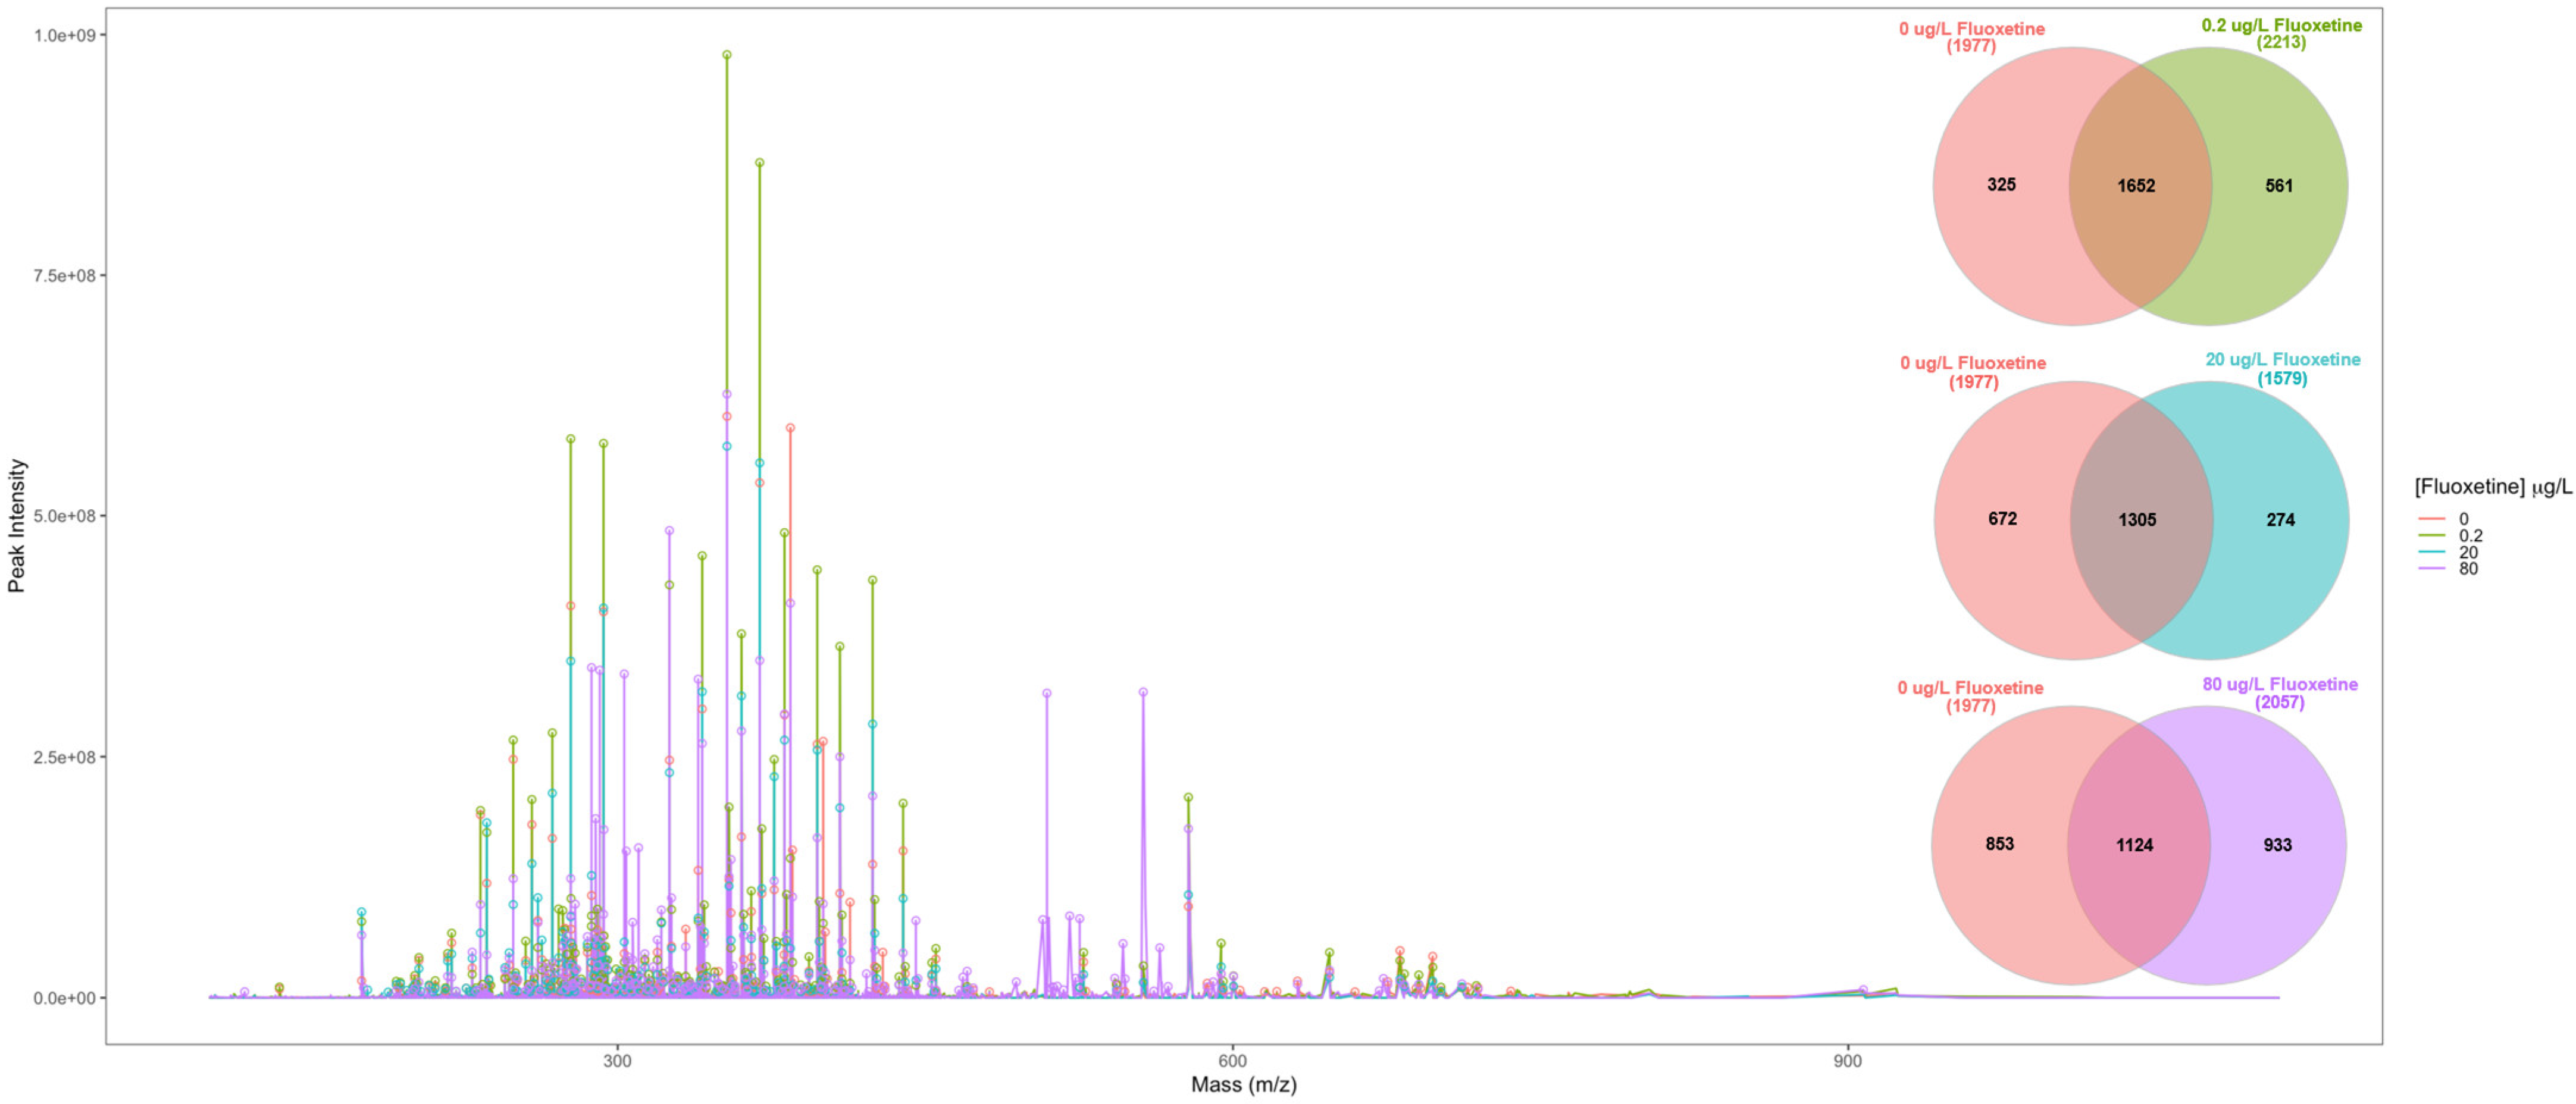
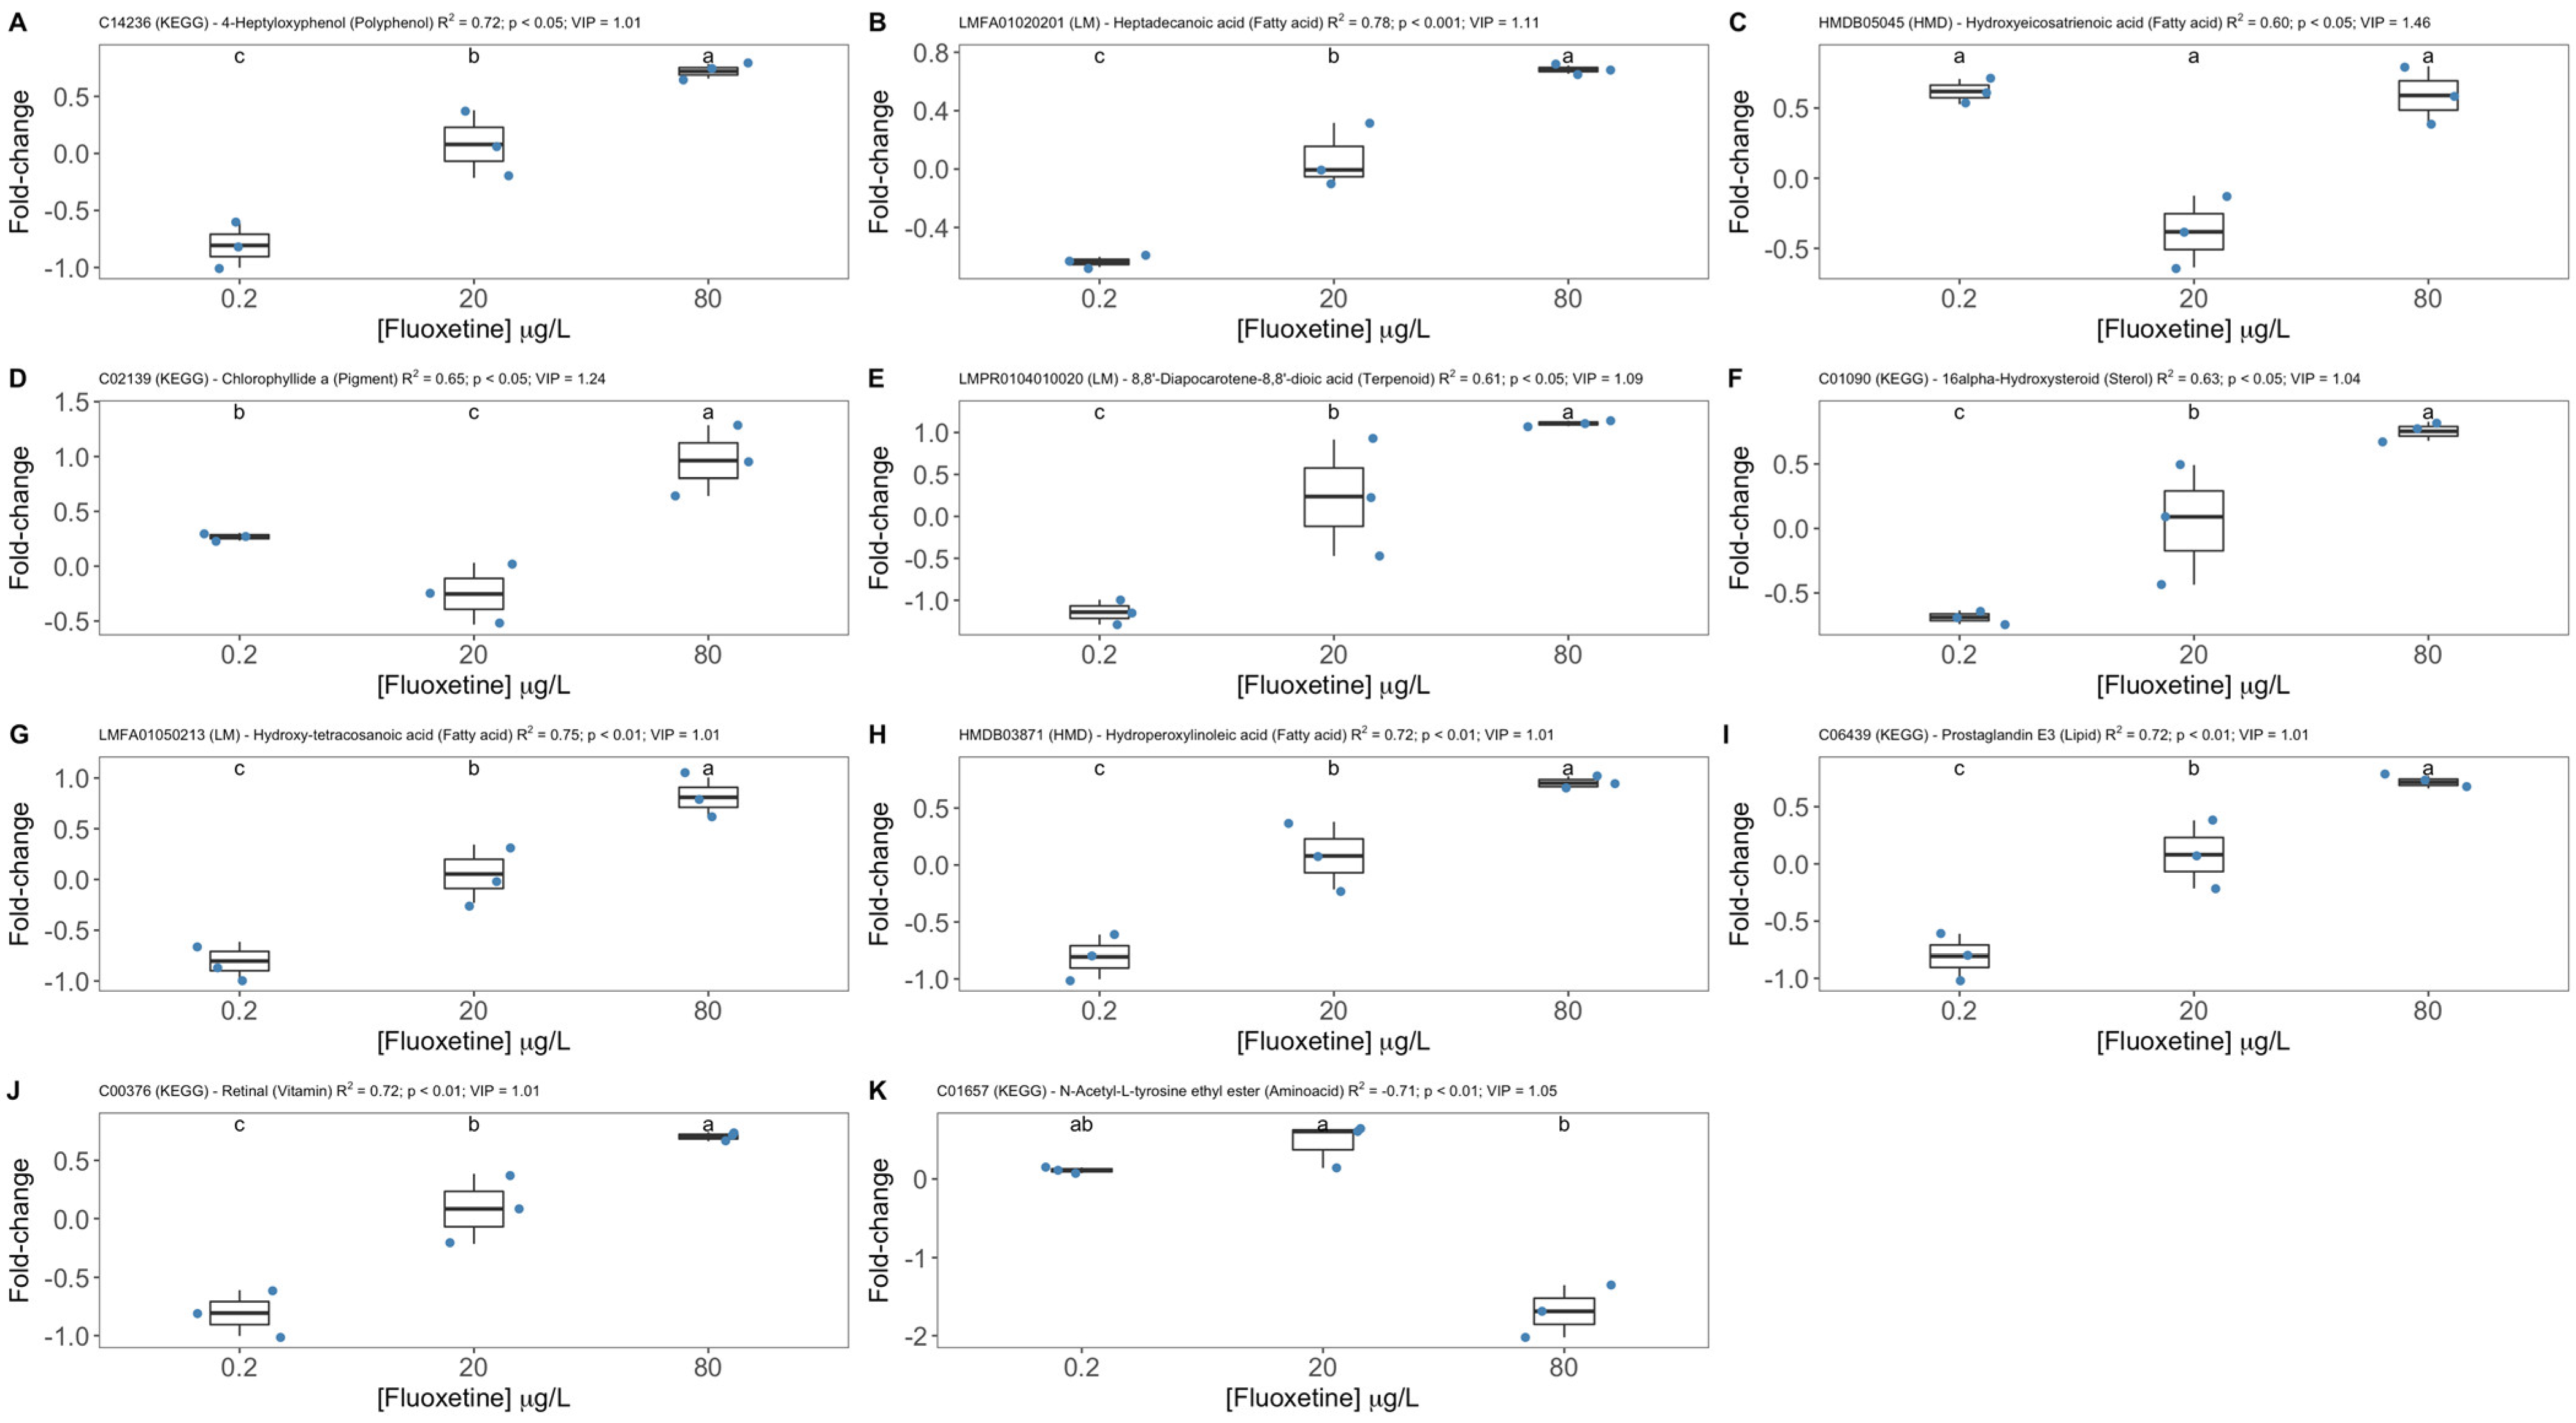
3.3. Fluoxetine Metabolic Biomarker Discovery
4. Discussion
5. Conclusions
Author Contributions
Funding
Institutional Review Board Statement
Informed Consent Statement
Data Availability Statement
Conflicts of Interest
References
- Mezzelani, M.; Regoli, F. The Biological Effects of Pharmaceuticals in the Marine Environment. Annu. Rev. Mar. Sci. 2022, 14, 105–128. [Google Scholar] [CrossRef] [PubMed]
- European Comission. Communication from the Commission to the European Parliament, the Council and the European Economic and Social Committee; European Union Strategic Approach to Pharmaceuticals in the Environment: Brussels, Belgium, 2019. [Google Scholar]
- Fonseca, V.F.; Duarte, I.A.; Duarte, B.; Freitas, A.; Pouca, A.S.V.; Barbosa, J.; Gillanders, B.M.; Reis-Santos, P. Environmental Risk Assessment and Bioaccumulation of Pharmaceuticals in a Large Urbanized Estuary. Sci. Total Environ. 2021, 783, 147021. [Google Scholar] [CrossRef] [PubMed]
- Reis-Santos, P. Screening of Human and Veterinary Pharmaceuticals in Estuarine Waters: A Baseline Assessment for the Tejo Estuary. Mar. Pollut. Bull. 2018, 6, 1079–1084. [Google Scholar] [CrossRef] [PubMed]
- Duarte, B.; Gameiro, C.; Matos, A.R.; Figueiredo, A.; Silva, M.S.; Cordeiro, C.; Caçador, I.; Reis-Santos, P.; Fonseca, V.; Cabrita, M.T. First Screening of Biocides, Persistent Organic Pollutants, Pharmaceutical and Personal Care Products in Antarctic Phytoplankton from Deception Island by FT-ICR-MS. Chemosphere 2021, 274, 129860. [Google Scholar] [CrossRef] [PubMed]
- Prichard, E.; Granek, E.F. Effects of Pharmaceuticals and Personal Care Products on Marine Organisms: From Single-Species Studies to an Ecosystem-Based Approach. Environ. Sci. Pollut. Res. 2016, 23, 22365–22384. [Google Scholar] [CrossRef] [PubMed]
- Duarte, B.; Feijão, E.; Cruz de Carvalho, R.; Duarte, I.A.; Silva, M.; Matos, A.R.; Cabrita, M.T.; Novais, S.C.; Lemos, M.F.L.; Marques, J.C.; et al. Effects of Propranolol on Growth, Lipids and Energy Metabolism and Oxidative Stress Response of Phaeodactylum tricornutum. Biology 2020, 9, 478. [Google Scholar] [CrossRef] [PubMed]
- Duarte, B.; Prata, D.; Matos, A.R.; Cabrita, M.T.; Caçador, I.; Marques, J.C.; Cabral, H.N.; Reis-Santos, P.; Fonseca, V.F. Ecotoxicity of the Lipid-Lowering Drug Bezafibrate on the Bioenergetics and Lipid Metabolism of the Diatom Phaeodactylum tricornutum. Sci. Total Environ. 2019, 650, 2085–2094. [Google Scholar] [CrossRef]
- Duarte, I.A.; Reis-Santos, P.; Novais, S.C.; Rato, L.D.; Lemos, M.F.L.L.; Freitas, A.; Pouca, A.S.V.; Barbosa, J.; Cabral, H.N.; Fonseca, V.F. Depressed, Hypertense and Sore: Long-Term Effects of Fluoxetine, Propranolol and Diclofenac Exposure in a Top Predator Fish. Sci. Total Environ. 2020, 712, 136564. [Google Scholar] [CrossRef]
- Feijão, E.; Cruz de Carvalho, R.; Duarte, I.A.; Matos, A.R.; Cabrita, M.T.; Novais, S.C.; Lemos, M.F.L.; Caçador, I.; Marques, J.C.; Reis-Santos, P.; et al. Fluoxetine Arrests Growth of the Model Diatom Phaeodactylum tricornutum by Increasing Oxidative Stress and Altering Energetic and Lipid Metabolism. Front. Microbiol. 2020, 11, 1803. [Google Scholar] [CrossRef]
- Lopes, D.G.; Duarte, I.A.; Antunes, M.; Fonseca, V.F. Effects of Antidepressants in the Reproduction of Aquatic Organisms: A Meta-Analysis. Aquat. Toxicol. 2020, 227, 105569. [Google Scholar] [CrossRef]
- Brodin, T.; Piovano, S.; Fick, J.; Klaminder, J.; Heynen, M.; Jonsson, M. Ecological Effects of Pharmaceuticals in Aquatic Systems—Impacts through Behavioural Alterations. Philos. Trans. R. Soc. B Biol. Sci. 2014, 369, 20130580. [Google Scholar] [CrossRef] [PubMed] [Green Version]
- Shaliutina-Kolešová, A.; Shaliutina, O.; Nian, R. The Effects of Environmental Antidepressants on Macroinvertebrates: A Mini Review. Water Environ. J. 2020, 34, 153–159. [Google Scholar] [CrossRef]
- Krupa, D.; Czech, M.; Pinkas, J.; Mosiołek, A. Impact of COVID-19 Pandemic on the Use of Antidepressant and Antianxiety Pharmaceuticals as Well as Sick Leave in Poland. Int. J. Environ. Res. Public Health 2022, 19, 2135. [Google Scholar] [CrossRef] [PubMed]
- Van Harten, J. Clinical Pharmacokinetics of Selective Serotonin Reuptake Inhibitors. Clin. Pharmacokinet. 1993, 24, 203–220. [Google Scholar] [CrossRef] [PubMed]
- Kwon, J.-W.; Armbrust, K.L. Laboratory Persistence and Fate of Fluoxetine in Aquatic Environments. Environ. Toxicol. Chem. 2006, 25, 2561–2568. [Google Scholar] [CrossRef]
- Aus der Beek, T.; Weber, F.A.; Bergmann, A.; Hickmann, S.; Ebert, I.; Hein, A.; Küster, A. Pharmaceuticals in the Environment-Global Occurrences and Perspectives. Environ. Toxicol. Chem. 2016, 35, 823–835. [Google Scholar] [CrossRef]
- Mezzelani, M.; Gorbi, S.; Regoli, F. Pharmaceuticals in the Aquatic Environments: Evidence of Emerged Threat and Future Challenges for Marine Organisms. Mar. Environ. Res. 2018, 140, 41–60. [Google Scholar] [CrossRef]
- Vasskog, T.; Anderssen, T.; Pedersen-Bjergaard, S.; Kallenborn, R.; Jensen, E. Occurrence of Selective Serotonin Reuptake Inhibitors in Sewage and Receiving Waters at Spitsbergen and in Norway. J. Chromatogr. A 2008, 1185, 194–205. [Google Scholar] [CrossRef]
- Wong, D.T.; Bymaster, F.P.; Engleman, E.A. Prozac (Fluoxetine, Lilly 110140), the First Selective Serotonin Uptake Inhibitor and an Antidepressant Drug: Twenty Years since Its First Publication. Life Sci. 1995, 57, 411–441. [Google Scholar] [CrossRef]
- Gaworecki, K.M.; Klaine, S.J. Behavioral and Biochemical Responses of Hybrid Striped Bass during and after Fluoxetine Exposure. Aquat. Toxicol. 2008, 88, 207–213. [Google Scholar] [CrossRef]
- Mennigen, J.A.; Lado, W.E.; Zamora, J.M.; Duarte-Guterman, P.; Langlois, V.S.; Metcalfe, C.D.; Chang, J.P.; Moon, T.W.; Trudeau, V.L. Waterborne Fluoxetine Disrupts the Reproductive Axis in Sexually Mature Male Goldfish, Carassius Auratus. Aquat. Toxicol. 2010, 100, 354–364. [Google Scholar] [CrossRef] [PubMed]
- Duarte, B.; Feijão, E.; Franzitta, M.; Duarte, I.A.; de Carvalho, R.C.; Cabrita, M.T.; Marques, J.C.; Caçador, I.; Fonseca, V.; Matos, A.R. LipidTOX: A Fatty Acid-Based Index Efficient for Ecotoxicological Studies with Marine Model Diatoms Exposed to Legacy and Emerging Contaminants. Ecol. Indic. 2022, 139, 108885. [Google Scholar] [CrossRef]
- Duarte, B.; Feijão, E.; Cruz de Carvalho, R.; Franzitta, M.; Carlos Marques, J.; Caçador, I.; Teresa Cabrita, M.; Fonseca, V.F. Unlocking Kautsky’s Dark Box: Development of an Optical Toxicity Classification Tool (OPTOX Index) with Marine Diatoms Exposed to Emerging Contaminants. Ecol. Indic. 2021, 131, 108238. [Google Scholar] [CrossRef]
- Pires, V.L.; Novais, S.C.; Lemos, M.F.L.; Fonseca, V.F.; Duarte, B. Evaluation of Multivariate Biomarker Indexes Application in Ecotoxicity Tests with Marine Diatoms Exposed to Emerging Contaminants. Appl. Sci. 2021, 11, 3878. [Google Scholar] [CrossRef]
- Maia, M.; Figueiredo, A.; Cordeiro, C.; Sousa Silva, M. FT-ICR-MS-Based Metabolomics: A Deep Dive into Plant Metabolism. Mass Spectrom. Rev. 2021, 1–22. [Google Scholar] [CrossRef] [PubMed]
- Maia, M.; Monteiro, F.; Sebastiana, M.; Marques, A.P.; Ferreira, A.E.N.; Freire, A.P.; Cordeiro, C.; Figueiredo, A.; Sousa Silva, M. Metabolite Extraction for High-Throughput FTICR-MS-Based Metabolomics of Grapevine Leaves. EuPA Open Proteom. 2016, 12, 4–9. [Google Scholar] [CrossRef] [Green Version]
- Guillard, R.R.L.; Ryther, J.H. Studies of marine planktonic diatoms: I. cyclotella nana hustedt, and detonula confervacea (cleve) gran. Can. J. Microbiol. 1962, 8, 229–239. [Google Scholar] [CrossRef]
- Feijão, E.; Gameiro, C.; Franzitta, M.; Duarte, B.; Caçador, I.; Cabrita, M.T.; Matos, A.R. Heat Wave Impacts on the Model Diatom Phaeodactylum tricornutum: Searching for Photochemical and Fatty Acid Biomarkers of Thermal Stress. Ecol. Indic. 2018, 95, 1026–1037. [Google Scholar] [CrossRef]
- OECD. OECD Guidelines for the Testing of Chemicals. Freshwater Alga and Cyanobacteria, Growth Inhibition Test. Organ. Econ. Coop. Dev. 1–25. [CrossRef]
- Kolpin, D.W.; Furlong, E.T.; Meyer, M.T.; Thurman, E.M.; Zaugg, S.D.; Barber, L.B.; Buxton, H.T. Pharmaceuticals, Hormones, and Other Organic Wastewater Contaminants in U.S. Streams, 1999–2000: A National Reconnaissance. Environ. Sci. Technol. 2002, 36, 1202–1211. [Google Scholar] [CrossRef]
- Kanda, R.; Griffin, P.; James, H.A.; Fothergill, J. Pharmaceutical and Personal Care Products in Sewage Treatment Works. J. Environ. Monit. 2003, 5, 823–830. [Google Scholar] [CrossRef] [PubMed]
- Singer, H.; Müller, S.; Tixier, C.; Pillonel, L. Triclosan: Occurrence and Fate of a Widely Used Biocide in the Aquatic Environment: Field Measurements in Wastewater Treatment Plants, Surface Waters, and Lake Sediments. Environ. Sci. Technol. 2002, 36, 4998–5004. [Google Scholar] [CrossRef] [PubMed]
- Jampani, M.; Chandy, S.J. Increased Antimicrobial Use during COVID-19: The Risk of Advancing the Threat of Antimicrobial Resistance. Health Sci. Rep. 2021, 4, e459. [Google Scholar] [CrossRef] [PubMed]
- Hora, P.I.; Pati, S.G.; McNamara, P.J.; Arnold, W.A. Increased Use of Quaternary Ammonium Compounds during the SARS-CoV-2 Pandemic and Beyond: Consideration of Environmental Implications. Environ. Sci. Technol. Lett. 2020, 7, 622–631. [Google Scholar] [CrossRef]
- Kanawati, B.; Bader, T.M.; Wanczek, K.-P.; Li, Y.; Schmitt-Kopplin, P. Fourier Transform (FT)-Artifacts and Power-Function Resolution Filter in Fourier Transform Mass Spectrometry. Rapid Commun. Mass Spectrom. 2017, 31, 1607–1615. [Google Scholar] [CrossRef]
- Xia, J.; Psychogios, N.; Young, N.; Wishart, D.S. MetaboAnalyst: A Web Server for Metabolomic Data Analysis and Interpretation. Nucleic Acids Res. 2009, 37, W652–W660. [Google Scholar] [CrossRef] [Green Version]
- Suhre, K.; Schmitt-Kopplin, P. MassTRIX: Mass Translator into Pathways. Nucleic Acids Res. 2008, 36, 481–484. [Google Scholar] [CrossRef] [Green Version]
- Taiyun. Taiyun/Corrplot 2021; Taiyun Tech Co., Ltd.: Guangzhou, China, 2021. [Google Scholar]
- Wickham, H. Ggplot2: Elegant Graphics for Data Analysis; Use R! Springer: New York, NY, USA, 2009; ISBN 978-0-387-98141-3. [Google Scholar]
- De Mendiburu, F.; Simon, R. Agricolae—Ten Years of an Open Source Statistical Tool for Experiments in Breeding, Agriculture and Biology. PeerJ PrePrints 2015, 3, e1404v1. [Google Scholar]
- Heberle, H.; Meirelles, V.G.; da Silva, F.R.; Telles, G.P.; Minghim, R. InteractiVenn: A Web-Based Tool for the Analysis of Sets through Venn Diagrams. BMC Bioinform. 2015, 16, 169. [Google Scholar] [CrossRef] [Green Version]
- Sanchez, G. Package ‘DiscriMiner’. 2013. Available online: https://mran.microsoft.com/snapshot/2015-10-02/web/packages/DiscriMiner/DiscriMiner.pdf (accessed on 30 October 2022).
- Dulawa, S.C.; Holick, K.A.; Gundersen, B.; Hen, R. Effects of Chronic Fluoxetine in Animal Models of Anxiety and Depression. Neuropsychopharmacology 2004, 29, 1321–1330. [Google Scholar] [CrossRef] [Green Version]
- Bi, R.; Zeng, X.; Mu, L.; Hou, L.; Liu, W.; Li, P.; Chen, H.; Li, D.; Bouchez, A.; Tang, J.; et al. Sensitivities of Seven Algal Species to Triclosan, Fluoxetine and Their Mixtures. Sci. Rep. 2018, 8, 15361. [Google Scholar] [CrossRef] [PubMed]
- Miazek, K.; Brozek-Pluska, B. Effect of PHRs and PCPs on Microalgal Growth, Metabolism and Microalgae-Based Bioremediation Processes: A Review. Int. J. Mol. Sci. 2019, 20, 2492. [Google Scholar] [CrossRef] [PubMed] [Green Version]
- Fonseca, V.F.; Reis-Santos, P.; Duarte, B.; Cabral, H.N.; Caçador, M.I.; Vaz, N.; Dias, J.M.; Pais, M.P. Roving Pharmacies: Modelling the Dispersion of Pharmaceutical Contamination in Estuaries. Ecol. Indic. 2020, 115, 106437. [Google Scholar] [CrossRef]
- Yang, H.; Cao, Q.; Xiong, X.; Zhao, P.; Shen, D.; Zhang, Y.; Zhang, N. Fluoxetine Regulates Glucose and Lipid Metabolism via the PI3K-AKT Signaling Pathway in Diabetic Rats. Mol. Med. Rep. 2020, 22, 3073–3080. [Google Scholar] [CrossRef] [PubMed]
- Tang, X.; Li, J.; Xiang, W.; Cui, Y.; Xie, B.; Wang, X.; Xu, Z.; Gan, L. Metformin Increases Hepatic Leptin Receptor and Decreases Steatosis in Mice. J. Endocrinol. 2016, 230, 227–237. [Google Scholar] [CrossRef] [Green Version]
- Pan, S.; Tan, Y.; Yao, S.; Xin, Y.; Yang, X.; Liu, J.; Xiong, J. Fluoxetine Induces Lipid Metabolism Abnormalities by Acting on the Liver in Patients and Mice with Depression. Acta Pharmacol. Sin. 2018, 39, 1463–1472. [Google Scholar] [CrossRef] [Green Version]
- Chen, C.T.; Green, J.T.; Orr, S.K.; Bazinet, R.P. Regulation of Brain Polyunsaturated Fatty Acid Uptake and Turnover. Prostaglandins Leukot. Essent. Fat. Acids 2008, 79, 85–91. [Google Scholar] [CrossRef]
- Qiu, W.; Duarte-Guterman, P.; Eid, R.S.; Go, K.A.; Lamers, Y.; Galea, L.A.M. Postpartum Fluoxetine Increased Maternal Inflammatory Signalling and Decreased Tryptophan Metabolism: Clues for Efficacy. Neuropharmacology 2020, 175, 108174. [Google Scholar] [CrossRef]
- Coppen, A.; Bailey, J. Enhancement of the Antidepressant Action of Fluoxetine by Folic Acid: A Randomised, Placebo Controlled Trial. J. Affect. Disord. 2000, 60, 121–130. [Google Scholar] [CrossRef]
- Page, G.L.J.; Laight, D.; Cummings, M.H. Thiamine Deficiency in Diabetes Mellitus and the Impact of Thiamine Replacement on Glucose Metabolism and Vascular Disease. Int. J. Clin. Pract. 2011, 65, 684–690. [Google Scholar] [CrossRef] [Green Version]
- Su, S.-Y.; Hogrefe-Phi, C.E.; Asara, J.M.; Turck, C.W.; Golub, M.S. Peripheral Fibroblast Metabolic Pathway Alterations in Juvenile Rhesus Monkeys Undergoing Long-Term Fluoxetine Administration. Eur. Neuropsychopharmacol. 2016, 26, 1110–1118. [Google Scholar] [CrossRef] [PubMed]
- Tseng, Y.-L.; Chiang, M.-L.; Lane, H.-Y.; Su, K.-P.; Lai, Y.-C. Selective Serotonin Reuptake Inhibitors Reduce P2Y12 Receptor-Mediated Amplification of Platelet Aggregation. Thromb. Res. 2013, 131, 325–332. [Google Scholar] [CrossRef] [PubMed]
- Aboul-Fotouh, S. Coenzyme Q10 Displays Antidepressant-like Activity with Reduction of Hippocampal Oxidative/Nitrosative DNA Damage in Chronically Stressed Rats. Pharmacol. Biochem. Behav. 2013, 104, 105–112. [Google Scholar] [CrossRef] [PubMed]
- Yang, J.; Jin, W.; Liu, D.; Zhong, Q.; Zhou, T. Enhanced Pseudotargeted Analysis Using a Segment Data Dependent Acquisition Strategy by Liquid Chromatography–Tandem Mass Spectrometry for a Metabolomics Study of Liquiritin in the Treatment of Depression. J. Sep. Sci. 2020, 43, 2088–2096. [Google Scholar] [CrossRef] [PubMed]
- Bhowal, B.; Bhattacharjee, A.; Goswami, K.; Sanan-Mishra, N.; Singla-Pareek, S.L.; Kaur, C.; Sopory, S. Serotonin and Melatonin Biosynthesis in Plants: Genome-Wide Identification of the Genes and Their Expression Reveal a Conserved Role in Stress and Development. Int. J. Mol. Sci. 2021, 22, 11034. [Google Scholar] [CrossRef] [PubMed]
- Dumas, T.; Boccard, J.; Gomez, E.; Fenet, H.; Courant, F. Multifactorial Analysis of Environmental Metabolomic Data in Ecotoxicology: Wild Marine Mussel Exposed to WWTP Effluent as a Case Study. Metabolites 2020, 10, 269. [Google Scholar] [CrossRef]
- Nagata, N.; Tanaka, R.; Tanaka, A. The Major Route for Chlorophyll Synthesis Includes [3,8-Divinyl]-Chlorophyllide a Reduction in Arabidopsis Thaliana. Plant Cell Physiol. 2007, 48, 1803–1808. [Google Scholar] [CrossRef] [PubMed] [Green Version]
- Ayyash, A.; Holloway, A.C. Fluoxetine-Induced Hepatic Lipid Accumulation Is Mediated by Prostaglandin Endoperoxide Synthase 1 and Is Linked to Elevated 15-Deoxy-Δ12,14 PGJ2. J. Appl. Toxicol. 2021, 42, 1004–1015. [Google Scholar] [CrossRef]
- Lupette, J.; Jaussaud, A.; Vigor, C.; Oger, C.; Galano, J.-M.; Réversat, G.; Vercauteren, J.; Jouhet, J.; Durand, T.; Maréchal, E. Non-Enzymatic Synthesis of Bioactive Isoprostanoids in the Diatom Phaeodactylum Following Oxidative Stress 1. Plant Physiol. 2018, 178, 1344–1357. [Google Scholar] [CrossRef] [Green Version]
- Álvarez-Fernández, M.A.; Fernández-Cruz, E.; Garcia-Parrilla, M.C.; Troncoso, A.M.; Mattivi, F.; Vrhovsek, U.; Arapitsas, P. Saccharomyces Cerevisiae and Torulaspora Delbrueckii Intra- and Extra-Cellular Aromatic Amino Acids Metabolism. J. Agric. Food Chem. 2019, 67, 7942–7953. [Google Scholar] [CrossRef]


Publisher’s Note: MDPI stays neutral with regard to jurisdictional claims in published maps and institutional affiliations. |
© 2022 by the authors. Licensee MDPI, Basel, Switzerland. This article is an open access article distributed under the terms and conditions of the Creative Commons Attribution (CC BY) license (https://creativecommons.org/licenses/by/4.0/).
Share and Cite
Duarte, B.; Feijão, E.; Cruz de Carvalho, R.; Duarte, I.A.; Marques, A.P.; Maia, M.; Hertzog, J.; Matos, A.R.; Cabrita, M.T.; Caçador, I.; et al. Untargeted Metabolomics Reveals Antidepressant Effects in a Marine Photosynthetic Organism: The Diatom Phaeodactylum tricornutum as a Case Study. Biology 2022, 11, 1770. https://doi.org/10.3390/biology11121770
Duarte B, Feijão E, Cruz de Carvalho R, Duarte IA, Marques AP, Maia M, Hertzog J, Matos AR, Cabrita MT, Caçador I, et al. Untargeted Metabolomics Reveals Antidepressant Effects in a Marine Photosynthetic Organism: The Diatom Phaeodactylum tricornutum as a Case Study. Biology. 2022; 11(12):1770. https://doi.org/10.3390/biology11121770
Chicago/Turabian StyleDuarte, Bernardo, Eduardo Feijão, Ricardo Cruz de Carvalho, Irina A. Duarte, Ana Patrícia Marques, Marisa Maia, Jasmine Hertzog, Ana Rita Matos, Maria Teresa Cabrita, Isabel Caçador, and et al. 2022. "Untargeted Metabolomics Reveals Antidepressant Effects in a Marine Photosynthetic Organism: The Diatom Phaeodactylum tricornutum as a Case Study" Biology 11, no. 12: 1770. https://doi.org/10.3390/biology11121770