
Ovine Mesenchymal Stem Cell Chondrogenesis on a Novel 3D-Printed Hybrid Scaffold In Vitro
 , , , , , and
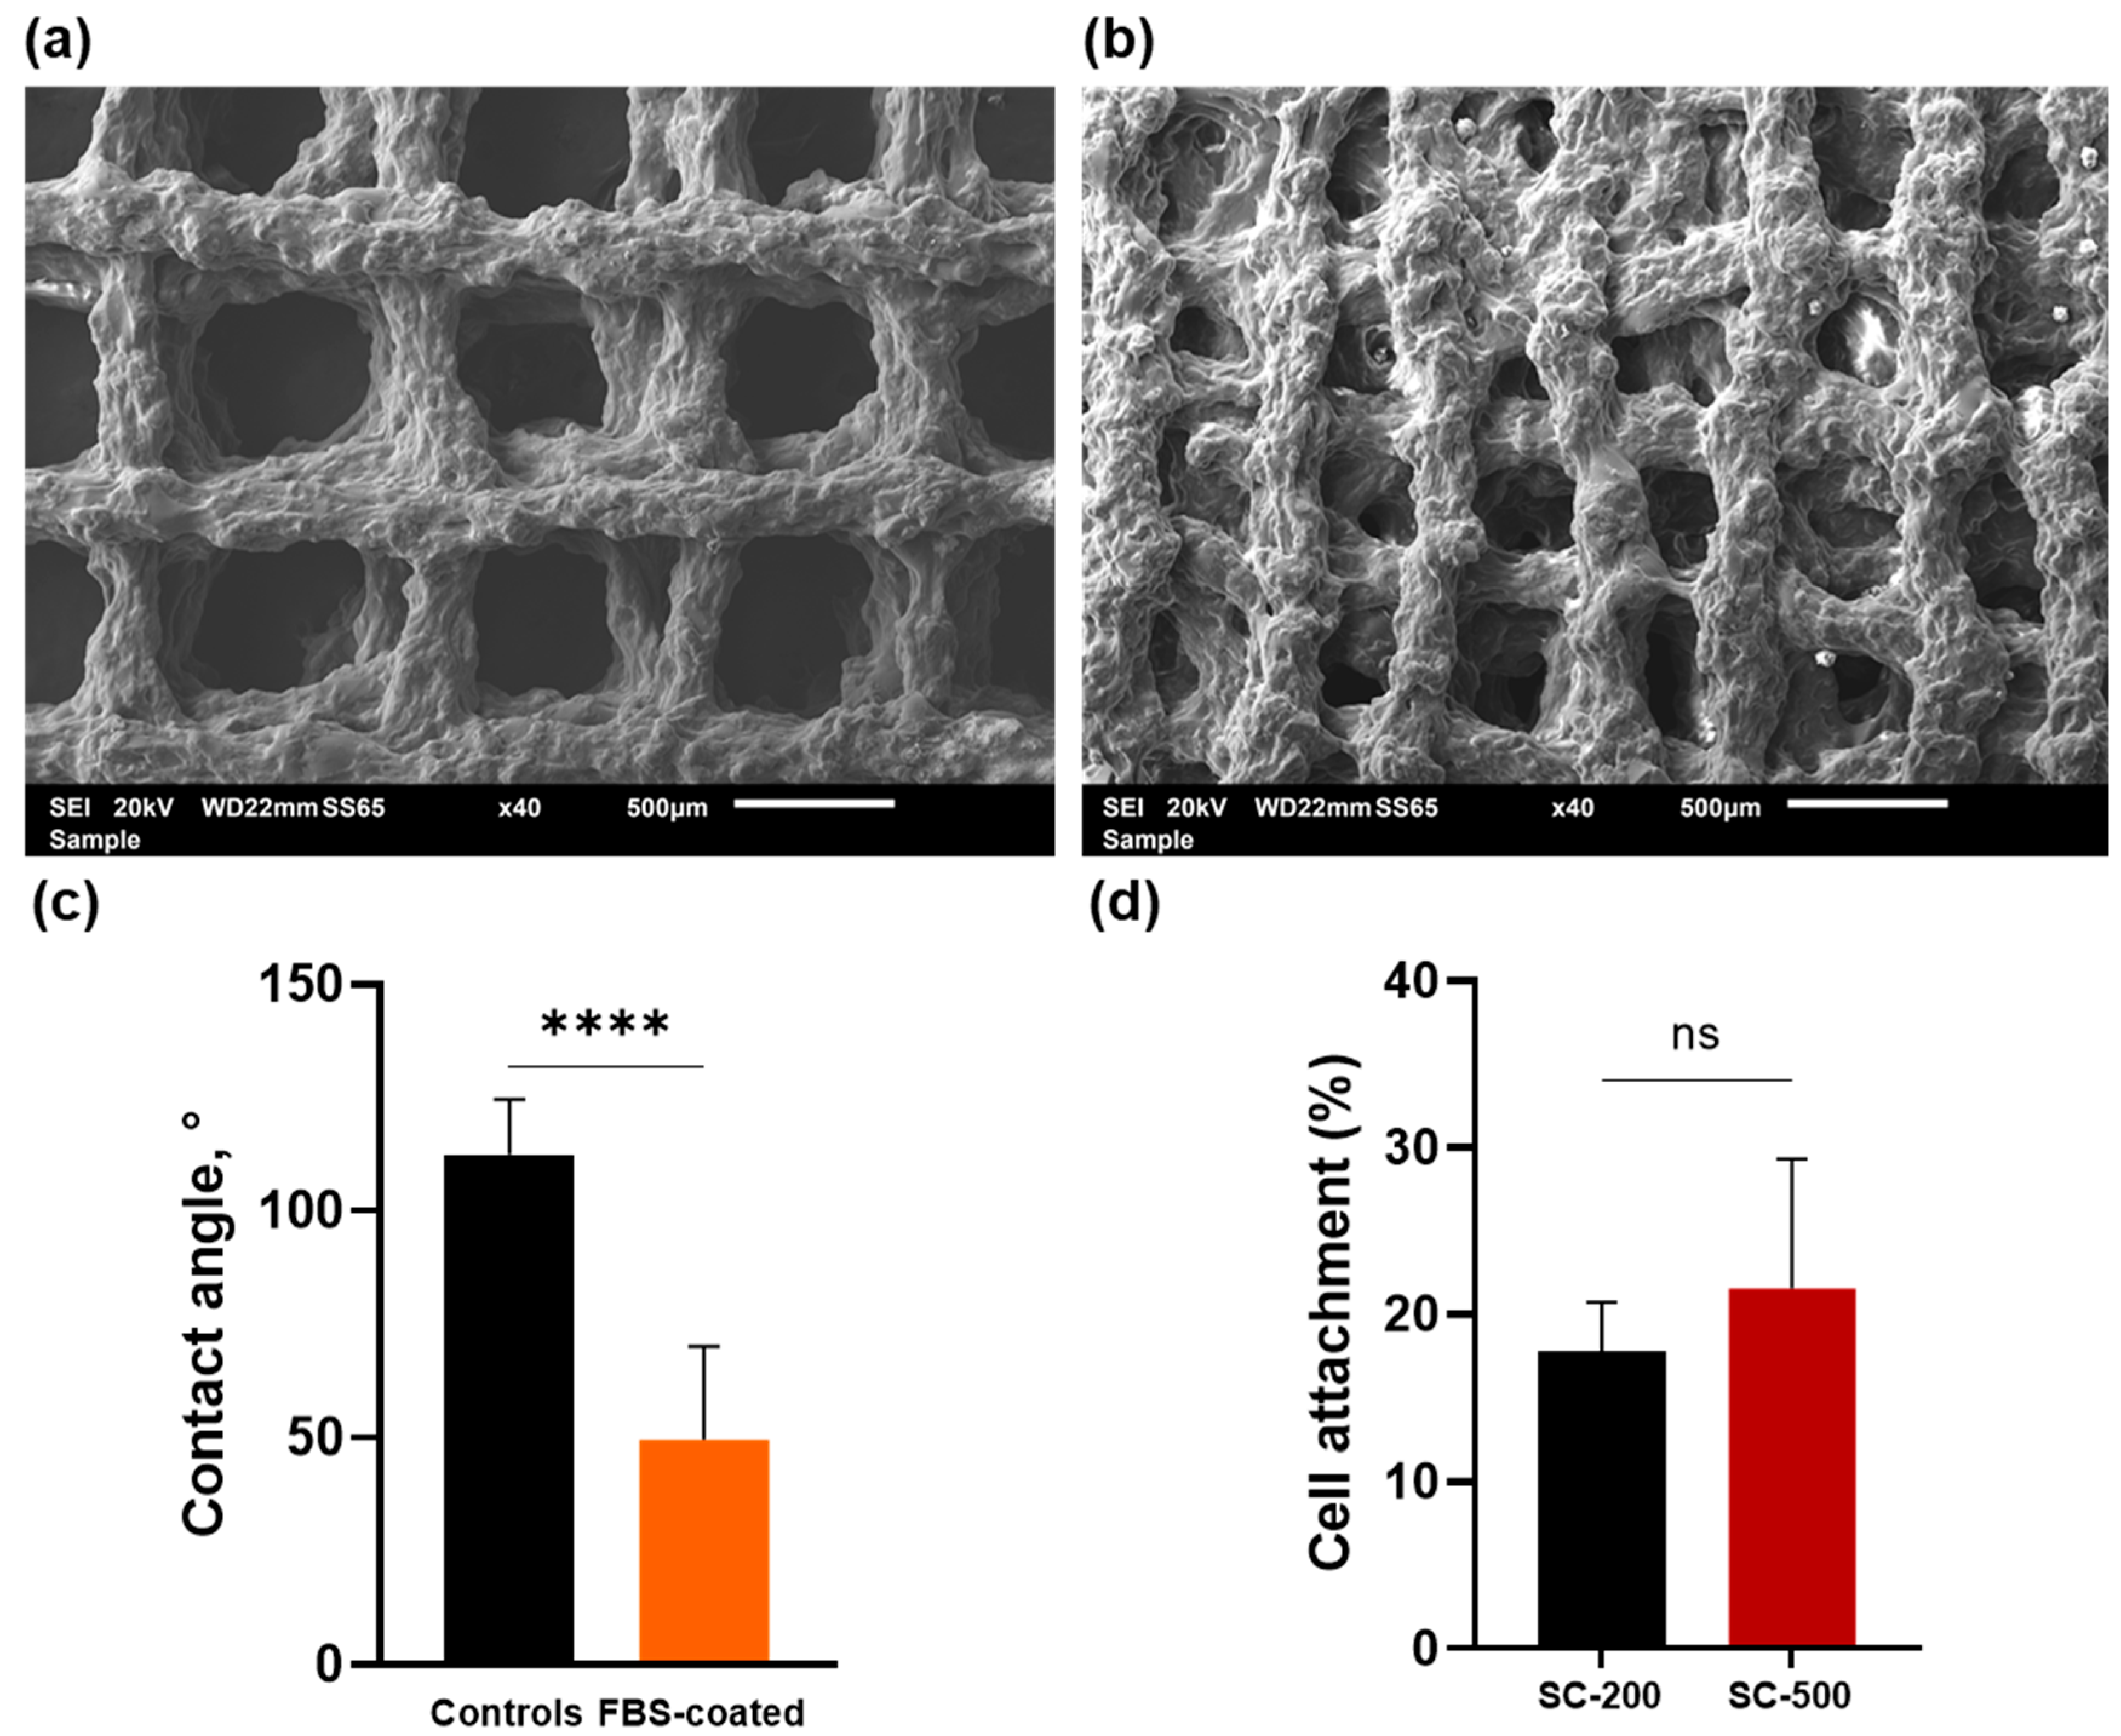
Abstract
:1. Introduction
2. Materials and Methods
2.1. Hybrid Synthesis
2.2. Direct Ink Writing for Hybrid Scaffold Fabrication and Characterisation
2.3. Isolation and Characterisation of Ovine Mesenchymal Stem Cells
2.4. In Vitro Cell Culture
2.5. Cell Seeding on Scaffolds
2.6. Cellular Attachment and Viability
2.7. Live/Dead Staining
2.8. Cellular Morphology by Scanning Electron Microscopy
2.9. RNA Extraction and RT-qPCR
2.10. Immunohistochemistry
2.11. Sulphated Glycosaminoglycan (sGAGs) Quantification
Statistical Analysis
3. Results
3.1. Contact Angle and Cell Attachment
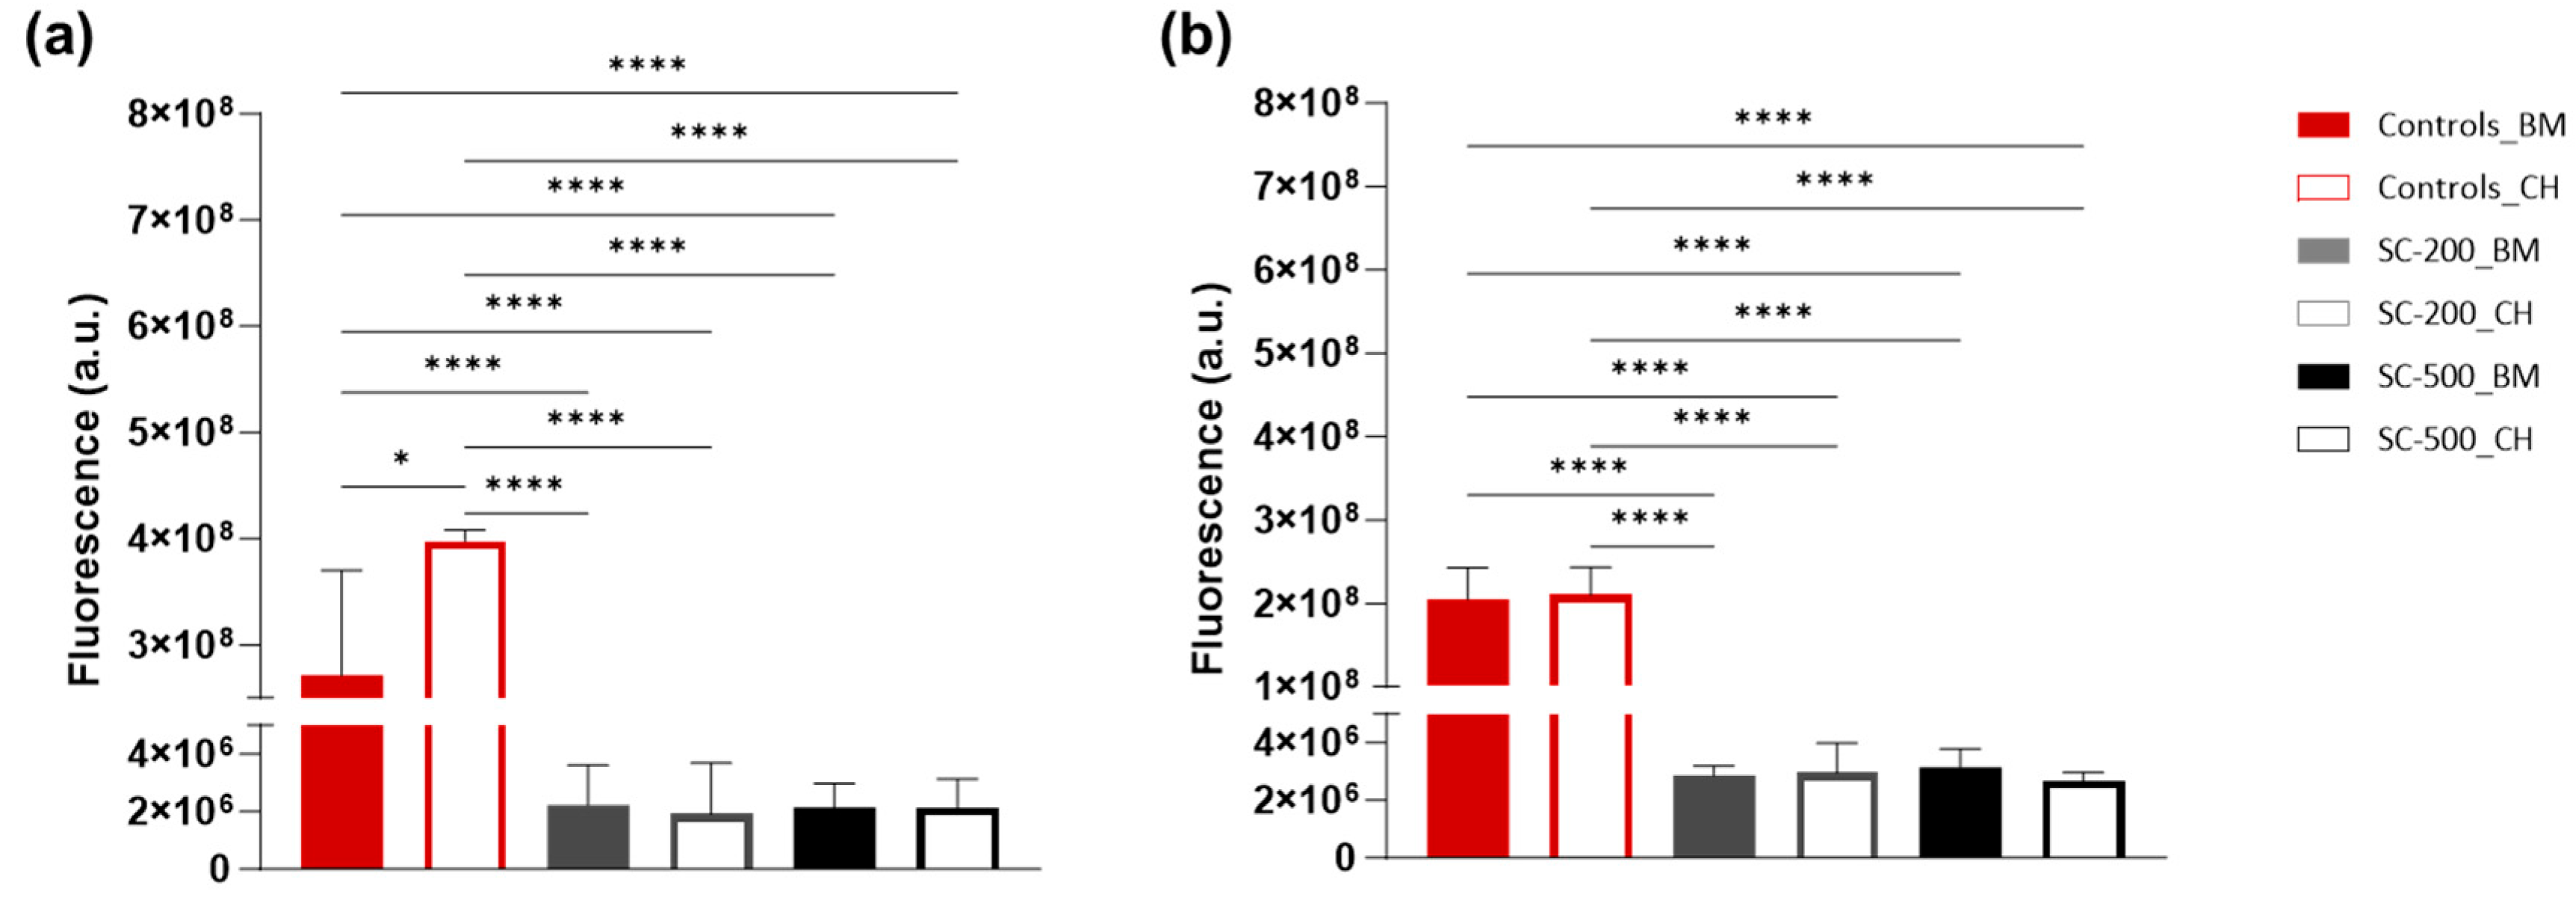
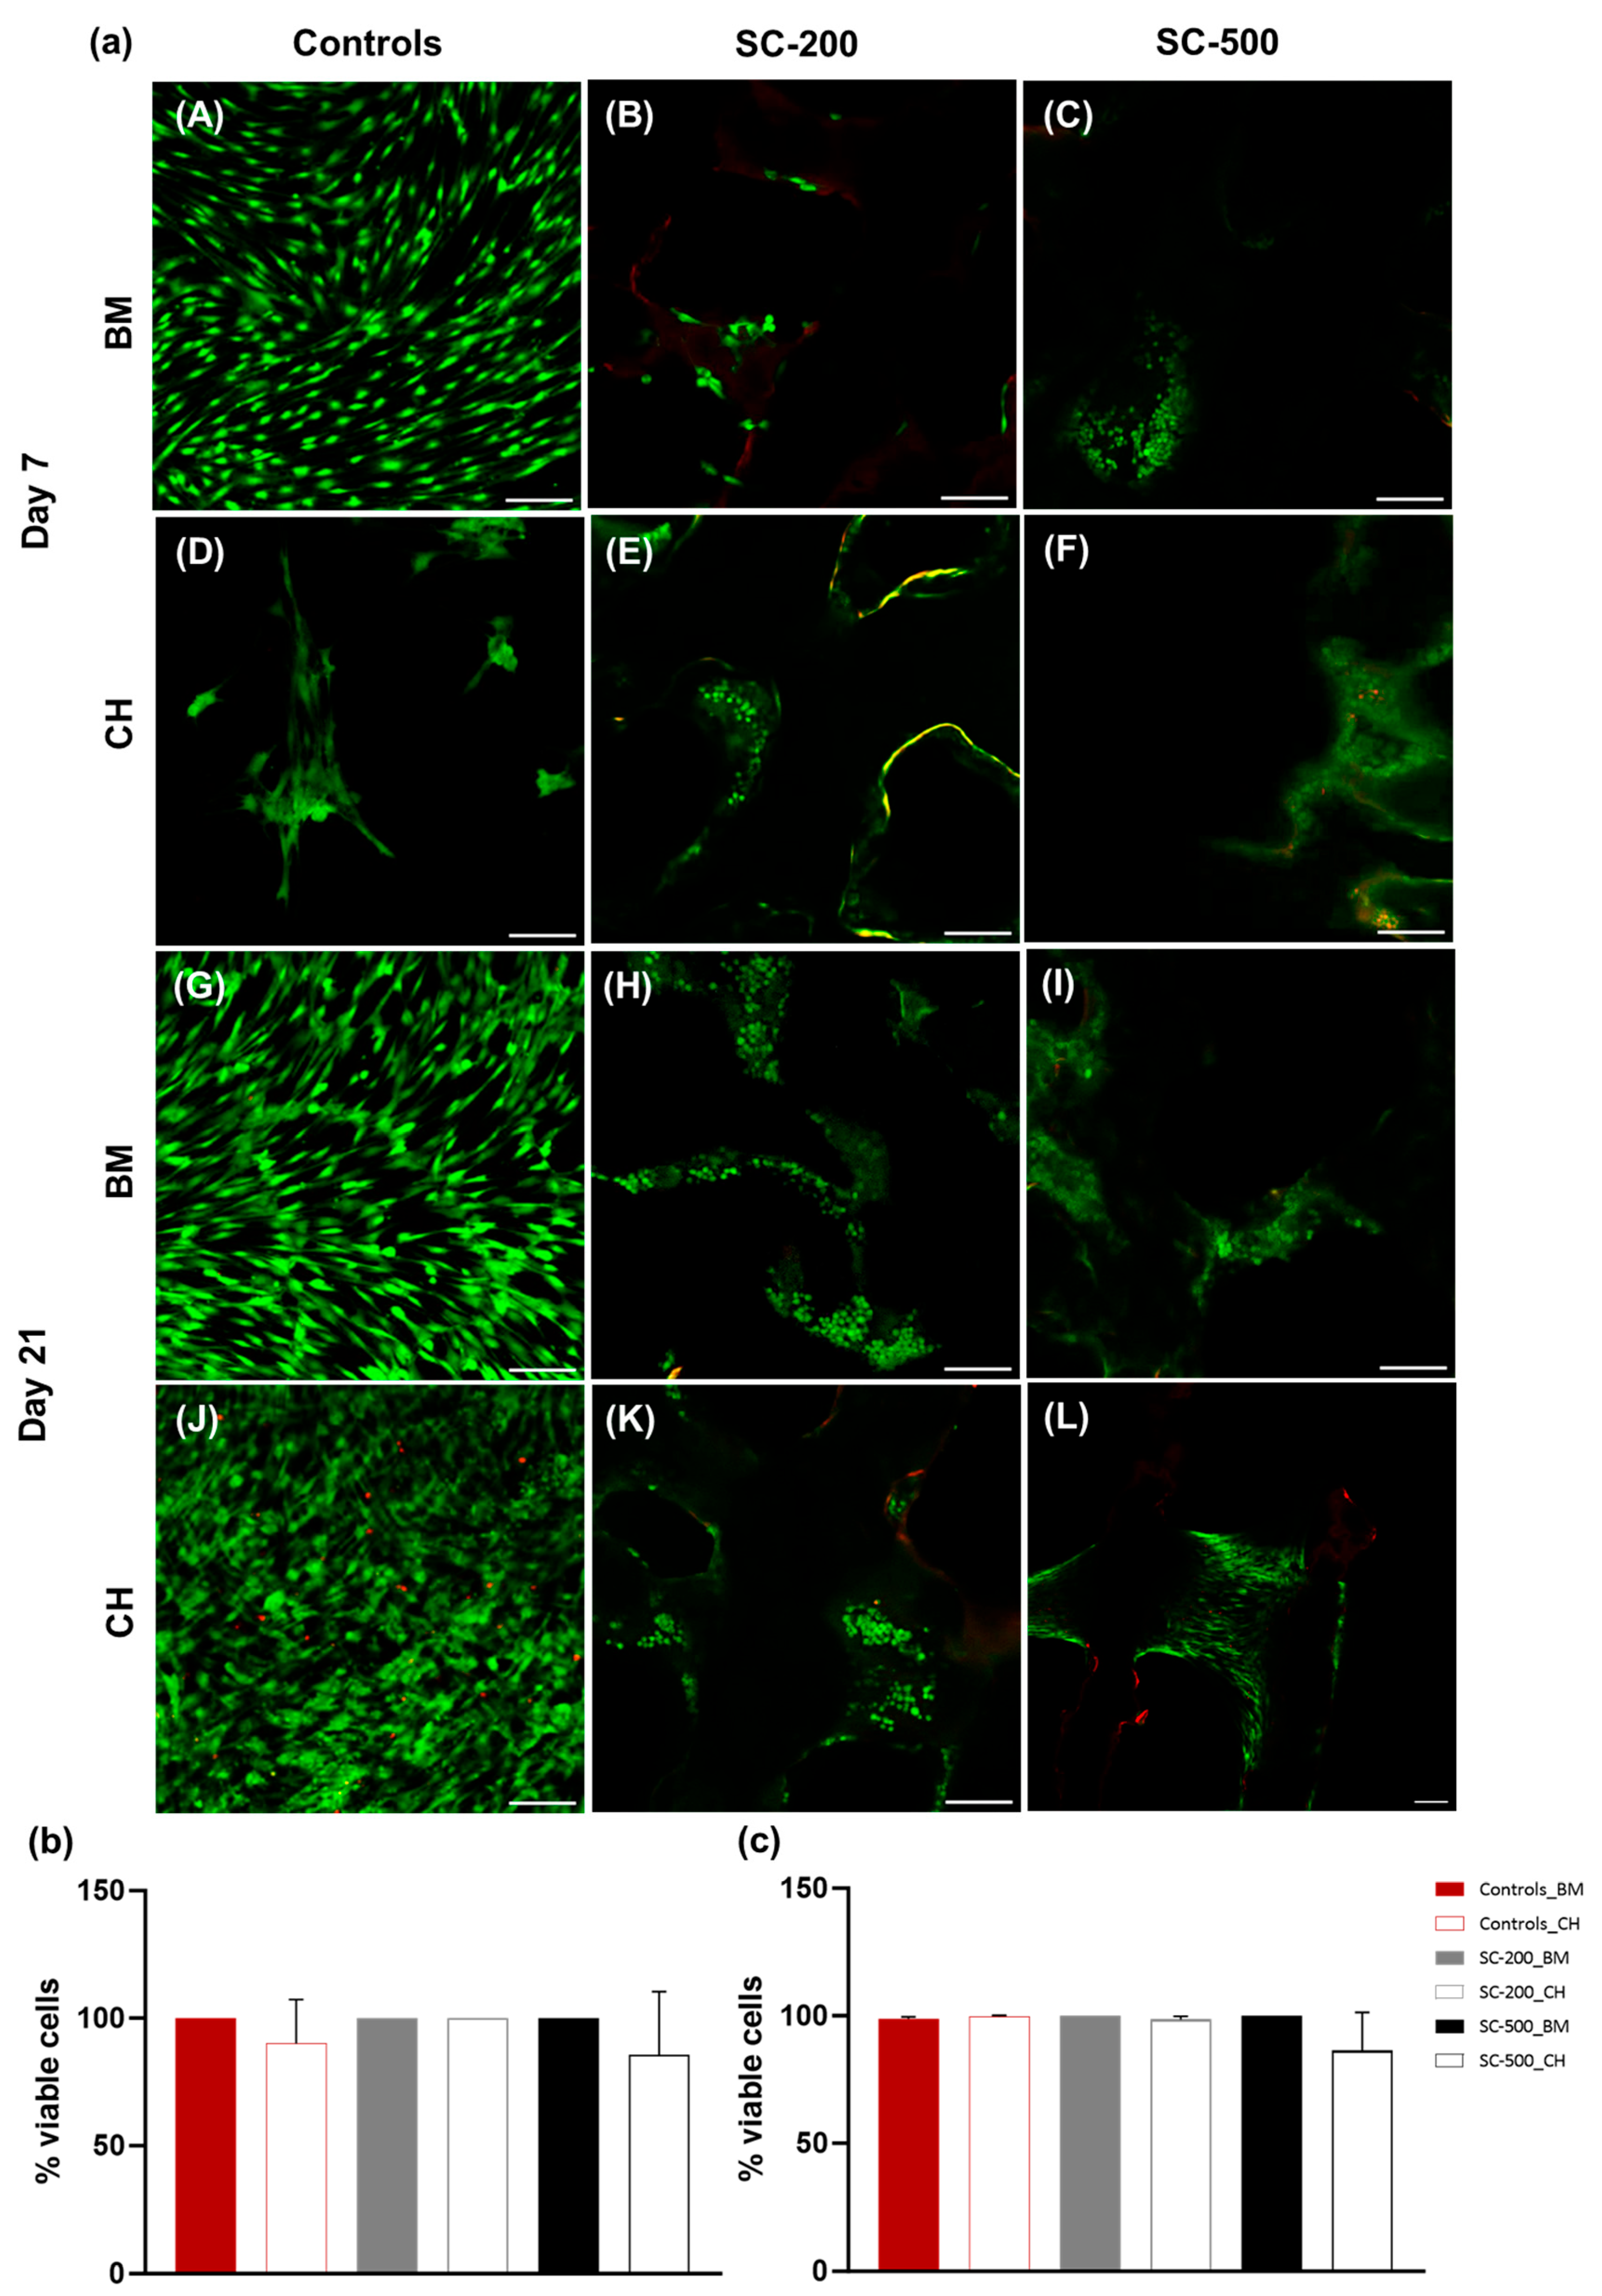
3.2. Cell Metabolic Activity and Viability
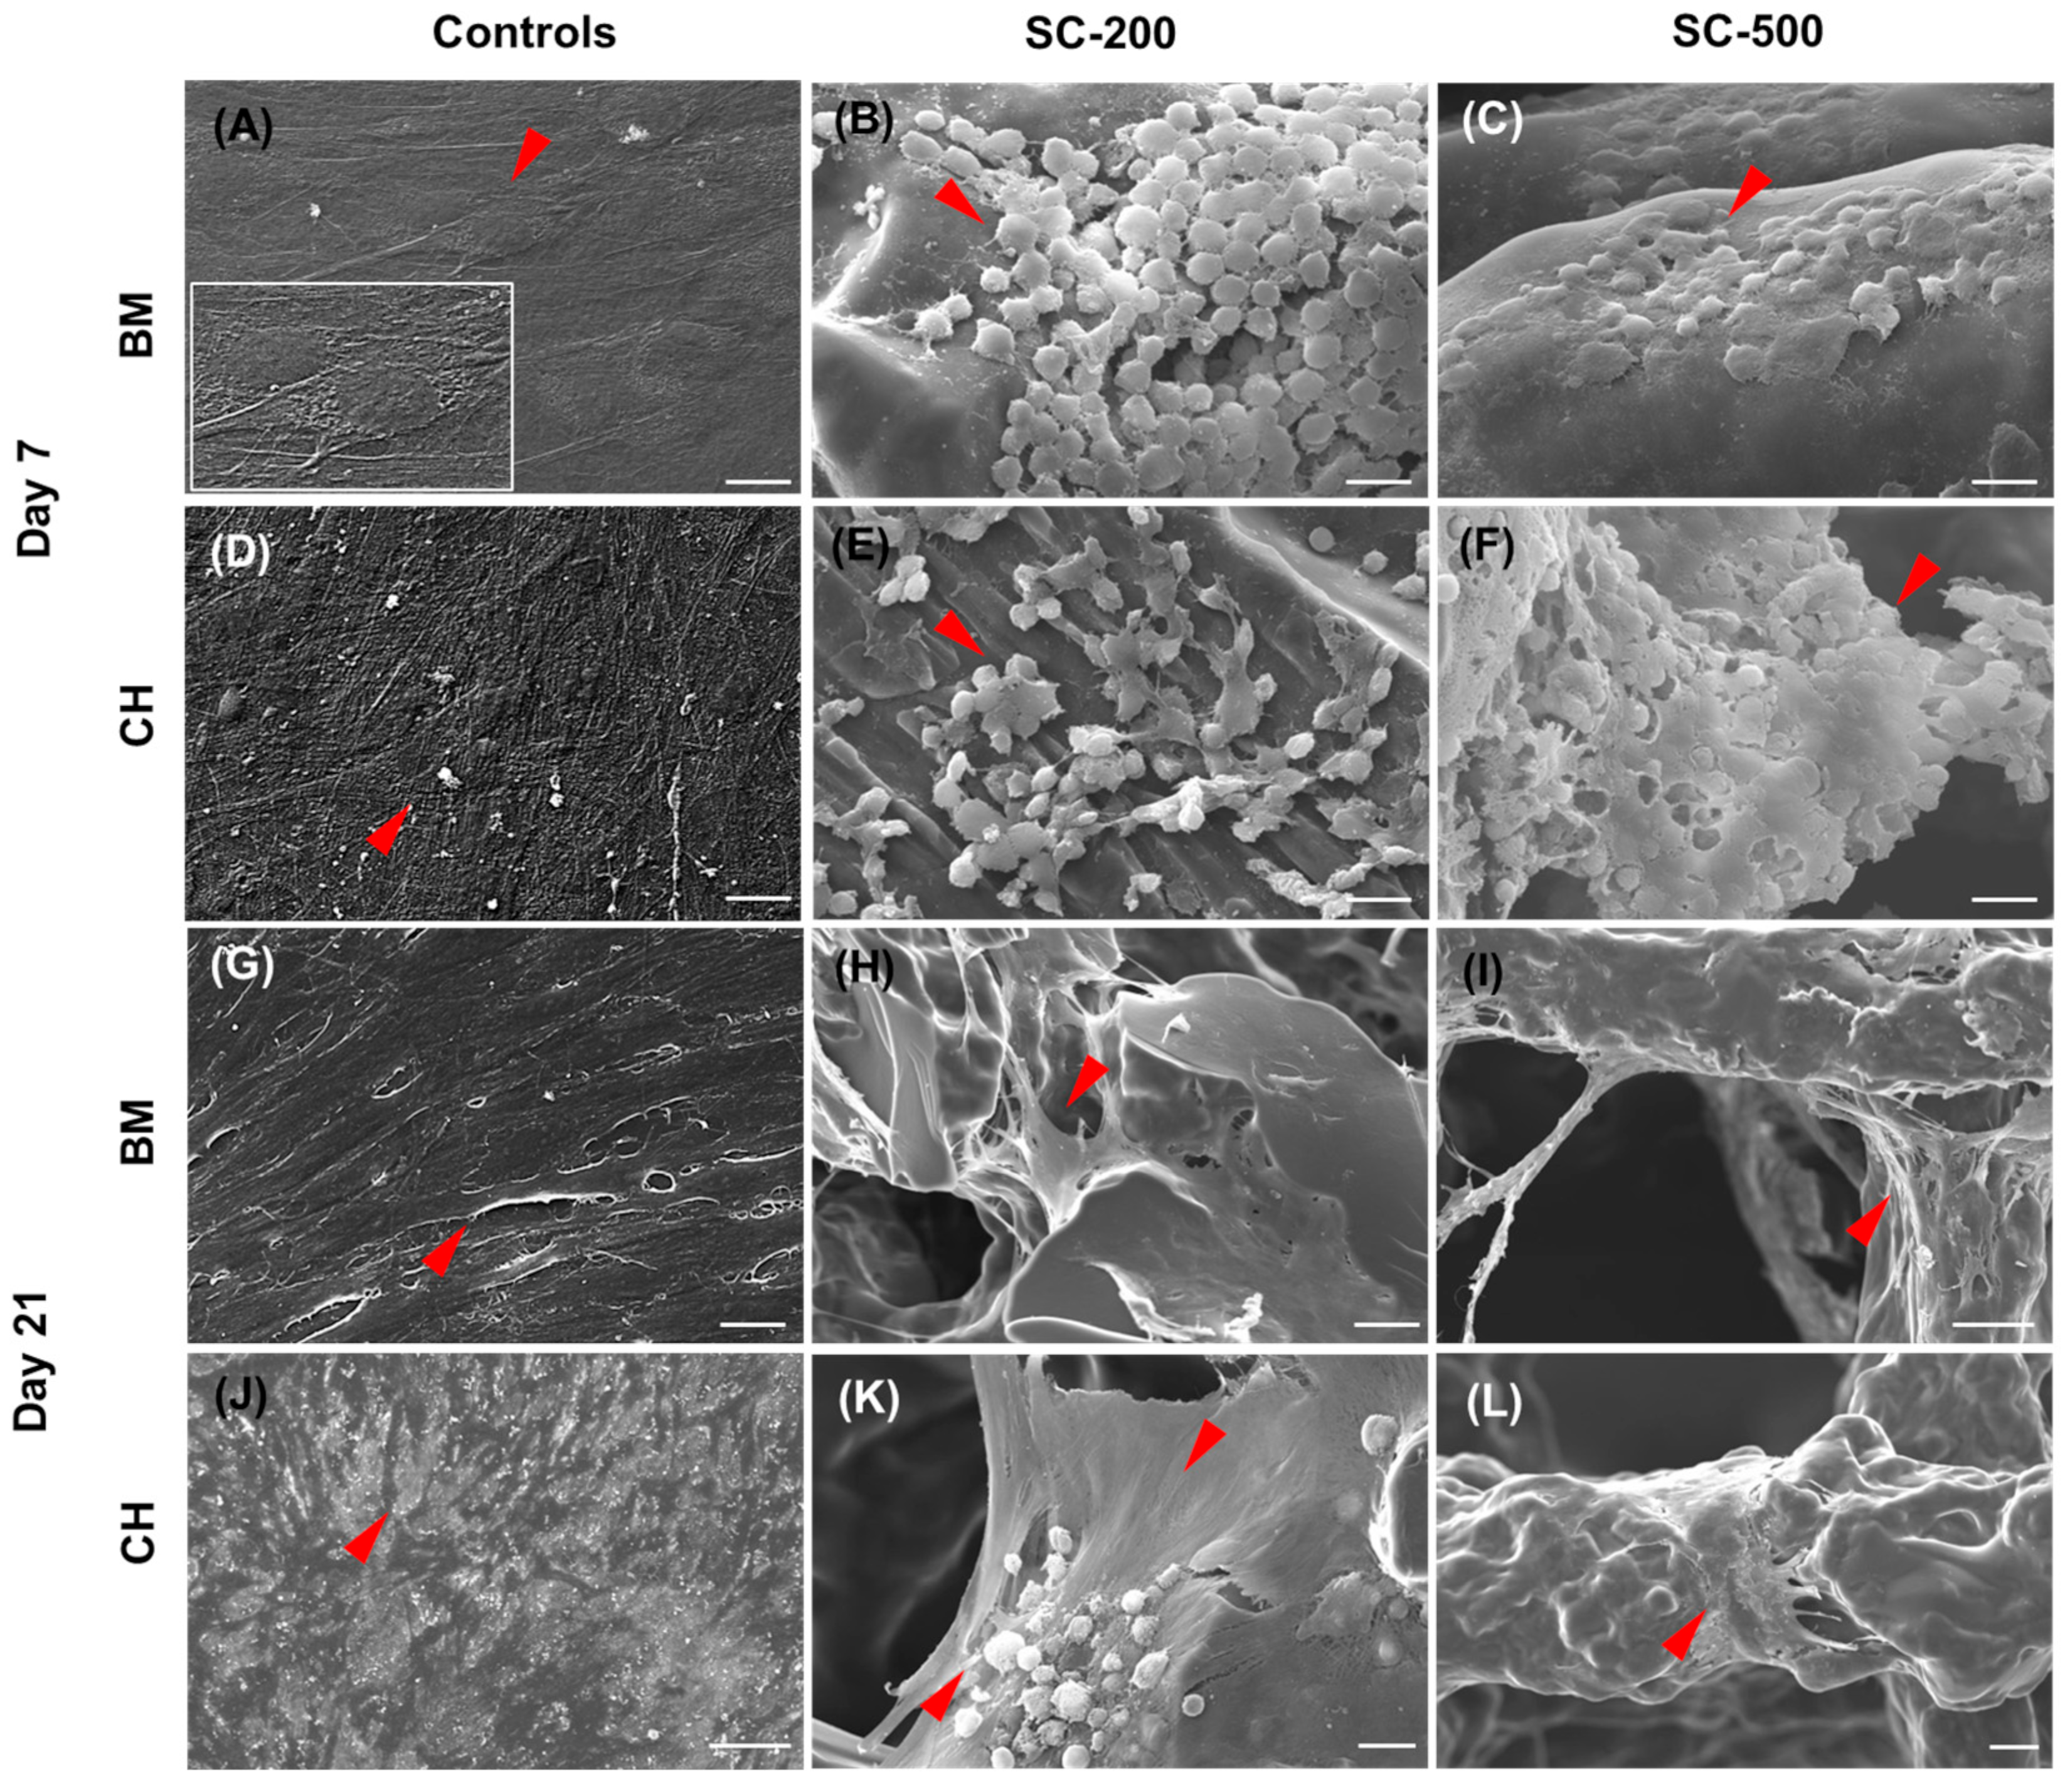
3.3. Cell Morphology
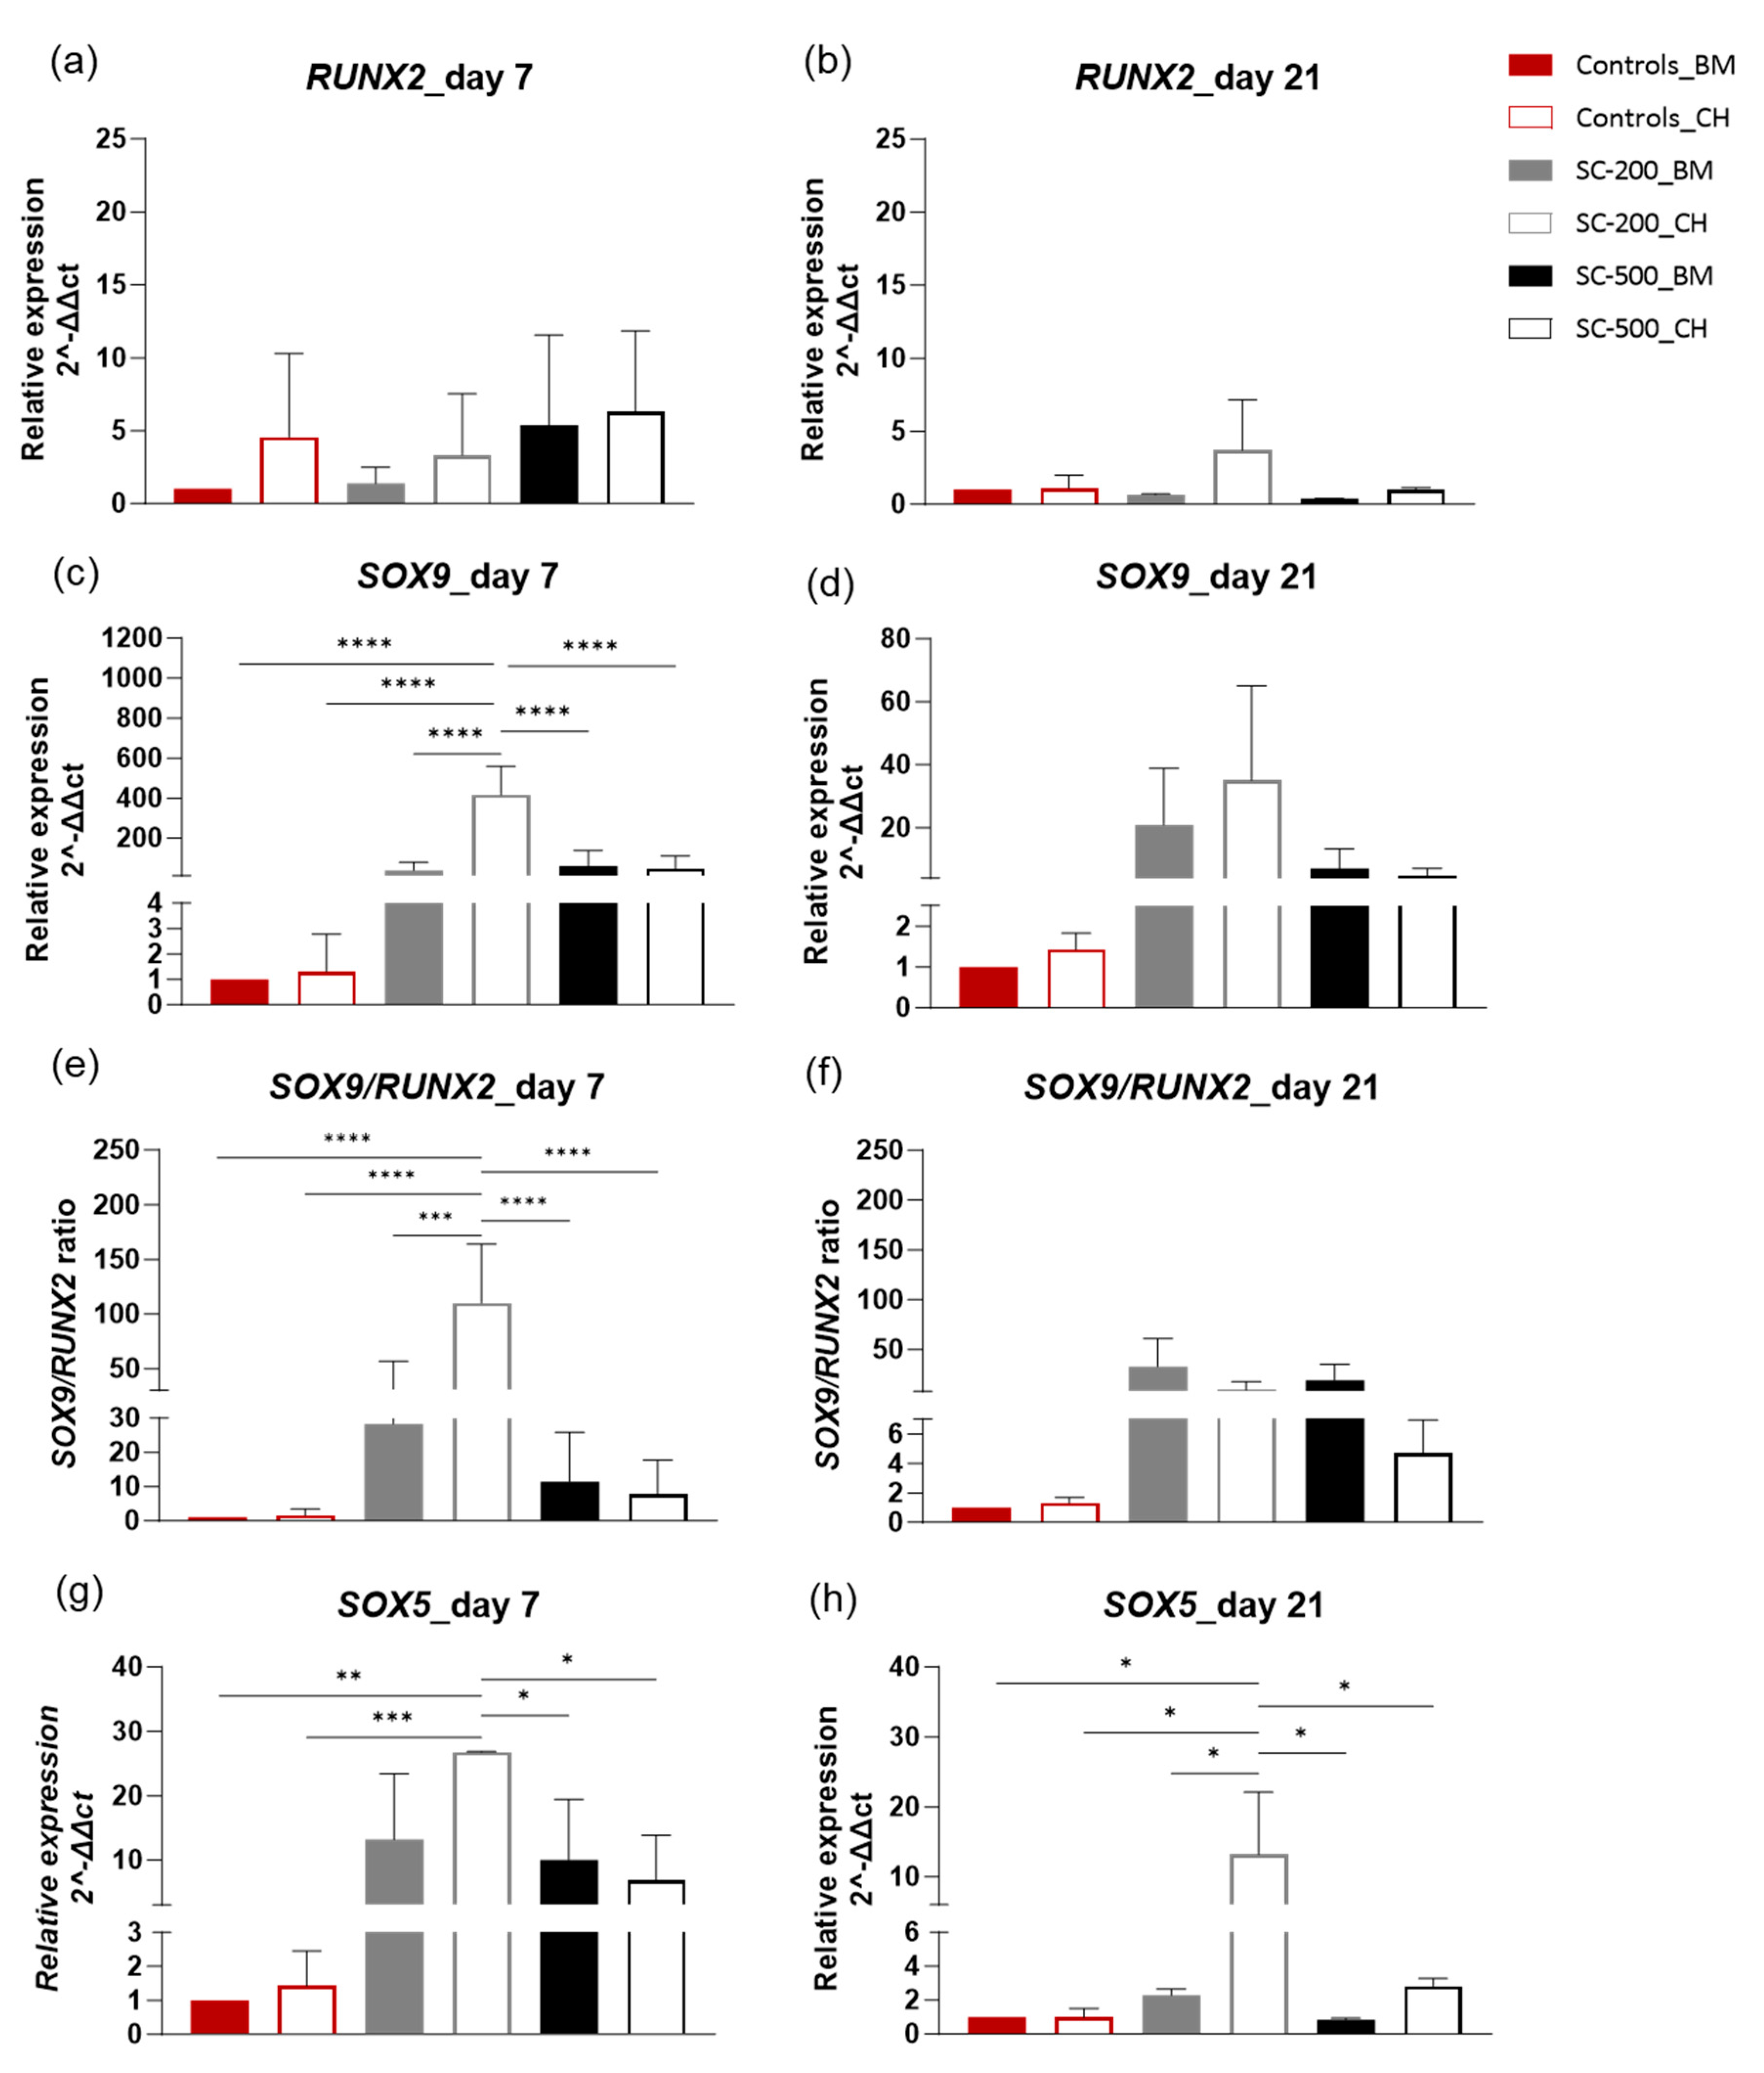
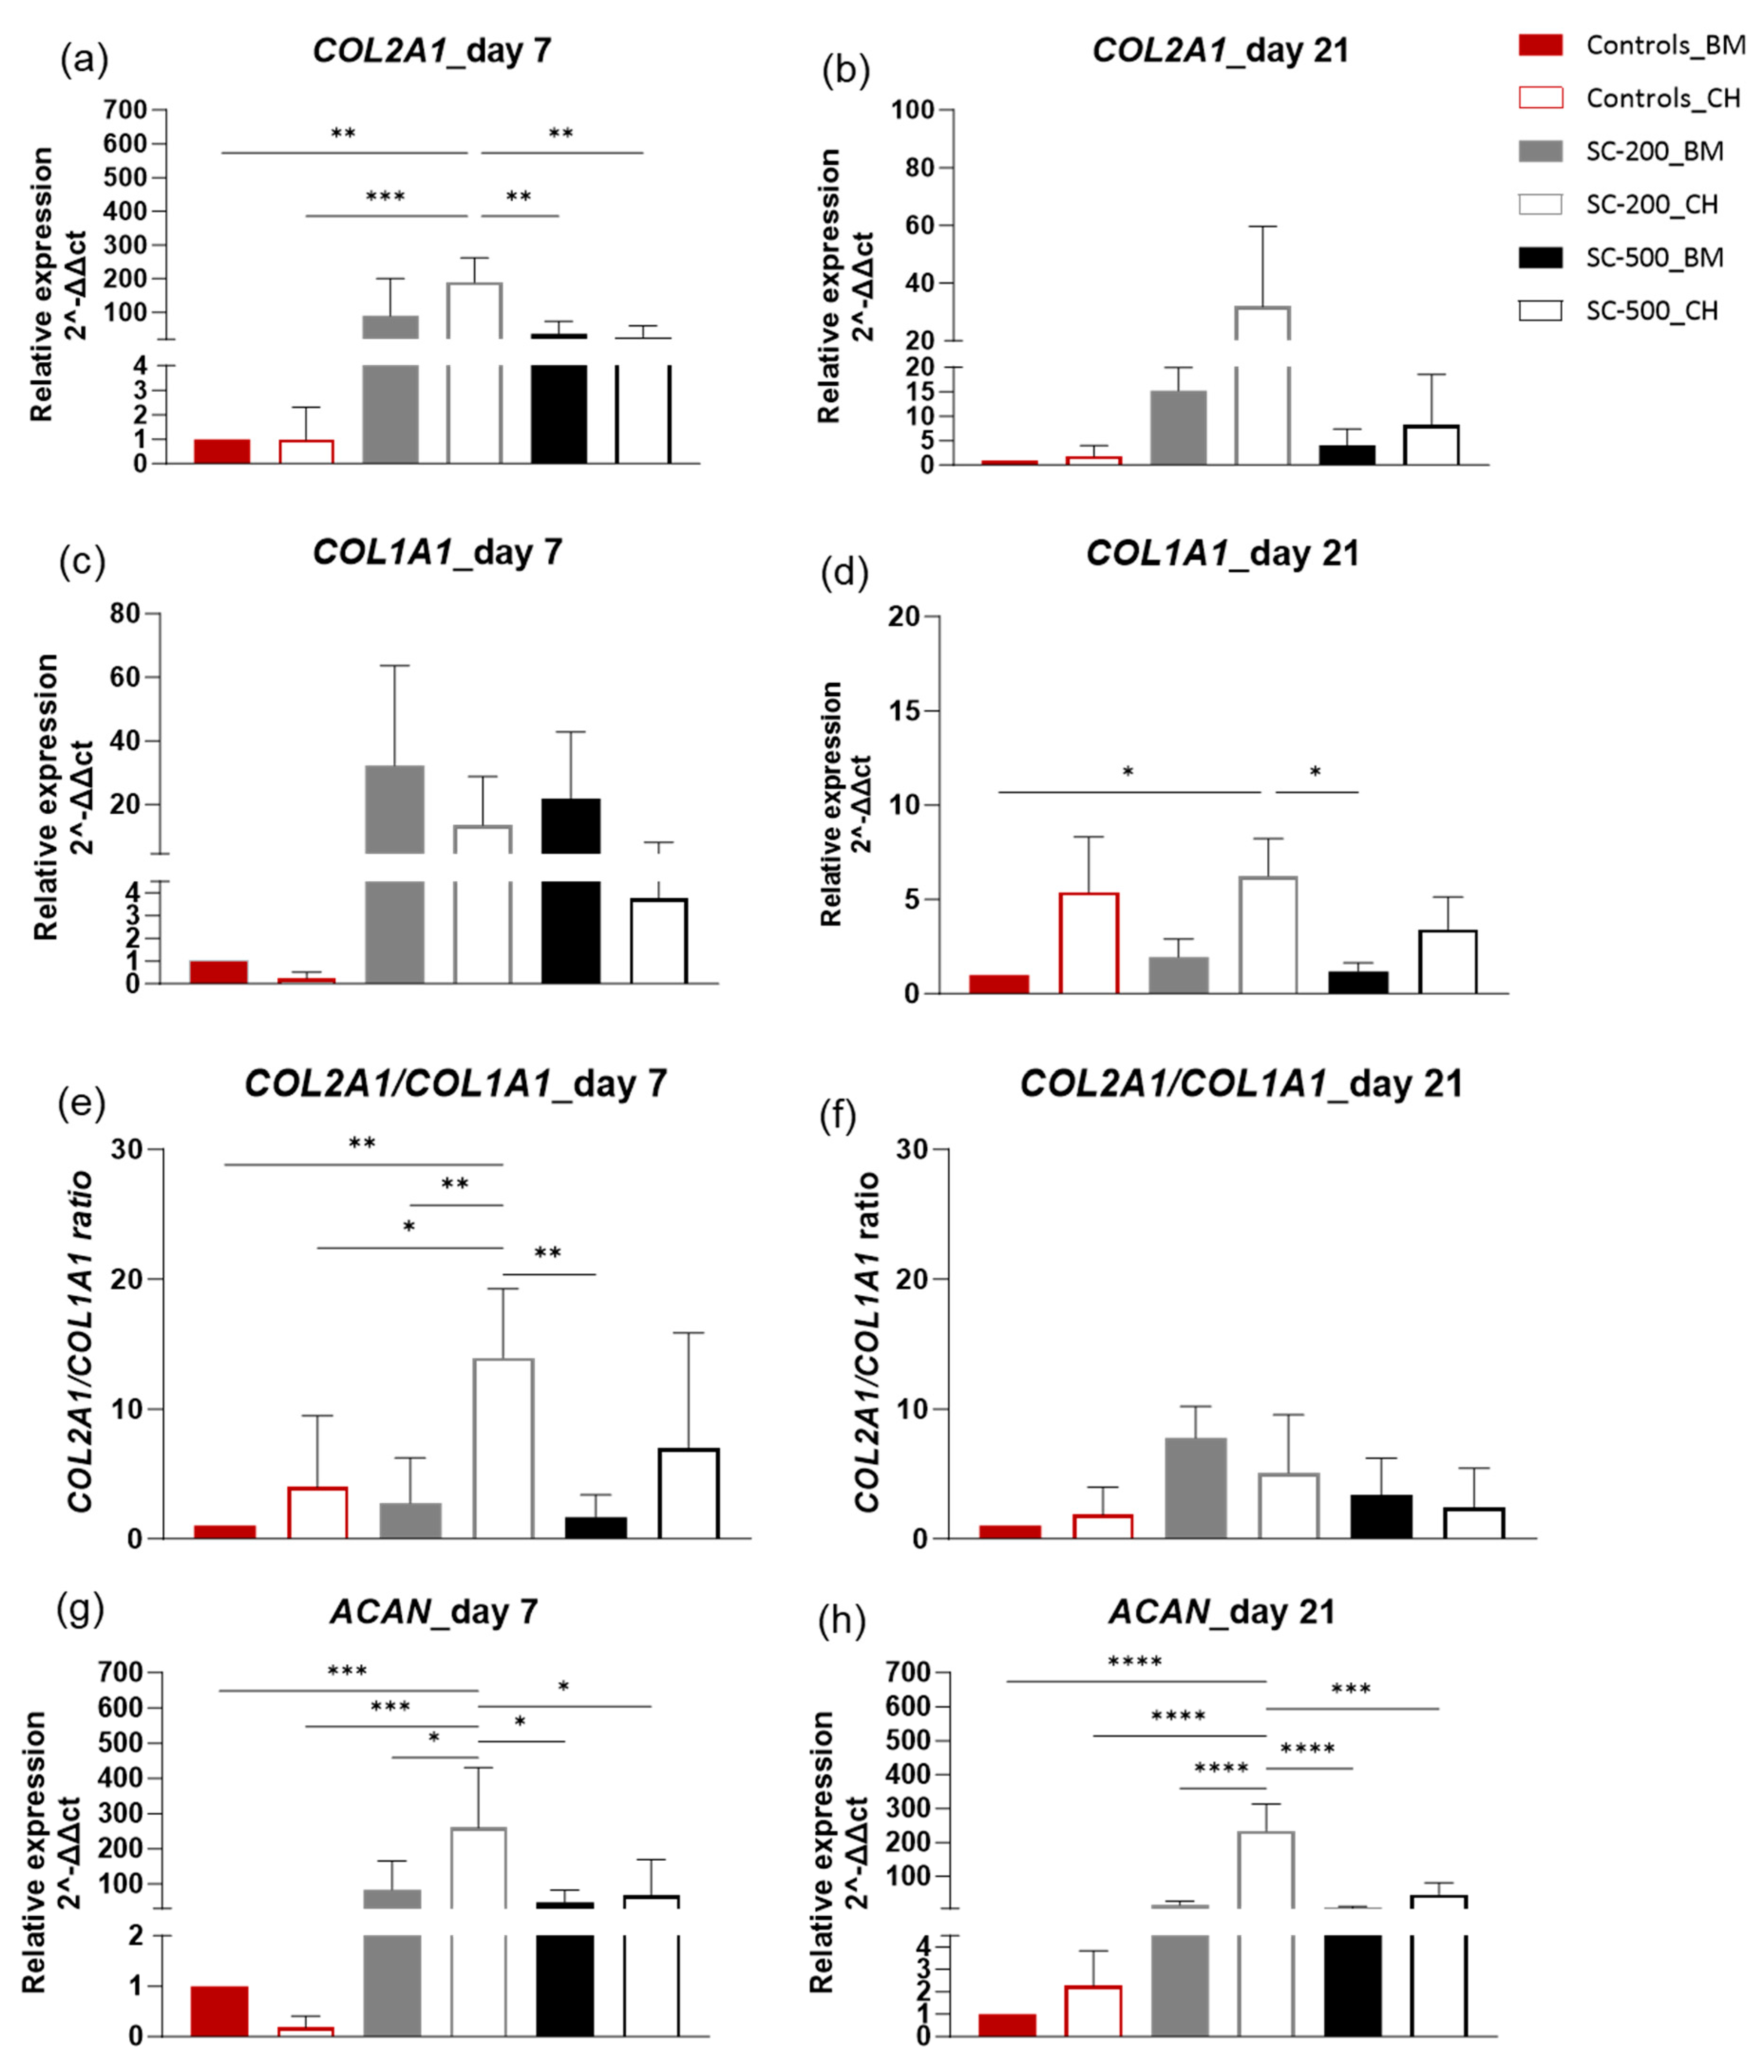
3.4. Relative Gene Expression
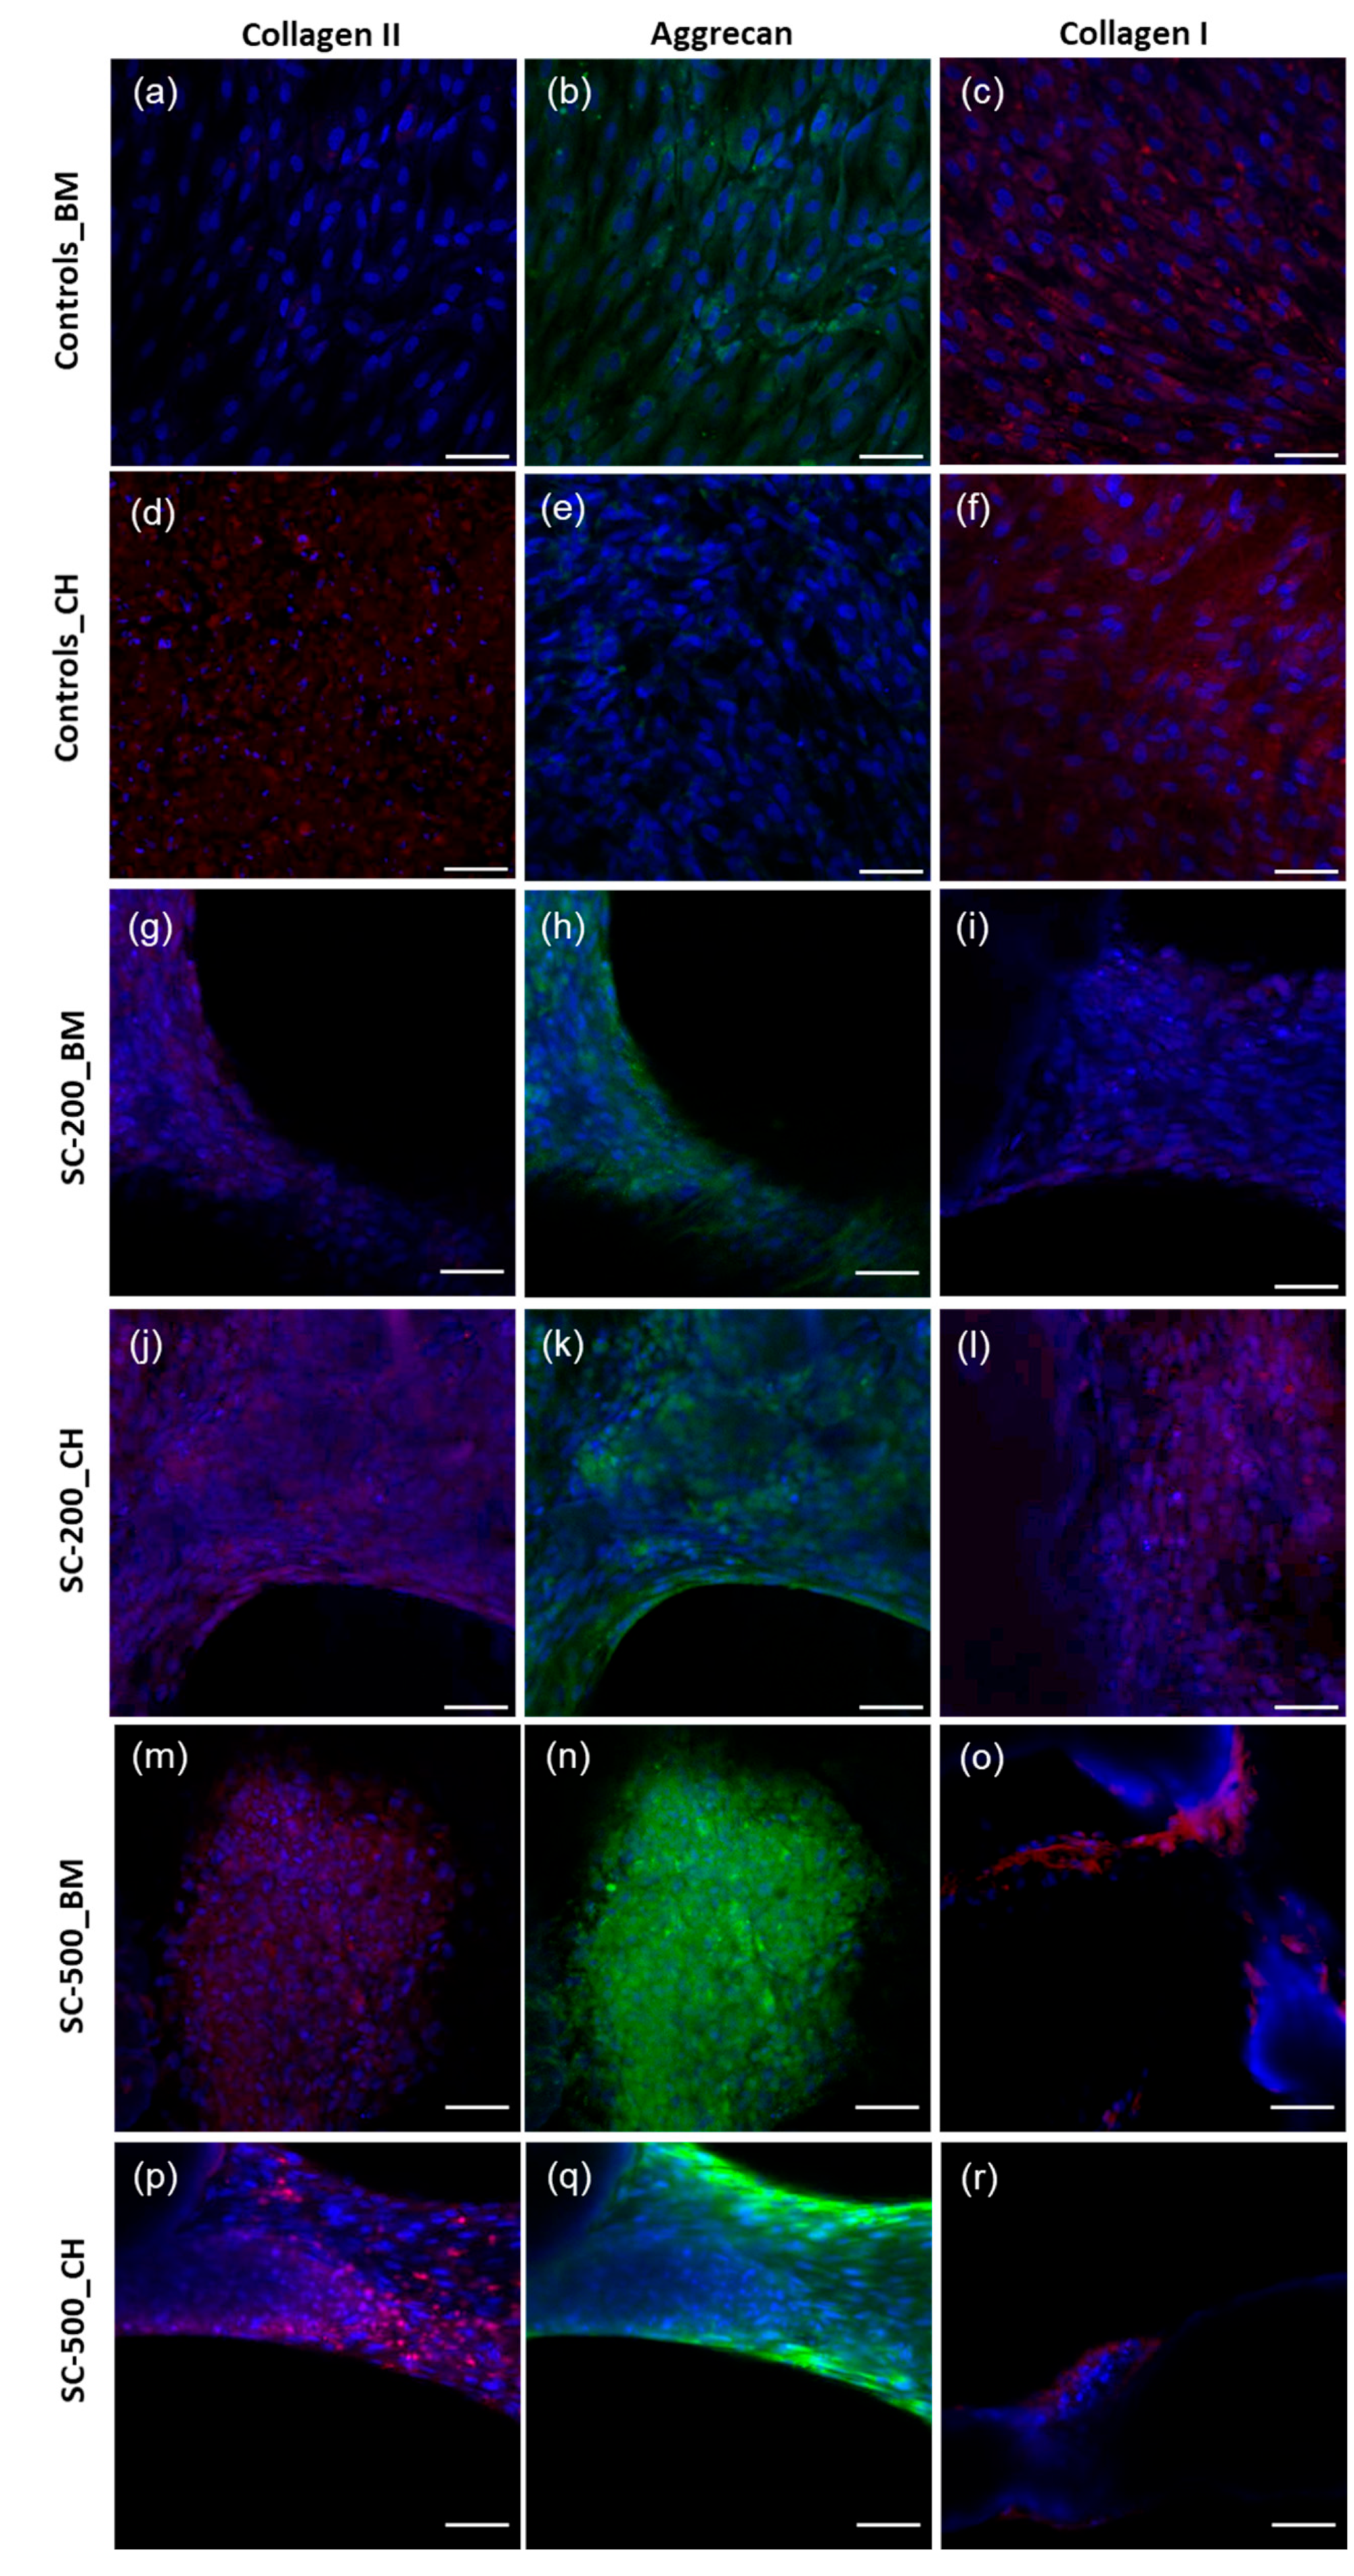
3.5. Immunohistochemistry
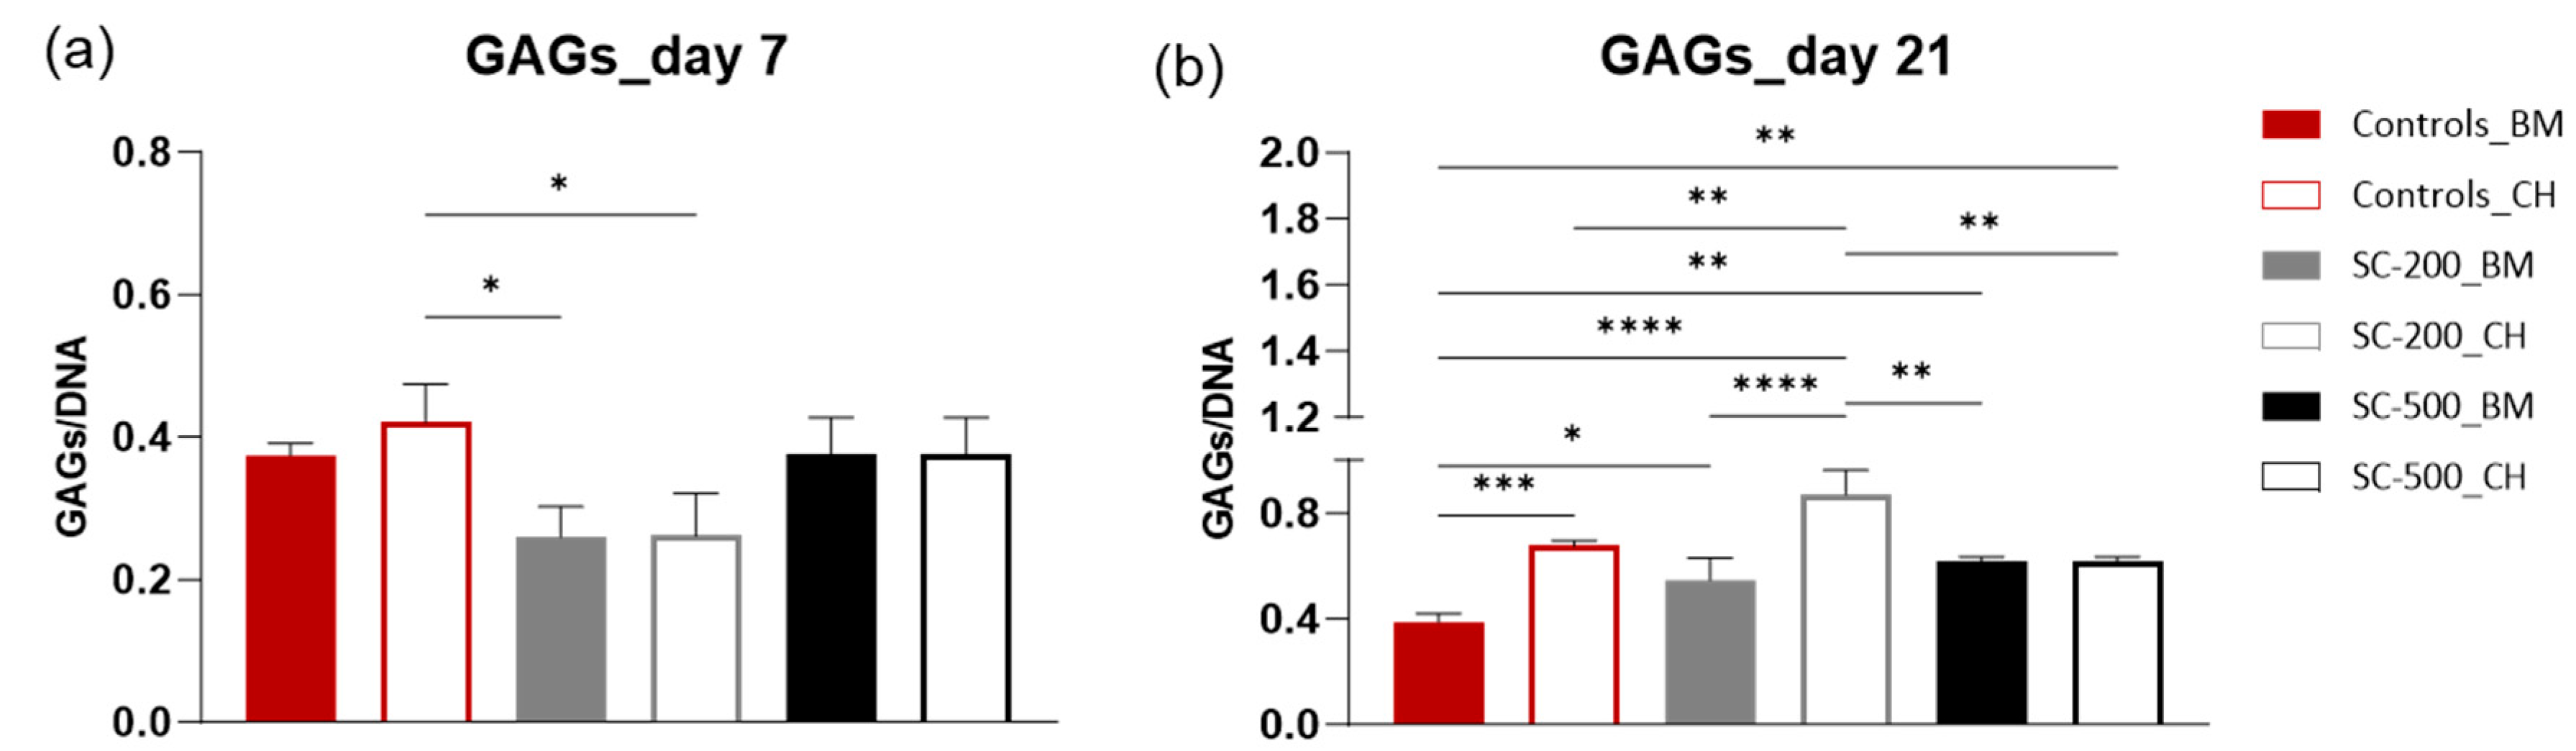
3.6. Sulfated Glycosaminoglycan Quantification
4. Discussion
5. Conclusions
Supplementary Materials
Author Contributions
Funding
Institutional Review Board Statement
Informed Consent Statement
Data Availability Statement
Acknowledgments
Conflicts of Interest
References
- Sophia Fox, A.J.; Bedi, A.; Rodeo, S.A. The basic science of articular cartilage: Structure, composition, and function. Sports Health 2009, 1, 461–468. [Google Scholar] [CrossRef] [PubMed]
- Davis, S.; Roldo, M.; Blunn, G.; Tozzi, G.; Roncada, T. Influence of the Mechanical Environment on the Regeneration of Osteochondral Defects. Front. Bioeng. Biotechnol. 2021, 9, 603408. [Google Scholar] [CrossRef] [PubMed]
- De Mori, A.; Peña Fernández, M.; Blunn, G.; Tozzi, G.; Roldo, M. 3D Printing and Electrospinning of Composite Hydrogels for Cartilage and Bone Tissue Engineering. Polymers 2018, 10, 285. [Google Scholar] [CrossRef] [PubMed]
- Belluzzi, E.; Todros, S.; Pozzuoli, A.; Ruggieri, P.; Carniel, E.L.; Berardo, A. Human Cartilage Biomechanics: Experimental and Theoretical Approaches towards the Identification of Mechanical Properties in Healthy and Osteoarthritic Conditions. Processes 2023, 11, 1014. [Google Scholar] [CrossRef]
- Bhosale, A.M.; Richardson, J.B. Articular cartilage: Structure, injuries and review of management. Br. Med. Bull. 2008, 87, 77–95. [Google Scholar] [CrossRef] [PubMed]
- Hoshino, T.; Tsuji, K.; Onuma, H.; Udo, M.; Ueki, H.; Akiyama, M.; Abula, K.; Katagiri, H.; Miyatake, K.; Watanabe, T.; et al. Persistent synovial inflammation plays important roles in persistent pain development in the rat knee before cartilage degradation reaches the subchondral bone. BMC Musculoskelet. Disord. 2018, 19, 291. [Google Scholar] [CrossRef] [PubMed]
- Hevesi, M.; Hevesi, M.; Sanders, T.L.; Pareek, A.; Milbrandt, T.A.; Levy, B.A.; Stuart, M.J.; Saris, D.B.F.; Krych, A.J. Osteochondritis Dissecans in the Knee of Skeletally Immature Patients: Rates of Persistent Pain, Osteoarthritis, and Arthroplasty at Mean 14-Years’ Follow-Up. Cartilage 2020, 11, 291–299. [Google Scholar] [CrossRef]
- Stone, L.S. Joint degeneration and chronic pain: Still looking for the missing link. Pain 2009, 141, 185–186. [Google Scholar] [CrossRef]
- Houck, D.A.; Kraeutler, M.J.; Belk, J.W.; Frank, R.M.; McCarty, E.C.; Bravman, J.T. Do Focal Chondral Defects of the Knee Increase the Risk for Progression to Osteoarthritis? A Review of the Literature. Orthop. J. Sports Med. 2018, 6, 2325967118801931. [Google Scholar] [CrossRef]
- Fisher, M.B.; Henning, E.A.; Söegaard, N.B.; Dodge, G.R.; Steinberg, D.R.; Mauck, R.L. Maximizing cartilage formation and integration via a trajectory-based tissue engineering approach. Biomaterials 2014, 35, 2140–2148. [Google Scholar] [CrossRef]
- Kramer, J.; Böhrnsen, F.; Lindner, U.; Behrens, P.; Schlenke, P.; Rohwedel, J. In vivo matrix-guided human mesenchymal stem cells. Cell. Mol. Life Sci. 2006, 63, 616–626. [Google Scholar] [CrossRef] [PubMed]
- Ratner, B.D.; Bryant, S.J. Biomaterials: Where We Have Been and Where We Are Going. Annu. Rev. Biomed. Eng. 2004, 6, 41–75. [Google Scholar] [CrossRef] [PubMed]
- Zhang, Z.; Zhong, X.; Ji, H.; Tang, Z.; Bai, J.; Yao, M.; Hou, J.; Zheng, M.; Wood, D.J.; Sun, J.; et al. Matrix-induced autologous chondrocyte implantation for the treatment of chondral defects of the knees in Chinese patients. Drug Des. Dev. Ther. 2014, 8, 2439–2448. [Google Scholar]
- Basad, E.; Wissing, F.R.; Fehrenbach, P.; Rickert, M.; Steinmeyer, J.; Ishaque, B. Matrix-induced autologous chondrocyte implantation (MACI) in the knee: Clinical outcomes and challenges. Knee Surg. Sports Traumatol. Arthrosc. 2015, 23, 3729–3735. [Google Scholar] [CrossRef] [PubMed]
- Niemeyer, P.; Albrecht, D.; Andereya, S.; Angele, P.; Ateschrang, A.; Aurich, M.; Fritz, J. Autologous chondrocyte implantation (ACI) for cartilage defects of the knee: A guideline by the working group ‘Clinical Tissue Regeneration’ of the German Society of Orthopaedics and Trauma (DGOU). Knee 2016, 23, 426–435. [Google Scholar] [CrossRef]
- Erickson, B.J.; Strickland, S.M.; Gomoll, A.H. Indications, Techniques, Outcomes for Matrix-Induced Autologous Chondrocyte Implantation (MACI). Oper. Tech. Sports Med. 2018, 26, 175–182. [Google Scholar] [CrossRef]
- Bartlett, W.; Skinner, J.A.; Gooding, C.R.; Carrington, R.W.; Flanagan, A.M.; Briggs, T.W.; Bentley, G. Autologous chondrocyte implantation versus matrix-induced autologous chondrocyte implantation for osteochondral defects of the knee: A prospective, randomised study. J. Bone Jt. Surg. Br. Vol. 2005, 87, 640–645. [Google Scholar] [CrossRef]
- Manjunath, A.K.; Hurley, E.T.; Strauss, E.J. Autologous Chondrocyte Implantation as a Two Stage Approach (MACI). Oper. Tech. Sports Med. 2020, 28, 150783. [Google Scholar] [CrossRef]
- Benthien, J.P.; Behrens, P. Autologous matrix-induced chondrogenesis (AMIC): Combining microfracturing and a collagen I/III matrix for articular cartilage resurfacing. Cartilage 2010, 1, 65–68. [Google Scholar] [CrossRef]
- Choi, J.B.; Choi, J.B.; Youn, I.; Cao, L.; Leddy, H.A.; Gilchrist, C.L.; Setton, L.A.; Guilak, F. Zonal changes in the three-dimensional morphology of the chondron under compression: The relationship among cellular, pericellular, and extracellular deformation in articular cartilage. J. Biomech. 2007, 40, 2596–2603. [Google Scholar] [CrossRef]
- Heyraud, A.; Heyraud, A.; Tallia, F.; Sory, D.; Ting, H.-K.; Tchorzewska, A.; Liu, J.; Pilsworth, H.L.; Lee, P.D.; Hanna, J.V.; et al. 3D printed hybrid scaffolds for bone regeneration using calcium methoxyethoxide as a calcium source. Front. Bioeng. Biotechnol. 2023, 11, 1224596. [Google Scholar] [CrossRef] [PubMed]
- Mancini, D.; Fontana, A. Five-year results of arthroscopic techniques for the treatment of acetabular chondral lesions in femoroacetabular impingement. Int. Orthop. 2014, 38, 2057–2064. [Google Scholar] [CrossRef] [PubMed]
- Karande, T.S.; Ong, J.L.; Agrawal, C.M. Diffusion in musculoskeletal tissue engineering scaffolds: Design issues related to porosity, permeability, architecture, and nutrient mixing. Ann. Biomed. Eng. 2004, 32, 1728–1743. [Google Scholar] [CrossRef] [PubMed]
- Li, Z.; Kupcsik, L.; Yao, S.J.; Alini, M.; Stoddart, M.J. Mechanical load modulates chondrogenesis of human mesenchymal stem cells through the TGF-β pathway. J. Cell Mol. Med. 2010, 14, 1338–1346. [Google Scholar] [CrossRef] [PubMed]
- Lien, S.M.; Ko, L.Y.; Huang, T.J. Effect of pore size on ECM secretion and cell growth in gelatin scaffold for articular cartilage tissue engineering. Acta Biomater. 2009, 5, 670–679. [Google Scholar] [CrossRef] [PubMed]
- Parkes, M.; Tallia, F.; Young, G.R.; Cann, P.; Jones, J.R.; Jeffers, J.R.T. Tribological evaluation of a novel hybrid for repair of articular cartilage defects. Mater. Sci. Eng. C 2020, 119, 111495. [Google Scholar] [CrossRef] [PubMed]
- Oh, S.H.; Park, I.; Kim, J.; Jh, L. In Vitro and In Vivo Characteristics of PCL Scaffolds With Pore Size Gradient Fabricated by a Centrifugation Method. Biomaterials 2007, 28, 1664–1671. [Google Scholar] [CrossRef]
- Bružauskaitė, I.; Bironaitė, D.; Bagdonas, E.; Bernotienė, E. Scaffolds and cells for tissue regeneration: Different scaffold pore sizes—Different cell effects. Cytotechnology 2016, 68, 355–369. [Google Scholar] [CrossRef]
- Dave, K.; Gomes, V.G. Interactions at scaffold interfaces: Effect of surface chemistry, structural attributes and bioaffinity. Mater. Sci. Eng. C 2019, 105, 110078. [Google Scholar] [CrossRef]
- Yang, K.C.; Chen, I.H.; Yang, Y.T.; Hsiao, J.K.; Wang, C.C. Effects of scaffold geometry on chondrogenic differentiation of adipose-derived stem cells. Mater. Sci. Eng. C 2020, 110, 110733. [Google Scholar] [CrossRef]
- Tallia, F.; Russo, L.; Li, S.; Orrin, A.; Shi, X.; Chen, S.; Steele, J.; Meille, S.; Chevalier, J. Bouncing and 3D printable hybrids with self-healing properties. Mater. Horiz. 2018, 5, 849–860. [Google Scholar] [CrossRef]
- Li, S.; Tallia, F.; Mohammed, A.A.; Stevens, M.M.; Jones, J.R. Scaffold channel size influences stem cell differentiation pathway in 3-D printed silica hybrid scaffolds for cartilage regeneration. Biomater. Sci. 2020, 8, 4458–4466. [Google Scholar] [CrossRef] [PubMed]
- Haddouti, E.M.; Randau, T.M.; Hilgers, C.; Masson, W.; Walgenbach, K.J.; Pflugmacher, R.; Burger, C.; Gravius, S.; Schildberg, F.A. Characterization and comparison of human and ovine mesenchymal stromal cells from three corresponding sources. Int. J. Mol. Sci. 2020, 21, 2310. [Google Scholar] [CrossRef] [PubMed]
- Westerkowsky, E.K.; Soares de Almeida, A.M.; Selle, M.; Harms, O.; Bundkirchen, K.; Neunaber, C.; Noack, S. Characterization of Human, Ovine and Porcine Mesenchymal Stem Cells from Bone Marrow: Critical In Vitro Comparison with Regard to Humans. Life 2023, 13, 718. [Google Scholar] [CrossRef]
- Roncada, T.; Bonithon, R.; Blunn, G.; Roldo, M. Soft substrates direct stem cell differentiation into the chondrogenic lineage without the use of growth factors. J. Tissue Eng. 2022, 13, 20417314221122121. [Google Scholar] [CrossRef]
- Verdanova, M.; Sauerova, P.; Hempel, U.; Kalbacova, M.H. Initial cell adhesion of three cell types in the presence and absence of serum proteins. Histochem. Cell Biol. 2017, 148, 273–288. [Google Scholar] [CrossRef]
- Shinto, H.; Hirata, T.; Fukasawa, T.; Fujii, S.; Maeda, H.; Okada, M.; Nakamura, Y.; Furuzono, T. Effect of interfacial serum proteins on melanoma cell adhesion to biodegradable poly(l-lactic acid) microspheres coated with hydroxyapatite. Colloids Surf. B Biointerfaces 2013, 108, 8–15. [Google Scholar] [CrossRef]
- Raimondi, M.T.; Bertoldi, S.; Caddeo, S.; Farè, S.; Arrigoni, C.; Moretti, M. The effect of polyurethane scaffold surface treatments on the adhesion of chondrocytes subjected to interstitial perfusion culture. Tissue Eng. Regen. Med. 2016, 13, 364–374. [Google Scholar] [CrossRef]
- De Mori, A.; Alasa, U.J.; Mühlhölzl, A.; Blunn, G. Slipper Limpet (Crepidula fornicata) Shells Support In Vitro Osteogenesis of Human Adipose-Derived Stem Cells. Mar. Drugs 2023, 21, 248. [Google Scholar] [CrossRef]
- Lavogina, D.; Lust, H.; Tahk, M.-J.; Laasfeld, T.; Vellama, H.; Nasirova, N.; Vardja, M.; Eskla, K.-L.; Salumets, A.; Rinken, A.; et al. Revisiting the Resazurin-Based Sensing of Cellular Viability: Widening the Application Horizon. Biosensors 2022, 12, 196. [Google Scholar] [CrossRef]
- Hu, N.; Gao, Y.; Jayasuriya, C.T.; Liu, W.; Du, H.; Ding, J.; Feng, M.; Chen, Q. Chondrogenic induction of human osteoarthriticcartilage-derived mesenchymal stem cells activates mineralization and hypertrophic and osteogenic gene expression through amechanomiR. Arthritis Res. 2019, 21, 167. [Google Scholar] [CrossRef] [PubMed]
- McCoy, A.M. Animal Models of Osteoarthritis: Comparisons and Key Considerations. Vet. Pathol. 2015, 52, 803–818. [Google Scholar] [CrossRef] [PubMed]
- Cook, J.L.; Hung, C.T.; Kuroki, K.; Stoker, A.M.; Cook, C.R.; Pfeiffer, F.M.; Sherman, S.L.; Stannard, J.P. Animal models of cartilage repair. Bone Jt. Res. 2014, 3, 89–94. [Google Scholar] [CrossRef] [PubMed]
- Park, S.; Na, J.Y.; Gwon, Y.; Kim, W.; Kang, J.Y.; Seon, J.K.; Kim, J. Transplantable stem cell nanobridge scaffolds for accelerating articular cartilage regeneration. Biomaterials 2023, 301, 122287. [Google Scholar] [CrossRef] [PubMed]
- Rosadi, I.; Karina, K.; Rosliana, I.; Sobariah, S.; Afini, I.; Widyastuti, T.; Barlian, A. In vitro study of cartilage tissue engineering using human adipose-derived stem cells induced by platelet-rich plasma and cultured on silk fibroin scaffold. Stem. Cell Res. Ther. 2019, 10, 1–15. [Google Scholar] [CrossRef] [PubMed]
- Valonen, P.K.; Moutos, F.T.; Kusanagi, A.; Moretti, M.G.; Diekman, B.O.; Welter, J.F.; Caplan, A.I.; Guilak, F.; Freed, L.E. In Vitro Generation of Mechanically Functional Cartilage Grafts Based on Adult Human Stem Cells and 3D-Woven Poly(ɛ-Caprolactone) Scaffolds. Biomaterials 2010, 31, 2193–2200. [Google Scholar] [CrossRef]
- Kalaszczynska, I.; Ruminski, S.; Platek, A.E.; Bissenik, I.; Zakrzewski, P.; Noszczyk, M.; Lewandowska-Szumiel, M. Substantial Differences Between Human and Ovine Mesenchymal Stem Cells in Response to Osteogenic Media: How to Explain and How to Manage? BioResearch Open Access 2013, 2, 356–363. [Google Scholar] [CrossRef]
- Low, S.P.; Williams, K.A.; Canham, L.T.; Voelcker, N.H. Evaluation of mammalian cell adhesion on surface-modified porous silicon. Biomaterials 2006, 27, 4538–4546. [Google Scholar] [CrossRef]
- Shen, M.; Horbett, T.A. The effects of surface chemistry and adsorbed proteins on monocyte/macrophage adhesion to chemically modified polystyrene surfaces. J. Biomed. Mater. Res. 2001, 57, 336–345. [Google Scholar] [CrossRef]
- Sawyer, A.A.; Hennessy, K.M.; Bellis, S.L. Regulation of mesenchymal stem cell attachment and spreading on hydroxyapatite by RGD peptides and adsorbed serum proteins. Biomaterials 2005, 26, 1467–1475. [Google Scholar] [CrossRef]
- Hayman, E.G.; Pierschbacher, M.D.; Suzuki, S.; Ruoslahti, E. Vitronectin—A major cell attachment-promoting protein in foetal bovine serum. Exp. Cell Res. 1985, 160, 245–258. [Google Scholar] [CrossRef] [PubMed]
- O’Brien, F.J.; Harley, B.A.; Waller, M.A.; Yannas, I.V.; Gibson, L.J.; Prendergast, P.J. The effect of pore size on permeability and cell attachment in collagen scaffolds for tissue engineering. Technol. Health Care 2007, 15, 3–17. [Google Scholar] [CrossRef] [PubMed]
- Kim, N.G.; Koh, E.; Chen, X.; Gumbiner, B.M. E-cadherin mediates contact inhibition of proliferation through Hippo signaling-pathway components. Proc. Natl. Acad. Sci. USA 2011, 108, 11930–11935. [Google Scholar] [CrossRef] [PubMed]
- Gumbiner, B.M.; Kim, N.-G. The Hippo-YAP signaling pathway and contact inhibition of growth. J. Cell Sci. 2014, 127, 709–717. [Google Scholar] [CrossRef] [PubMed]
- Meleshina, A.V.; Dudenkova, V.V.; Shirmanova, M.V.; Shcheslavskiy, V.I.; Becker, W.; Bystrova, A.S.; Cherkasova, E.I.; Zagaynova, E.V. Probing metabolic states of differentiating stem cells using two-photon FLIM. Sci. Rep. 2016, 6, 21853. [Google Scholar] [CrossRef]
- Coope, A.; Ghanameh, Z.; Kingston, O.; Sheridan, C.M.; Barrett-Jolley, R.; Phelan, M.M.; Oldershaw, R.A. 1H NMR Metabolite Monitoring during the Differentiation of Human Induced Pluripotent Stem Cells Provides New Insights into the Molecular Events That Regulate Embryonic Chondrogenesis. Int. J. Mol. Sci. 2022, 23, 9266. [Google Scholar] [CrossRef]
- Yao, Y.; Wang, C. Dedifferentiation: Inspiration for devising engineering strategies for regenerative medicine. NPJ Regen. Med. 2020, 5, 14. [Google Scholar] [CrossRef]
- Kobayashi, S.; Meir, A.; Urban, J. Effect of cell density on the rate of glycosaminoglycan accumulation by disc and cartilage cells in vitro. J. Orthop. Res. 2008, 26, 493–503. [Google Scholar] [CrossRef]
- Nelson, M.; Li, S.; Page, S.J.; Shi, X.; Lee, P.D.; Stevens, M.M.; Hanna, J.V.; Jones, J.R. 3D printed silica-gelatin hybrid scaffolds of specific channel sizes promote collagen Type II, Sox9 and Aggrecan production from chondrocytes. Mater. Sci. Eng. C 2021, 123, 111964. [Google Scholar] [CrossRef]
- Revell, C.M.; Reynolds, C.E.; Athanasiou, K.A. Effects of initial cell seeding in self assembly of articular cartilage. Ann. Biomed. Eng. 2008, 36, 1441–1448. [Google Scholar] [CrossRef]
- Bačenková, D.; Trebuňová, M.; Demeterová, J.; Živčák, J. Human Chondrocytes, Metabolism of Articular Cartilage, and Strategies for Application to Tissue Engineering. Int. J. Mol. Sci. 2023, 24, 17096. [Google Scholar] [CrossRef] [PubMed]
- Nava, M.M.; Draghi, L.; Giordano, C.; Pietrabissa, R. The effect of scaffold pore size in cartilage tissue engineering. J. Appl. Biomater. Funct. Mater. 2016, 14, e223–e229. [Google Scholar] [CrossRef] [PubMed]
- Yi, S.W.; Kim, H.J.; Oh, H.J.; Shin, H.; Lee, J.S.; Park, J.S.; Park, K.-H. Gene Expression Profiling of Chondrogenic Differentiation by Dexamethasone-Conjugated Polyethyleneimine with SOX Trio Genes in Stem Cells. Stem Cell Res. Ther. 2018, 9, 341. [Google Scholar] [CrossRef] [PubMed]
- Chen, D.; Smith, L.R.; Khandekar, G.; Patel, P.; Yu, C.K.; Zhang, K.; Chen, C.S.; Han, L.; Wells, R.G. Distinct Effects of Different Matrix Proteoglycans on Collagen Fibrillogenesis and Cell-Mediated Collagen Reorganization. Sci. Rep. 2020, 10, 19065. [Google Scholar] [CrossRef] [PubMed]
- Akiyama, H.; Chaboissier, M.C.; Martin, J.F.; Schedl, A.; De Crombrugghe, B. The transcription factor Sox9 has essential roles in successive steps of the chondrocyte differentiation pathway and is required for expression of Sox5 and Sox6. Genes Dev. 2002, 16, 2813–2828. [Google Scholar] [CrossRef]
- Marconi, A.; Hancock-Ronemus, A.; Gillis, J.A. Adult chondrogenesis and spontaneous cartilage repair in the skate, Leucoraja erinacea. eLife 2020, 9, e53414. [Google Scholar] [CrossRef]
- Tsang, K.Y.; Chan, D.; Cheah, K.S.E. Fate of growth plate hypertrophic chondrocytes: Death or lineage extension? Dev. Growth Differ. 2015, 57, 179–192. [Google Scholar] [CrossRef]
- Mwale, F.; Stachura, D.; Roughley, P.; Antoniou, J. Limitations of using aggrecan and type X collagen as markers of chondrogenesis in mesenchymal stem cell differentiation. J. Orthop. Res. 2006, 24, 1791–1798. [Google Scholar] [CrossRef]
- Xu, Y.; Shi, T.; Xu, A.; Zhang, L. 3D spheroid culture enhances survival and therapeutic capacities of MSCs injected into ischemic kidney. J. Cell. Mol. Med. 2016, 20, 1203–1213. [Google Scholar] [CrossRef]
- Zhang, B.Y.; Xu, P.; Luo, Q.; Song, G.B. Proliferation and tenogenic differentiation of bone marrow mesenchymal stem cells in a porous collagen sponge scaffold. World J. Stem Cells 2021, 13, 115–127. [Google Scholar] [CrossRef]
- Elango, J.; Robinson, J.; Zhang, J.; Bao, B.; Ma, N.; de Val, J.E.M.S.; Wu, W. Collagen Peptide Upregulates Osteoblastogenesis from Bone Marrow Mesenchymal Stem Cells through MAPK- Runx2. Cells 2019, 8, 446. [Google Scholar] [CrossRef] [PubMed]
- Fan, H.; Hu, Y.; Zhang, C.; Li, X.; Lv, R.; Qin, L.; Zhu, R. Cartilage regeneration using mesenchymal stem cells and a PLGA–gelatin/chondroitin/hyaluronate hybrid scaffold. Biomaterials 2006, 27, 4573–4580. [Google Scholar] [CrossRef] [PubMed]
- Ren, L.; Cong, N.; Han, H.; Zhang, Z.; Deng, C.; Zhang, N.; Li, D. The effect of sodium metasilicate on the three-dimensional chondrogenesis of mesenchymal stem cells. Dent. Mater. J. 2021, 40, 853–862. [Google Scholar] [CrossRef] [PubMed]
- Götz, W.; Tobiasch, E.; Witzleben, S.; Schulze, M. Effects of silicon compounds on biomineralization, osteogenesis, and hard tissue formation. Pharmaceutics 2019, 11, 117–144. [Google Scholar] [CrossRef]
- Chen, S.; Fu, P.; Cong, R.; Wu, H.; Pei, M. Strategies to minimize hypertrophy in cartilage engineering and regeneration. Genes Dis. 2015, 2, 76–95. [Google Scholar] [CrossRef]
- Al-Mutheffer, E.A.; Reinwald, Y.; El Haj, A.J. Donor variability of ovine bone marrow derived mesenchymal stem cell—Implications for cell therapy. Int. J. Vet. Sci. Med. 2023, 11, 23–37. [Google Scholar] [CrossRef]
- Vekshin, N.L.; Frolov, M.S. Artefacts of confocal microscopy. Biophysics 2014, 59, 1034–1039. [Google Scholar] [CrossRef]


Disclaimer/Publisher’s Note: The statements, opinions and data contained in all publications are solely those of the individual author(s) and contributor(s) and not of MDPI and/or the editor(s). MDPI and/or the editor(s) disclaim responsibility for any injury to people or property resulting from any ideas, methods, instructions or products referred to in the content. |
© 2024 by the authors. Licensee MDPI, Basel, Switzerland. This article is an open access article distributed under the terms and conditions of the Creative Commons Attribution (CC BY) license (https://creativecommons.org/licenses/by/4.0/).
Share and Cite
De Mori, A.; Heyraud, A.; Tallia, F.; Blunn, G.; Jones, J.R.; Roncada, T.; Cobb, J.; Al-Jabri, T. Ovine Mesenchymal Stem Cell Chondrogenesis on a Novel 3D-Printed Hybrid Scaffold In Vitro. Bioengineering 2024, 11, 112. https://doi.org/10.3390/bioengineering11020112
De Mori A, Heyraud A, Tallia F, Blunn G, Jones JR, Roncada T, Cobb J, Al-Jabri T. Ovine Mesenchymal Stem Cell Chondrogenesis on a Novel 3D-Printed Hybrid Scaffold In Vitro. Bioengineering. 2024; 11(2):112. https://doi.org/10.3390/bioengineering11020112
Chicago/Turabian StyleDe Mori, Arianna, Agathe Heyraud, Francesca Tallia, Gordon Blunn, Julian R. Jones, Tosca Roncada, Justin Cobb, and Talal Al-Jabri. 2024. "Ovine Mesenchymal Stem Cell Chondrogenesis on a Novel 3D-Printed Hybrid Scaffold In Vitro" Bioengineering 11, no. 2: 112. https://doi.org/10.3390/bioengineering11020112