
Printed Carbon Black Thermocouple as an In Situ Thermal Sensor for Lithium-Ion Cell

Department of Chemical and Biological Engineering, The University of Sheffield, Sheffield S1 3JD, UK
*
Author to whom correspondence should be addressed.
Batteries 2024, 10(3), 78; https://doi.org/10.3390/batteries10030078
Submission received: 3 October 2023
/
Revised: 15 February 2024
/
Accepted: 17 February 2024
/
Published: 27 February 2024
(This article belongs to the Section Battery Performance, Ageing, Reliability and Safety)
Abstract
:Thermal monitoring of lithium-ion batteries ensures their safe and optimal operation. To collect the most accurate temperature data of LIBs, previous studies used thermocouples in the cell and proved them to be technically viable. However, the cost and scale-up limitations of this method restricted its use in many applications, hindering its mass adoption. This work developed a low-cost and scalable screen-printed carbon black thermocouple to study its applicability for the thermal monitoring of LIB. Given the appropriate manufacturing parameters, it was found that thermal sensors may be printed on the electrodes, installed on a pouch cell, and once calibrated, operate with excellent sensitivity. However, to reliably use a printed carbon black thermocouple in operando of a pouch cell, its chemical resistance against electrolytes was found to require further development.
1. Introduction
Lithium-Ion Batteries (LIBs) are currently the preferred energy storage medium for electric vehicles (EV) due to their high power and energy density [1]. However, to ensure that their performance is optimized, their operating temperature must be accurately monitored and controlled, as failure to do so was observed to cause temporary and/or permanent damage to the cell, reducing its deliverable power and capacity [2,3]. At worst, a poorly managed LIB may also undergo thermal runaway, causing it to outgas, catch fire, or even explode [4,5].
Initial thermal studies of LIBs monitored and evaluated the surface temperature of lithium-ion cells to address the above issues and better manage the cell’s operation. Independent of the cell’s material, whether it be Nickel Manganese Cobalt oxide (NMC), Lithium Iron Phosphate (LFP), Lithium Titanate Oxide (LTO) or other comparable materials, the temperature of the positive tab was always observed to increase the most when charging/discharging is initiated. As the charging/discharging process progressed, the cell’s surface temperature distribution was then observed to become more uniform, with its center area exhibiting the most significant temperature increase [6]. Recognizing such temperature characteristics is vital for understanding and optimizing LIB performance; however, surface temperature measurement is limited, as the cell’s internal temperature gradient was also found to vary across its thickness [7].
For improved temperature monitoring, more advanced thermal studies of LIB also installed thermal sensors inside the cell [7,8,9]. Through such an approach, three-dimensional thermal monitoring of LIBs was achieved, which could also aid with the validation of three-dimensional LIB thermal models and simulations [10]. However, for the internal temperature measurement technique to be more effective and widely adopted, the in situ sensor’s limited spatial resolution, high implementation costs, and low volume manufacturing approach must be addressed and improved.
Li et al. addressed the spatial resolution issue by embedding multiple commercial T-type thermocouples in a pouch cell to monitor areas of interest [11]. To execute this technique, this method simply required multiple thermocouples, with a thin profile and special insulation, to be taped to the cell’s internal components and to be permanently sealed in the pouch cell. Such a technique is suitable for one-off cells; however, its compatibility for applications where hundreds or even thousands of cells are used is limited, as its manufacturing and integration method is complex and costly to implement.
Alternatively, to minimize the cost and increase scalability, the internal temperature of an LIB may also be measured by utilizing a technique that does not use physical thermal sensors. For example, the soft sensor method developed by Schmidt et al. measures the internal temperature of the cell, specifically the anode, by exploiting the relationship between the cell’s impedance and temperature [12]. The only limitation of this approach is that it is currently limited to cells that use graphite anodes and can only present an averaged anode temperature. Unfortunately, this is a significant issue for large format pouch cells, as their temperature distribution varies more widely across their surface and thickness [7,10,11]. Therefore, if the soft sensor method is used in a large cell, random heat spots may be missed and produce misleading cell temperature data.
By developing a custom thermocouple array, Mutyala et al. addressed the spatial resolution issues discussed above [13]. Also, the thermocouple array by Mutyala et al. is novel, as it consists of multiple sensing points that can monitor multiple areas of interest. Due to its single sensor body, its installation in LIBs is also simplified, as it only requires a single sealing point for installation, minimizing the weak points in the pouch material and improving its scalability. By utilizing alumel (Ni/Al/Si/Mn) and chromel (Ni/Cr) materials, the customized sensor also presents good adaptability, as it is compatible and ready to operate with existing data-logging systems that use K-type thermocouples. Although this previous work is advanced, it is worth noting that it is still limited, as its sensor placement does not measure the cell’s core, where heat buildup occurs the most [10]. Regarding cost, the sensor’s materials are also similar to existing K-type thermocouples; therefore, its cost would be near-identical to off-the-shelf components, making it less financially scalable in applications that require a large number of cells.
Therefore, to build upon previous LIB thermal studies, this paper explores a novel method of sensor fabrication and integration in a pouch cell. The sensor in this study is novel, as it utilizes carbon black inks as a low-cost material and screen printing as an advanced technique for manufacturing the sensors [14]. Additionally, the cell’s electrode, specifically the cathode, is utilized as the sensor’s substrate to further decrease the sensor’s required material and cost. From a technical aspect, such a sensor placement is also advantageous, as it enables the sensor to be in direct contact with its intended subject and, therefore, immediately detect any temperature change that is critical to the electrode’s active materials. Regarding the sensor’s spatial resolution, an array configuration is also utilized to make the sensor compact. The individual sensors in the array are also distributed equally across the electrode’s surface, enhancing the sensor’s capability to monitor a large area with a wide temperature gradient.
2. Methodology
2.1. Sensor Materials and Fabrication
Screen-printed, pure carbon black thermocouples operate similarly to conventional metal and/or semiconductor-based thermocouples [14]. When its cold and hot junctions are subjected to a temperature difference, the electrons at its hot junction are excited, move to and are then diffused at the cold junction, creating an electrical current and, therefore, a potential difference [14,15]. However, as the sensor in this work utilizes inks and screen printing, it is important to note that its thermoelectric properties are also affected by the ink’s purity and its active material’s distribution [14].
Table 1 shows the properties of the commercial inks used in this study. Even though the manufacturer did not provide the ink’s detailed composition, initial studies conducted by Offenzeller et al. [14]. presented the ink’s thermoelectric properties, which were used to aid with the sensor’s characterization.
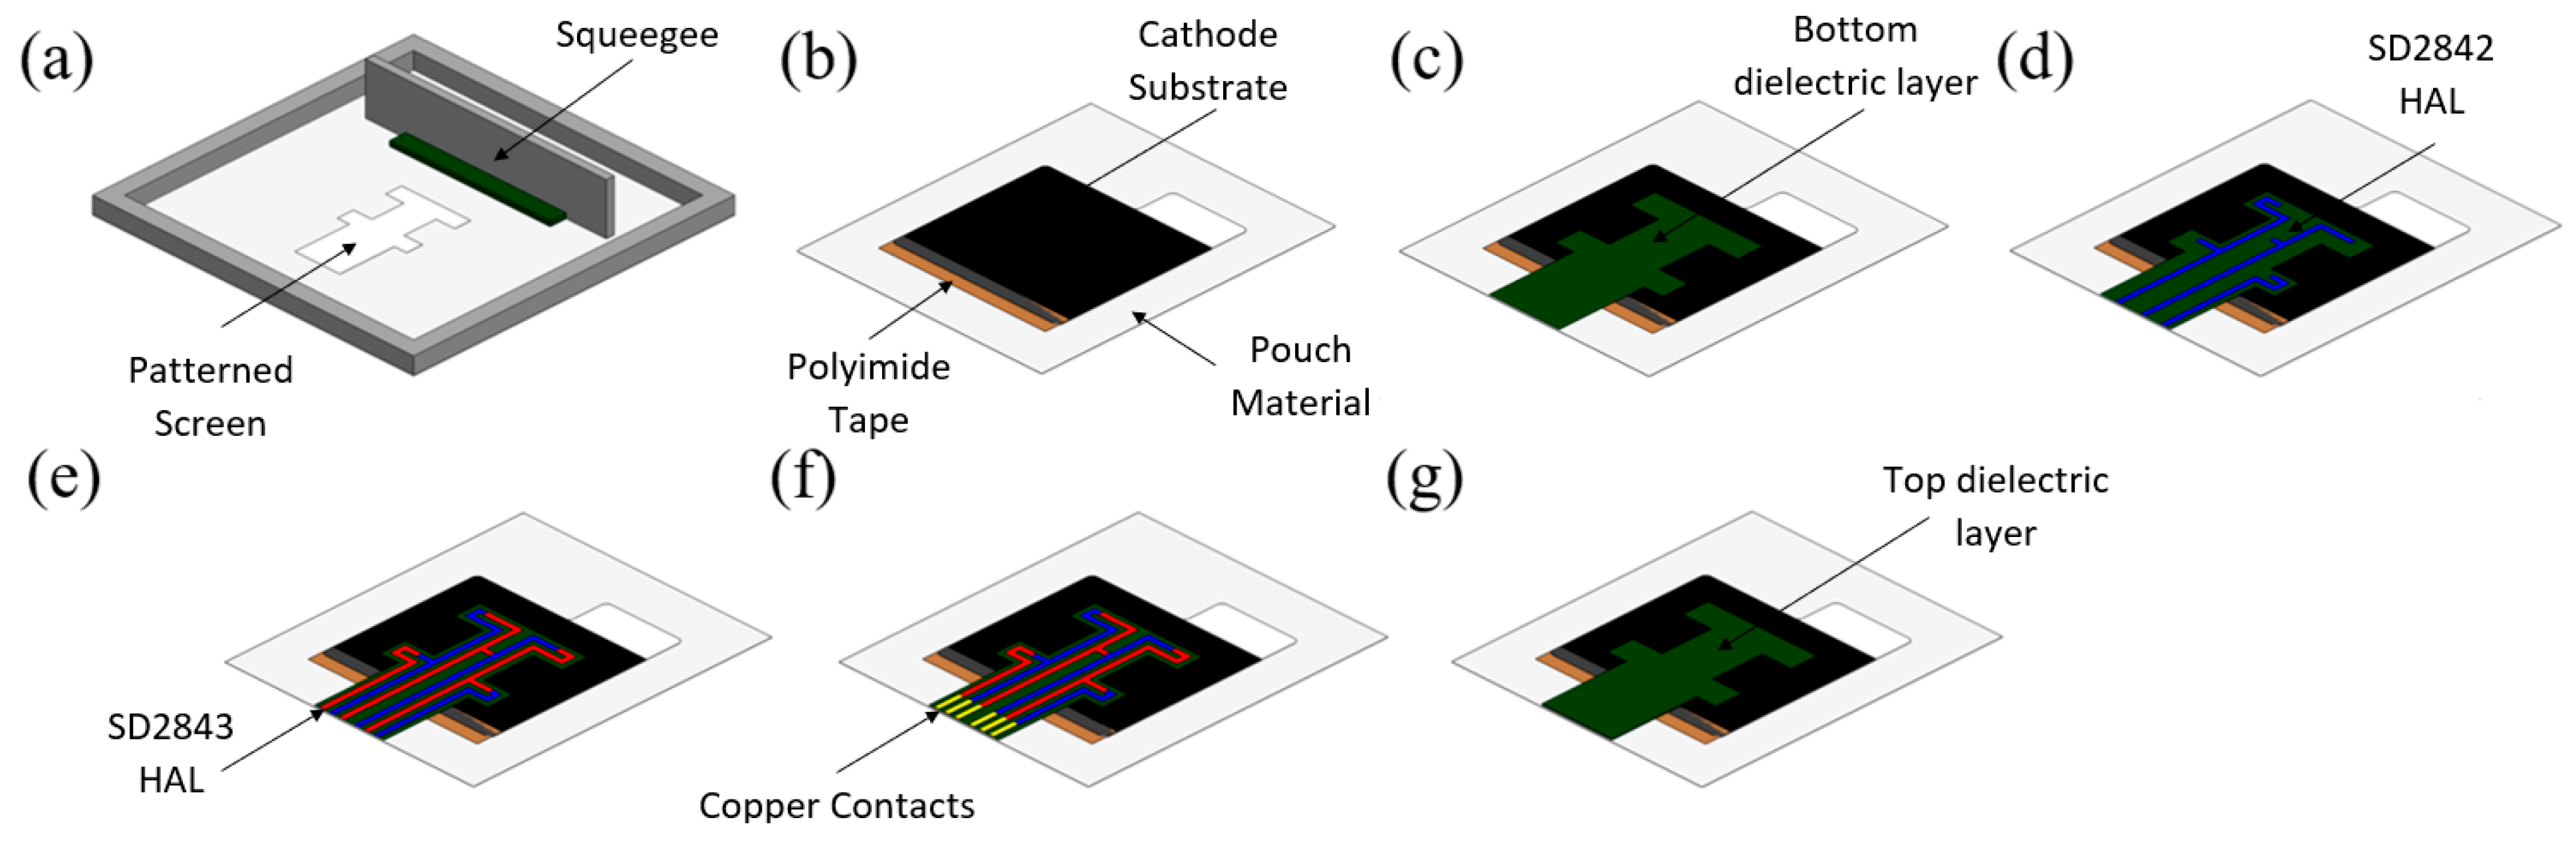
The carbon black thermocouple in this work is located and printed on the LIB’s LFP cathode electrode, and its manufacturing process is shown in Figure 1. To prepare the LFP electrode for screen printing, it was secured in place by a polyimide tape on the inner side of the pouch material (aluminum-laminated film). Using a patterned stainless-steel screen with 230 threads per inch mesh, a thoroughly mixed dielectric ink (SunTronic DSU4606G (Sun Chemical Corporation, Parsippany-Troy Hills, USA) was then deposited and printed on the substrates and dried for a couple of hours under an ultraviolet lamp. After the dielectric layer was dried, the thoroughly mixed SD 2842 HAL was printed on top of the dielectric material and dried at 50 °C for 24 h. Ideally, the SD 2842 HAL ink may be dried for a shorter duration of 30 min at 150 °C [14]; however, the cathode electrode substrate in this work deteriorates above 50 °C, which therefore restricts the maximum drying temperature. Therefore, to ensure that the cathode substrate was preserved and the SD 2842 HAL was dried thoroughly, the drying temperature was limited, and the duration of the drying process was increased instead.
Using a similar printing and drying process, the SD 2843 HAL ink was then printed on top of the dielectric layer, whilst overlapping with SD 2842 HAL in some areas to form the thermocouple array’s hot junctions. After the SD 2843 HAL was thoroughly dried, copper contacts were then attached to the printed thermocouple’s cold junctions to extract the voltage signal from the sensors, whilst minimizing the possibility of mechanical damage to the screen-printed carbon black ink. To complete the sensor, the printed thermocouple array was then encapsulated with a dielectric ink layer (SunTronic DSU4606G) to isolate it from the LIB’s internal components.
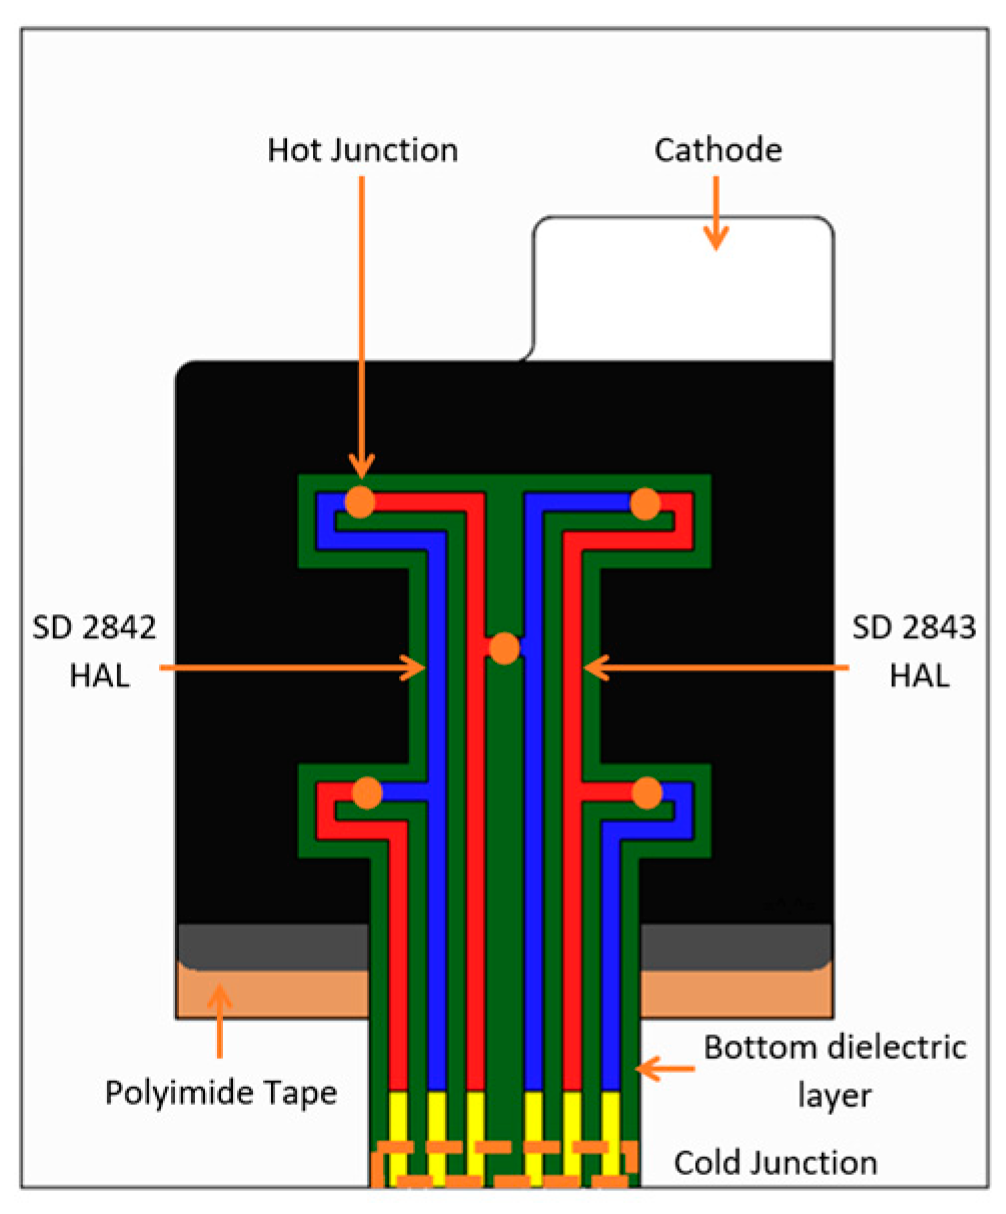
Looking at the printed thermocouple’s design in Figure 2, it can be noted that the sensor array in this work is physically connected in series, whilst the sensor array developed by Mutyala et al. [13]. has independent and physically isolated thermocouples. By utilizing a series configuration, the number of thermocouples in this work was increased to five whilst minimizing the amount of sensor wiring to six. If all thermocouples were physically isolated from each other and were arranged similarly to the thermocouple developed by Mutyala et al., ten connections would be required for the five thermocouples—increasing the sensor’s physical size and wiring complexity. From an electrical perspective, the series approach is suitable and appropriate for the proposed application, as the voltage across a printed thermocouple is distinct and independent from its neighboring thermocouples. By looking at Figure 2, it can also be noted that the thermocouple was printed and extended to the polyimide tape and the pouch material to enable the sensor to be wired and connected to a digital multimeter located outside the pouch cell.
2.2. Sensor Integration and Pouch Cell Assembly
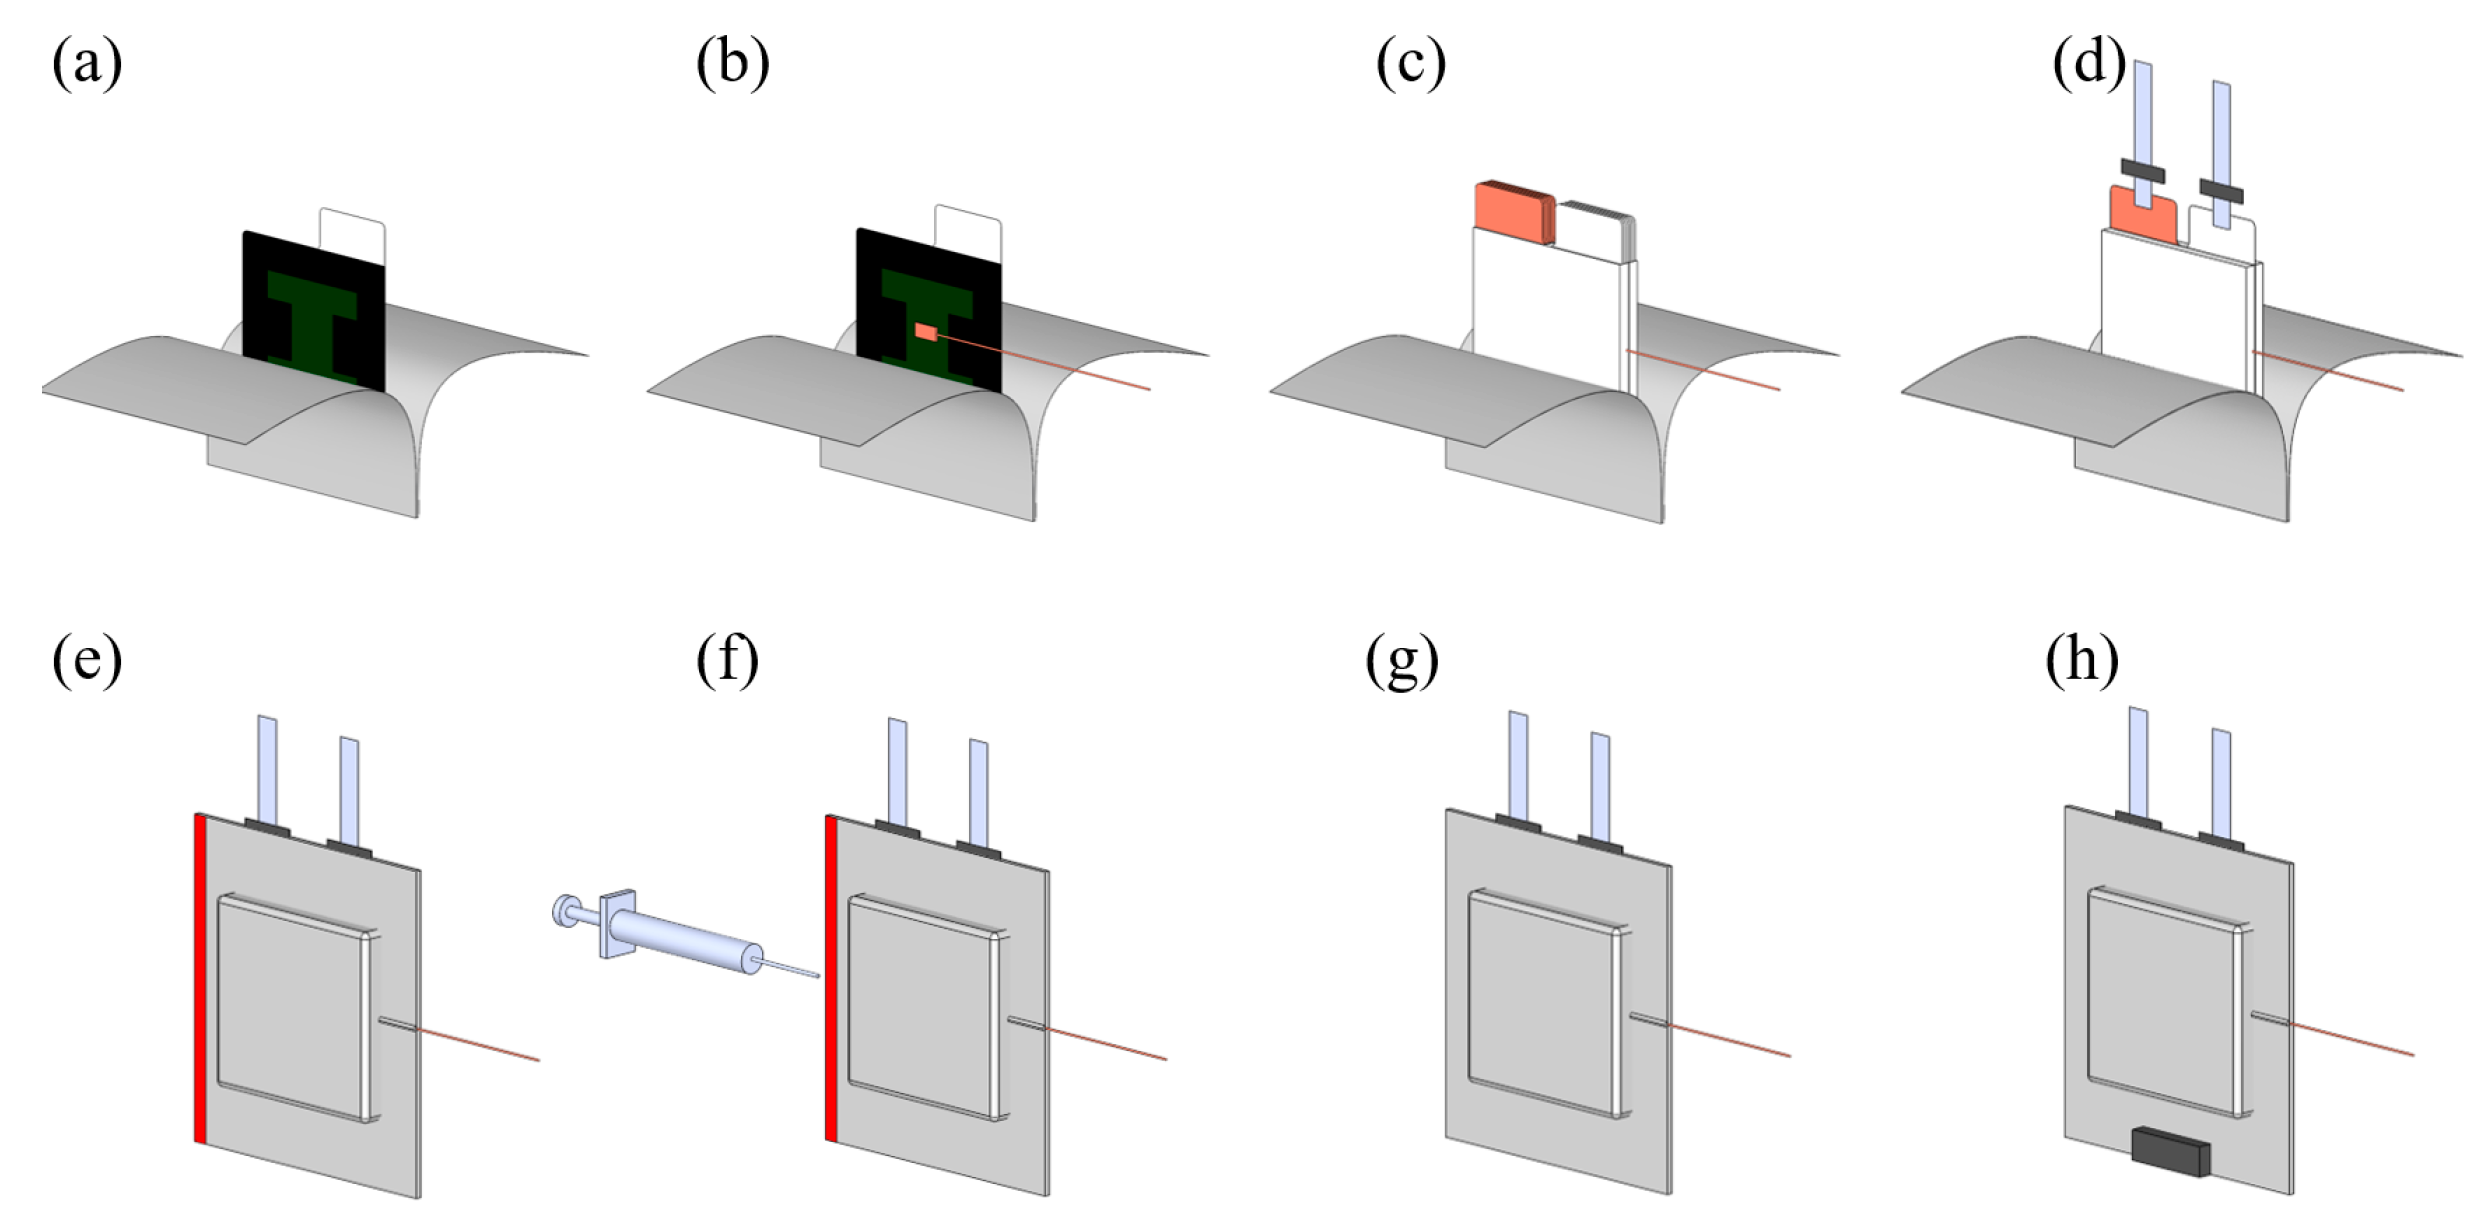
After the thermocouple was fabricated, the pouch substrate and the printed sensor were partially sealed, as shown in Figure 3a. For the sealing process, two parameters were tested on two different samples to observe the robustness of the printed sensors. The first parameter represents the conventional sealing procedure of a pouch cell and used an RDM HSE-3 heat sealer (RDM Test Equipment, Elsenham, UK) with two aluminum heat bars, a temperature of 140 °C, 2 bar pressure, and a dwell time of 6 s. On the other hand, the second sealing parameter represents a more forgiving sealing technique and used a Henkelman Mini Jumbo heat sealer with aluminum–silicone heat bars, the device’s default pressure and temperature, and a dwell time of 6 s.
As shown in Figure 3b, a commercial K-type thermocouple insulated with polyimide film was then attached to one of the printed thermocouples. Such a set-up was made so that an internal reference temperature can also be collected to validate the performance of the printed sensor after it was installed in situ in a pouch cell. As shown in Figure 3c, the printed and reference K-type thermocouple was then placed at the cell’s core and sandwiched by ten pairs of graphite anodes, LFP cathodes, and separators. After the electrodes and separators were stacked, the tabs were then ultrasonically welded to the electrodes, and the cell was partially sealed, leaving one side of the cell open.
The partially sealed cell was then dried in an oven for a day to decrease its moisture content. For the drying process, two parameters were tested on two different samples to observe the robustness of the printed sensor. The first parameter represents the conventional drying condition of a pouch cell, which was conducted using a vacuum oven at 80 °C. On the other hand, the second drying parameter represents a more forgiving drying technique that used a non-vacuum oven and a lower temperature of 50 °C. The second drying parameter was chosen and utilized, as the LFP cathode in this work deteriorates above 50 °C.
Using a glove box, the dried cells were then filled with lithium hexafluorophosphate in ethylene carbonate, ethyl methyl carbonate, and vinylene carbonate electrolyte, and the pouch was permanently sealed. As shown in Figure 3h, a custom-built connector was then attached to the printed sensor’s cold junction to enable a digital multimeter to interface with the internally located thermocouple array and extract its voltage output.
2.3. Sensor Characterization
As this work presents the first integration of carbon black thermocouples in LIBs, the effects of the installation process on the sensor’s performance are unknown. As such, the printed sensor’s thermoelectric properties were continually tested and monitored after each major procedure. These major procedures were identified as the printing of the thermocouple array, the encapsulation of the thermocouple array in the dielectric ink, pouch and sensor sealing, electrode drying, and the sensor’s in situ operation. To characterize the sensor before and/or after the mentioned procedures, ex situ (Section 2.3.1) and in situ (Section 2.3.2) test procedures were developed and carried out as described below.
2.3.1. Ex Situ Test
Pure carbon black thermocouples that utilize SD 2842 HAL and SD 2843 HAL commercial inks were previously fabricated and tested by Offenzeller et al.; therefore, initial insights regarding their performance are available in the literature. Offenzeller et al. reported that the Seebeck coefficient (SC) of the commercial inks are −1.85 ± 0.002 and 0.93 ± 0.002 μV/K, respectively [14]. Therefore, by applying the ink’s reported SC (S1 and S2, respectively), and measuring and using the printed thermocouple’s cold junction temperature (T1) and its voltage output (V) according to Equation (1), the hot junction temperature (T2) could be calculated.
Equation (1): The relationship of voltage, temperature and the material’s SC in a thermocouple.
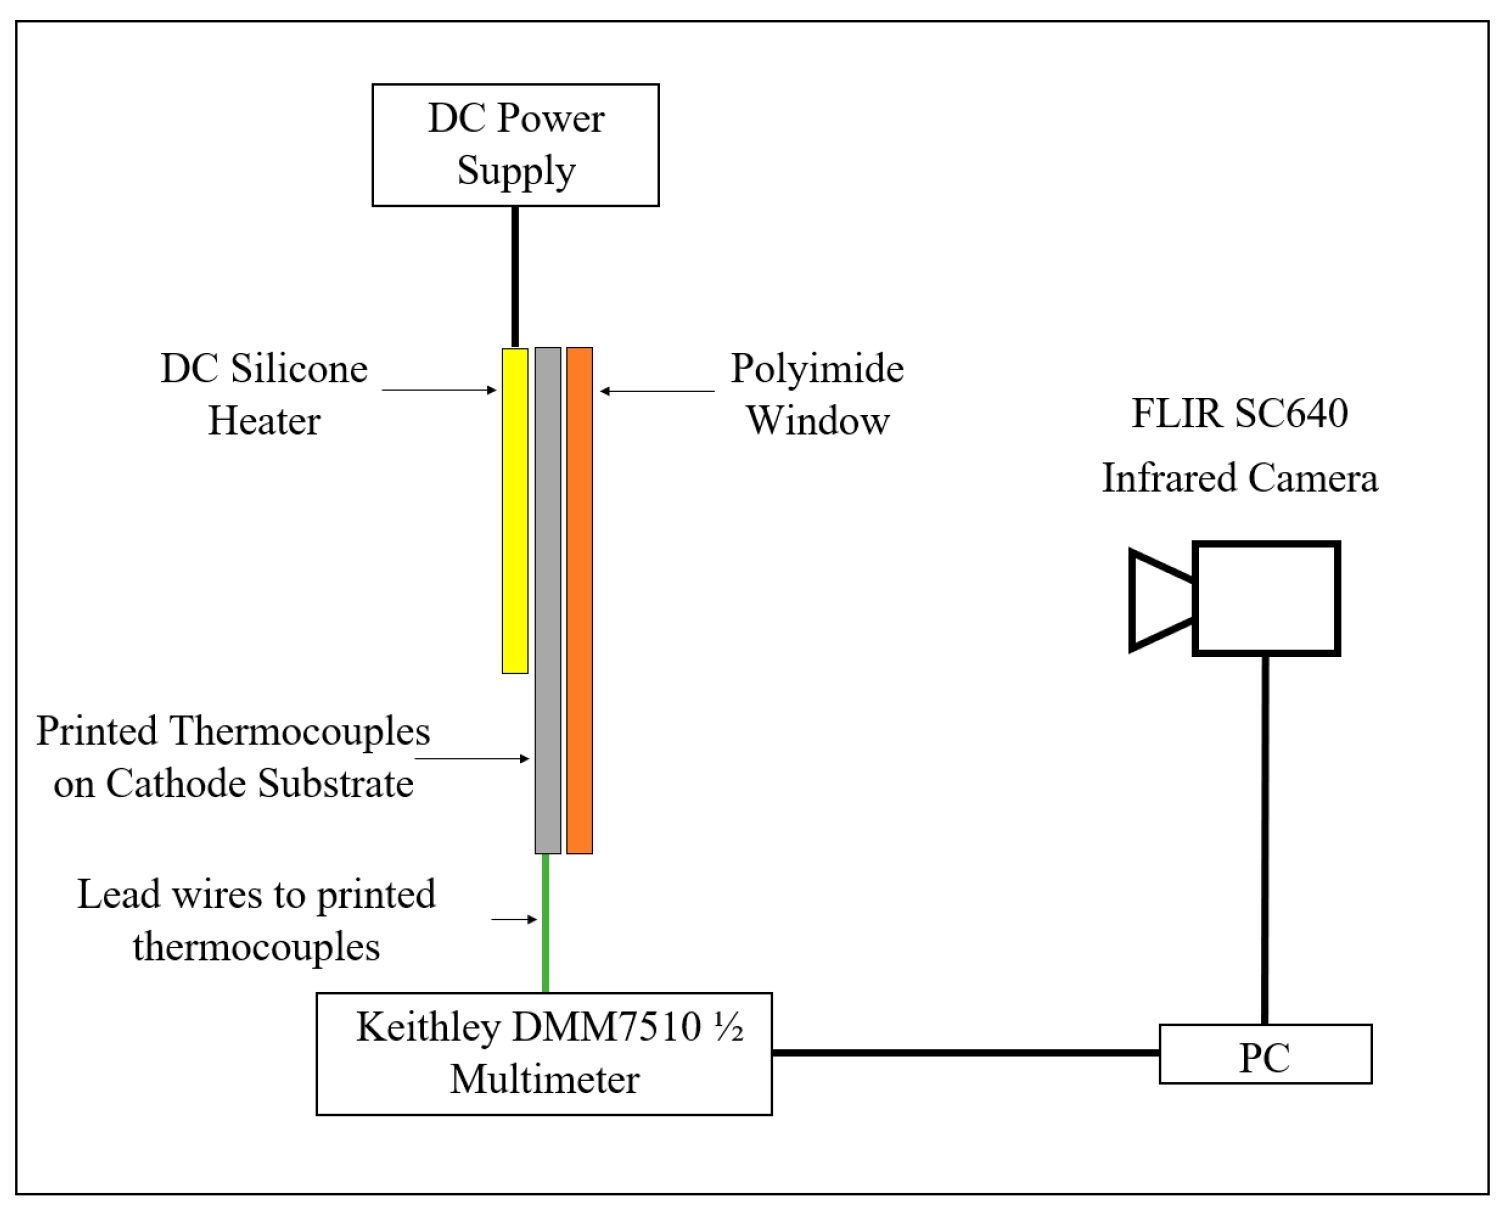
With the above calculation procedure established, the actual thermoelectric properties of the printed sensors were tested by utilizing the rig shown in Figure 4. As shown in the rig’s schematic, the printed thermocouple, along with its substrate, was tested by placing it under compression in between a DC electric silicone heater and a polyimide window. When the silicone heater was energized, the temperature at the printed thermocouple’s hot junction increased to around 40 °C, inducing a thermoelectric effect on the sensor and producing a potential difference that was measured and recorded by a digital multimeter (Keithley DMM7510 ½, Cleveland, USA). To measure and record the actual temperature of the printed thermocouples’ hot and cold junctions, an infrared camera (FLIR SC640 (Teledyne FLIR, Wilsonville, USA, with a thermal sensitivity of 30 mK) was then utilized. The polyimide window is crucial for the infrared camera’s accurate operation, as it ensures that the emissivity of the subject remains consistent (ϵ ≈ 0.95). By utilizing this set-up, the temperatures at the printed sensor’s hot junction may be calculated and then compared to the actual temperatures applied by the silicone heater.
To further validate the accuracy of the sensor’s thermoelectric properties, a calibration procedure was also developed and utilized to find the printed sample’s specific Seebeck coefficient difference (SCD) (S12). The calibration process required the sensor sample to also undergo the test procedure described in Figure 4 so as to monitor the sensor’s voltage output at specific temperature differences. Using the calibration procedure’s collected data, the measured temperature difference of the hot–cold junction was then plotted against its voltage output, allowing the best-fit line to be drawn and its gradient to be extracted, which is the specific SCD of a given printed thermocouple sample. By measuring the sample’s SCD, succeeding thermoelectric calculations may also be improved, as the sensor’s actual thermoelectric properties could provide a more accurate constant.
2.3.2. In Situ Test
Section 2.3.1 described the test procedure for the printed sensor’s characterization post printing, encapsulation, pouch sealing, and electrode drying. However, to test and characterize the sensor post electrolyte injection, a different test procedure is required. To validate the sensor’s performance after the pouch cell is injected with electrolyte, sealed, and fully assembled, the experimental set-up shown in Figure 5 was developed and utilized.
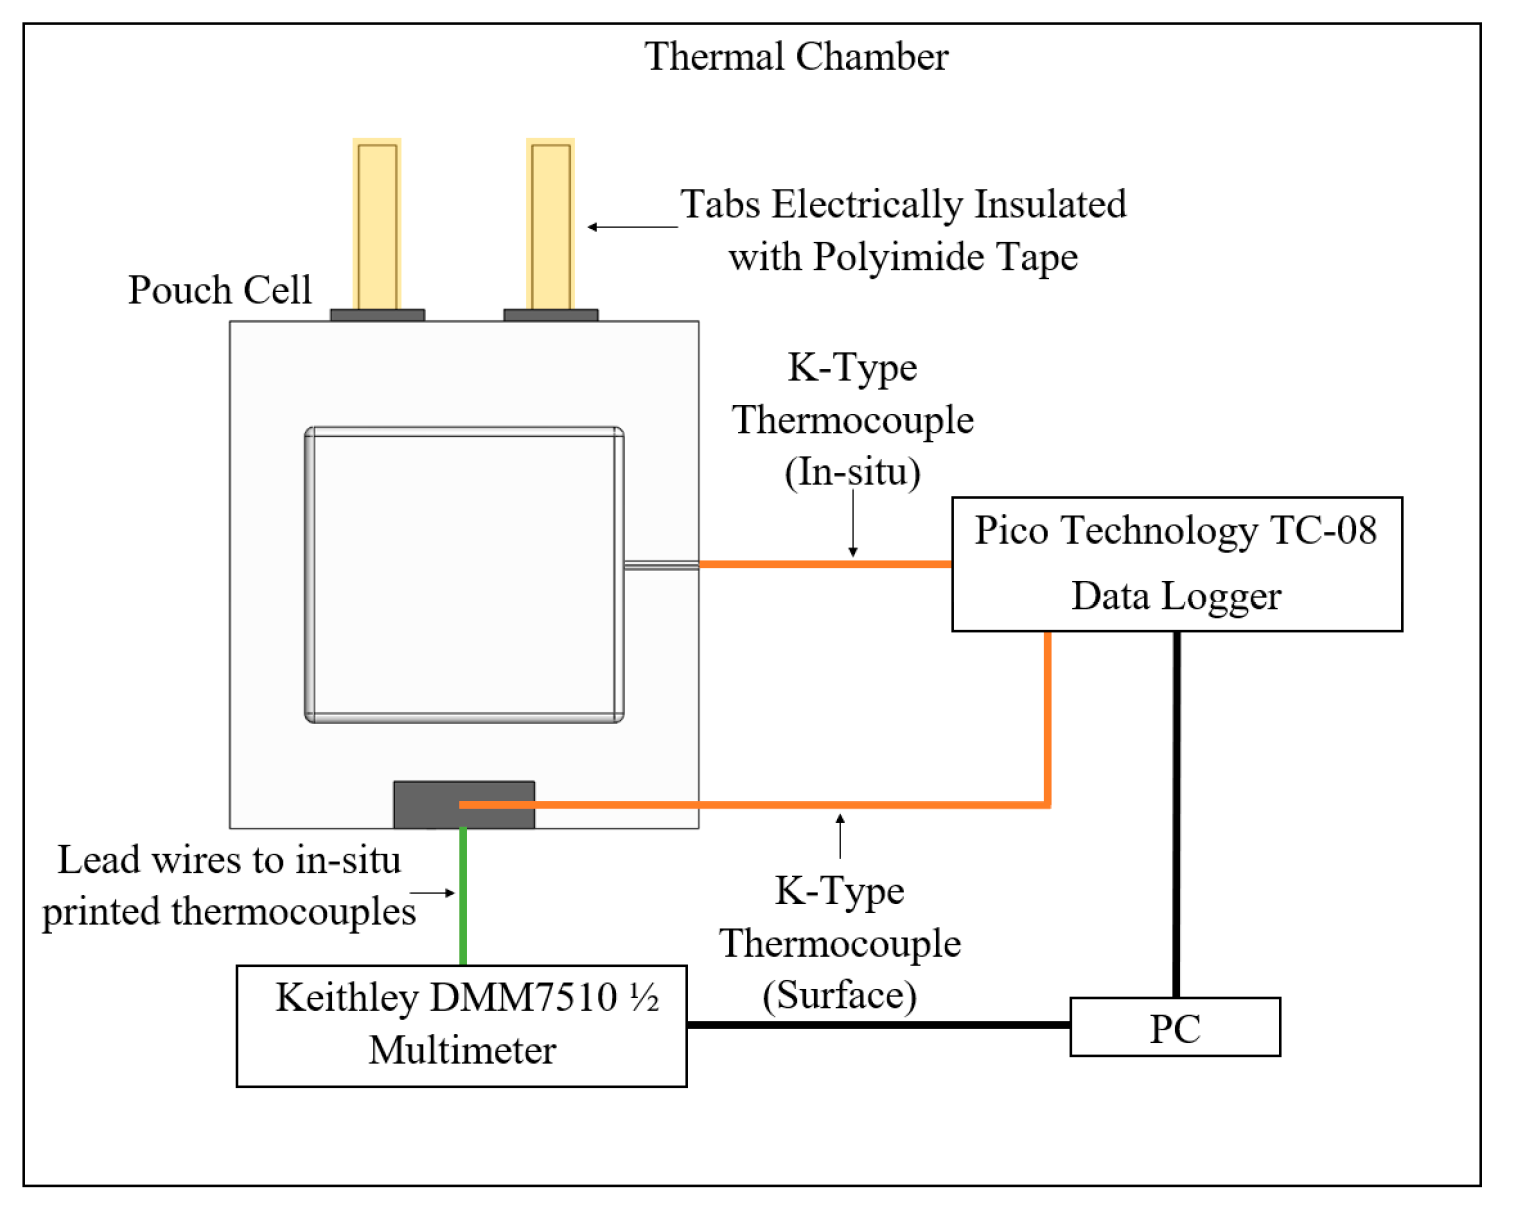
As discussed in Section 2.2, a K-type thermocouple was installed in situ of the pouch cell during its assembly. Through this in situ thermocouple, an internal reference temperature of the pouch cell was collected, aiding with the validation of the printed sensor’s in situ performance. Along with the in situ K-type thermocouple, a surface K-type thermocouple was also utilized on the printed sensor’s cold junction to provide additional reference temperatures. These reference K-type thermocouples were then connected to a data logger (Pico Technology TC-08, St Neots, UK) to measure and record their outputs. With regard to the printed thermocouple’s voltage output, it was again measured and recorded by an external digital multimeter (Keithley DMM7510 ½), as shown in Figure 5.
During testing, the effects of the environment were minimized by conducting the experiment in a thermal chamber where the temperature was set to 25 °C. For the duration of the test, the cell was also electrically isolated by neither charging nor discharging the cell and insulating its tabs with a polyimide tape. Through such an approach, only the effects of the electrolyte on the printed sensors were observed. Regarding the voltage-to-temperature calculation for this set-up, Equation (1) was again utilized along with the calculation procedure described in Section 2.3.1.
3. Results and Discussion
3.1. Post-Printing Characteristics
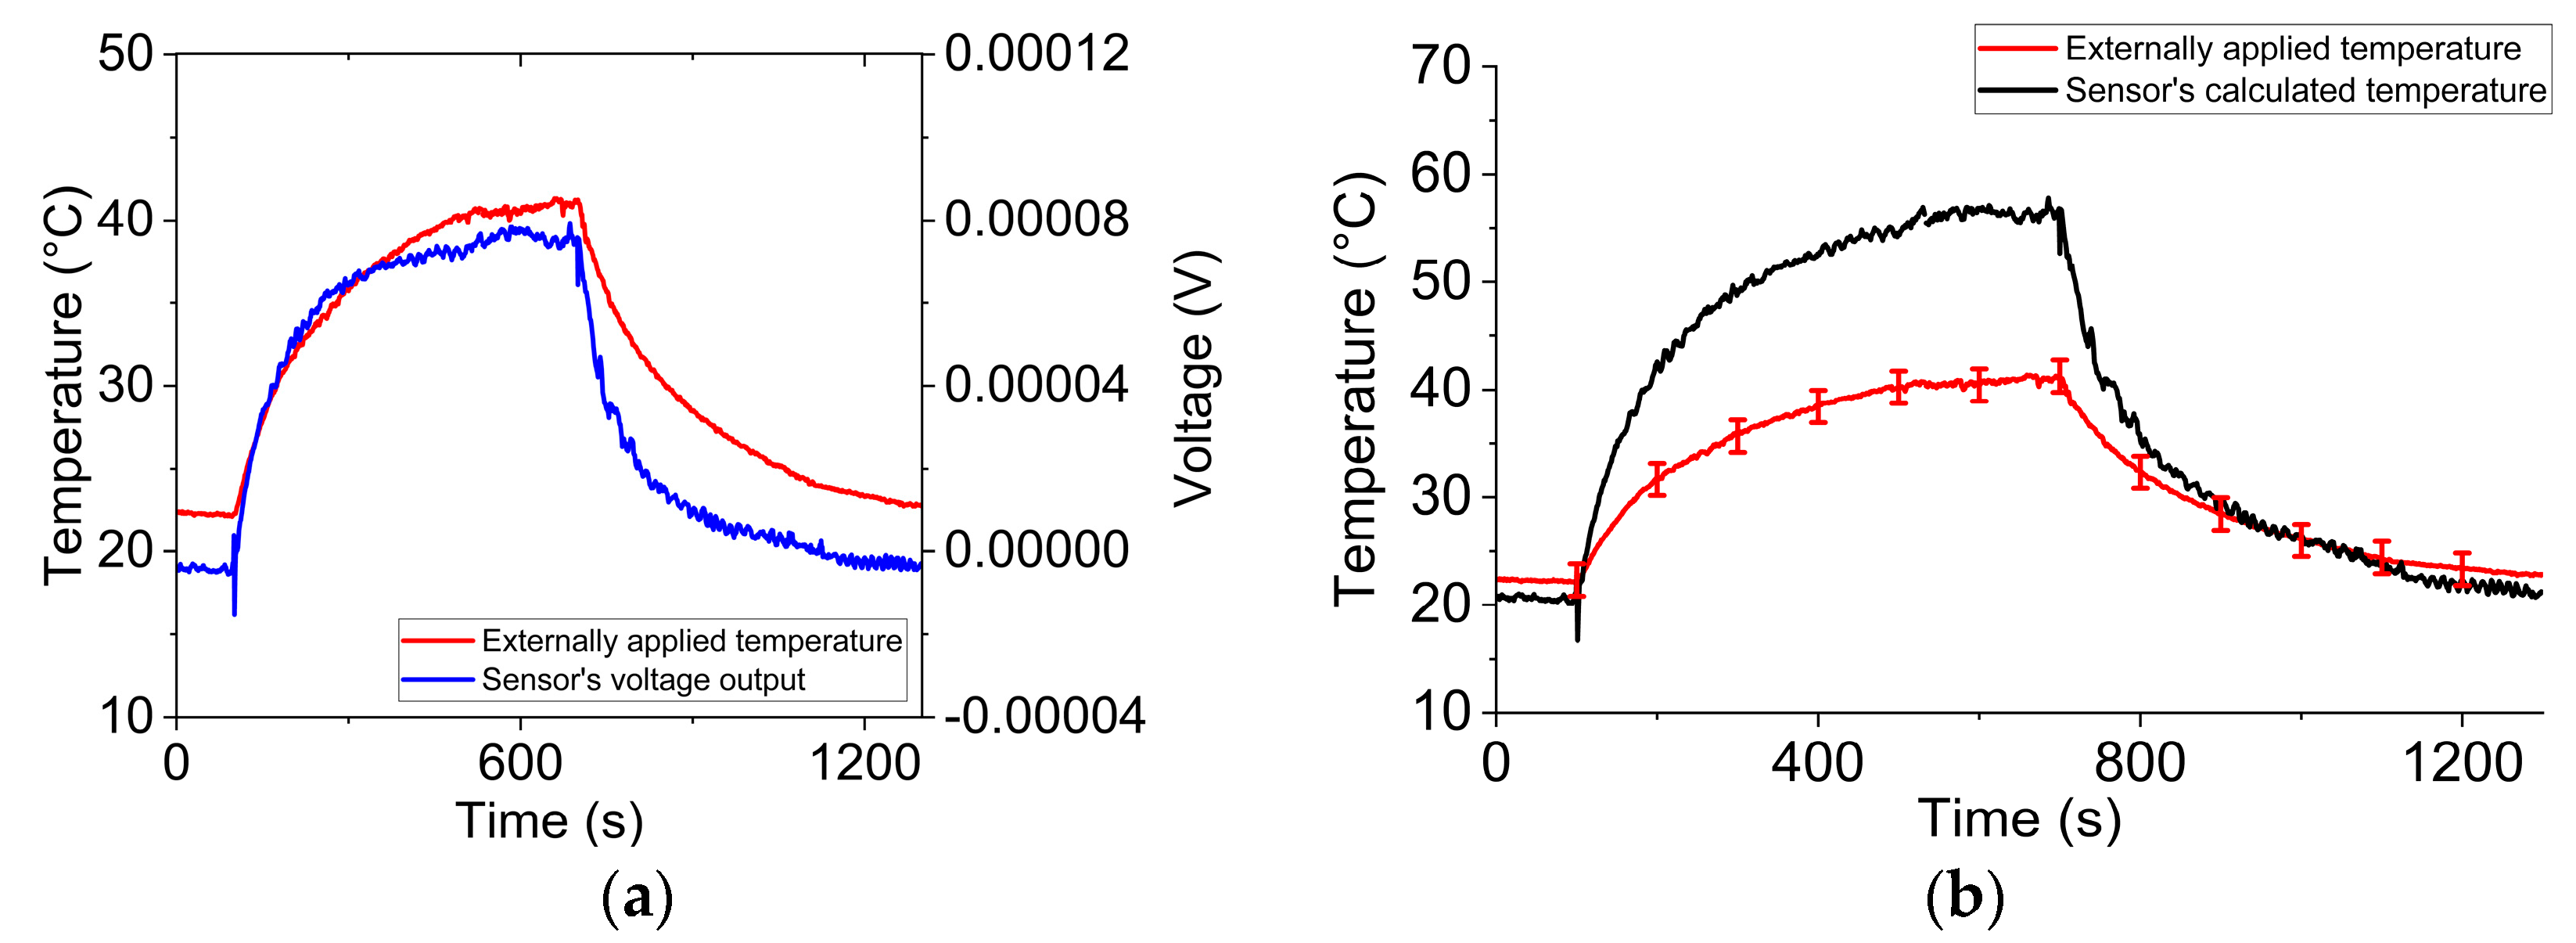
After printing the carbon black thermocouple, the sensor’s thermoelectric properties were tested as described in Section 2.3.1 to establish its base characteristics. Using the set-up shown in Figure 4, multiple voltages and temperature data points were collected as the silicone heater increased the printed sensor’s hot junction temperature and as it cooled down. As the graph in Figure 6a shows, the printed sensor’s voltage output and hot junction temperatures were found to be correlated. However, when the carbon black ink’s SC reported in the literature [14] as well as the measured cold junction temperatures and the voltage outputs of the printed sensor were applied to Equation (1), the calculated temperatures of the hot junction did not match with the actual temperatures applied by the heater and measured by the infrared camera. As shown in Figure 6b, the calculated temperatures deviated by −5.5 to 16.7 °C from the measured temperatures as the silicone heater warmed up the printed thermocouple and as it cooled down. The difference in the calculated and measured temperatures is suspected to arise from the previously reported SC of the commercial inks, as the equipment’s tolerance could not produce such a wide error. Additionally, the reported SC may be incompatible, as the commercial ink’s properties may vary depending on its active material’s purity and distribution [14].
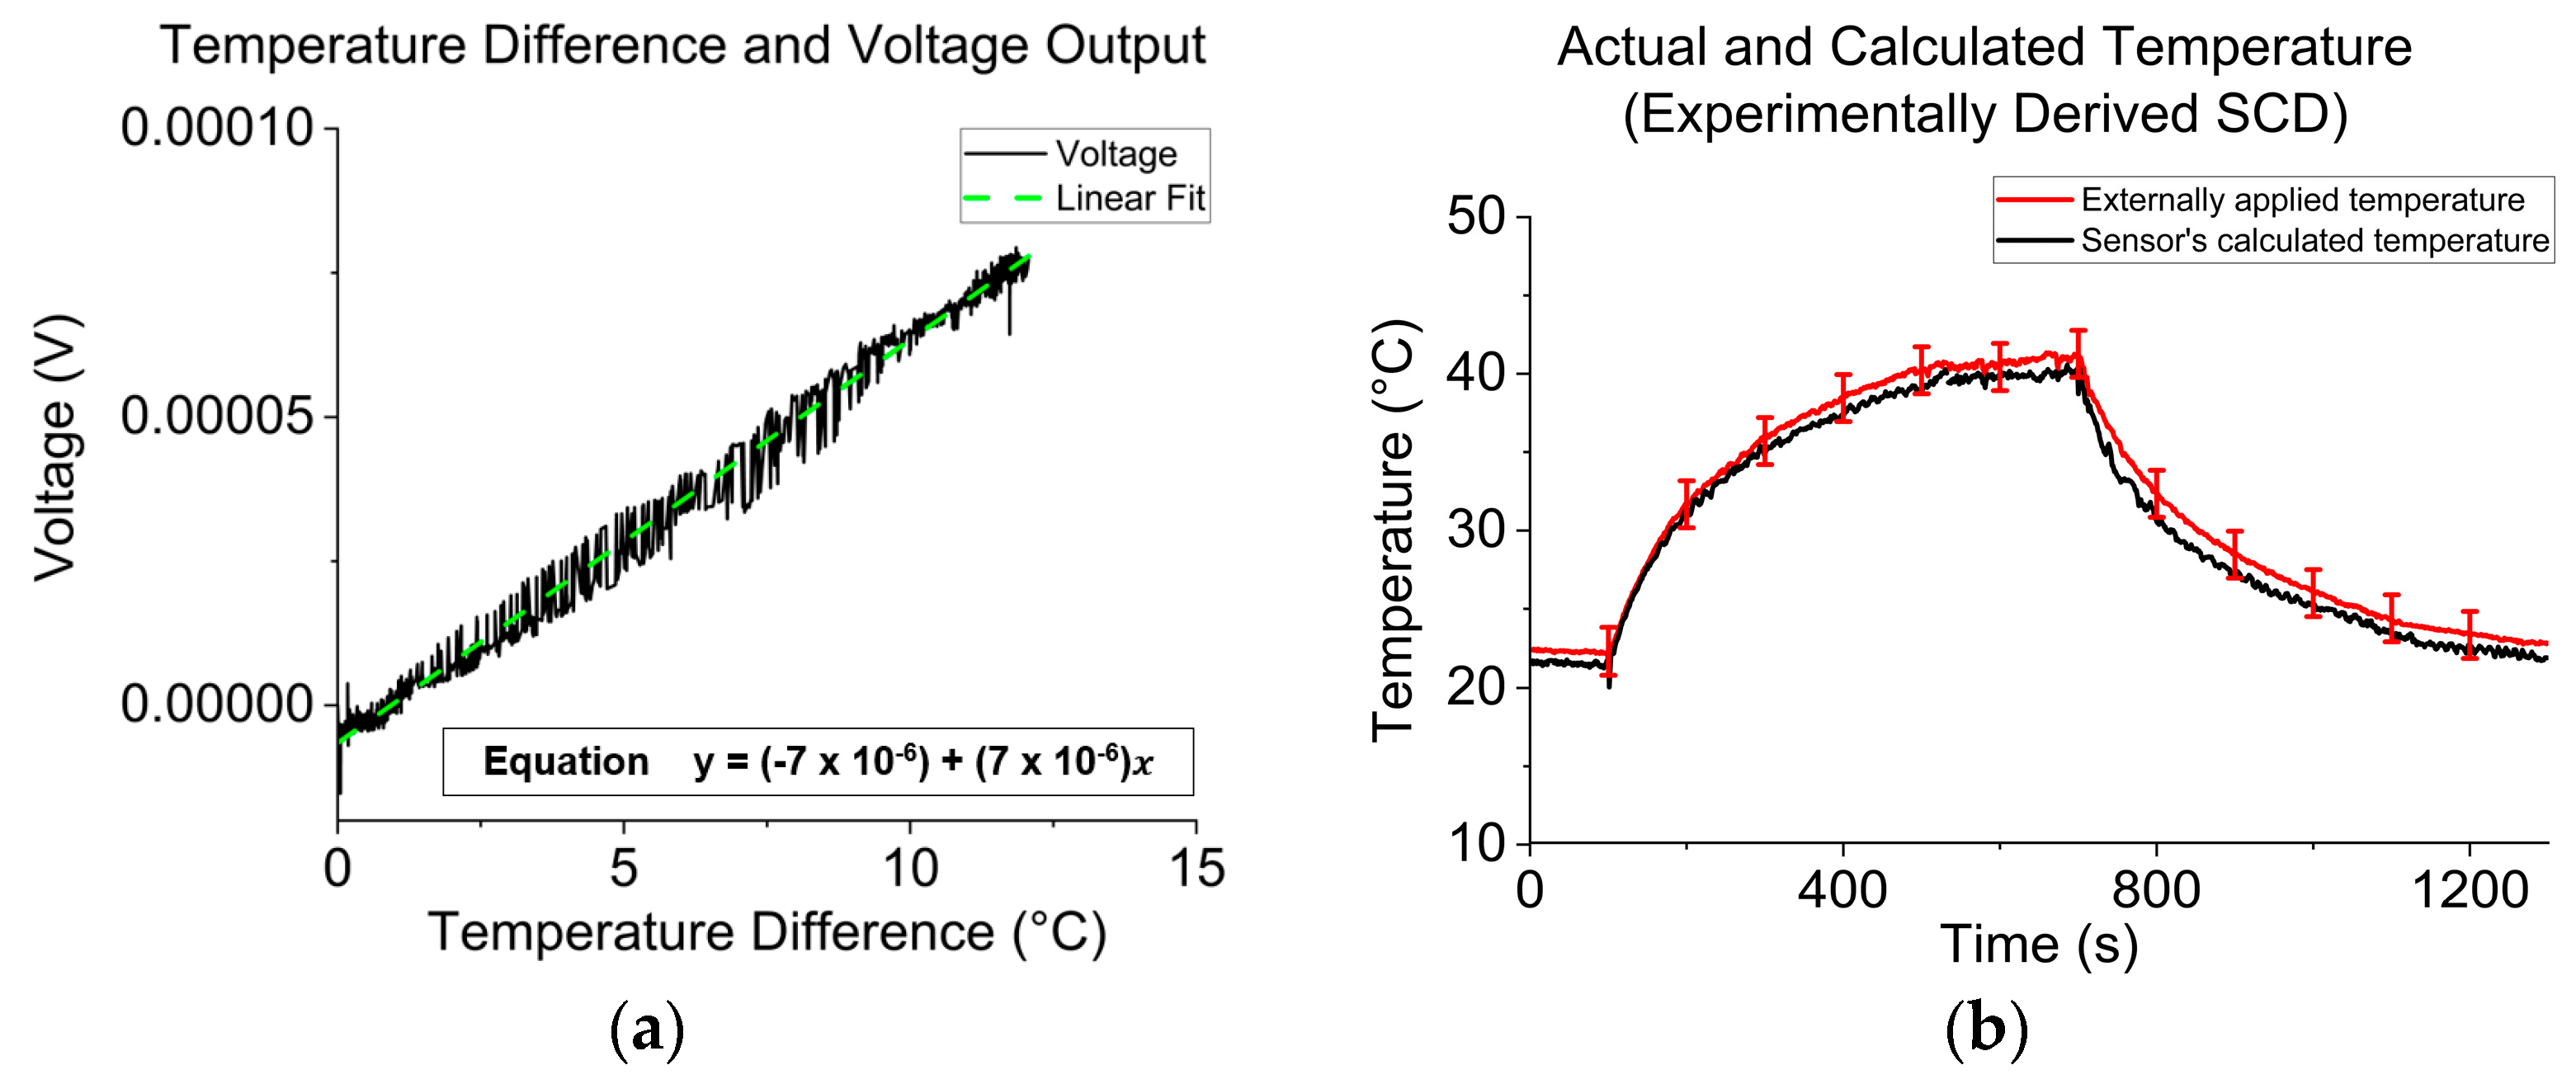
As the reported SC of the commercial inks was suspected to be incompatible, the calibration process was utilized to find the sample’s specific SCD (S12). As discussed in Section 2.3.1, the calibration process required the printed sensor to also undergo the test set-up shown in Figure 4. After the calibration test was conducted, the measured temperature difference of the hot and cold junction was then plotted against the sensor’s voltage output, as shown in Figure 7a. The specific SCD of the printed thermocouple sample was then found by laying the best-fit line and extracting its gradient. As the best-fit line’s gradient in Figure 7a shows, the SCD of the specific thermocouple sample was found to be 7 μV/K, which is higher than the 2.78 ± 0.004 μV/K SCD that can be derived from the literature. By applying the SCD found through the calibration process to Equation (1), the temperatures at the hot junction were re-calculated and re-graphed as shown in Figure 7b. As the graph in Figure 7b shows, the re-calculated temperatures were improved, as the deviation decreased to −2.55 to 0.36 °C. For all the printed thermocouples in the array, a similar pattern and trend were observed. Therefore, unless the printed sensor could be manufactured with high thermoelectric consistency, it is proposed that screen-printed carbon black thermocouples are individually calibrated in follow-up applications to better understand their specific properties and to provide a more accurate voltage-to-temperature calculation.
3.2. Post-Encapsulation Characteristics
After the carbon black thermocouple was encapsulated with a dielectric layer, as described in Section 2.1, the printed sensor’s thermoelectric properties were re-tested as described in the calibration procedure. It is crucial that the sensor’s properties are re-tested, as the application of the dielectric layer could cause unknown and unwanted effects on the carbon black thermocouples. Hereafter, it is also worth noting that the ink’s SC from the literature was not reused for follow-up calculations, as it was found to be incompatible with the samples.
After conducting the calibration procedure pre- and post-encapsulation, the SCD of the tested sample was found to be 7 μV/K and 7 μV/K, respectively. The consistency in the printed thermocouple’s SCD demonstrates that the encapsulating dielectric ink is compatible with the carbon black thermocouple and does not affect its performance. For additional reference, the sample’s calculated and measured temperatures had a minor deviation of −1.67 to 0.67 °C, further demonstrating that the printed thermocouple and its SCD remained stable and reliable post-encapsulation. It is also worth noting that a similar pattern and trend were observed for all the printed thermocouples in the array, therefore showing the encapsulation procedure to be a success.
3.3. Post-Sealing Characteristics
As discussed in Section 2.1, a portion of the printed thermocouple was deposited and located on the pouch material. Therefore, when the pouch cell is sealed, a part of the printed thermocouple will also be subjected to the pouch sealing’s high temperature and pressure environment. The effects of such conditions on the carbon black thermocouples are unknown; therefore, the sensor’s thermoelectric properties were re-tested to monitor the impact of the pouch-sealing process.
To test the effects of the sealing process, two samples were tested under two different sealing parameters. Using an RDM HSE-3 heat sealer, with its two aluminum heat bars, the first sample was sealed under conventional sealing parameters of 140 °C, 2 bar pressure, and a dwell time of 6 s. On the other hand, the second sample was sealed using a Henkelman Mini Jumbo heat sealer (Den Bosch, The Netherlands), with its aluminum–silicone heat bars, the equipment’s default pressure and temperature, and a dwell time of 6 s. The Henkelman Mini Jumbo is ideal for minimizing mechanical stress, as its aluminum–silicone heat bar construction provides a more forgiving and soft sealing environment for the printed thermocouple. With the two sealing parameters established, the sample’s pre- and post-sealing SCD were then tested using the calibration procedures described in Section 2.3.1.
Looking at Table 2, it can be observed that the SCD of the sample that underwent the conventional sealing method decreased, whilst the soft-sealed sensor remained consistent. If the traditional sealing method and its pre- and post-sealing SCD are utilized, the deviation between the calculated and measured temperatures will range between −2.56 to 2.31 °C and −5.75 to 0.03 °C, respectively. Identifying that such change may occur during the sealing process is crucial, as it could have unwanted effects on the voltage-to-temperature calculation of the sensor. In comparison, if the soft-sealing method and its SCD are utilized, the deviation between the calculated and measured temperatures will range between 0.84 and 2.28 °C, a minor change that could be attributed to the sensor’s operating tolerance.
By testing two different sealing approaches, it was observed that the conventional sealing method is destructive to the printed thermocouple, as it caused three out of the five thermocouples in the array to be permanently damaged post sealing. This occurred because the conventional sealing method was observed to physically deform the printed thermocouples, compressing some parts of the dried inks out of the pouch cell during the sealing process and, therefore, creating an electrical discontinuity in the sensors. On the contrary, the soft-sealed sample was unaffected, and all thermocouples in its array remained functional post sealing. Additionally, the soft-sealing method did not produce any observable deformation in the printed thermocouple samples, and its electrical continuity remained fully operational.
3.4. Post-Drying Characteristics
Prior to the injection of the electrolyte into the pouch cell, the electrodes must be re-dried to minimize its moisture content. Such a procedure is required, as excess moisture in the electrodes was found to accelerate the cell’s degradation [16,17]. As the carbon black thermocouples are located and are printed on the electrodes, they must also be subjected to the electrode’s prolonged high-temperature drying environment. The effects of such conditions on the printed thermocouples are unknown; therefore, we re-tested the printed thermocouples and investigated any changes in their thermoelectric properties.
To test the effects of the electrode’s dying process, two samples were tested under two different drying parameters. The first sample was dried in a vacuum oven at 80 °C for 24 h, observing conventional electrode drying procedures. On the other hand, as the electrode substrate in this work is thermally sensitive, the second sample was dried using a more forgiving drying technique that used a non-vacuum oven and a lower temperature of 50 °C for 24 h. With the two drying parameters established, the sample’s pre- and post-drying SCD were then tested using the sensor’s calibration procedure. The results of these tests are shown in Table 3.
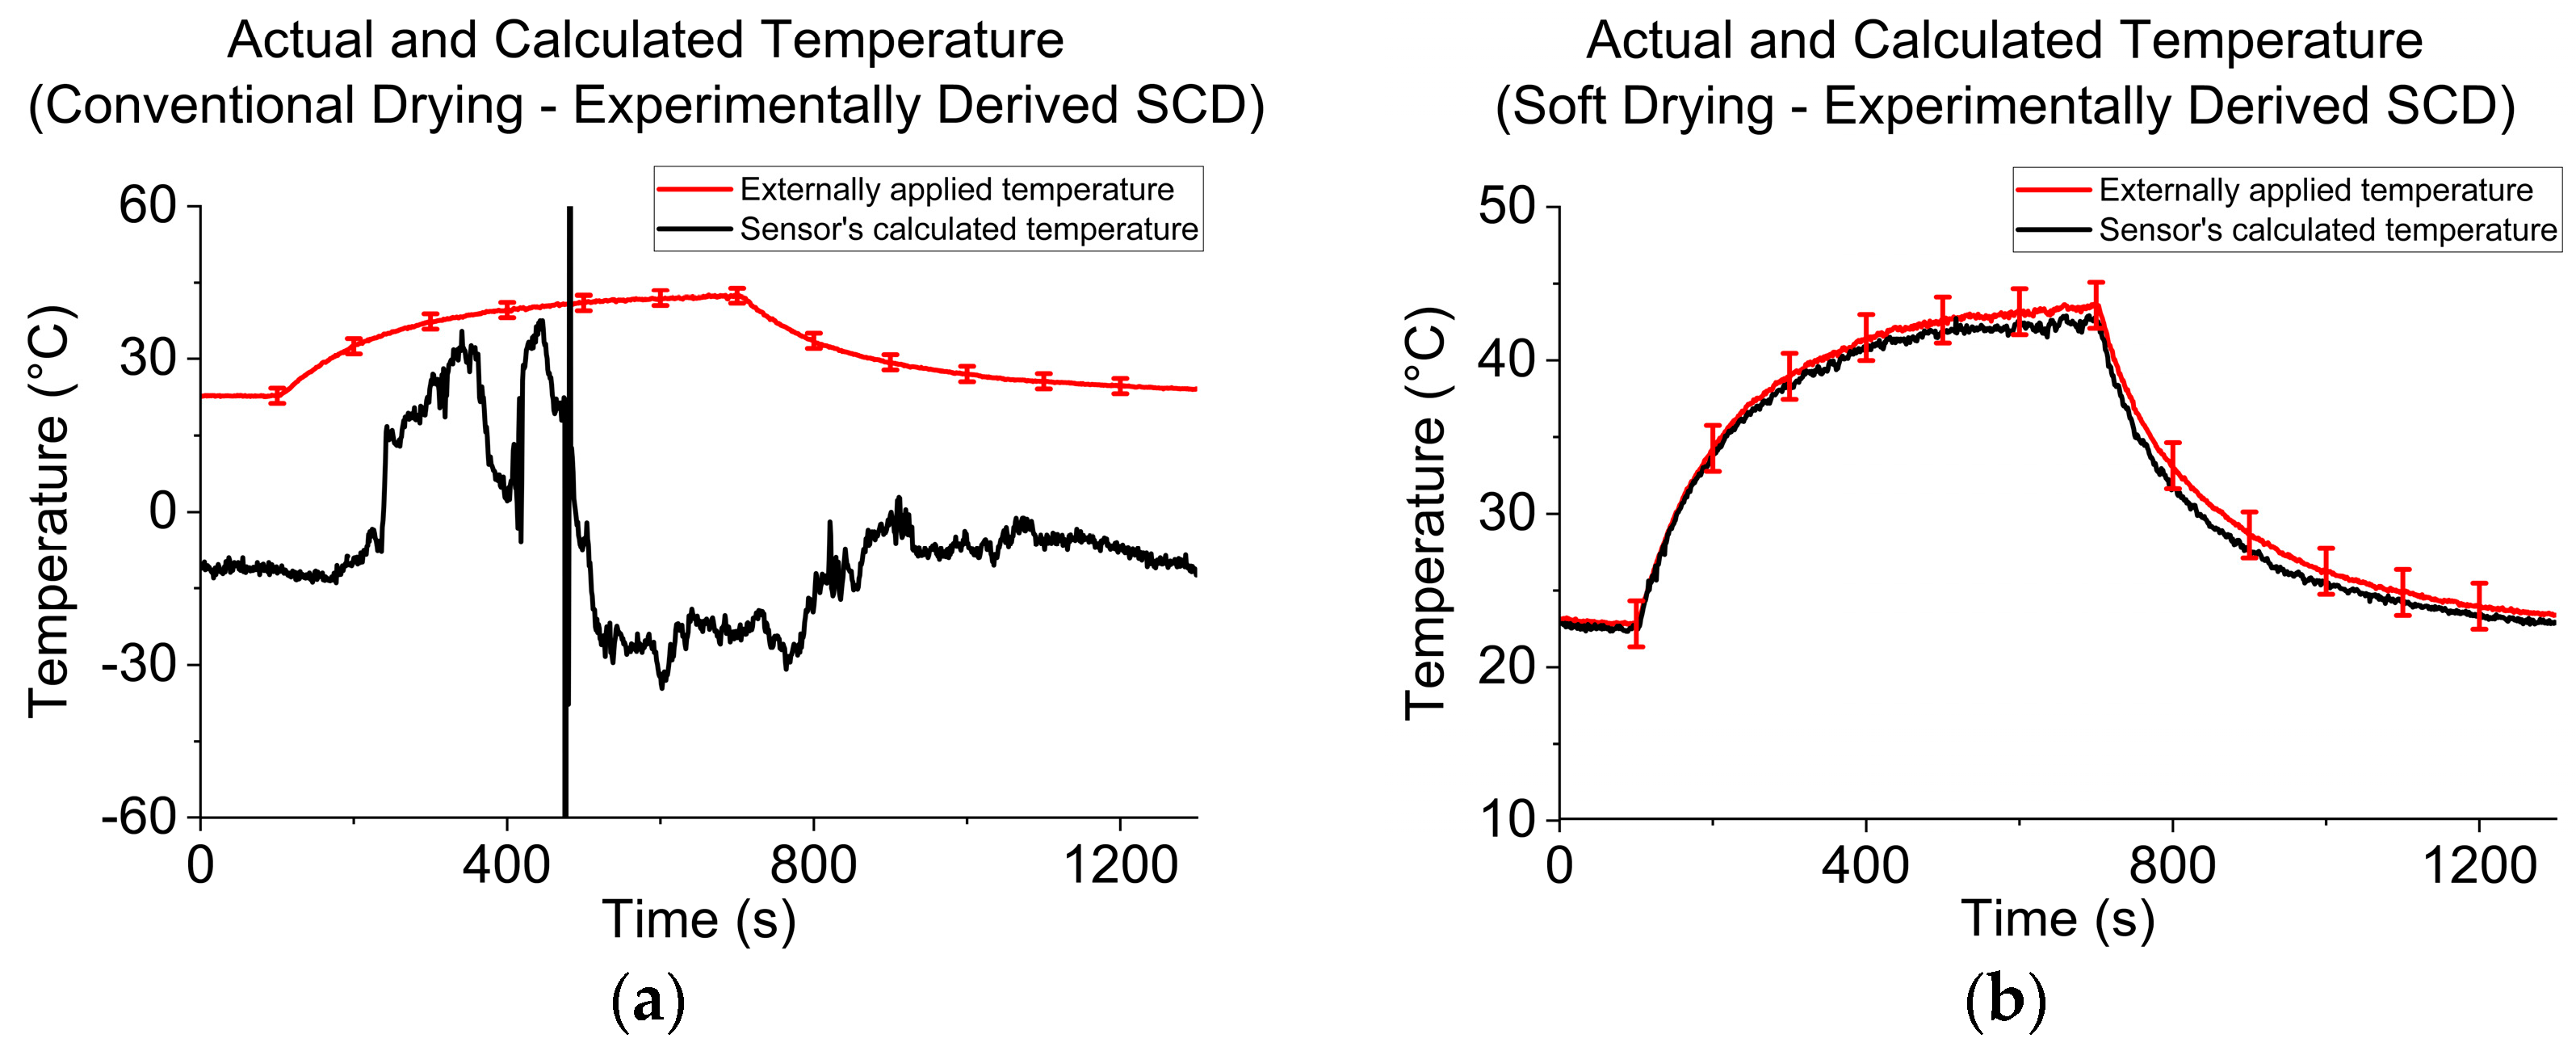
As Table 3 shows, the conventional drying procedure significantly affected the printed thermocouple’s SCD, whilst the soft-dried sensor experienced a minor change. In addition to the change in the thermocouple’s SCD, the conventional drying procedure was also found to damage the sensor’s thermoelectric properties permanently. Looking at Figure 8a, it can be noted that the printed thermocouple’s thermoelectric properties became unreliable post the conventional drying procedure, as its temperature and voltage output lost their correlation. In comparison, as shown in Figure 8b, the soft-dried thermocouple remained fully functional and operated with minor deviation from the actual temperature. For reference, if the soft-drying method’s pre- and post-sealing SCD are utilized, the deviation of the calculated temperatures will range between −1.37 to 1.48 °C and −1.82 to 0.39 °C, respectively, a minor change that could still be attributed to the printed sensor’s operating tolerance.
3.5. In Situ Characteristics
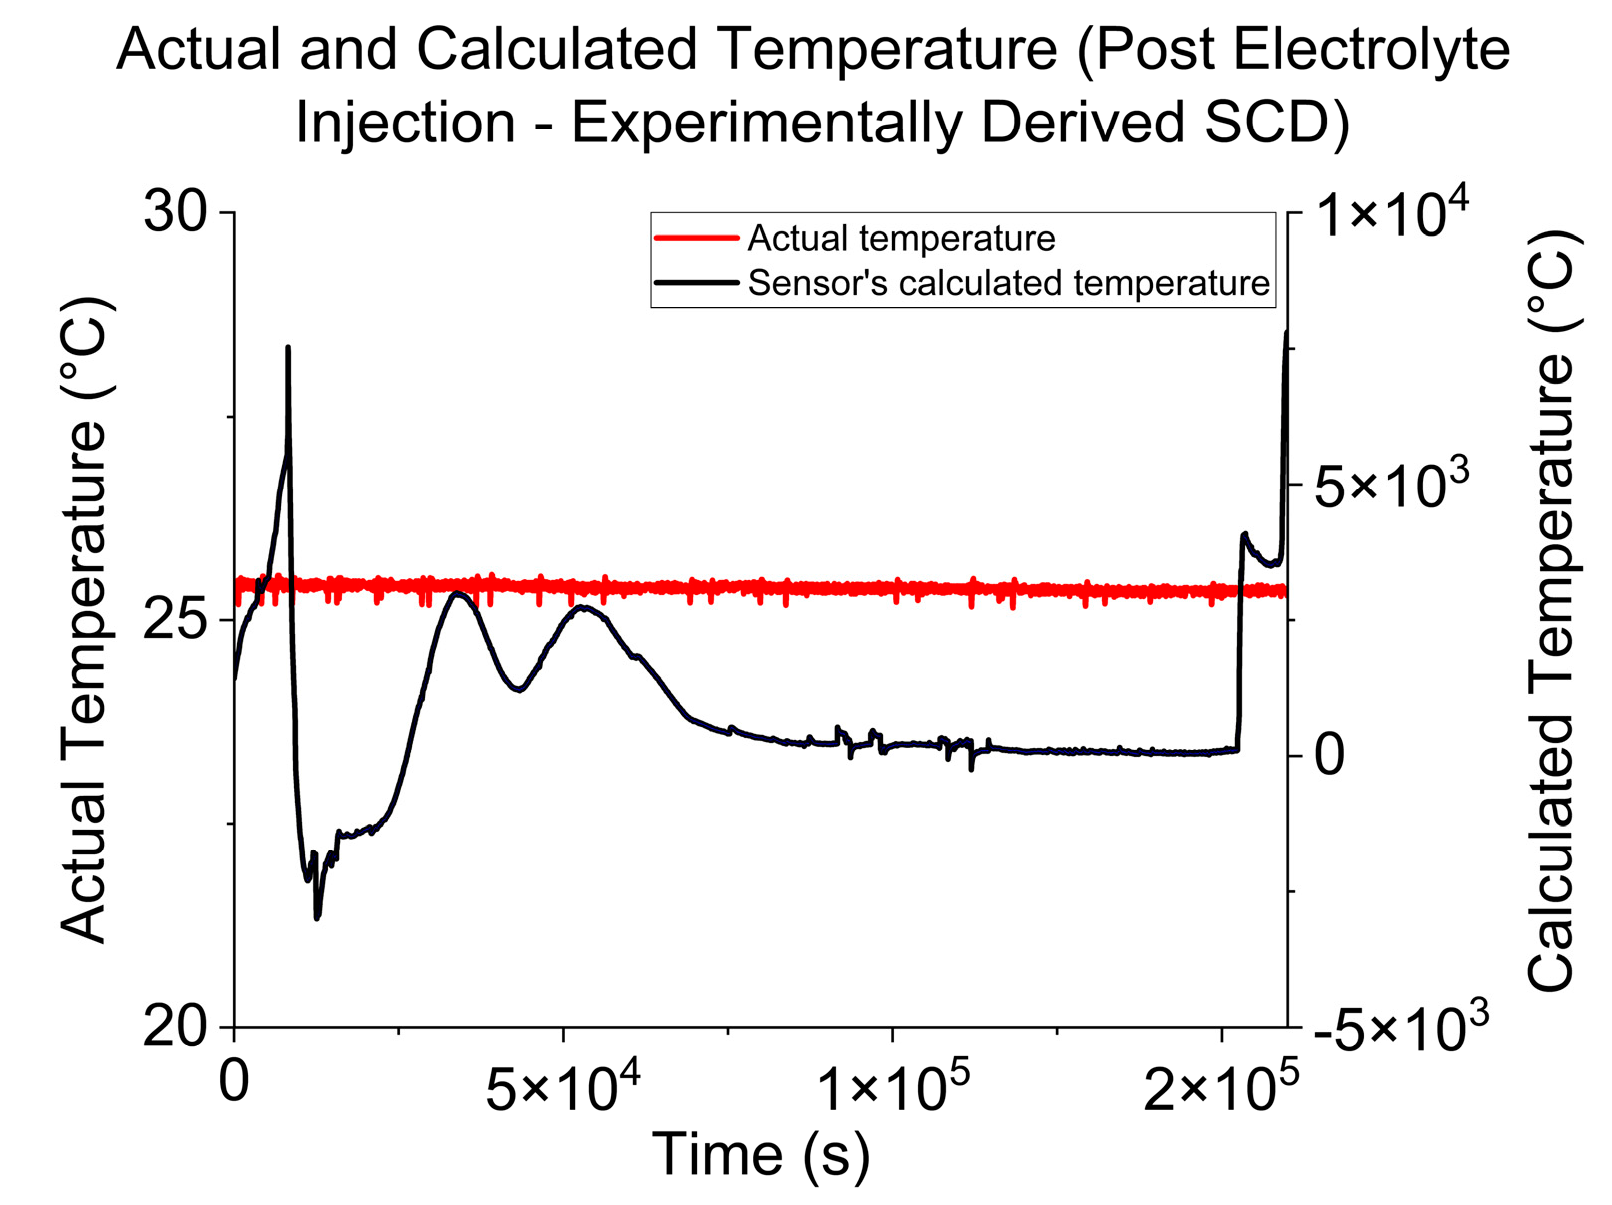
To test the printed thermocouple’s thermoelectric property post electrolyte injection and its in situ performance in a completed pouch cell, the experimental set-up described in Section 2.3.2 was utilized. Prior to the soaking of the printed sensor in the electrolyte, its average resting voltage output was −6.8 μV when its cold and hot junctions were at equal temperatures. When the electrolyte was injected, the sensor’s voltage output was observed to float at around −6.8 μV for several seconds. However, as time progressed, the printed sensor’s resting voltage output was observed to increase and then fluctuate, peaking at about 87 mV, losing its correlation with the temperature even though its cold and hot junctions remained stable at around 25 °C, as confirmed by the reference thermocouples. If the printed sensor’s new resting voltage outputs are converted to temperature, using its pre-electrolyte SCD of 10 μV/K, the calculated temperatures at the hot junction will deviate by −3006 to 8732 °C from the actual temperature, as shown in Figure 9.
With the above characteristics, it is evident that the printed thermocouple failed after the electrolyte was introduced. The sensor’s dielectric coating could have provided temporary chemical insulation for the carbon black thermocouple, enabling it to operate normally for several seconds. However, as the sensor was soaked, the dielectric coating could have failed, disintegrated, which therefore exposed the carbon black thermocouple to the electrolyte, altering its thermoelectric properties.
To validate the sensor’s reaction to the electrolyte, a total of two samples were subjected to the above in situ experimental set-up and procedures. On both samples, all the thermocouples in the array showed similar thermoelectric property degradation and loss of their temperature–voltage correlation post electrolyte injection. With this finding, it is proposed that the printed sensor’s insulation be developed further to improve its chemical resistance.
4. Conclusions
This paper discussed the fabrication, calibration, and integration of printed carbon black thermocouple arrays in a pouch cell. Due to the printed nature and low material cost of the carbon black thermocouple, the sensor was found to be easily scalable whilst also providing adaptability for accommodating sensor designs with good spatial resolution. By monitoring the printed sensor’s thermoelectric properties during its fabrication and integration in the pouch cell, it was also found that it could be accurately calibrated and installed in a cell given an optimized manufacturing parameter. As the carbon black thermocouple provided a stable thermoelectric property until it was soaked in the electrolyte, this technique could present a new approach for the thermal monitoring of LIBs. However, for this technique to be better utilized in situ of a LIB, the printed thermocouple’s encapsulating layer must be further developed to reliably insulate the sensor from the destructive effects of the electrolyte.
Author Contributions
Conceptualization, N.C.T.; Formal analysis, N.C.T.; Funding acquisition, D.J.C.; Investigation, N.C.T.; Methodology, N.C.T.; Project administration, D.J.C.; Resources, D.J.C.; Supervision, D.J.C.; Validation, D.J.C.; Visualization, N.C.T.; Writing—original draft, N.C.T.; Writing—review and editing, N.C.T. and D.J.C. All authors have read and agreed to the published version of the manuscript.
Funding
This work is supported by the Engineering and Physical Sciences Research Council Centre for Doctoral Training in Energy Storage and its Applications (EPSRC CDT ESA) and AMTE Power Plc (Stockton-On-Tees, UK), via grant EP/L016818/1.
Data Availability Statement
The data presented in this study are available on request from the corresponding author.
Conflicts of Interest
The authors declare that this study received funding from AMTE Power Plc (Stockton-On-Tees, UK). The funder had the following involvement with the study: the decision to submit it for publication.
References
- Choi, J.W.; Aurbach, D. Promise and reality of post-lithium-ion batteries with high energy densities. Nat. Rev. Mater. 2016, 1, 16013. [Google Scholar] [CrossRef]
- Waldmann, T.; Wilka, M.; Kasper, M.; Fleischhammer, M.; Wohlfahrt-Mehrens, M. Temperature dependent ageing mechanisms in Lithium-ion batteries—A Post-Mortem study. J. Power Sources 2014, 262, 129–135. [Google Scholar] [CrossRef]
- Deshpande, R.D.; Verbrugge, M.W.; Cheng, Y.-T.; Wang, J.; Liu, P. Battery cycle life prediction with coupled chemical degradation and fatigue mechanics. J. Electrochem. Soc. 2012, 159, A1730–A1738. [Google Scholar] [CrossRef]
- Mallick, S.; Gayen, D. Thermal behaviour and thermal runaway propagation in lithium-ion battery systems—A critical review. J. Energy Storage 2023, 62, 106894. [Google Scholar] [CrossRef]
- Kong, D.; Lv, H.; Ping, P.; Wang, G. A review of early warning methods of thermal runaway of lithium ion batteries. J. Energy Storage 2023, 64, 107073. [Google Scholar] [CrossRef]
- Goutam, S.; Timmermans, J.-M.; Omar, N.; Bossche, P.V.D.; Van Mierlo, J. Comparative Study of Surface Temperature Behavior of Commercial Li-Ion Pouch Cells of Different Chemistries and Capacities by Infrared Thermography. Energies 2015, 8, 8175–8192. [Google Scholar] [CrossRef]
- Wang, P.; Zhang, X.; Yang, L.; Zhang, X.; Yang, M.; Chen, H.; Fang, D. Real-time monitoring of internal temperature evolution of the lithium-ion coin cell battery during the charge and discharge process. Extreme Mech. Lett. 2016, 9, 459–466. [Google Scholar] [CrossRef]
- Forgez, C.; Do, D.; Friedrich, G.; Morcrette, M.; Delacourt, C. Thermal modeling of a cylindrical LiFePO4/graphite lithium-ion battery. J. Power Sources 2010, 195, 2961–2968. [Google Scholar] [CrossRef]
- Wu, Y.; Long, X.; Lu, J.; Zhou, R.; Liu, L.; Wu, Y. Long-life in-situ temperature field monitoring using Fiber Bragg grating sensors in electromagnetic launch high-rate hardcase lithium-ion battery. J. Energy Storage 2023, 57, 106207. [Google Scholar] [CrossRef]
- Goutam, S.; Nikolian, A.; Jaguemont, J.; Smekens, J.; Omar, N.; Bossche, P.V.D.; Van Mierlo, J. Three-dimensional electro-thermal model of li-ion pouch cell: Analysis and comparison of cell design factors and model assumptions. Appl. Therm. Eng. 2017, 126, 796–808. [Google Scholar] [CrossRef]
- Li, Z.; Zhang, J.; Wu, B.; Huang, J.; Nie, Z.; Sun, Y.; An, F.; Wu, N. Examining temporal and spatial variations of internal temperature in large-format laminated battery with embedded thermocouples. J. Power Sources 2013, 241, 536–553. [Google Scholar] [CrossRef]
- Schmidt, J.P.; Arnold, S.; Loges, A.; Werner, D.; Wetzel, T.; Ivers-Tiffée, E. Measurement of the internal cell temperature via impedance: Evaluation and application of a new method. J. Power Sources 2013, 243, 110–117. [Google Scholar] [CrossRef]
- Mutyala, M.S.K.; Zhao, J.; Li, J.; Pan, H.; Yuan, C.; Li, X. In-situ temperature measurement in lithium ion battery by transferable flexible thin film thermocouples. J. Power Sources 2014, 260, 43–49. [Google Scholar] [CrossRef]
- Offenzeller, C.; Knoll, M.; Jakoby, B.; Hilber, W. Screen-Printed, Pure Carbon-Black Thermocouple Fabrication and Seebeck Coefficients. Sensors 2019, 19, 403. [Google Scholar] [CrossRef] [PubMed]
- Bouaanani, Y.; Baucour, P.; Gavignet, E.; Lanzetta, F. Performance of a thermocouple subjected to a variable current. Int. J. Therm. Sci. 2018, 134, 440–452. [Google Scholar] [CrossRef]
- Stich, M.; Pandey, N.; Bund, A. Drying and moisture resorption behaviour of various electrode materials and separators for lithium-ion batteries. J. Power Sources 2017, 364, 84–91. [Google Scholar] [CrossRef]
- Logan, E.R.; Hebecker, H.; Eldesoky, A.; Luscombe, A.; Johnson, M.B.; Dahn, J.R. Performance and Degradation of LiFePO4/Graphite Cells: The Impact of Water Contamination and an Evaluation of Common Electrolyte Additives. J. Electrochem. Soc. 2020, 167, 130543. [Google Scholar] [CrossRef]
Figure 1.
The printed thermocouple fabrication process. The printing screen with the sensor’s patterns was prepared by flooding the screen with ink and positioning the squeegee for printing (a); the cathode substrate was secured in place on the pouch material using a polyimide tape (b); the dielectric layer was printed on the cathode, polyimide tape and pouch material (c); the SD 2842 Hal ink was printed on the dielectric layer (d); the SD 2843 HAL ink was printed on the dielectric layer and overlapped with SD 2842 Hal on some areas (overlap area = 6 mm2) to form the sensor’s hot junctions (e); the copper contacts were attached (f); and the carbon black thermocouple was encapsulated with a dielectric layer (g).

Figure 2.
The printed thermocouple array’s design with five hot junctions, shown as orange dots, for its sensing points, with the cold junctions located in the dashed orange box, and six connection wires/pins. With the 4154 mm2 (67 by 62 mm) cathode as the substrate, the SD 2842 HAL and SD 2843 HAL inks were printed on the dielectric layer, shown in blue, red, and green, respectively, producing a 1597 mm2 sensor, overlapping with roughly 38% of the electrode.

Figure 3.
The pouch cell assembly and sensor installation process. The pouch was partially sealed (a); a K-type thermocouple was attached adjacent to one of the printed thermocouples to provide reference temperature data (b); the printed and K-type thermocouples are sandwiched by stacks of anodes, cathodes, and separators (c); the tabs were welded to the electrode’s current collectors (d); the pouch was partially sealed, with the side highlighted in red left unsealed, and was dried in an oven (e); the electrolyte was injected into the cell (f); the pouch was fully sealed (g); and a custom-built connector was attached to the printed sensor (h).

Figure 4.
The measurement rig’s schematic. The printed thermocouple and its substrate were placed under compression in between a DC-powered silicone heater and a polyimide window. The digital multimeter measured the sensor’s voltage output whilst the infrared camera, with an accuracy of ±2 °C, monitored the cold and hot junction temperature through the polyimide window.

Figure 5.
The voltage output of the printed carbon black thermocouple in situ of the pouch cell was monitored by the digital multimeter, whilst the K-type thermocouples monitored the sensor’s cold and hot junction temperatures.
Figure 5.
The voltage output of the printed carbon black thermocouple in situ of the pouch cell was monitored by the digital multimeter, whilst the K-type thermocouples monitored the sensor’s cold and hot junction temperatures.

Figure 6.
The temperature at the printed thermocouple’s hot junction and the sensor’s corresponding voltage output (a). Using the carbon black ink’s reported SC from the literature caused the calculated temperature to significantly deviate from the actual temperature (b).
Figure 6.
The temperature at the printed thermocouple’s hot junction and the sensor’s corresponding voltage output (a). Using the carbon black ink’s reported SC from the literature caused the calculated temperature to significantly deviate from the actual temperature (b).

Figure 7.
The SCD of the printed thermocouple is the gradient of the temperature difference of the hot–cold junction against the sensor’s voltage output (a). Using the SCD found through the calibration procedure minimized the deviation between the calculated and actual temperatures, with tolerance falling within ±1.5 °C when the temperature was stable (b).

Figure 8.
The effects of the drying parameters on carbon black thermocouple’s thermoelectric properties. The carbon black thermocouple’s temperature and voltage output correlation is lost when the sensor and electrode are dried using conventional parameters (a). On the contrary, the ‘soft’-drying conditions have a minimal effect on the printed thermocouple’s performance, with tolerance falling within ±1.5 °C when the temperature is stable (b).

Figure 9.
The pouch cell’s in situ temperature and the printed sensor’s calculated temperature during electrolyte soaking. When the electrolyte was introduced, the carbon black thermocouple’s temperature and voltage output correlation was lost.
Figure 9.
The pouch cell’s in situ temperature and the printed sensor’s calculated temperature during electrolyte soaking. When the electrolyte was introduced, the carbon black thermocouple’s temperature and voltage output correlation was lost.


Table 1.
The properties of the carbon black inks, according to the manufacturer, and limited testing of the materials [14].
Table 1.
The properties of the carbon black inks, according to the manufacturer, and limited testing of the materials [14].
| Ink | Solids Content by Weight (%) | Seebeck Coefficient (μV/K) |
|---|---|---|
| SD 2842 HAL (Peters, Kempen, Germany) | 76–84 | −1.85 ± 0.002 |
| SD 2843 HAL (Peters, Kempen, Germany) | 73–77 | 0.93 ± 0.002 |
Table 2.
The SCD pre- and post-pouch sealing.
| SCD Pre-Pouch Sealing (μV/K) | SCD Post-Pouch Sealing (μV/K) | |
|---|---|---|
| Parameter 1 (Conventional Sealing) | 10 | 5 |
| Parameter 2 (Soft Sealing) | 7 | 7 |
Table 3.
The SCD pre- and post-electrode drying.
| SCD Pre-Electrode Drying (μV/K) | SCD Post-Electrode Drying (μV/K) | |
|---|---|---|
| Parameter 1 (Conventional Drying) | 5 | 0.2 |
| Parameter 2 (Soft Drying) | 9 | 10 |
Disclaimer/Publisher’s Note: The statements, opinions and data contained in all publications are solely those of the individual author(s) and contributor(s) and not of MDPI and/or the editor(s). MDPI and/or the editor(s) disclaim responsibility for any injury to people or property resulting from any ideas, methods, instructions or products referred to in the content. |
© 2024 by the authors. Licensee MDPI, Basel, Switzerland. This article is an open access article distributed under the terms and conditions of the Creative Commons Attribution (CC BY) license (https://creativecommons.org/licenses/by/4.0/).
Share and Cite
MDPI and ACS Style
Talplacido, N.C.; Cumming, D.J. Printed Carbon Black Thermocouple as an In Situ Thermal Sensor for Lithium-Ion Cell. Batteries 2024, 10, 78. https://doi.org/10.3390/batteries10030078
AMA Style
Talplacido NC, Cumming DJ. Printed Carbon Black Thermocouple as an In Situ Thermal Sensor for Lithium-Ion Cell. Batteries. 2024; 10(3):78. https://doi.org/10.3390/batteries10030078
Chicago/Turabian StyleTalplacido, Nikko Cano, and Denis J. Cumming. 2024. "Printed Carbon Black Thermocouple as an In Situ Thermal Sensor for Lithium-Ion Cell" Batteries 10, no. 3: 78. https://doi.org/10.3390/batteries10030078
Note that from the first issue of 2016, this journal uses article numbers instead of page numbers. See further details here.