
Assessing the Correlation between Land Cover Conversion and Temporal Climate Change—A Pilot Study in Coastal Mediterranean City, Fethiye, Turkey

Abstract
:
1. Introduction
2. Study Area and Methodology
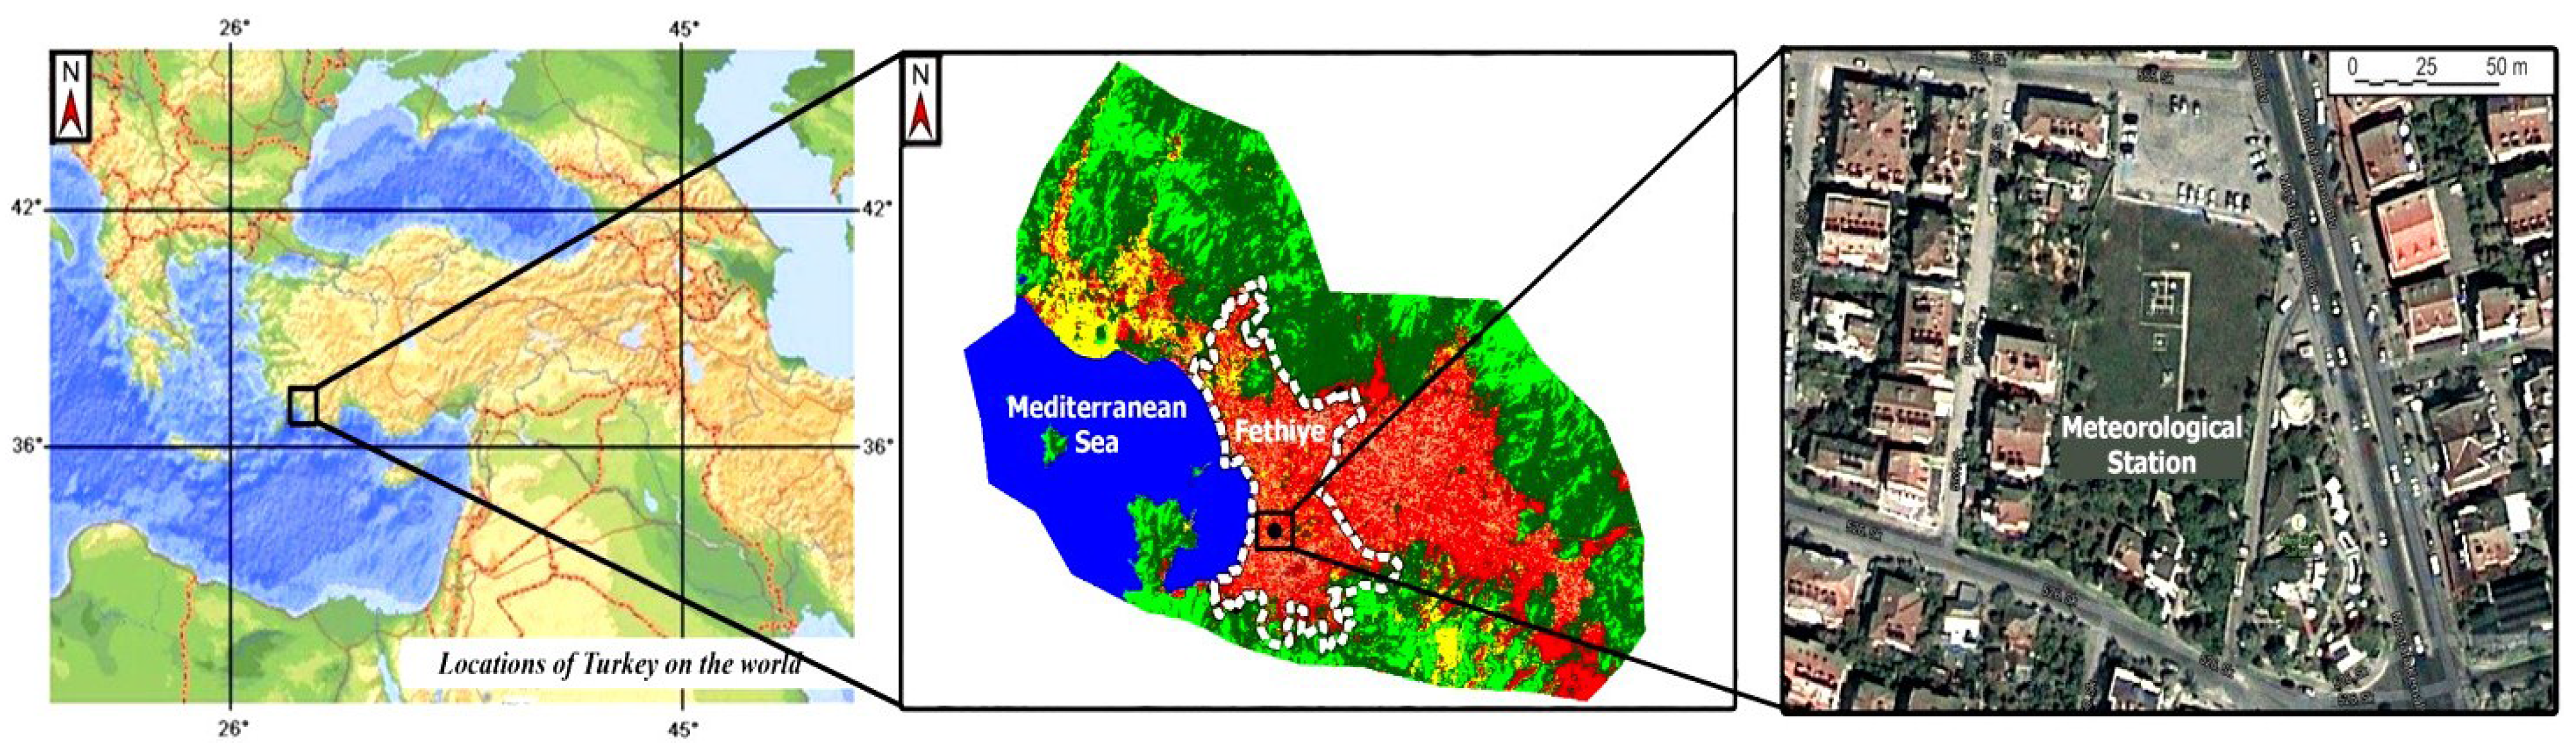
2.1. Study Area


2.2. Data and Methodology
3. Results and Discussion
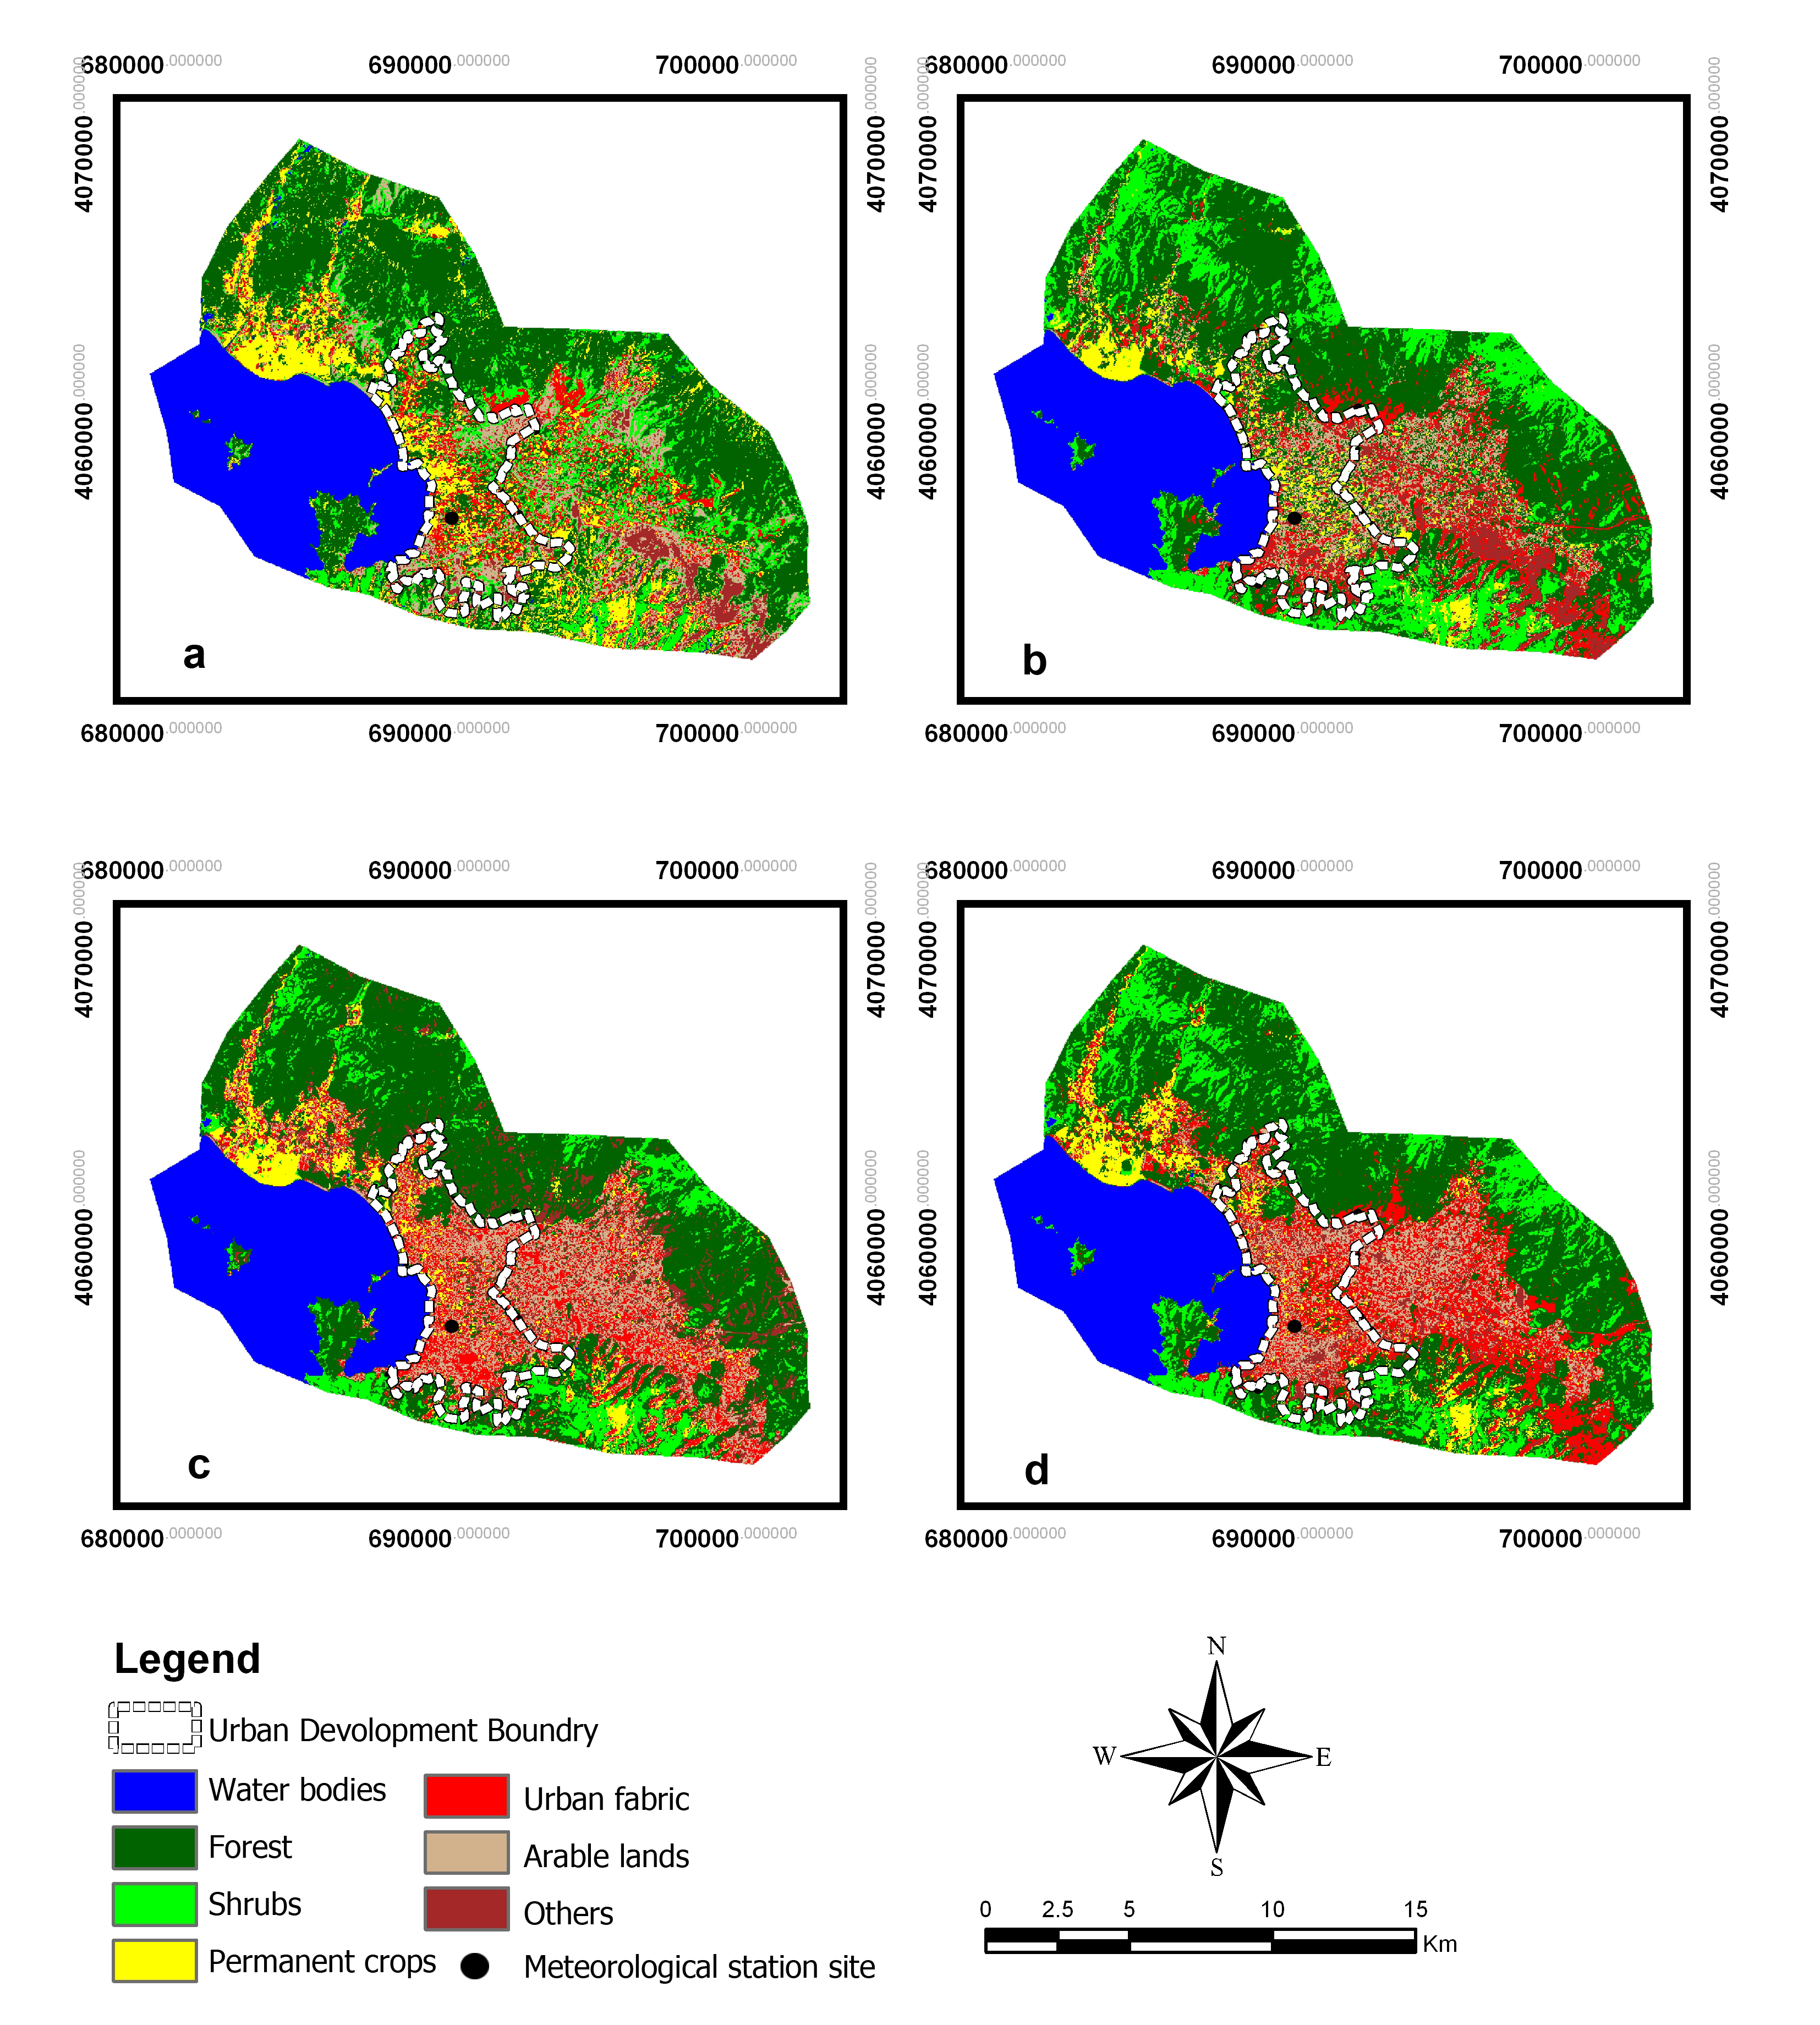
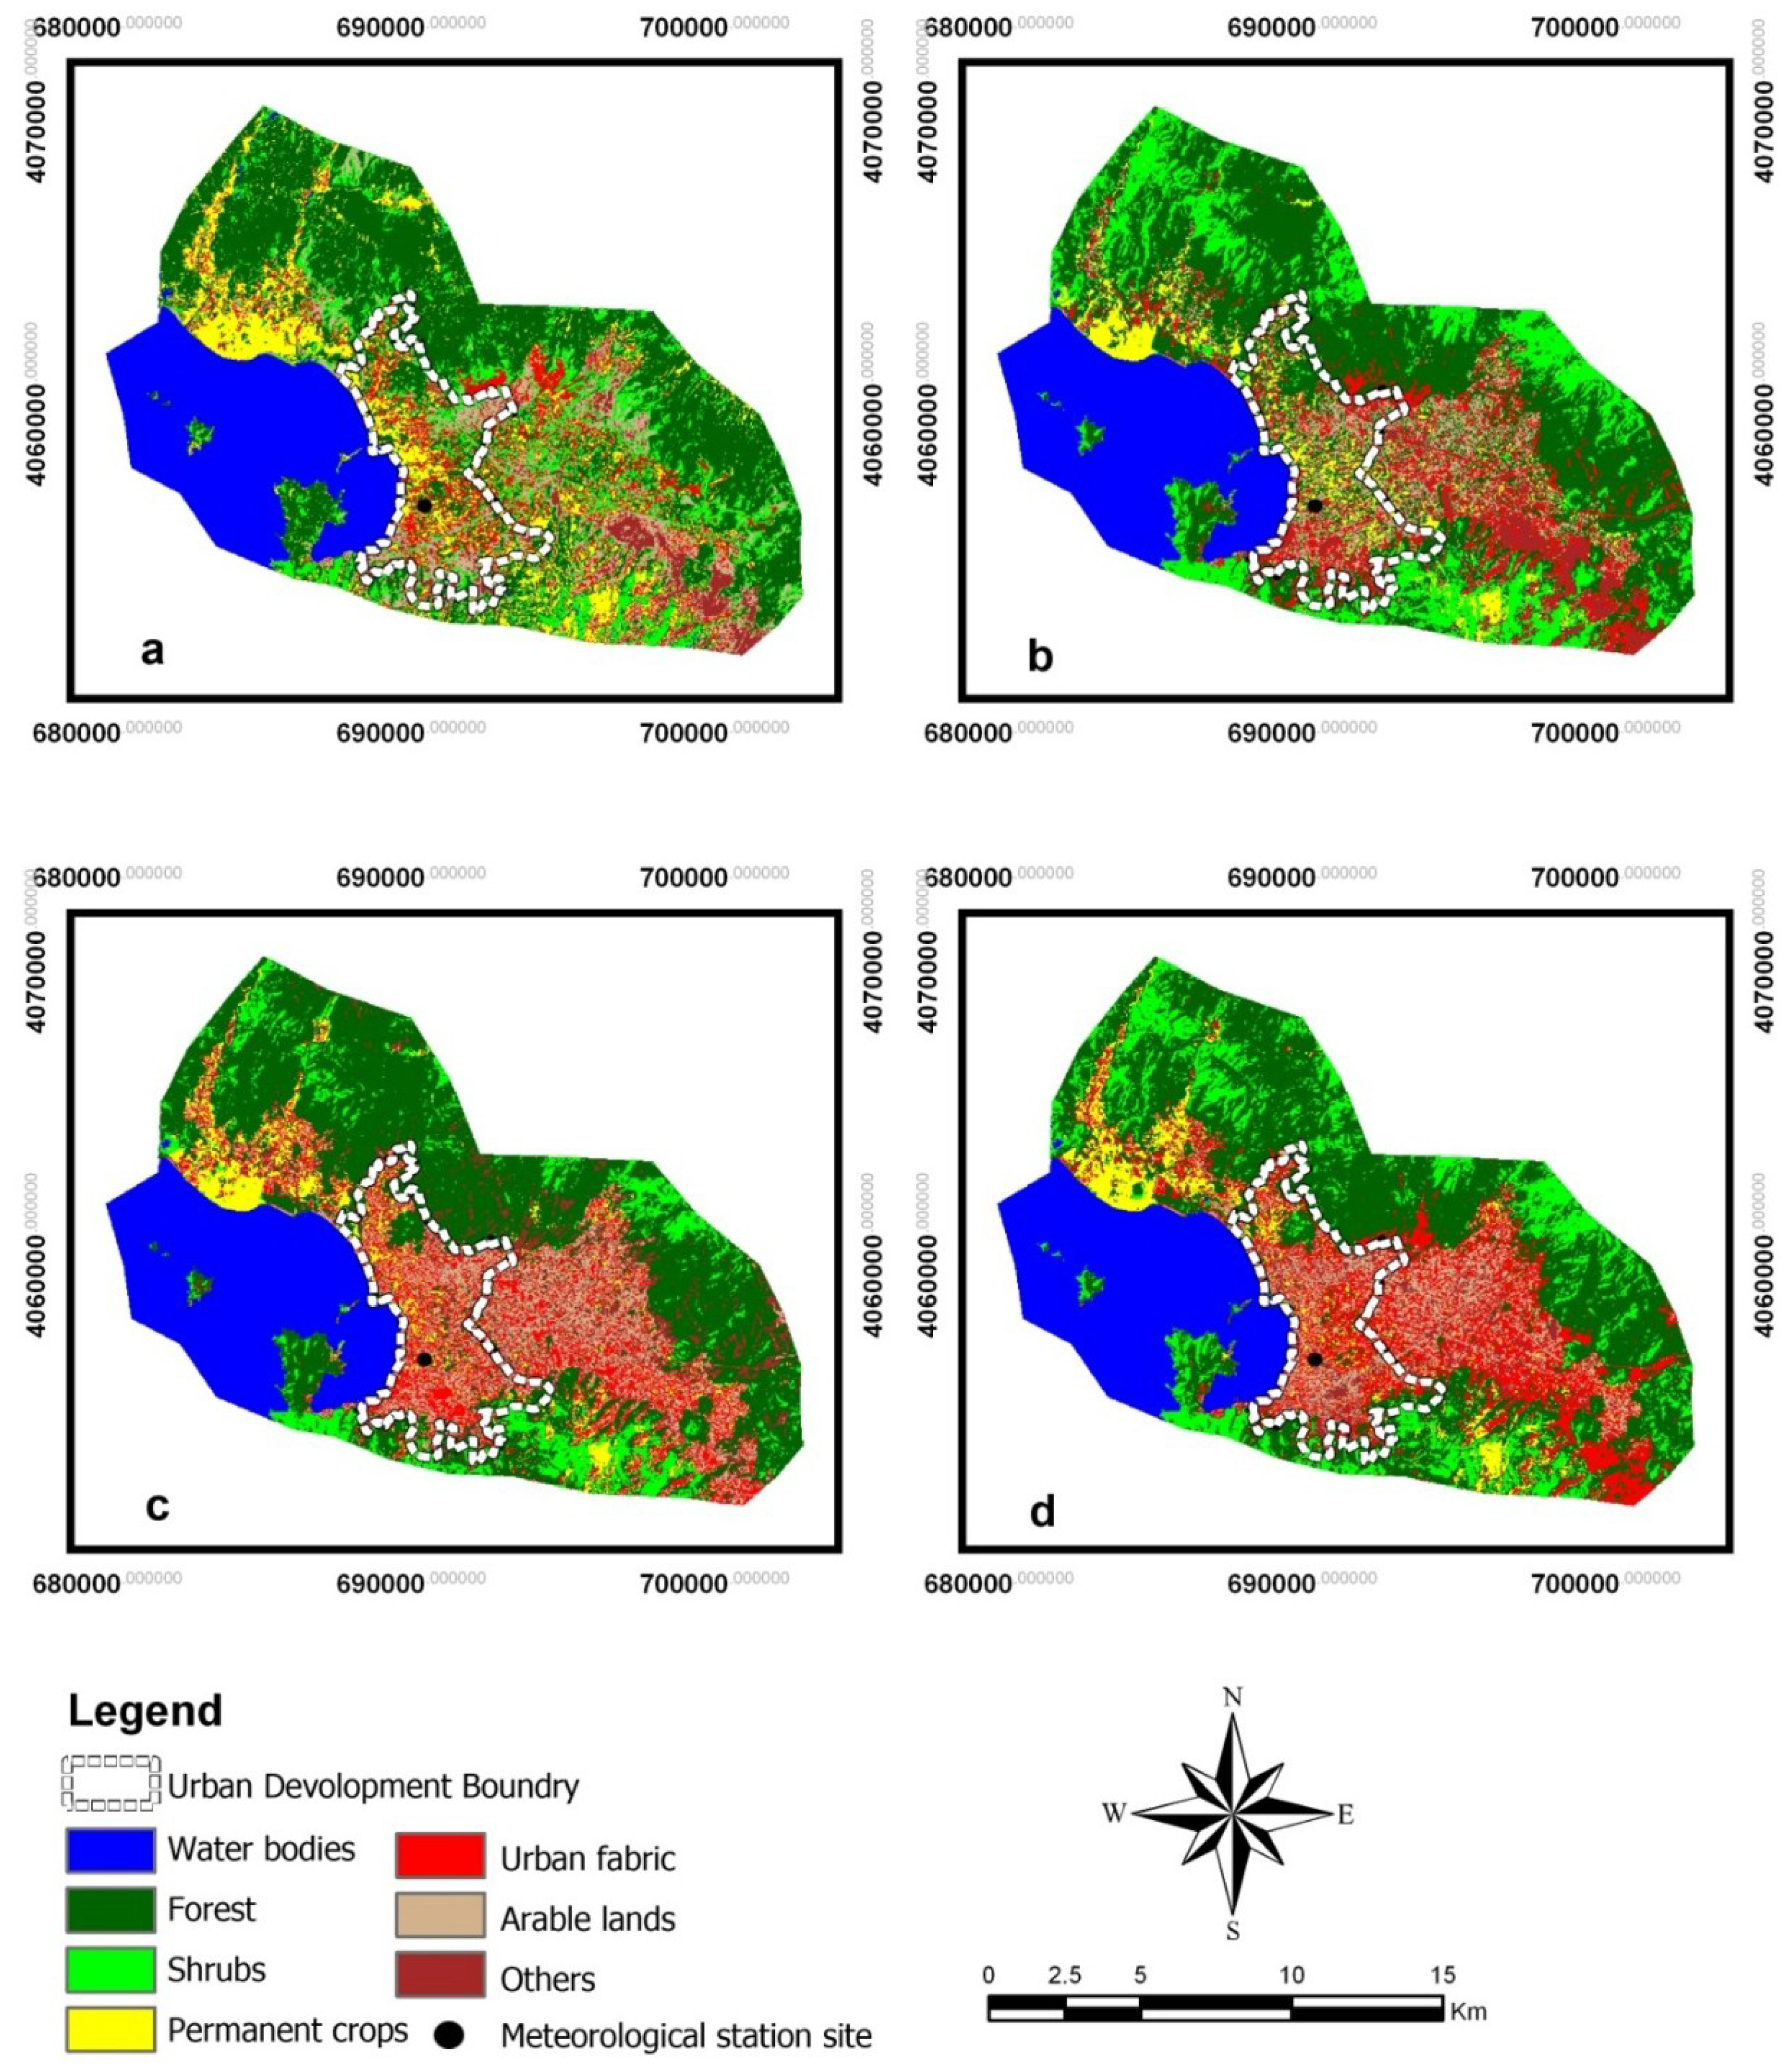
3.1. LULC Changes


| CORINE Land Cover Index | LULC (ha) | |||||||
|---|---|---|---|---|---|---|---|---|
| 1984 | 1984–1995 Change | 1995 | 1995–2003 Change | 2003 | 2003–2011 Change | 2011 | 1984–2011 Total Change | |
| Water bodies | 4718 | −83 | 4635 | +16 | 4651 | −17 | 4634 | −84 |
| Forest | 9543 | +838 | 10381 | −468 | 9913 | −373 | 9540 | −3 |
| Shrubs | 3113 | +604 | 3717 | −1799 | 1918 | +1093 | 3011 | −102 |
| Permanent crop | 2638 | −1456 | 1182 | +73 | 1255 | +22 | 1277 | −1361 |
| Urban fabric | 2018 | +112 | 2130 | +806 | 2936 | +918 | 3854 | +1836 |
| Arable lands | 2120 | −265 | 1855 | +821 | 2676 | −820 | 1856 | −264 |
| Others | 913 | +250 | 1163 | +551 | 1714 | −823 | 891 | −90 |

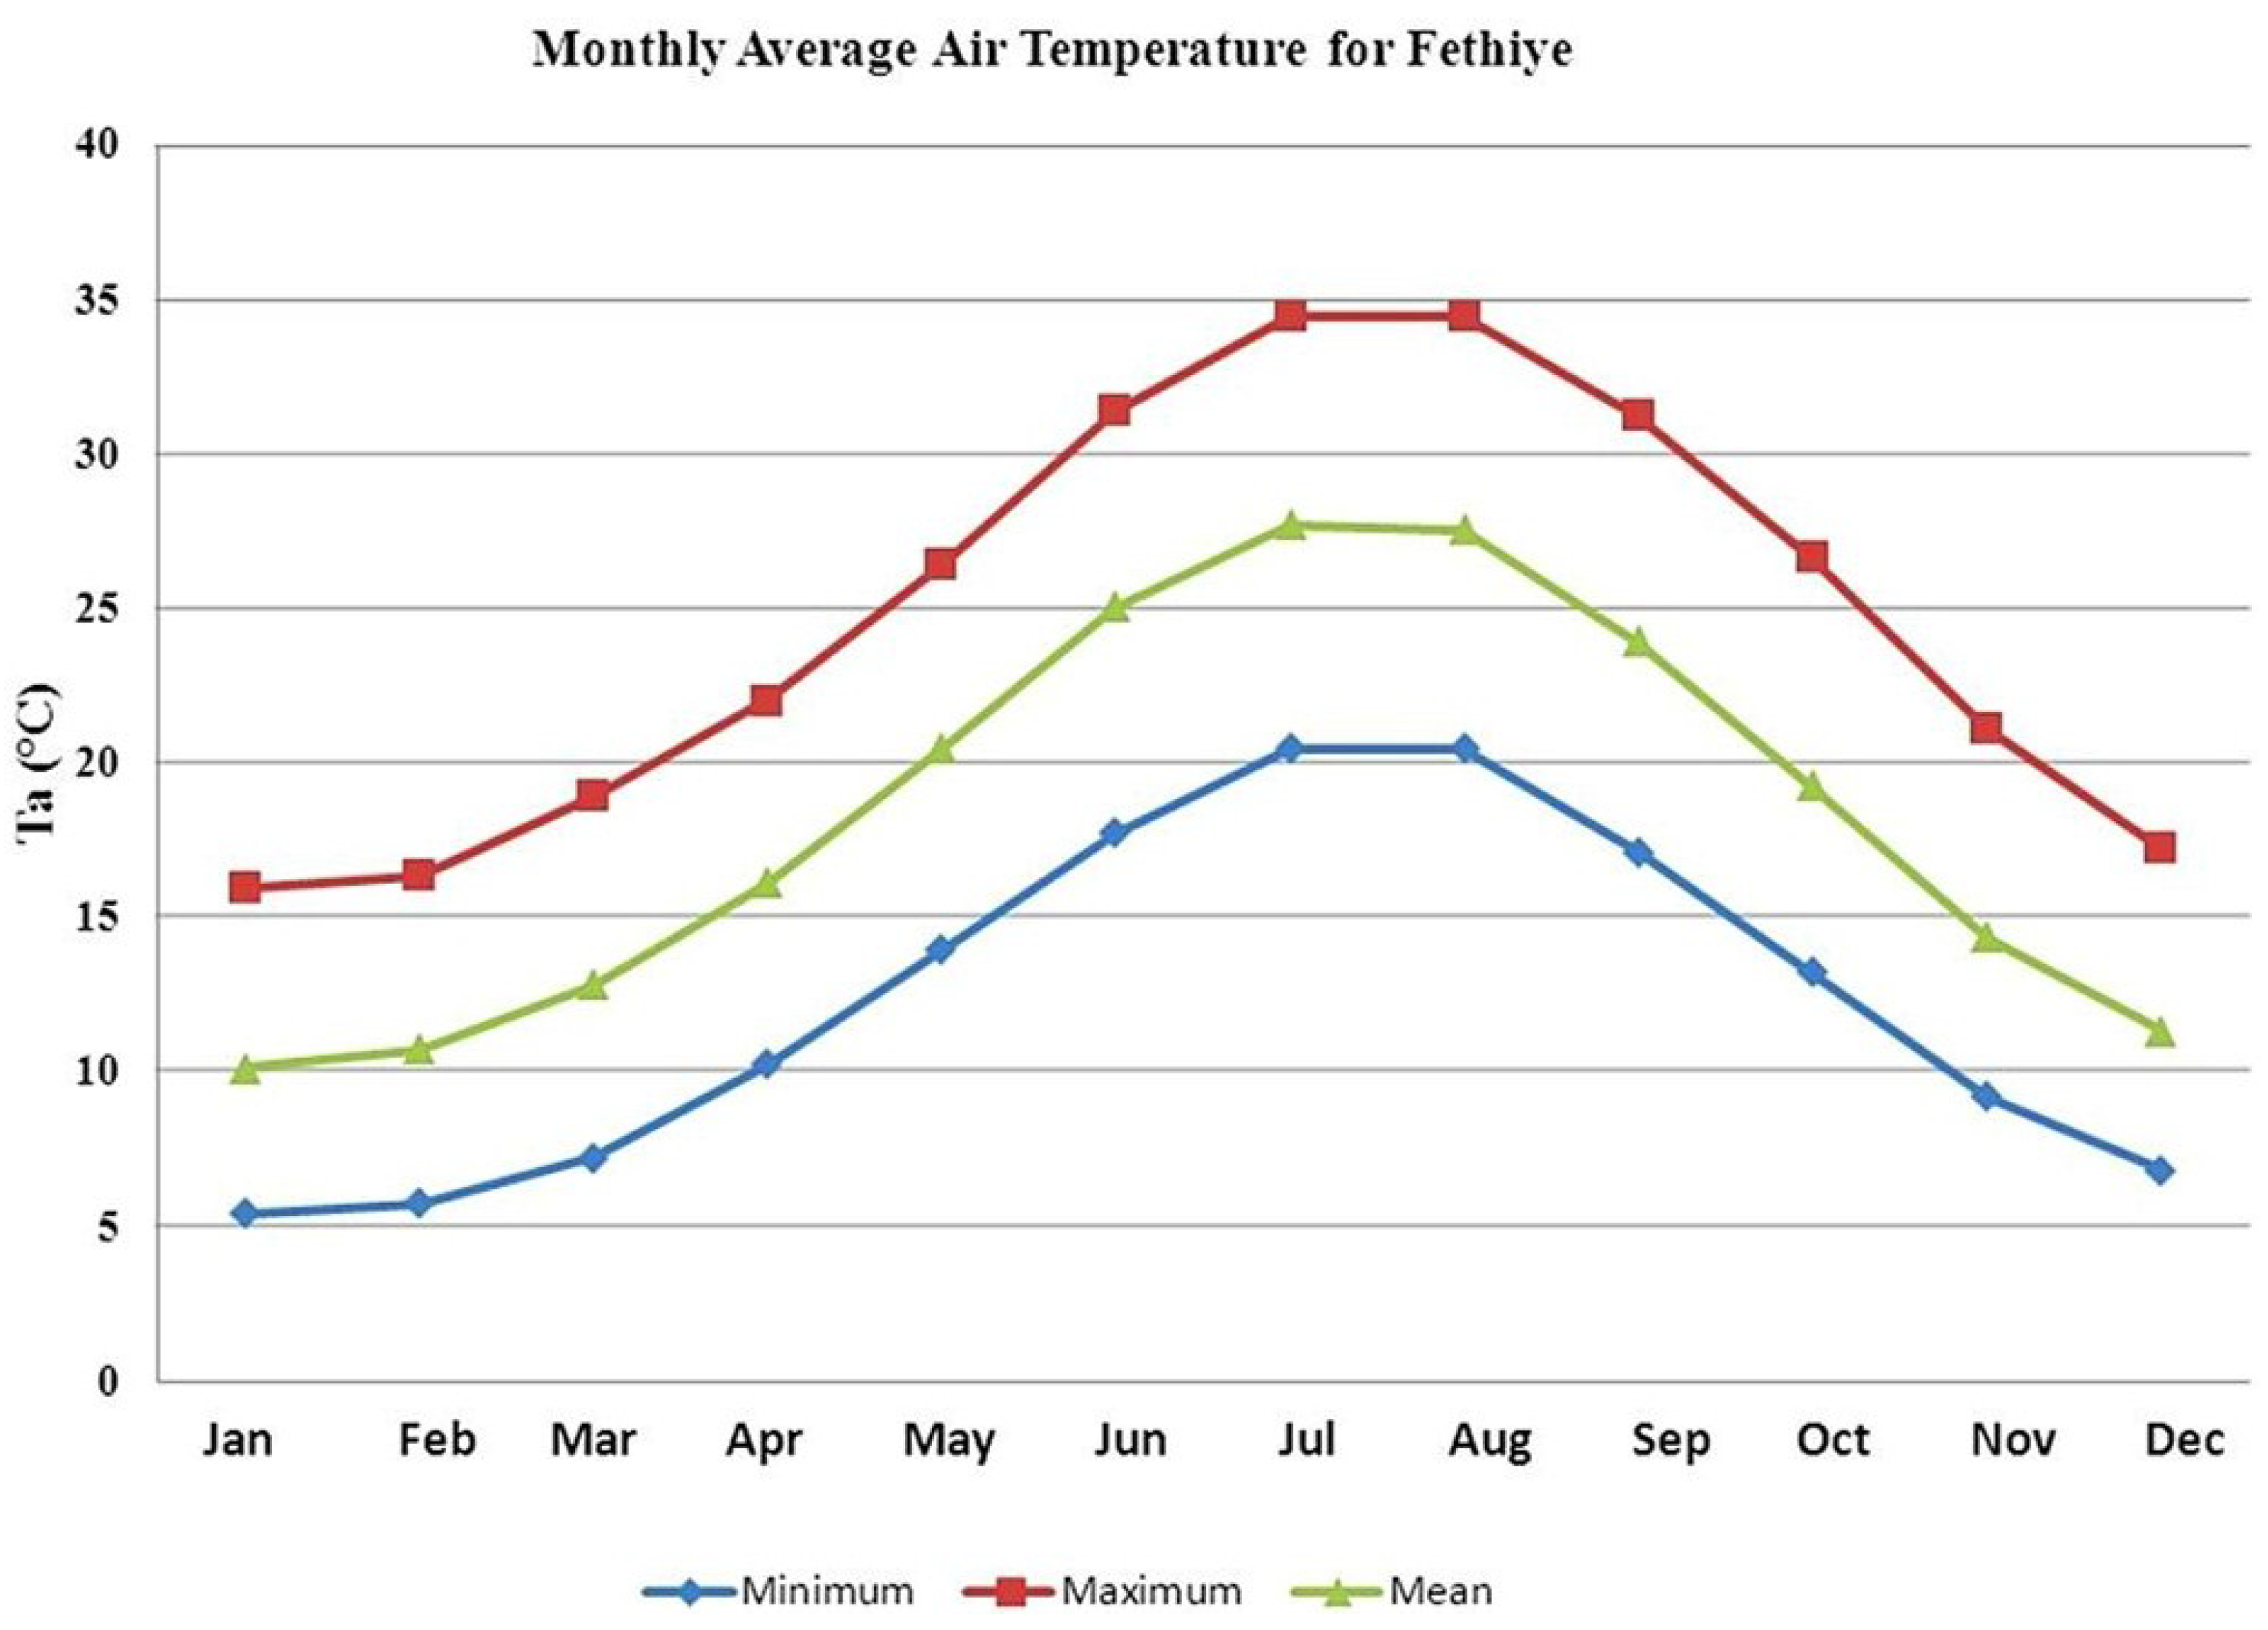
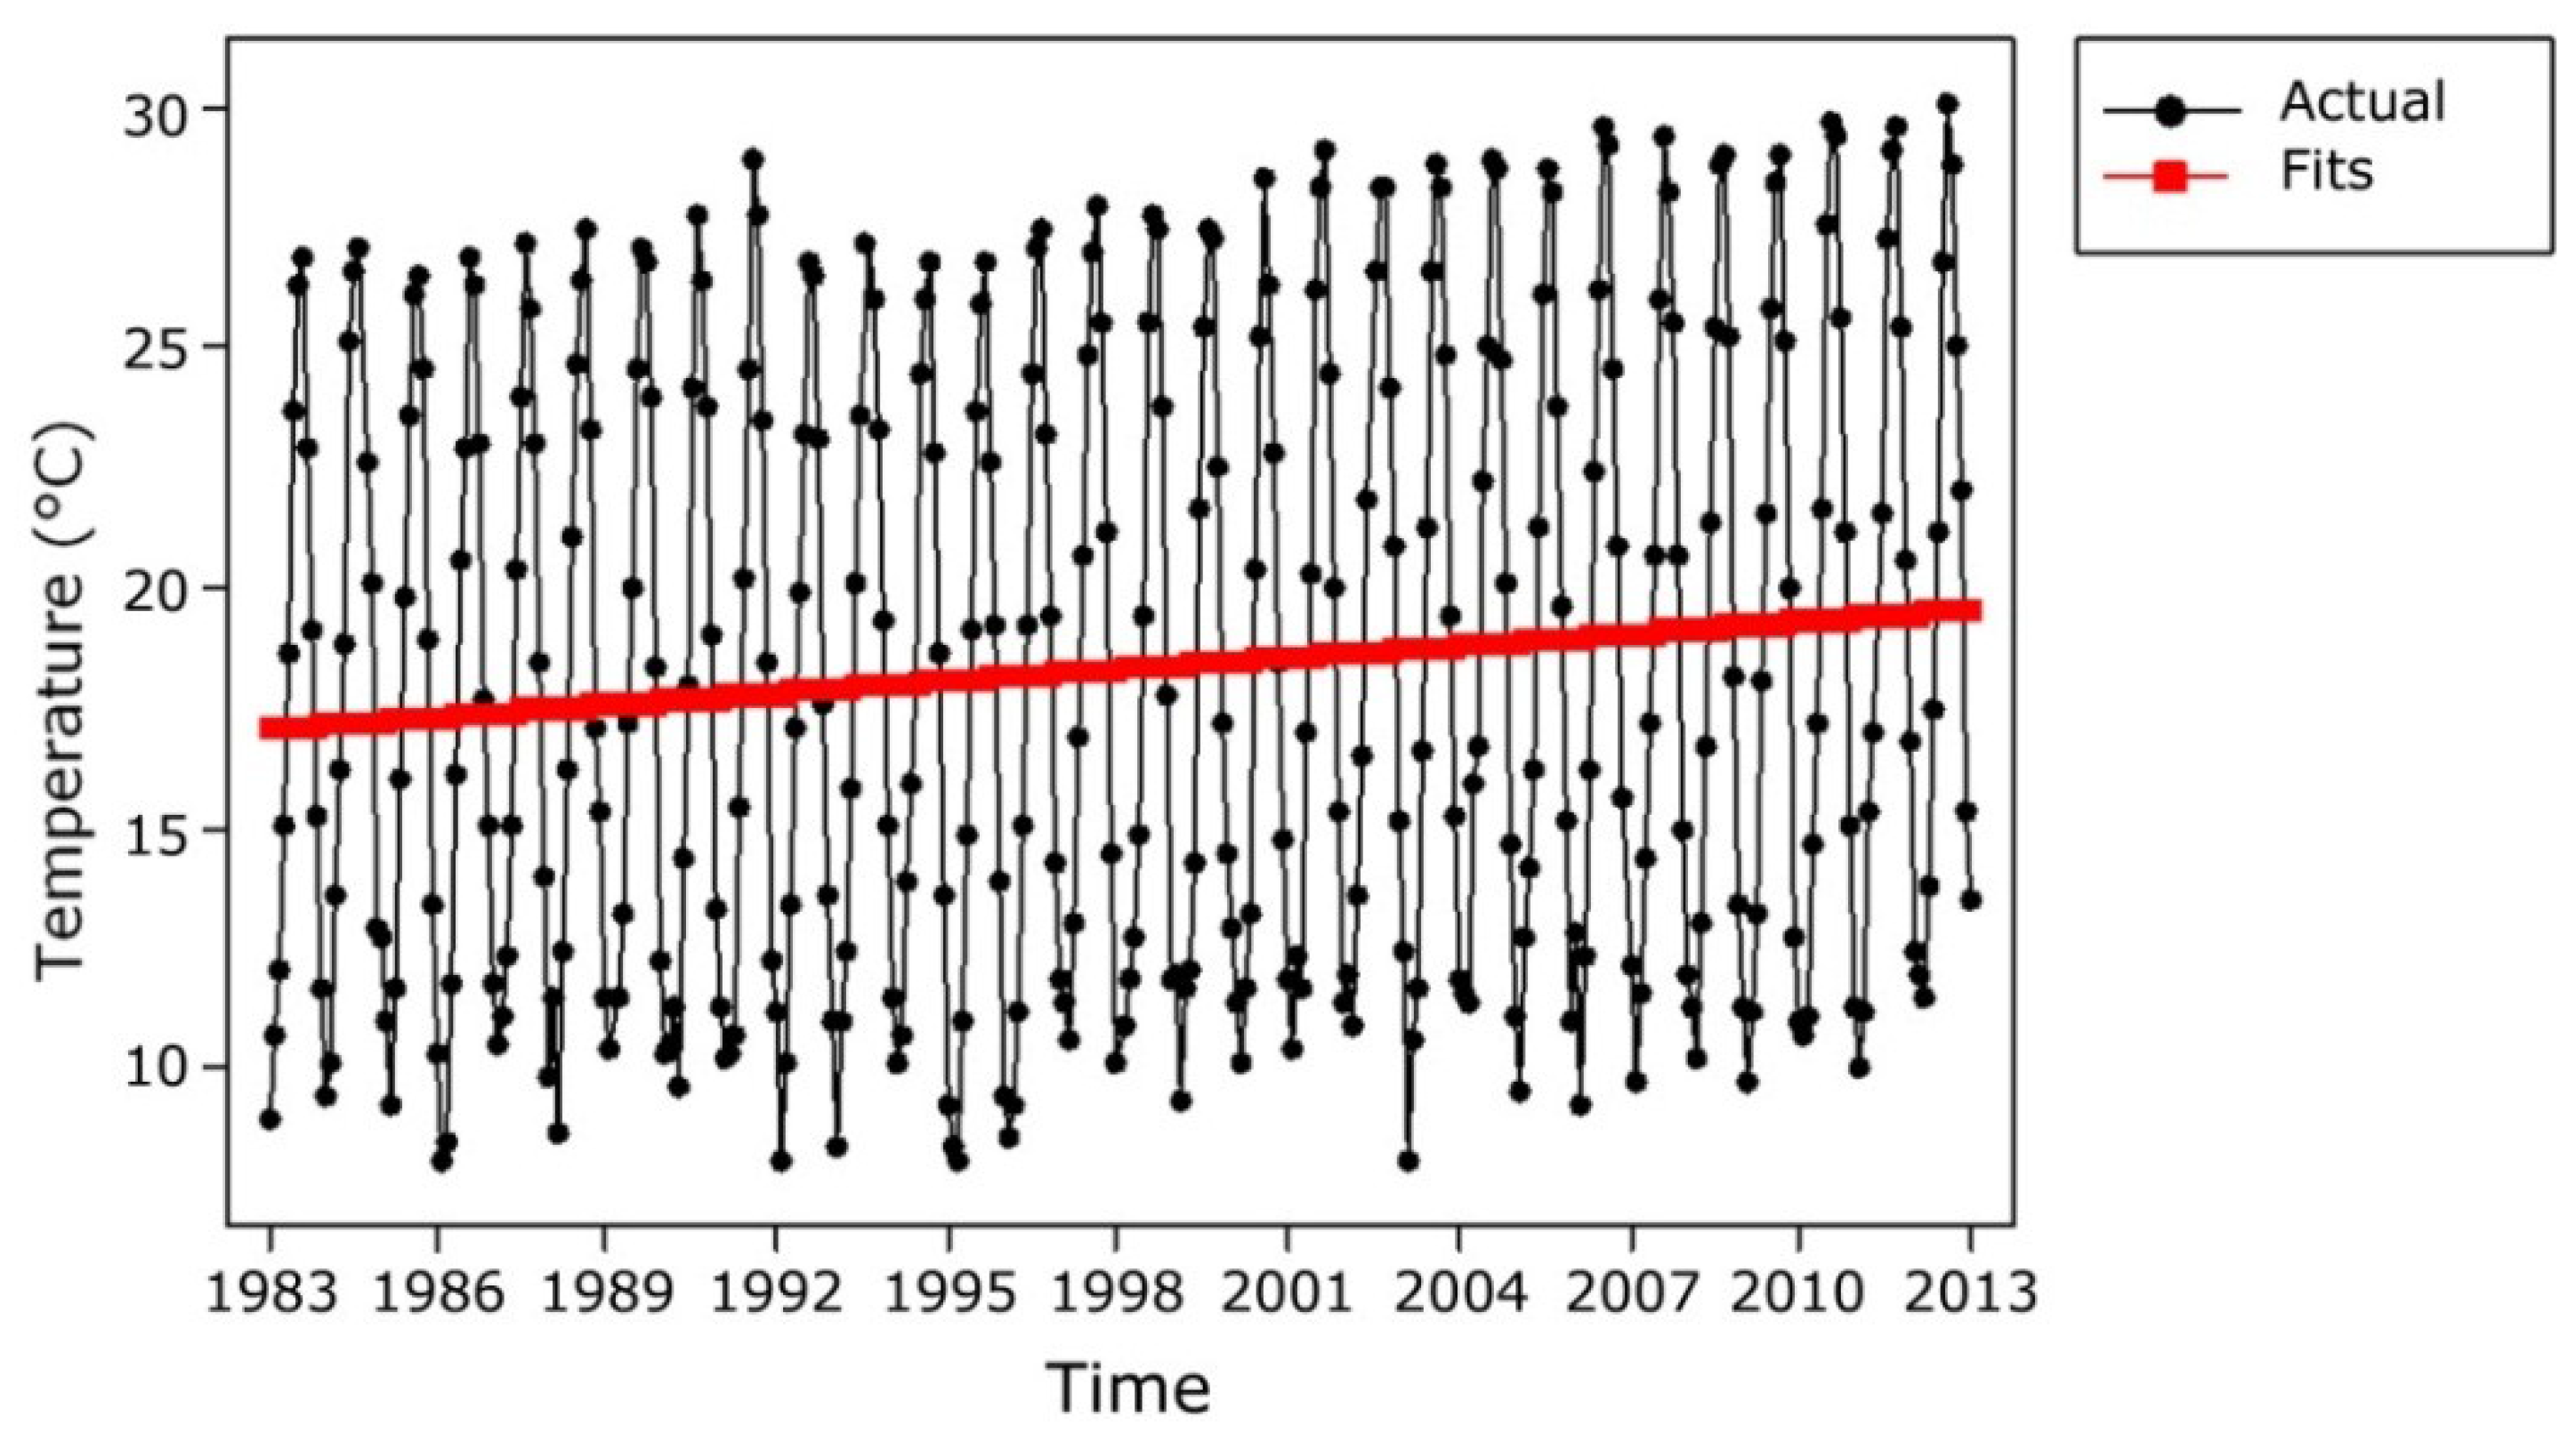
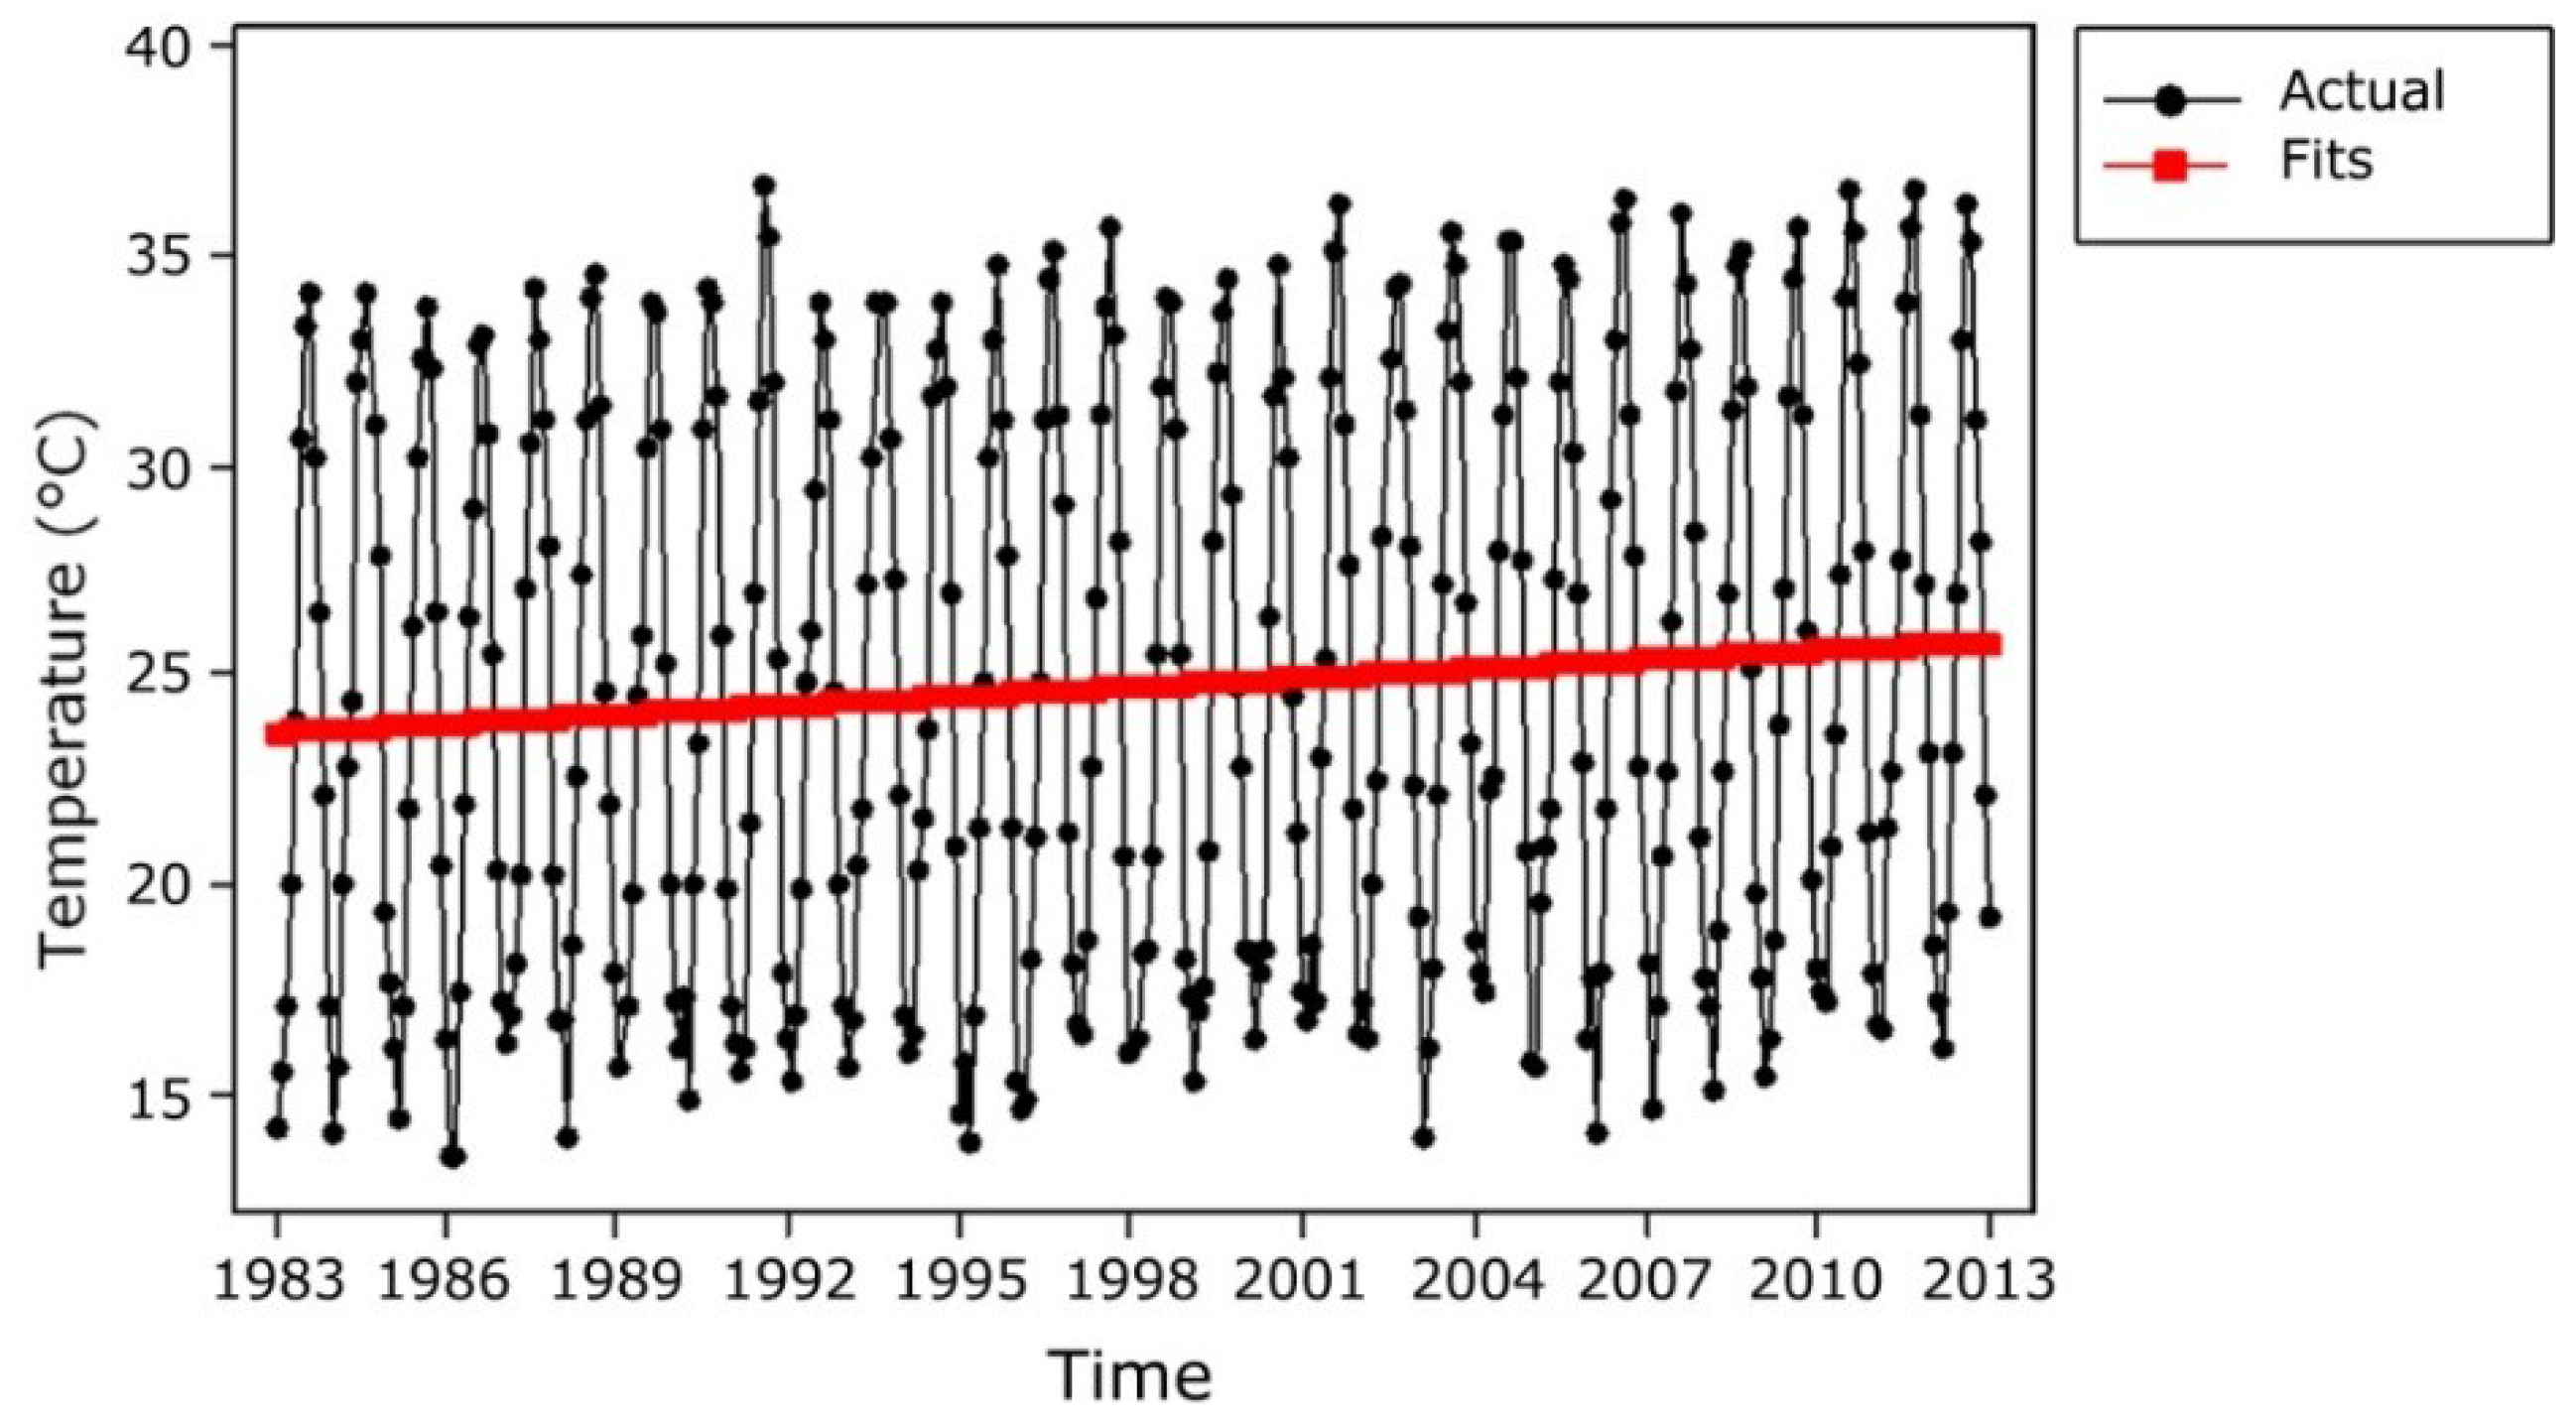
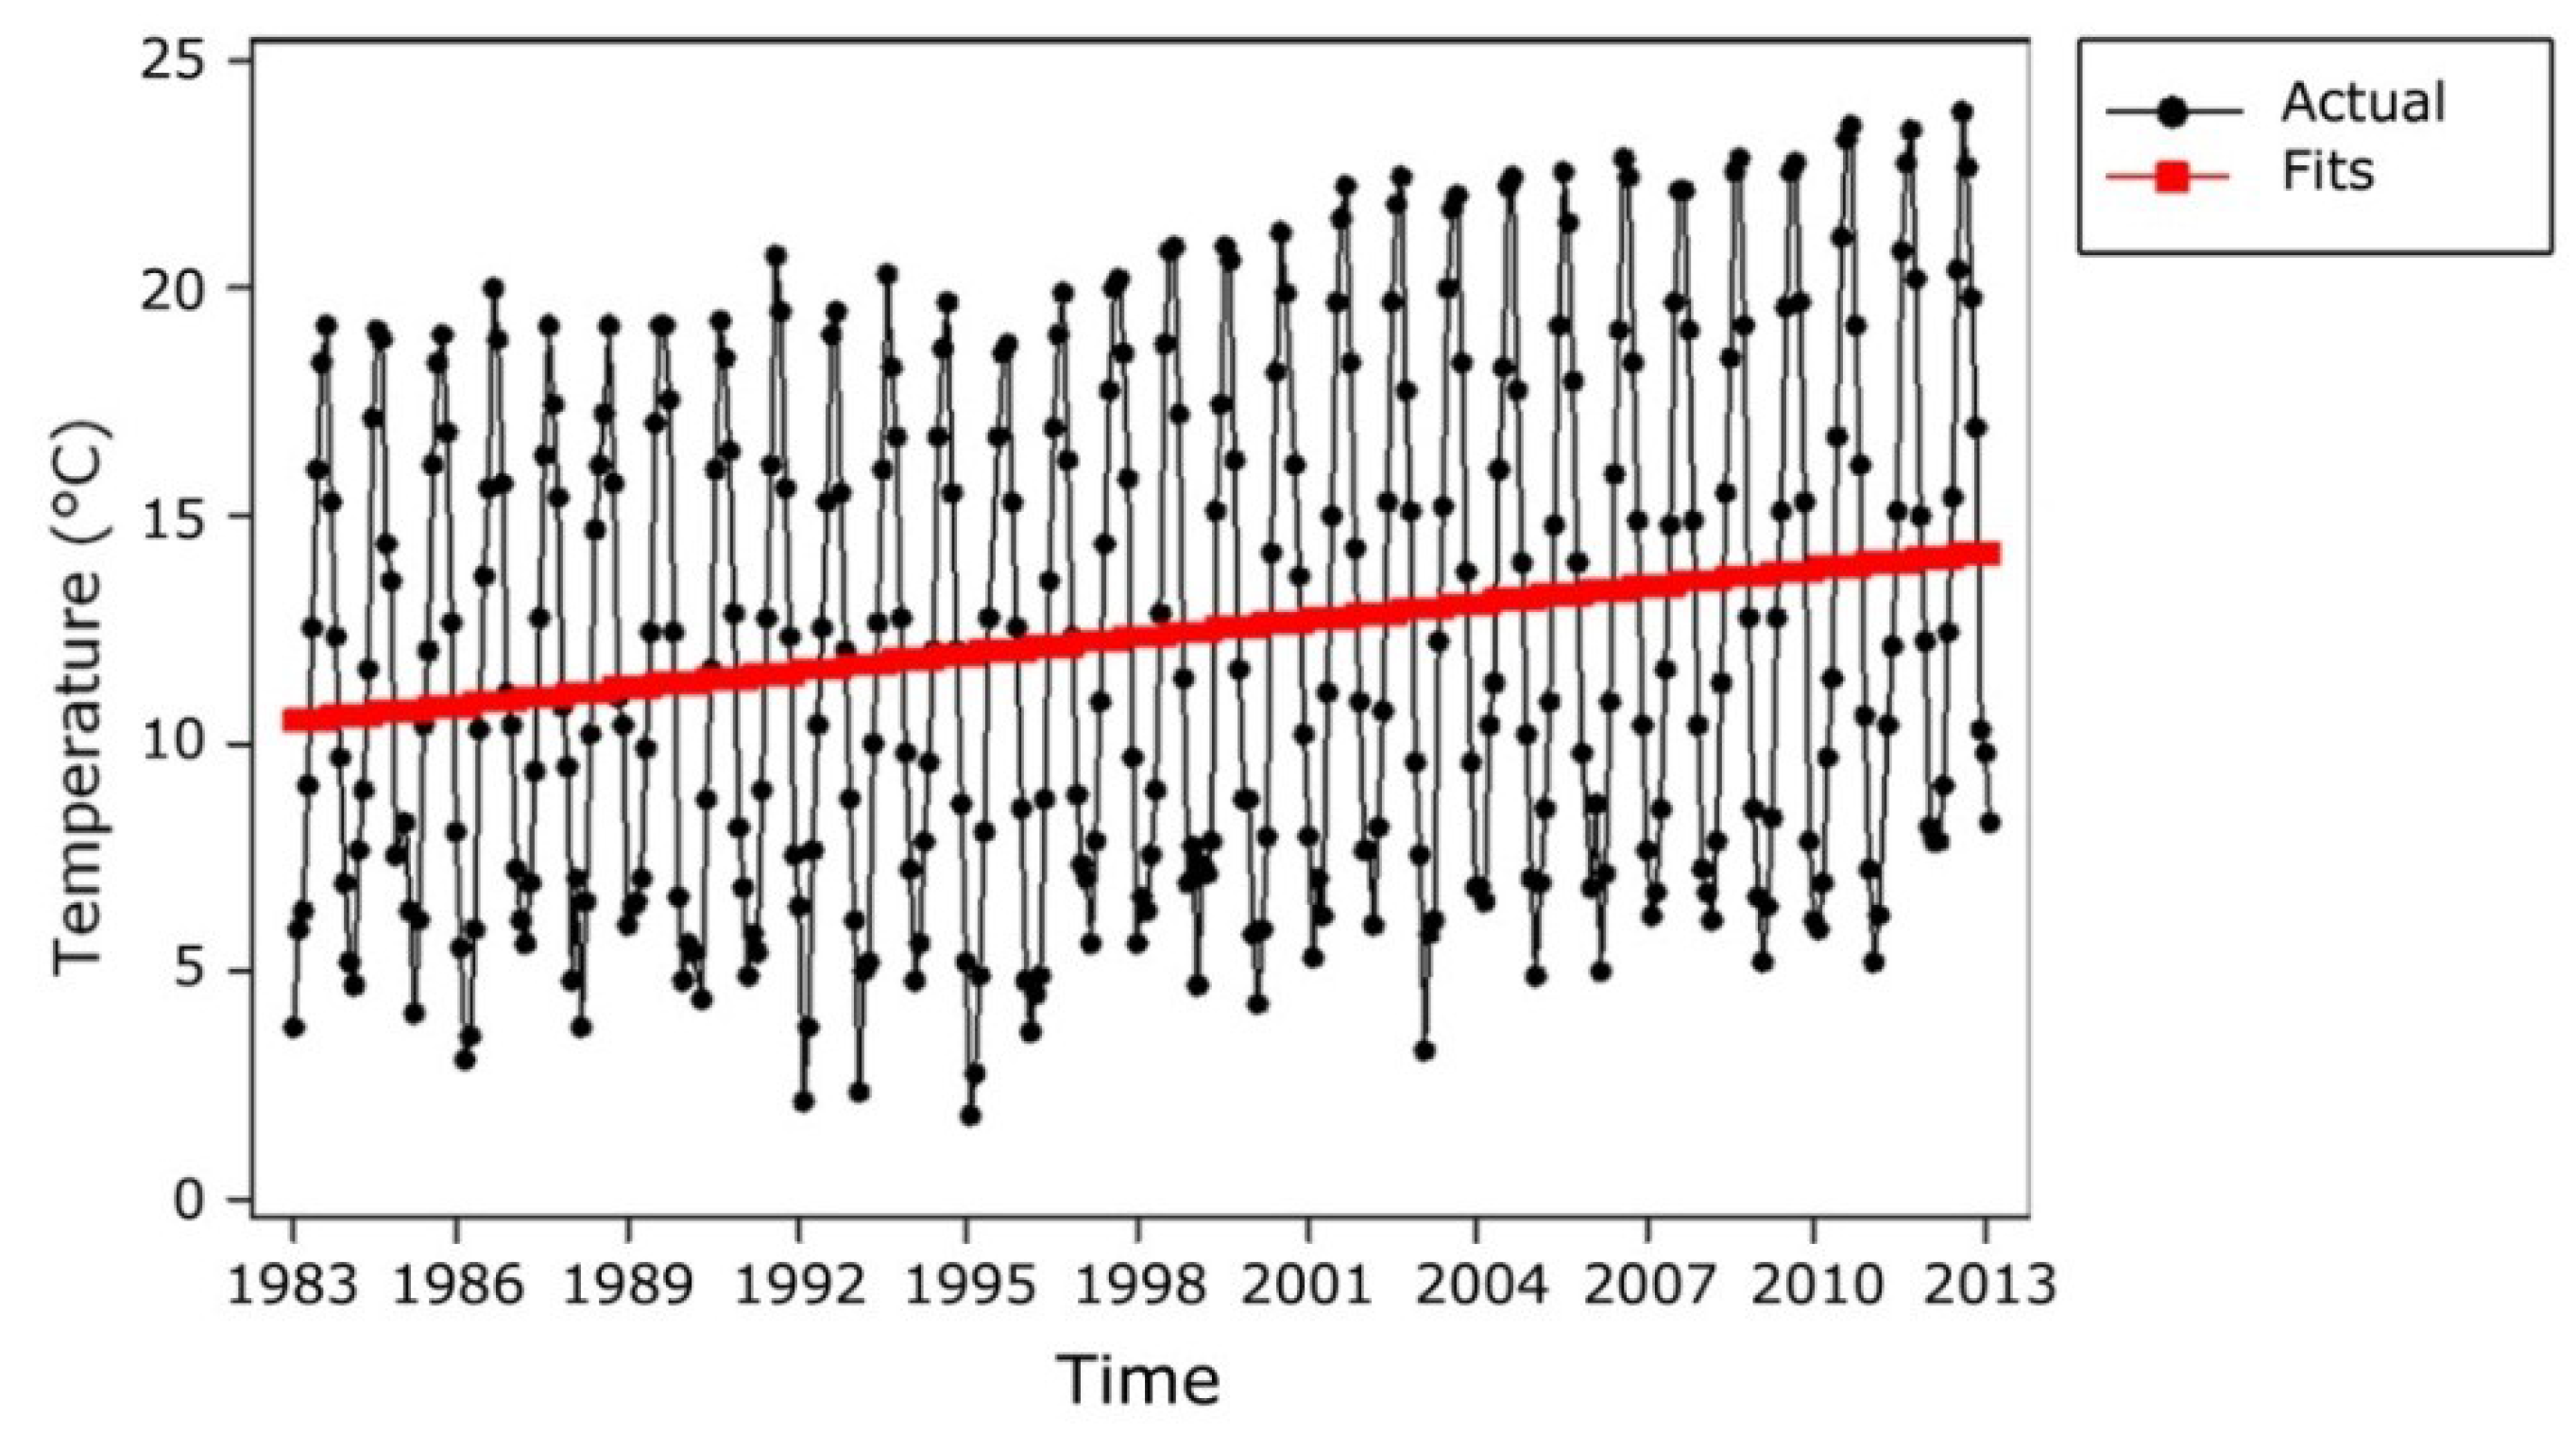
3.2. Trend Analysis of Decadal Air Temperature


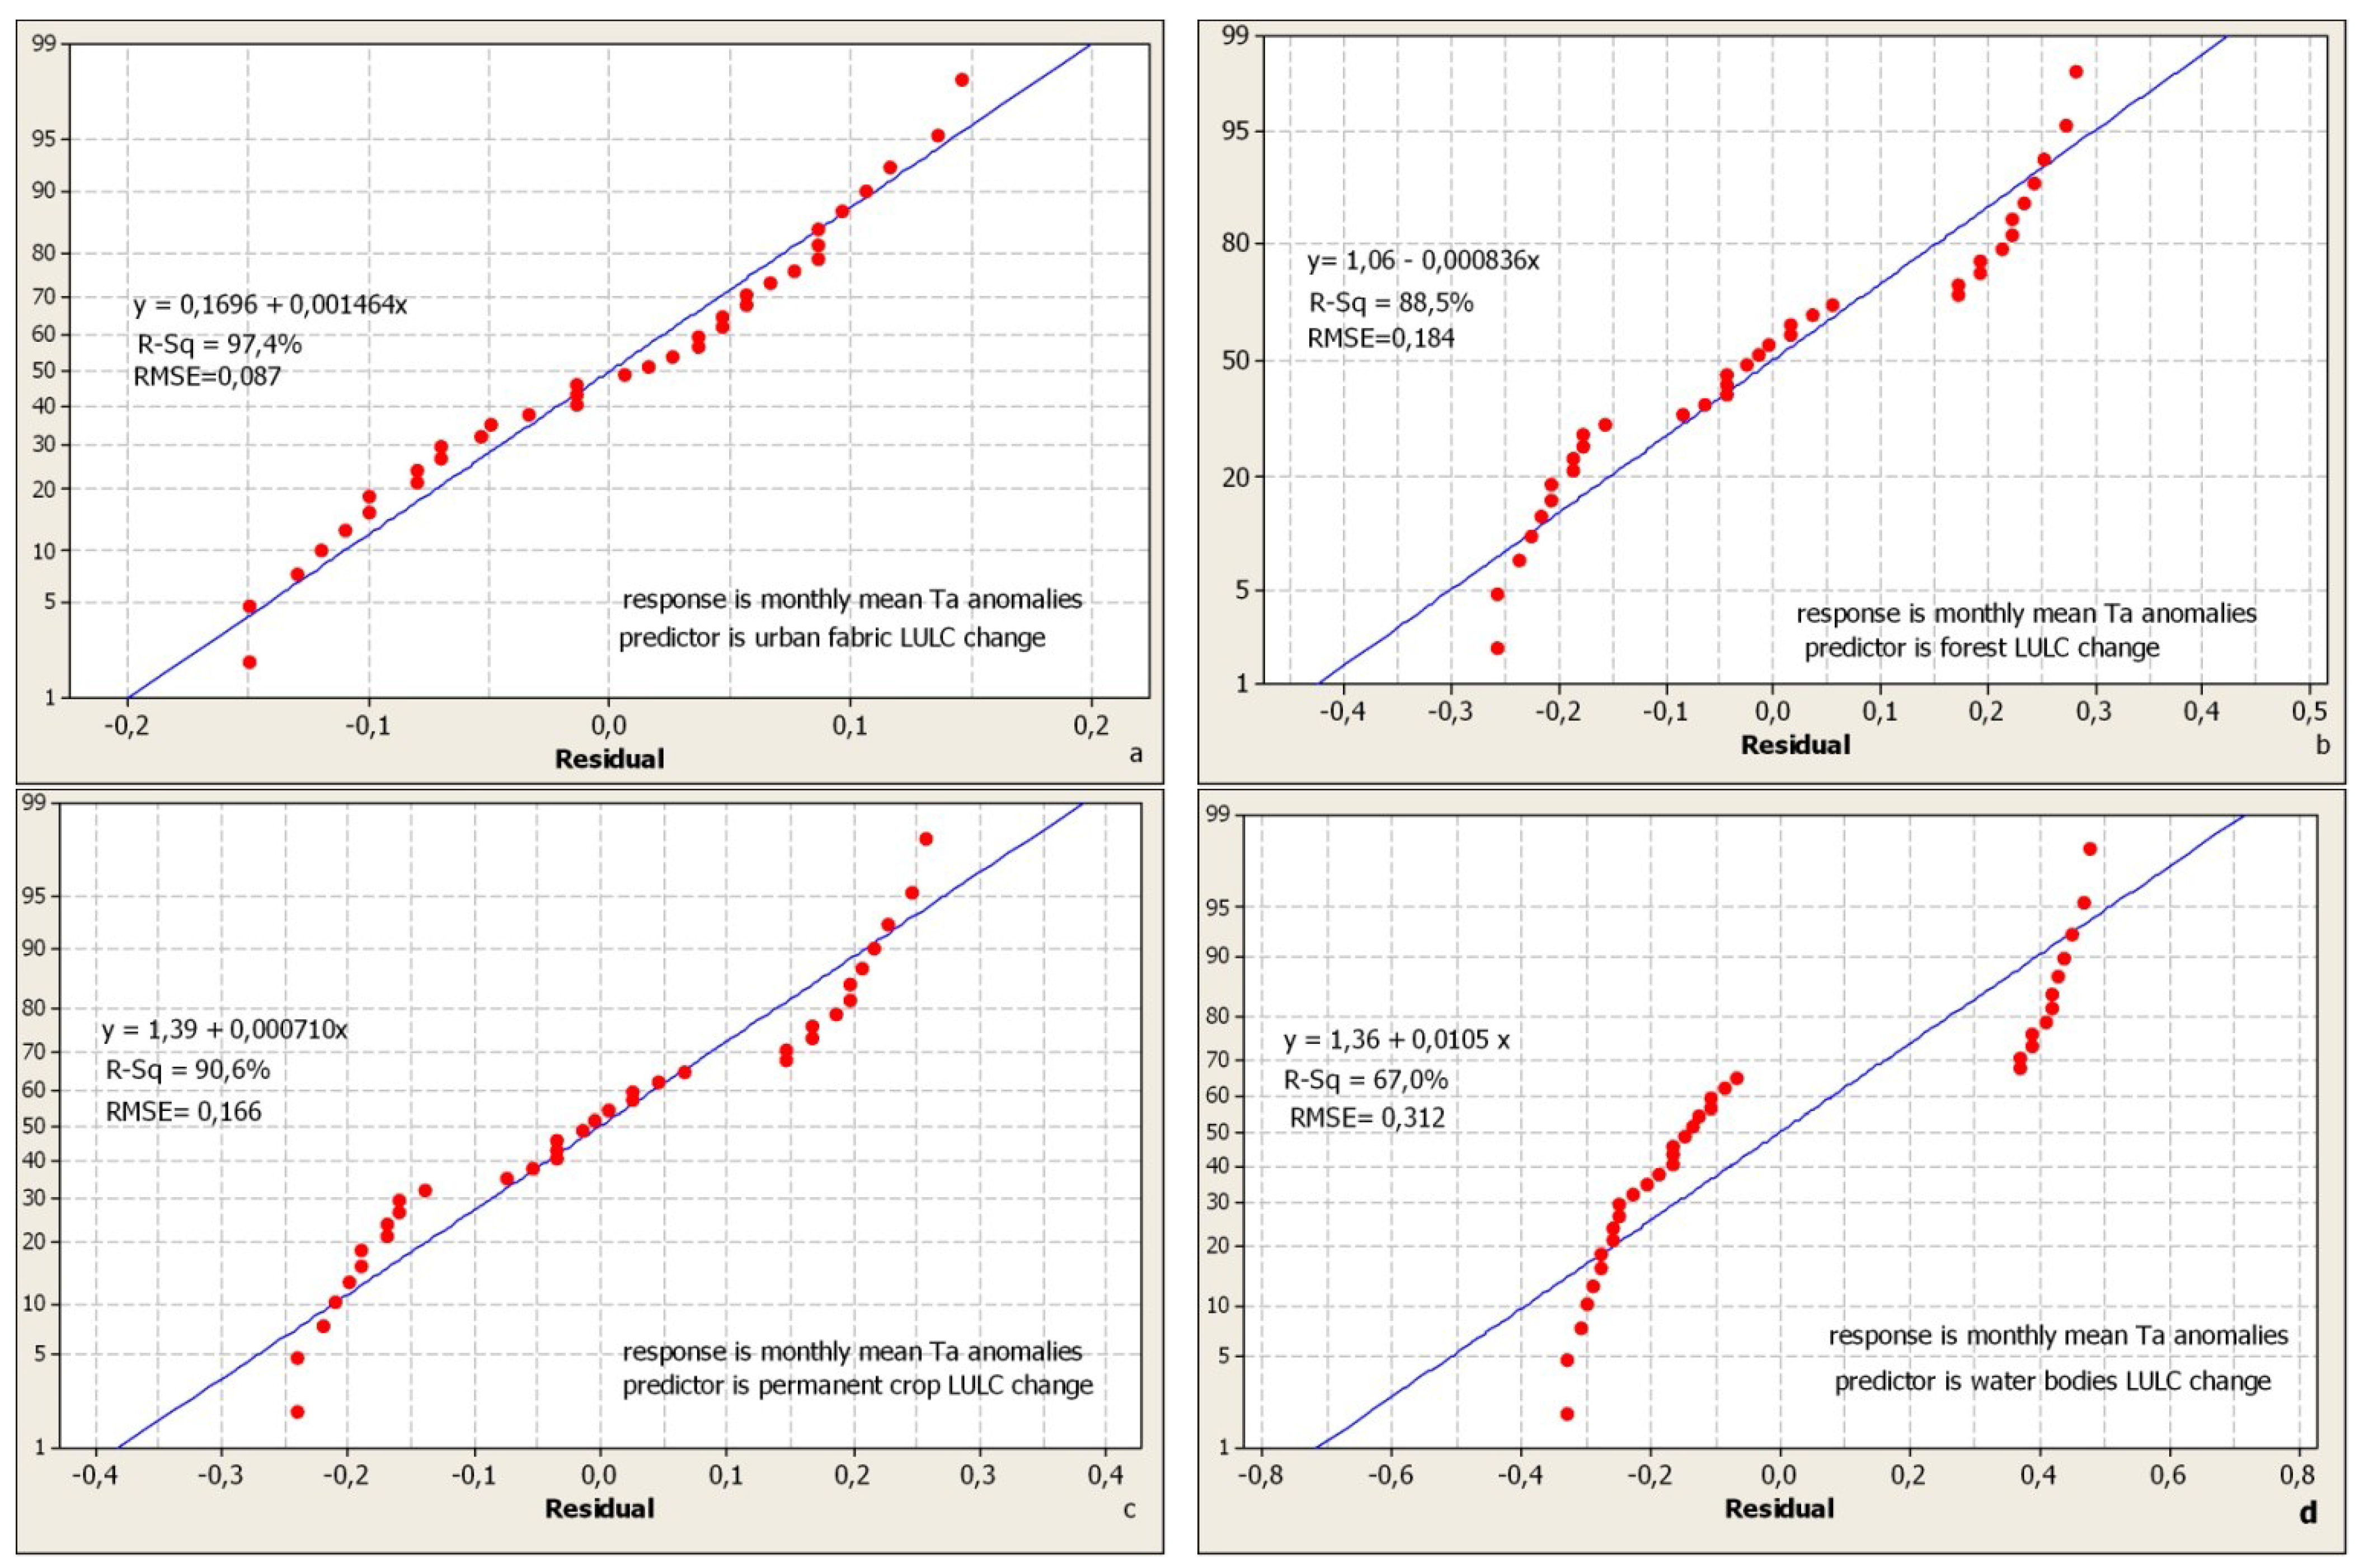
3.3. Regression Analysis of Air Temperature Anomalies and LULC Change Data
| Ta (°C) | Anomalies/Decades (°C) | ||
|---|---|---|---|
| 1983–1993 | 1993–2003 | 2003–2013 | |
| Monthly Mean Ta | 0.35 | 1.25 | 1.60 |
| Monthly Average of Maximum Ta | 0.46 | 0.90 | 1.36 |
| Monthly Average of Minimum Ta | 0.74 | 1.43 | 2.17 |
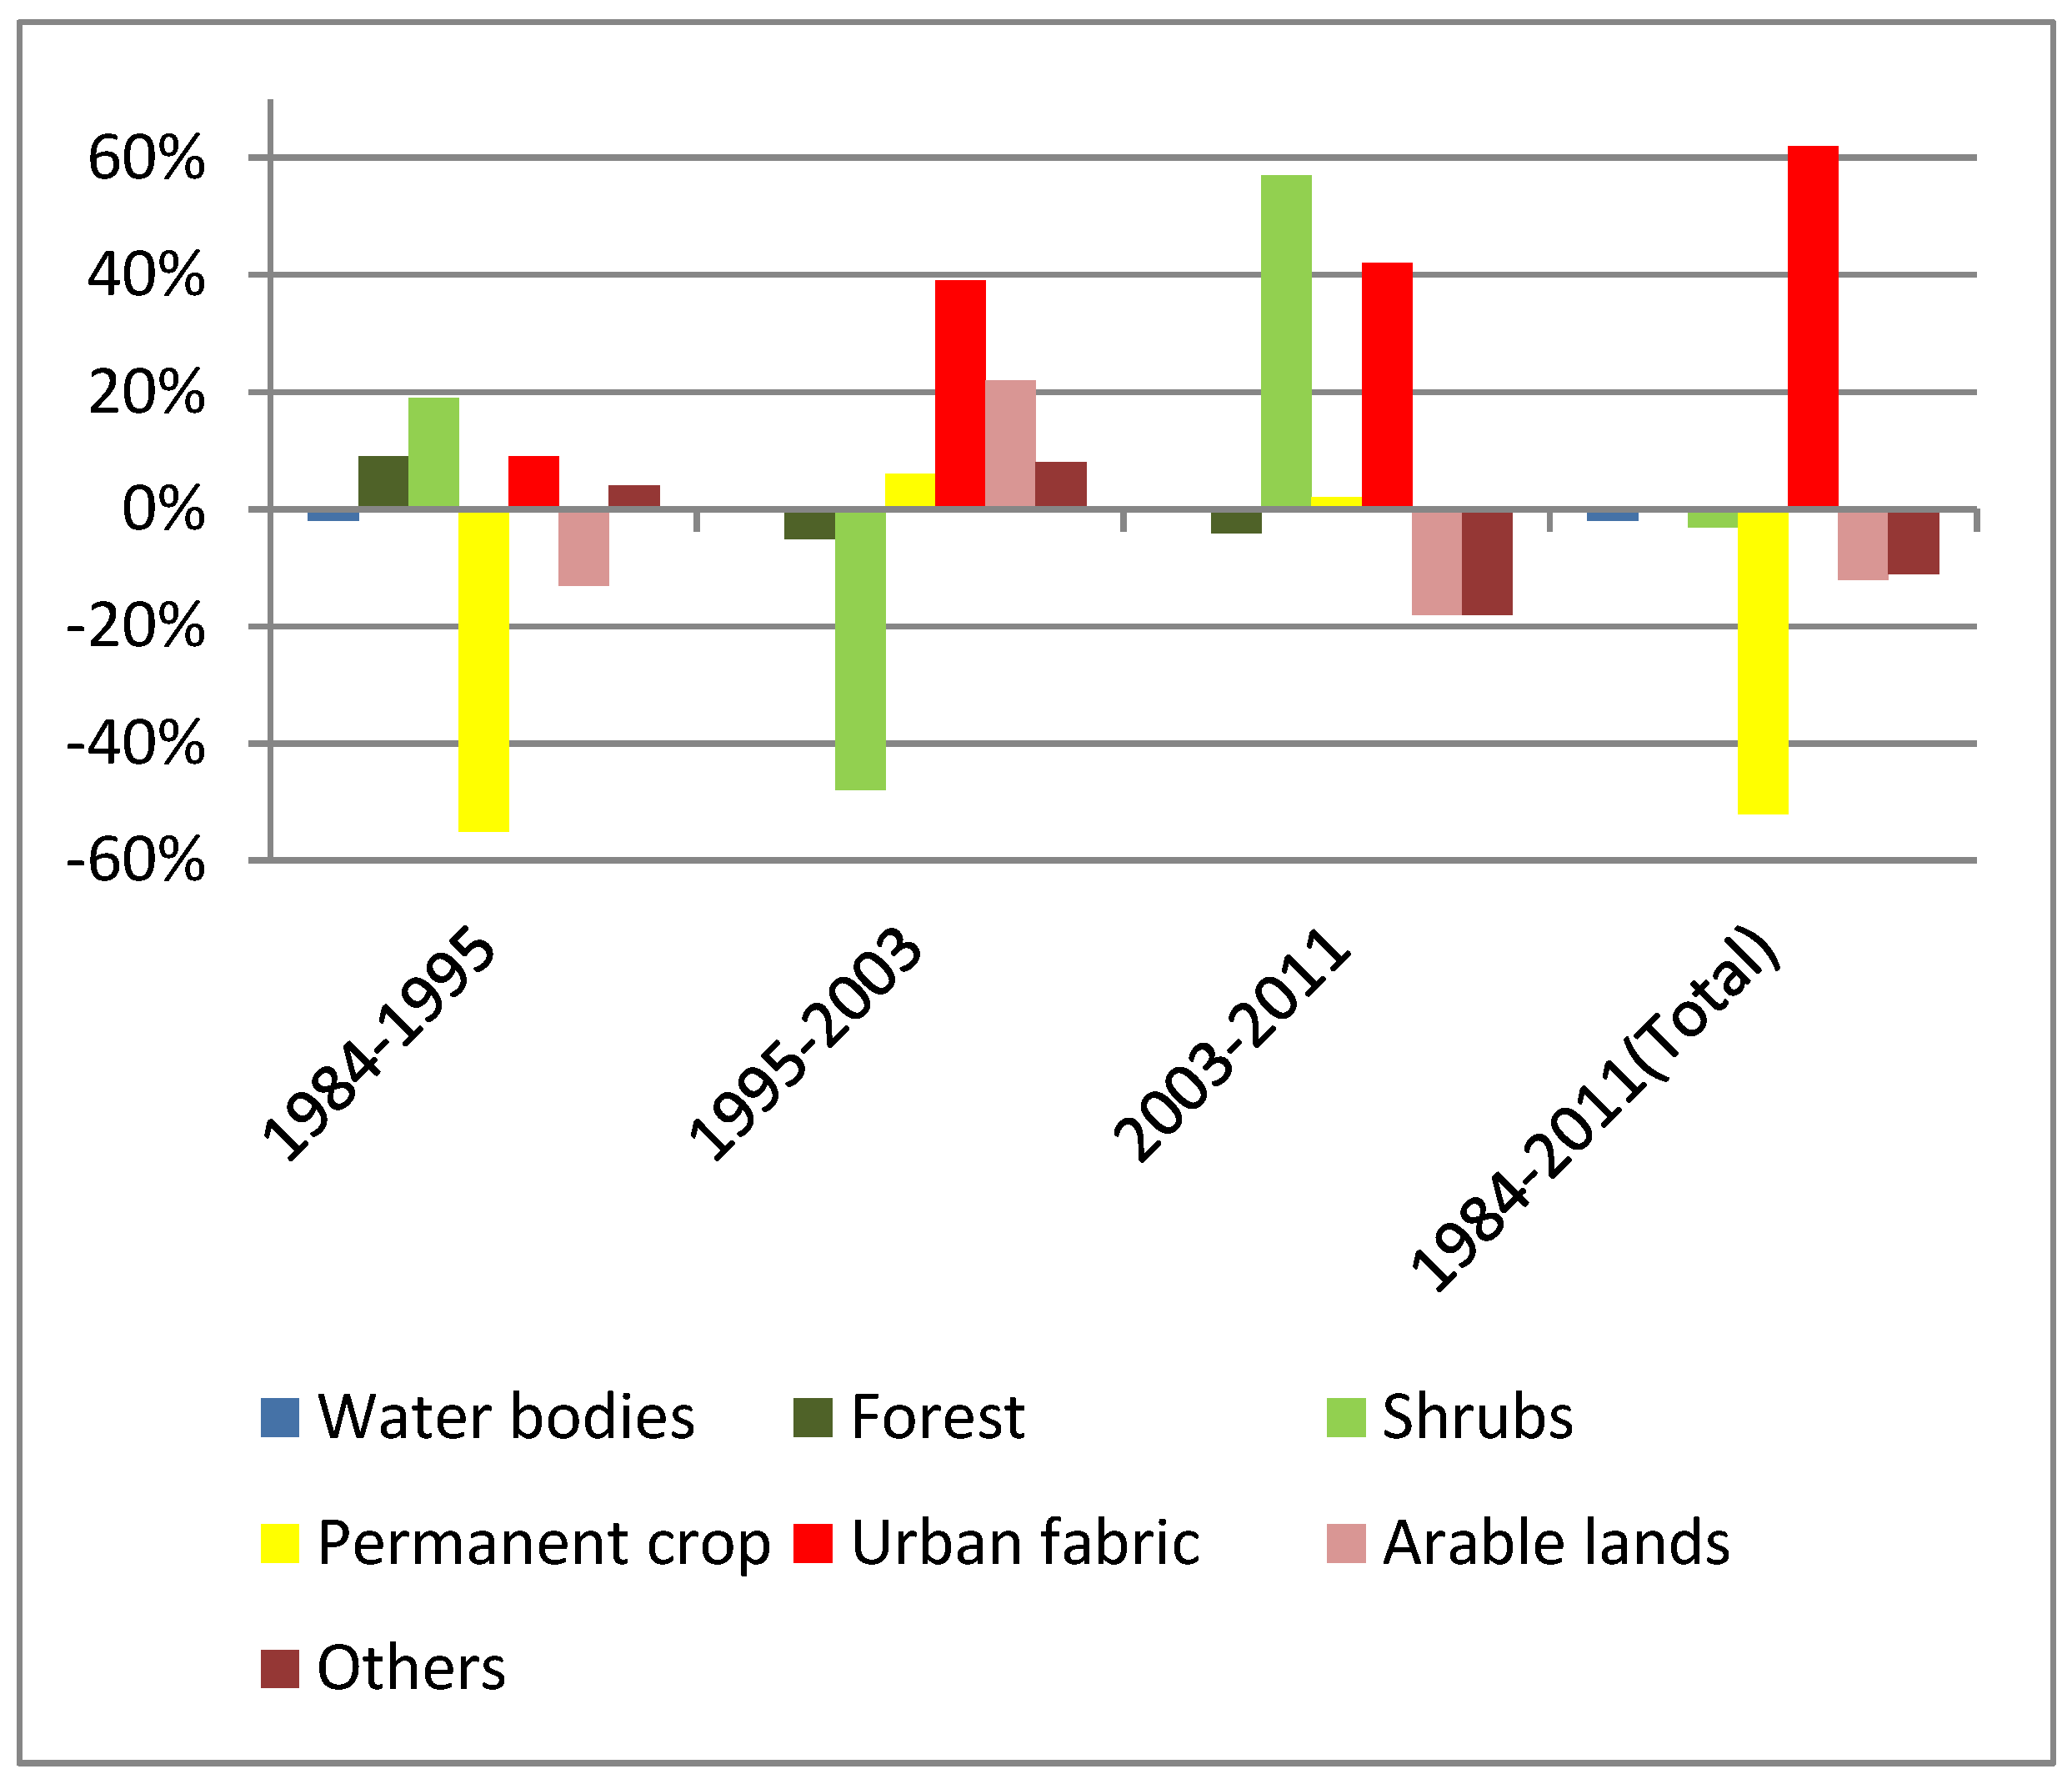
| CORİNE Land CoverDiversities | 1984–1995 Change | 1995–2003 Change | 2003–2011 Change | 1984-2011 Total Change |
|---|---|---|---|---|
| Water bodies | −83 | +16 | −17 | −84 |
| Forest | +838 | −468 | −373 | −3 |
| Shrubs | +604 | −1799 | +1093 | −102 |
| Permanent crop | −1456 | +73 | +22 | −1361 |
| Urban fabric | +112 | +806 | +918 | +1836 |
| Arable lands | −265 | +821 | −820 | −264 |
| Other | +250 | +551 | −823 | −90 |
| Months | Mean Ta (°C) Anomalies/Decades | ||
|---|---|---|---|
| 1983–1993 | 1993–2003 | 2003–2013 | |
| January | 0.40 | 1.30 | 1.66 |
| February | 0.38 | 1.28 | 1.60 |
| March | 0.34 | 1.27 | 1.57 |
| April | 0.32 | 1.22 | 1.55 |
| May | 0.32 | 1.20 | 1.55 |
| June | 0.28 | 1.20 | 1.57 |
| July | 0.30 | 1.24 | 1.60 |
| August | 0.32 | 1.23 | 1.59 |
| September | 0.35 | 1.25 | 1.61 |
| October | 0.36 | 1.25 | 1.62 |
| November | 0.38 | 1.27 | 1.63 |
| December | 0.42 | 1.28 | 1.65 |

4. Conclusions
Acknowledgments
Conflicts of Interest
References
- IPCC. Climate Change 2001: Impacts, Adaptation and Vulnarability; Contribution of Working Group II to the Third Assesment Report of the Intergovernmental Panel on Climate Change; McCarthy, J.J., Canziani, O.F., Leary, N.A., Dokken, D.J., White, K.S., Eds.; Cambridge University Press: Cambridge, UK, 2001. [Google Scholar]
- Mahmood, R.; Foster, A.; Logan, D. The GeoProfile metadata, exposure of instruments, and measurement bias in climatic record revisited. Int. J. Climatol. 2006, 26, 1091–1124. [Google Scholar] [CrossRef]
- Govindasamy, B.; Duffy, P.B.; Caldeira, K. Land use changes and northern hemisphere cooling. Geophys. Res. Lett. 2001, 28, 291–294. [Google Scholar] [CrossRef]
- Osborne, T.M.; Osborne, D.M.; Lawrence, J.M.; Slingo, A.J.; Challinor, T.R. Wheeler, Influence of vegetation on the local climate and hydrology in the tropics: Sensitivity to soil parameters. Clim. Dynm. 2004, 23, 45–61. [Google Scholar]
- Gibbard, S.; Caldeira, K.; Bala, G.; Phillips, T.J.; Wickett, M. Climate effects of global land cover change. Geophys. Res. Lett. 2005, 32, 705–714. [Google Scholar] [CrossRef]
- Alberti, M.; Marzluff, J. Ecological resilience in urban ecosystems: Linking urban patterns to ecological and human function. Urban Ecosyst. 2004, 7, 241–265. [Google Scholar] [CrossRef]
- Ackerman, B. Temporal march of the Chicago heat island. J. Clim. Appl. Meteorol. 1985, 24, 547–554. [Google Scholar] [CrossRef]
- Voogt, J.; Oke, T. Thermal remote sensing of urban climates. Remote Sens. Environ. 2003, 86, 370–384. [Google Scholar] [CrossRef]
- Song, C. Spectral mixture analysis for subpixel vegetation fractions in the urban environment: How to incorporate endmember variability? Remote Sens. Environ. 2005, 95, 248–263. [Google Scholar] [CrossRef]
- Masek, J.G.; Huang, C.; Wolfe, R.; Cohen, W.; Hall, F.; Kutler, J.; Nelson, P. North Amercan forest disturbance mapped from a decadal Landsat record. Remote Sens. Environ. 2008, 112, 2914–2926. [Google Scholar] [CrossRef]
- Su, W.; Zhang, Y.; Yang, Y.; Ye, G. Examining the impact of greenspace pattern on land surface temperature by coupling LİDAR DATA with a CFD Model. Sustainability 2014, 6, 6799–6814. [Google Scholar] [CrossRef]
- Stone, B. Land use as climate change mitigation. Environ. Sci. Technol. 2008, 43, 9052–9056. [Google Scholar] [CrossRef] [PubMed]
- Willems, E.; Vandevoort, C.; Willekens, A.; Buffaria, B. Landscape and land cover diversity index. Available online: http://ec.europa.eu/agriculture/publi/landscape (accessed on 15 May 2013).
- Gulinck, H.; Mugica, M.; Lucio, J.V.; Atauri, J.A. A framework for comparative landscape analysis and evaluation based on land cover data, with an application in the Madrid region (Spain). Landsc. Urban Plan. 2001, 55, 257–270. [Google Scholar] [CrossRef]
- Han, K.S.; Champeaux, J.L.; Roujean, J.L. A land cover classification product over France at 1 km resolution using SPOT4/VEGETATION data. Remote Sens. Environ. 2004, 92, 52–66. [Google Scholar] [CrossRef]
- Vancutsem, C.; Ceccato, P.; Dinku, T.; Connor, S. Evaluation of MODIS land surface temperature data to estimate air temperaturein different ecosystems over Africa. Remote. Sens. Environ. 2010, 114, 449–465. [Google Scholar] [CrossRef]
- Carlson, T.N.; Arthur, S.T. The impact of land use-land cover changes due to urbanization on surface microclimate and hydrology: A satellite perspective. Glob. Planet. Chang. 2000, 25, 49–65. [Google Scholar] [CrossRef]
- Chen, X.L.; Zhao, H.M.; Li, P.X.; Yin, Z.Y. Remote sensing image-based analysis of the relationship between urban heat island and land use/cover changes. Remote. Sens. Environ 2006, 104, 133–146. [Google Scholar] [CrossRef]
- Xiao, H.L.; Weng, Q.H. The impact of land use and land cover changes on land surface temperature in a karst area of China. J. Environ. Manag. 2007, 85, 245–257. [Google Scholar]
- Weng, Q.H.; Lu, D.S.; Schubring, J. Estimation of land surface temperature-vegetation abundance relationship for urban heat island studies. Remote. Sens. Environ 2004, 89, 467–483. [Google Scholar]
- Klok, L.; Zwart, S.; Verhagen, H.; Mauri, E. The surface heat island of Rotterdam and its relationshipwith urban surface characteristics. Resour. Consery. Recycl. 2012, 64, 23–29. [Google Scholar] [CrossRef]
- Dong, S.; Yan, X.; Xiong, Z. Varying responses in mean surface air temperature from land use/cover change in different seasons over northern China. Acta Ecol. Sin. 2013, 33, 167–171. [Google Scholar] [CrossRef]
- Li, J.J.; Wang, X.R.; Wang, X.J.; Ma, W.C.; Zhang, H. Remote sensing evaluation of urban heat island and its spatial pattern of the Shanghai metropolitan area, China. Ecol. Complex. 2009, 6, 413–420. [Google Scholar] [CrossRef]
- Owen, T.W.; Carlson, T.N.; Gillies, R.R. An assessment of satellite remotely sensed land cover parameters in quantitatively describing the climatic effect of urbanization. Int. J. Remote Sens. 1998, 19, 1663–1681. [Google Scholar] [CrossRef]
- Araya, Y.H.; Cabral, P. Analysis and modeling of urban land cover changes in Setubal and Sesimbra, Portugal. Remote Sens. 2010, 2, 1549–1563. [Google Scholar] [CrossRef]
- Weng, Q. Thermal infrared remote sensing for urban climate and environmental studies: Methods, applications and trends. ISPRS J. Photogramm. Remote Sens. 2009, 64, 335–344. [Google Scholar] [CrossRef]
- Schwarz, N.; Schlink, U.; Franch, U.; Grobmann, K. Relationship of land surface and air temperatures and its implications for quantifying urban heat island indicators—An application for the city of Leipzig (Germany). J. Ecol. Indic. 2012, 18, 693–704. [Google Scholar] [CrossRef]
- Cheng, K.S.; Su, Y.F.; Kuo, F.T.; Hunh, W.C.; Chiang, J.L. Assesing the effect landcover changes on air temperature using remote sensing images—A pilot study on northern Taiwan. Landsc. Urban Plan. 2008, 85, 85–96. [Google Scholar] [CrossRef]
- Turkish Statistical Institute. Avaiable online: http://www.turkstat.gov.tr (accessed on 20 March 2013).
- Kruscal, W.H.; Wallis, W.A. Use of ranks in one-criterion variance analysis. J. Am. Stat. Assoc. 1952, 47, 583–621. [Google Scholar] [CrossRef]
- Altınsoy, H.; Öztürk, T.; Türkeş, M.; Kurnaz, M.L. Projections of Future Air Temperature and Precipitation Changes in the Mediterranean Basin by Using the Global Climate Model. In Proceedings of the National Geographical Congress with International Participitation (CD-R), İstanbul, Turkey, 7–10 September 2011. (In Turkish)
- Sen, B.; Topçu, S.; Türkeş, M.; Sen, B.; Warner, J. F Projecting climate change, drought conditions and crop productivity in Turkey. Clim. Res. 2012, 52, 175–191. [Google Scholar] [CrossRef]
- Türkeş, M. Global Warming and Kyoto Protocol: Scientific, Economical, and Political Analysis of Climate Changes; Bağlam Publishing: İstanbul, Turkey, 2011; pp. 21–57. [Google Scholar]
- Türkeş, M. Physical Science Basis of the Climate Change: Physical Climate System, Enhanced Greenhouse Effect, Observed and Projected Climate Variations. In 5th Atmospheric Science Symposium Proceedings Book; Istanbul Technical University: Istanbul, Turkey, 2011; pp. 135–151. [Google Scholar]
- İyigün, C.; Türkeş, M.; Batmaz, İ.; Yozgatlıgil, C.; Purutçuoğlu, V.; Koç, E.K.; Öztürk, M.Z. Clustering current climatic regions of Turkey by using a multivariate statistical method. Theor. Appl. Climatol. 2011, 114, 95–106. [Google Scholar] [CrossRef]
- Türkeş, M.; Sümer, U.M.; Demir, I. Re-evaluation of trends and changes in mean, maximum and minimum temperatures of Turkey for the period 1929–1999. Int. J. Climatol. 2002, 22, 947–977. [Google Scholar] [CrossRef]
- Türkeş, M.; Sümer, U.M. Spatial and temporal patterns of trends and variability in diurnal temperature ranges of Turkey. Theor. Appl. Climatol. 2004, 77, 195–227. [Google Scholar] [CrossRef]
- Feng, X.Y.; Luo, G.P.; Li, C.F.; Dai, L.; Lu, L. Dynamics of ecosystem service value caused by land use changes in Manas River of Xinjiang, China. Int. J. Environ. Res. 2012, 6, 499–508. [Google Scholar]
- Odindi, J.O.; Mahangara, P. Green spaces trends in the city of Port Elizabeth from 1990 to 2000 using remote sensing. Int. J. Environ. Res. 2012, 6, 653–662. [Google Scholar]
- Barati, A.A.; Asadi, A.; Kalantari, K.; Azadi, H.; Witlof, F. Agricultural land conversion in Northwest Iran. Int. J. Environ. Res. 2015, 9, 281–290. [Google Scholar]
- Saptoma, S.K.; Nakona, Y.; Yuge, K.; Haraguchi, T. Observation and simulation of thermal environment in a paddy field. Paddy Water Environ. 2004, 2, 73–82. [Google Scholar] [CrossRef]
- Tian, Y.; Yin, K.; Lu, D.; Hua, L.; Zhao, Q.; Wen, M. Examining Land Use and Land Cover spatiotemporal change and driving forces in Beijing from 1978 to 2010. Remote Sens. 2014, 6, 10593–10611. [Google Scholar] [CrossRef]
- Bernatzky, A. The contribution of trees and green spaces to a town climate. Energ. Buildings 1982, 5, 1–10. [Google Scholar] [CrossRef]
- Georgi, N.J.; Dimitriou, D. The contribution of urban gren spaces to the improvement of environment in cities: Case study of Chania, Greece. Build. Environ. 2010, 45, 1401–1414. [Google Scholar] [CrossRef] [Green Version]
- Chen, Y.; Wong, N.H. Thermal benefits of city parks. Energy Build. 2006, 38, 105–120. [Google Scholar]
- Zhang, X.; Zhong, T.; Feng, X.; Wang, K. Estimation of the relationship between forest patches urban land surface temperature with remote sensing. Int. J. Remote Sens. 2009, 30, 2105–2118. [Google Scholar] [CrossRef]
- Jenerette, G.D.; Harlan, S.L.; Stefanov, W.L.; Martin, C.A. Ecosystem services and urban heat riskspace moderation: Water, green spaces and social inequality in Phoenix, USA. Ecol. Appl. 2011, 21, 2637–2651. [Google Scholar] [CrossRef] [PubMed]
- Shashua-Bar, L.; Pearlmutter, D.; Erell, E. The influences of trees and grass on outdoor thermal comfort in a hot-arid climate enviroment. Int. J. Climatol. 2011, 31, 1498–1506. [Google Scholar] [CrossRef]
© 2015 by the author; licensee MDPI, Basel, Switzerland. This article is an open access article distributed under the terms and conditions of the Creative Commons Attribution license (http://creativecommons.org/licenses/by/4.0/).
Share and Cite
Cinar, İ. Assessing the Correlation between Land Cover Conversion and Temporal Climate Change—A Pilot Study in Coastal Mediterranean City, Fethiye, Turkey. Atmosphere 2015, 6, 1102-1118. https://doi.org/10.3390/atmos6081102
Cinar İ. Assessing the Correlation between Land Cover Conversion and Temporal Climate Change—A Pilot Study in Coastal Mediterranean City, Fethiye, Turkey. Atmosphere. 2015; 6(8):1102-1118. https://doi.org/10.3390/atmos6081102
Chicago/Turabian StyleCinar, İsmail. 2015. "Assessing the Correlation between Land Cover Conversion and Temporal Climate Change—A Pilot Study in Coastal Mediterranean City, Fethiye, Turkey" Atmosphere 6, no. 8: 1102-1118. https://doi.org/10.3390/atmos6081102