
Comparison of Portable and Large Mobile Air Cleaners for Use in Classrooms and the Effect of Increasing Filter Loading on Particle Number Concentration Reduction Efficiency


Abstract
:1. Introduction
2. Air Cleaners and Setup
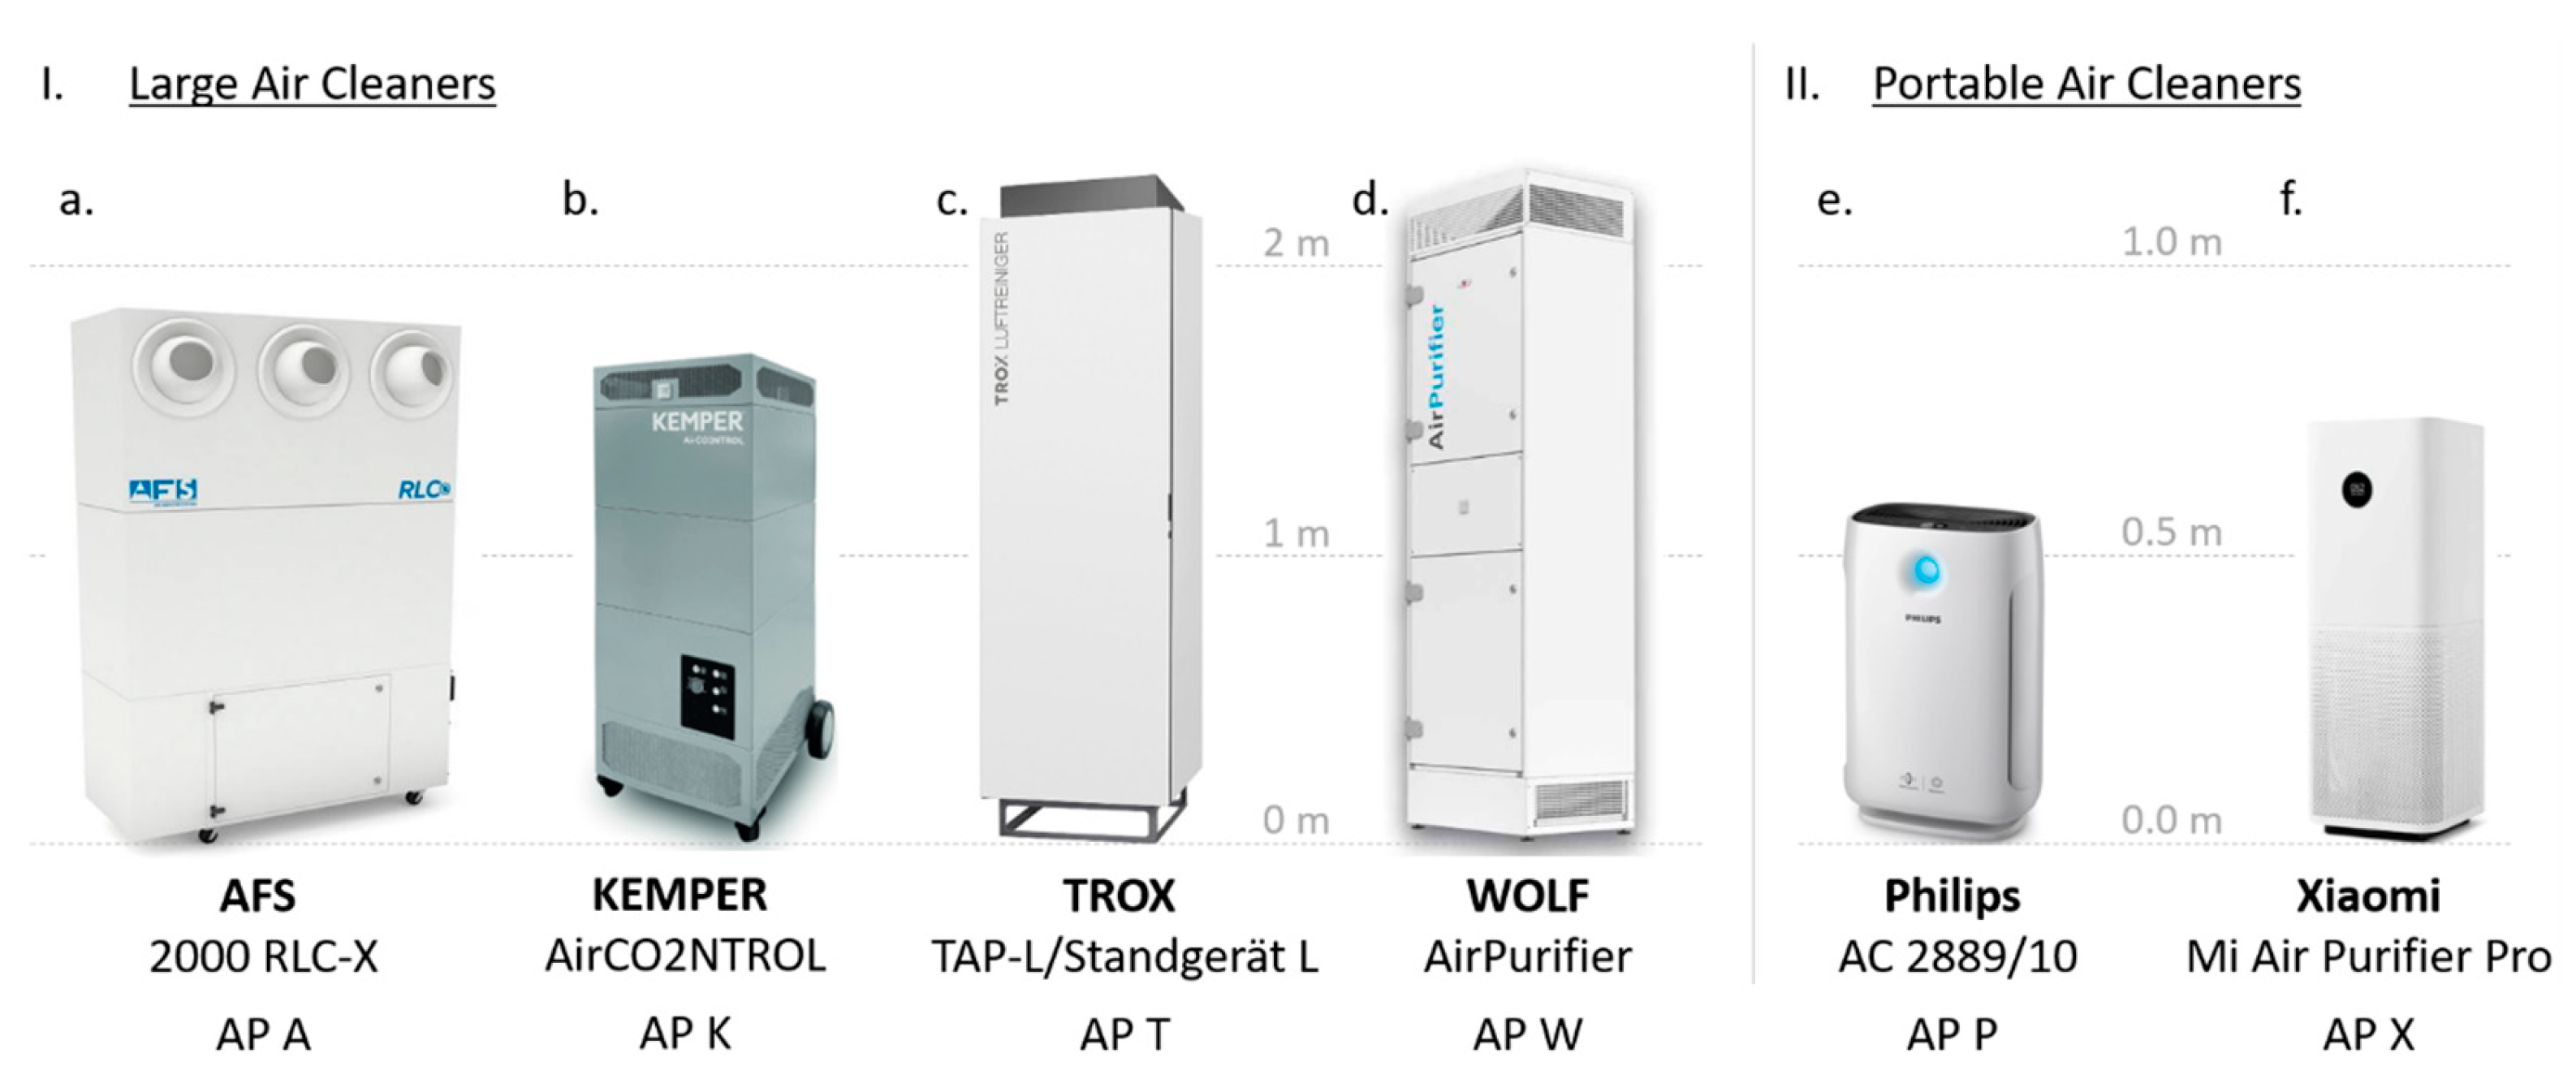
2.1. Portable/Mobile/Large Air Cleaners Used
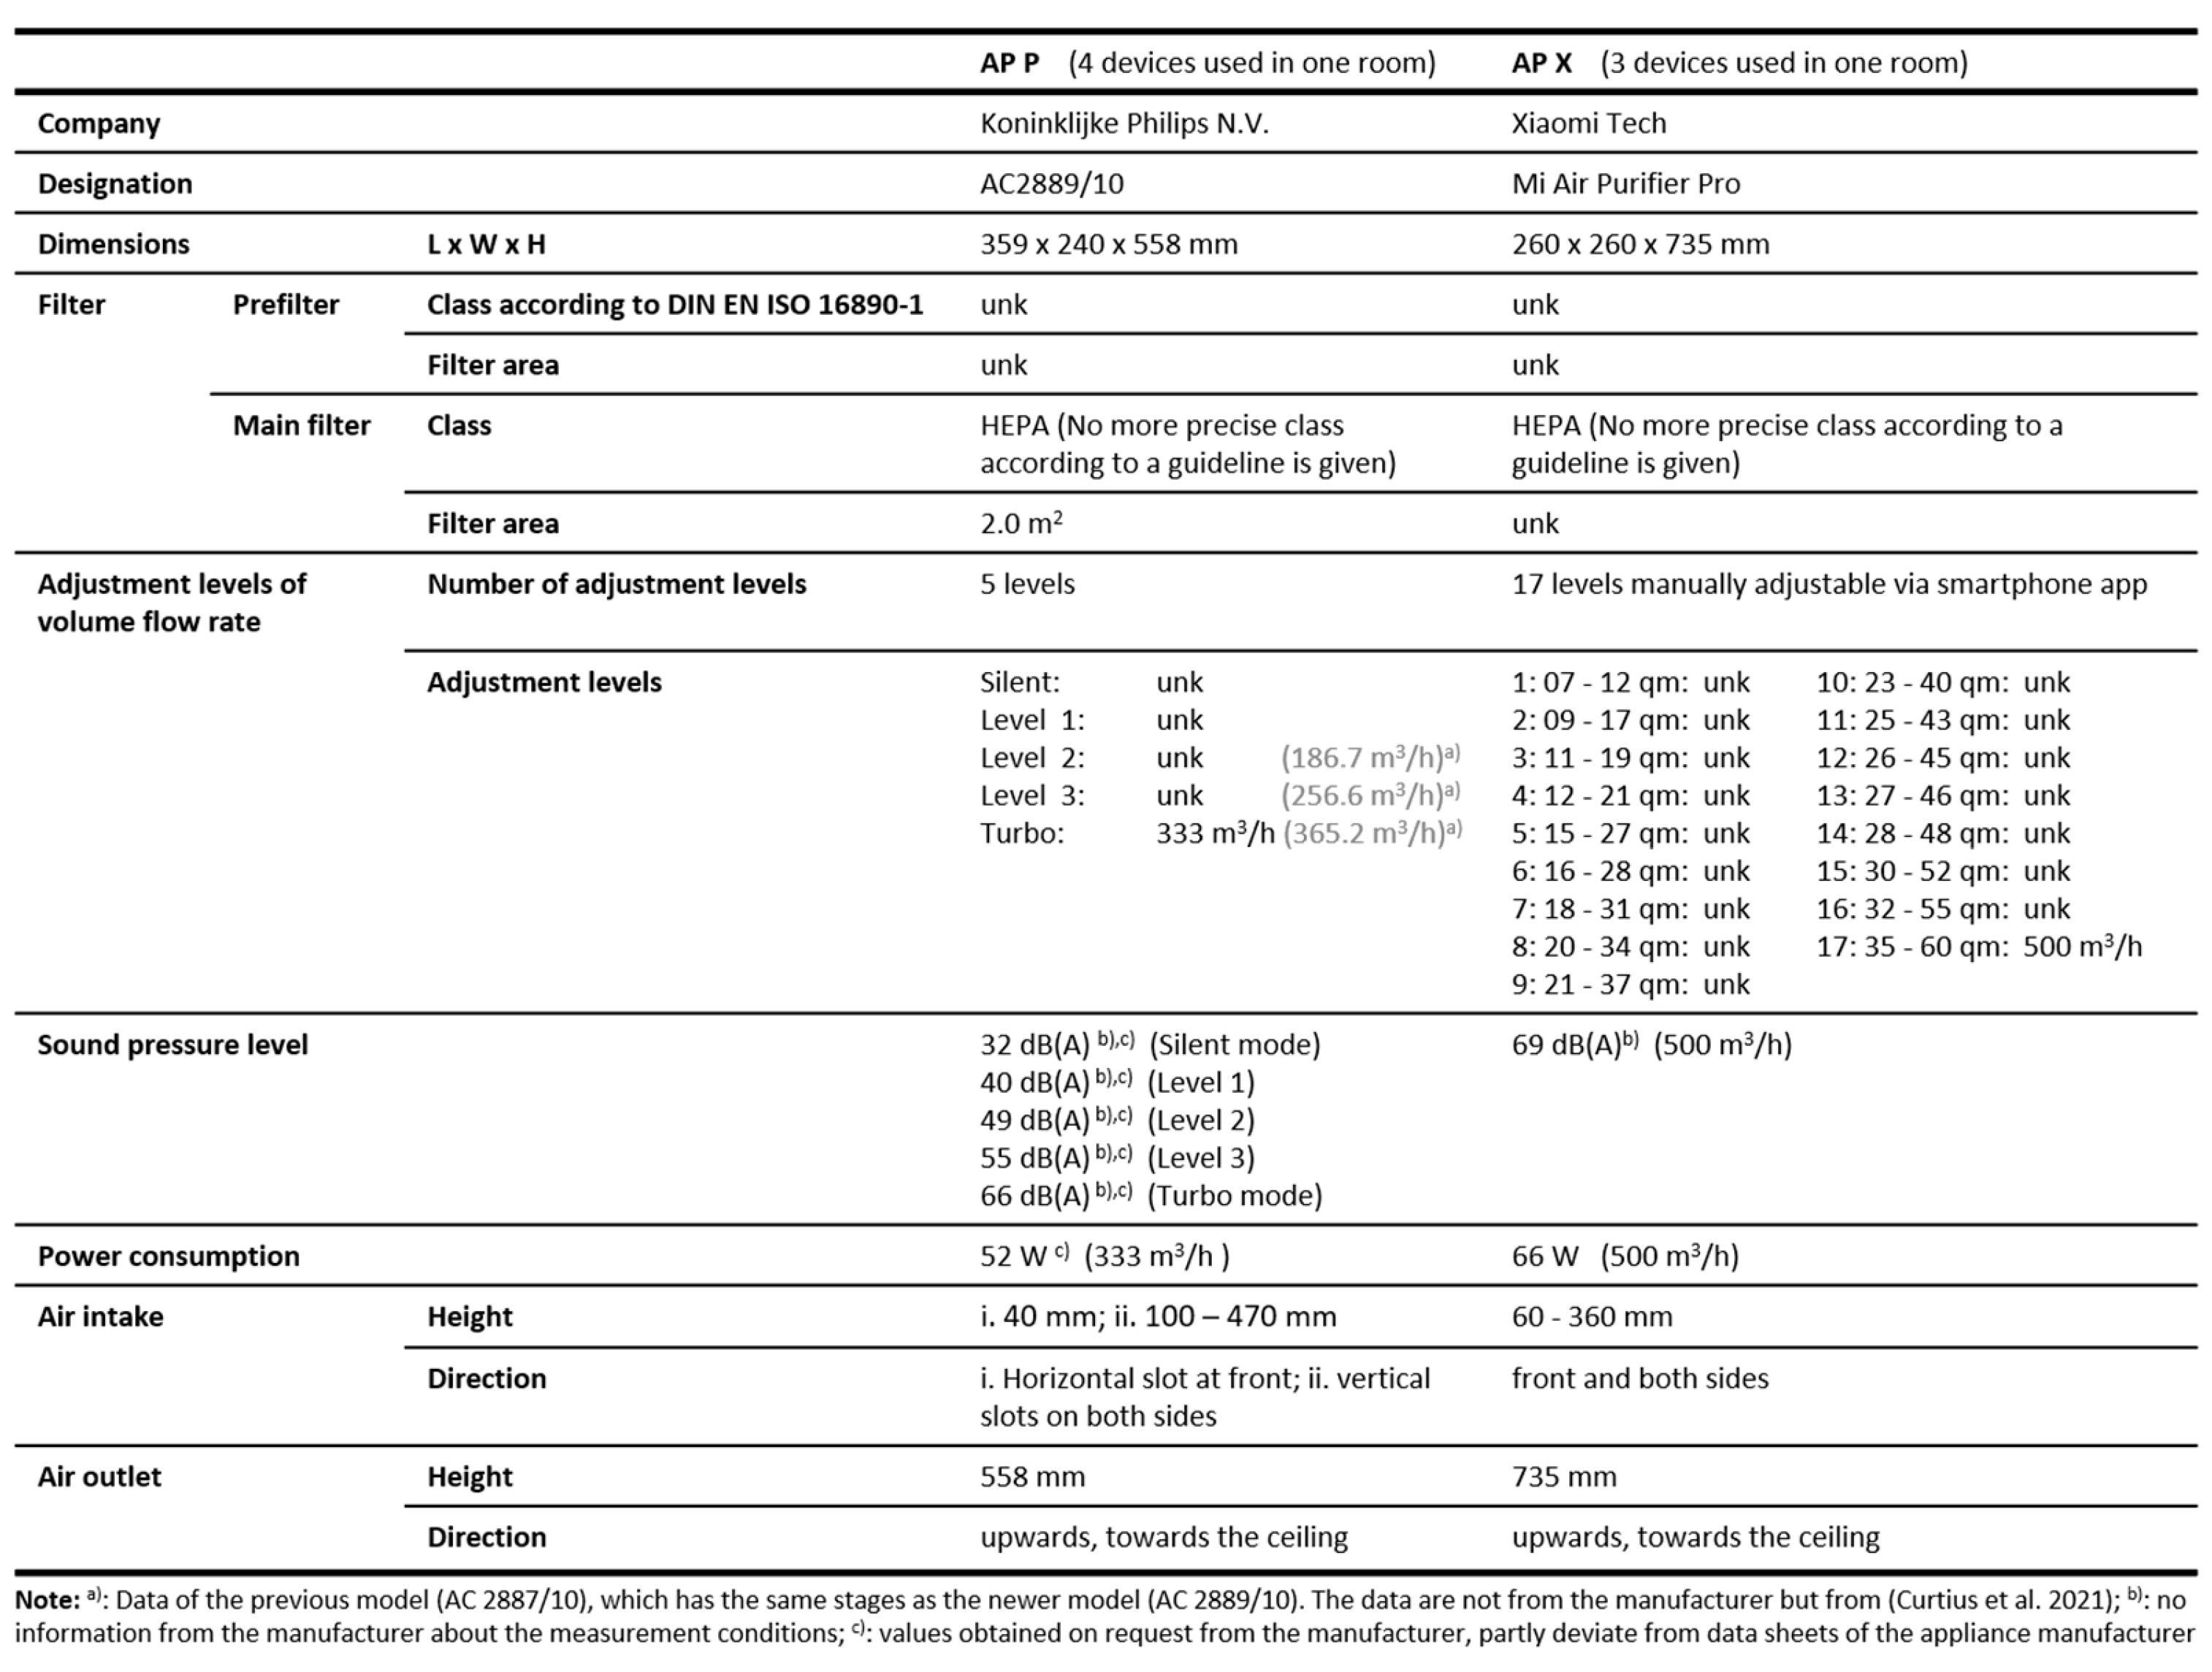
2.1.1. Portable Air Cleaners

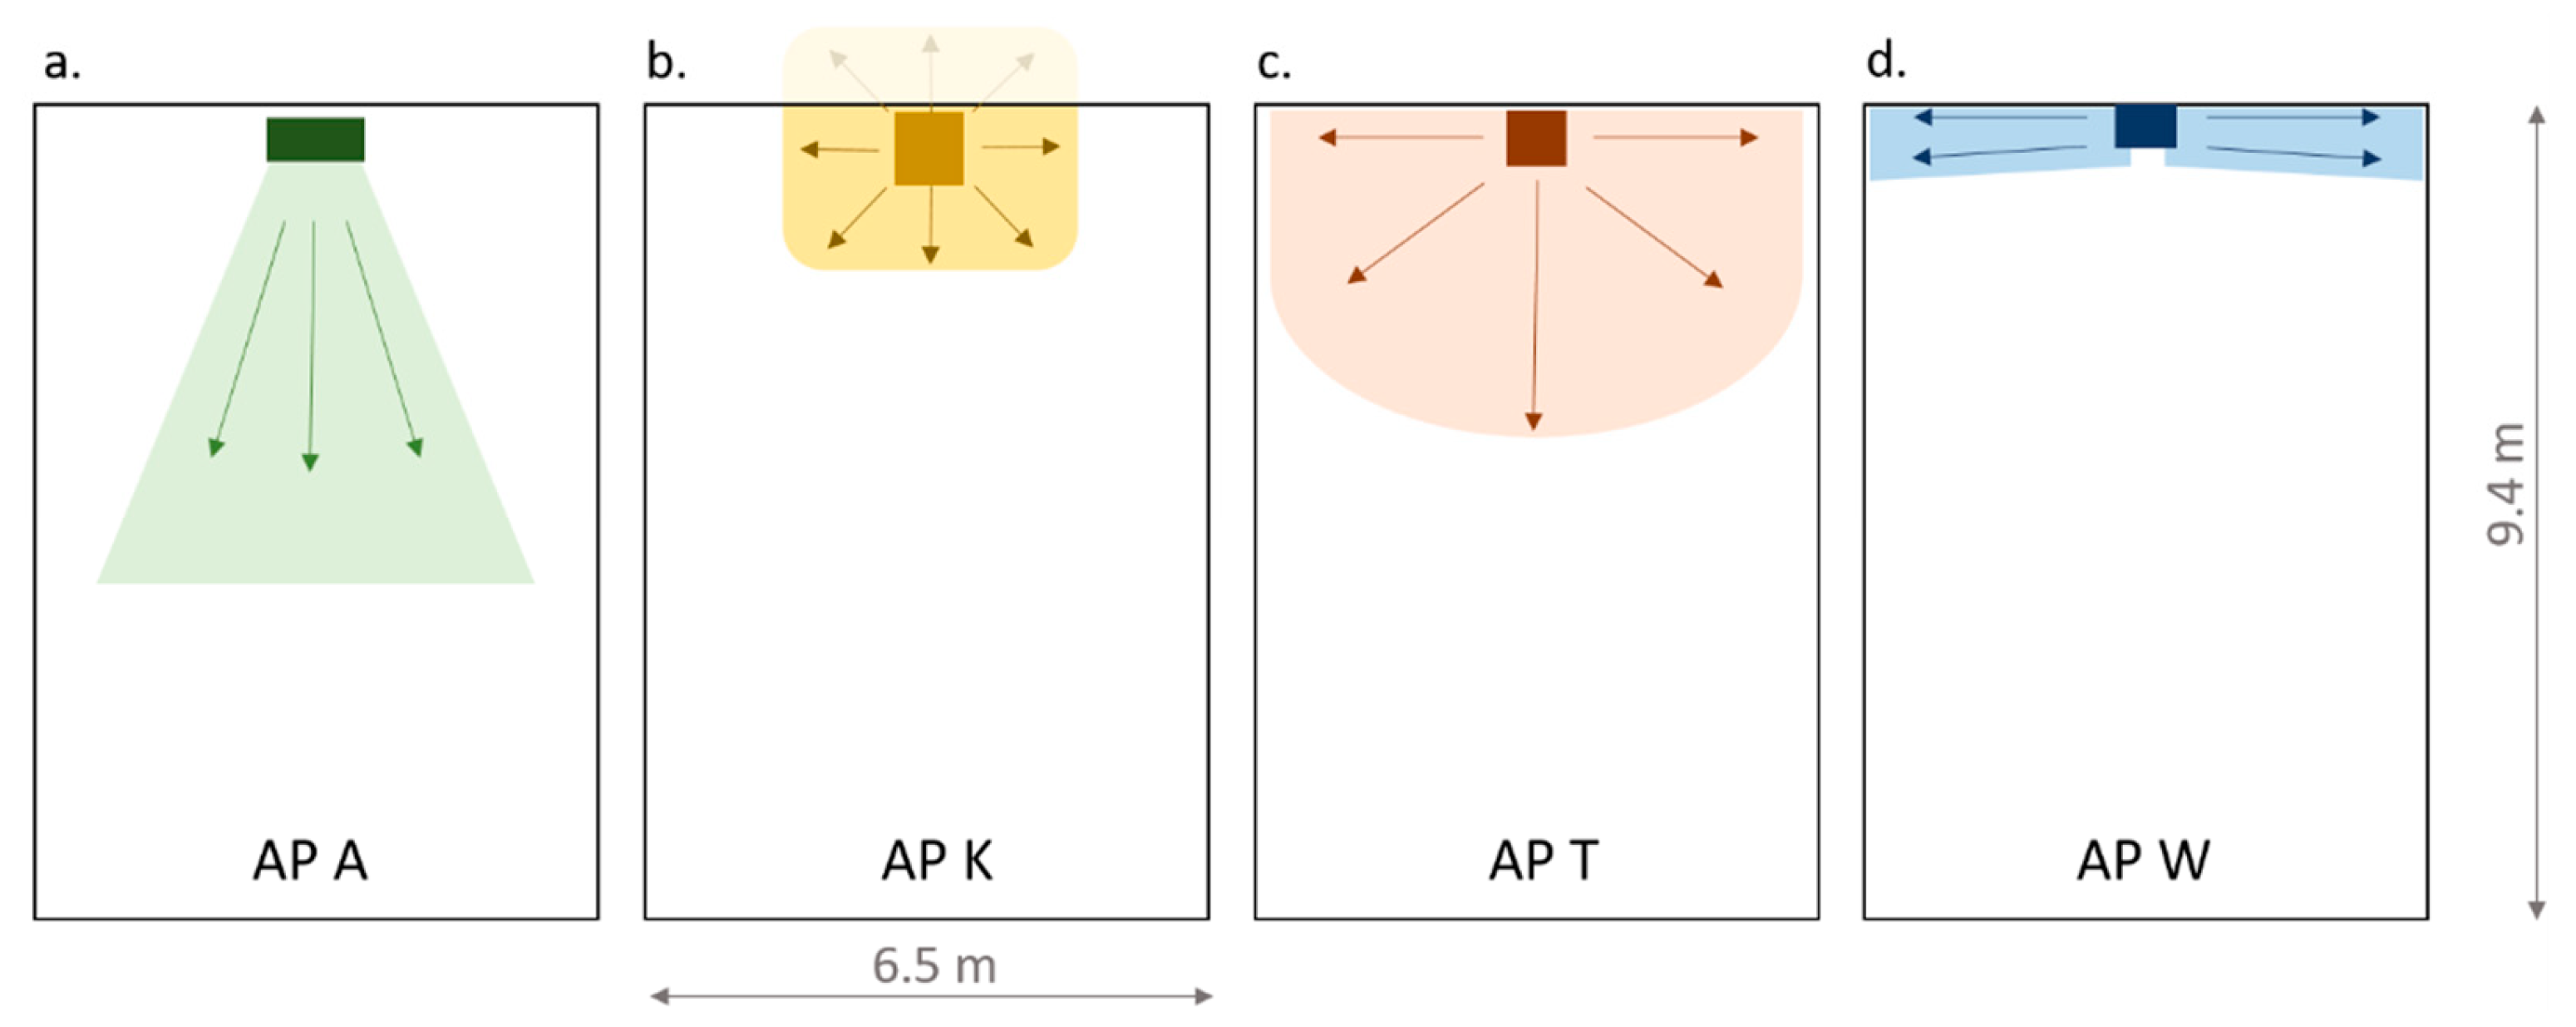
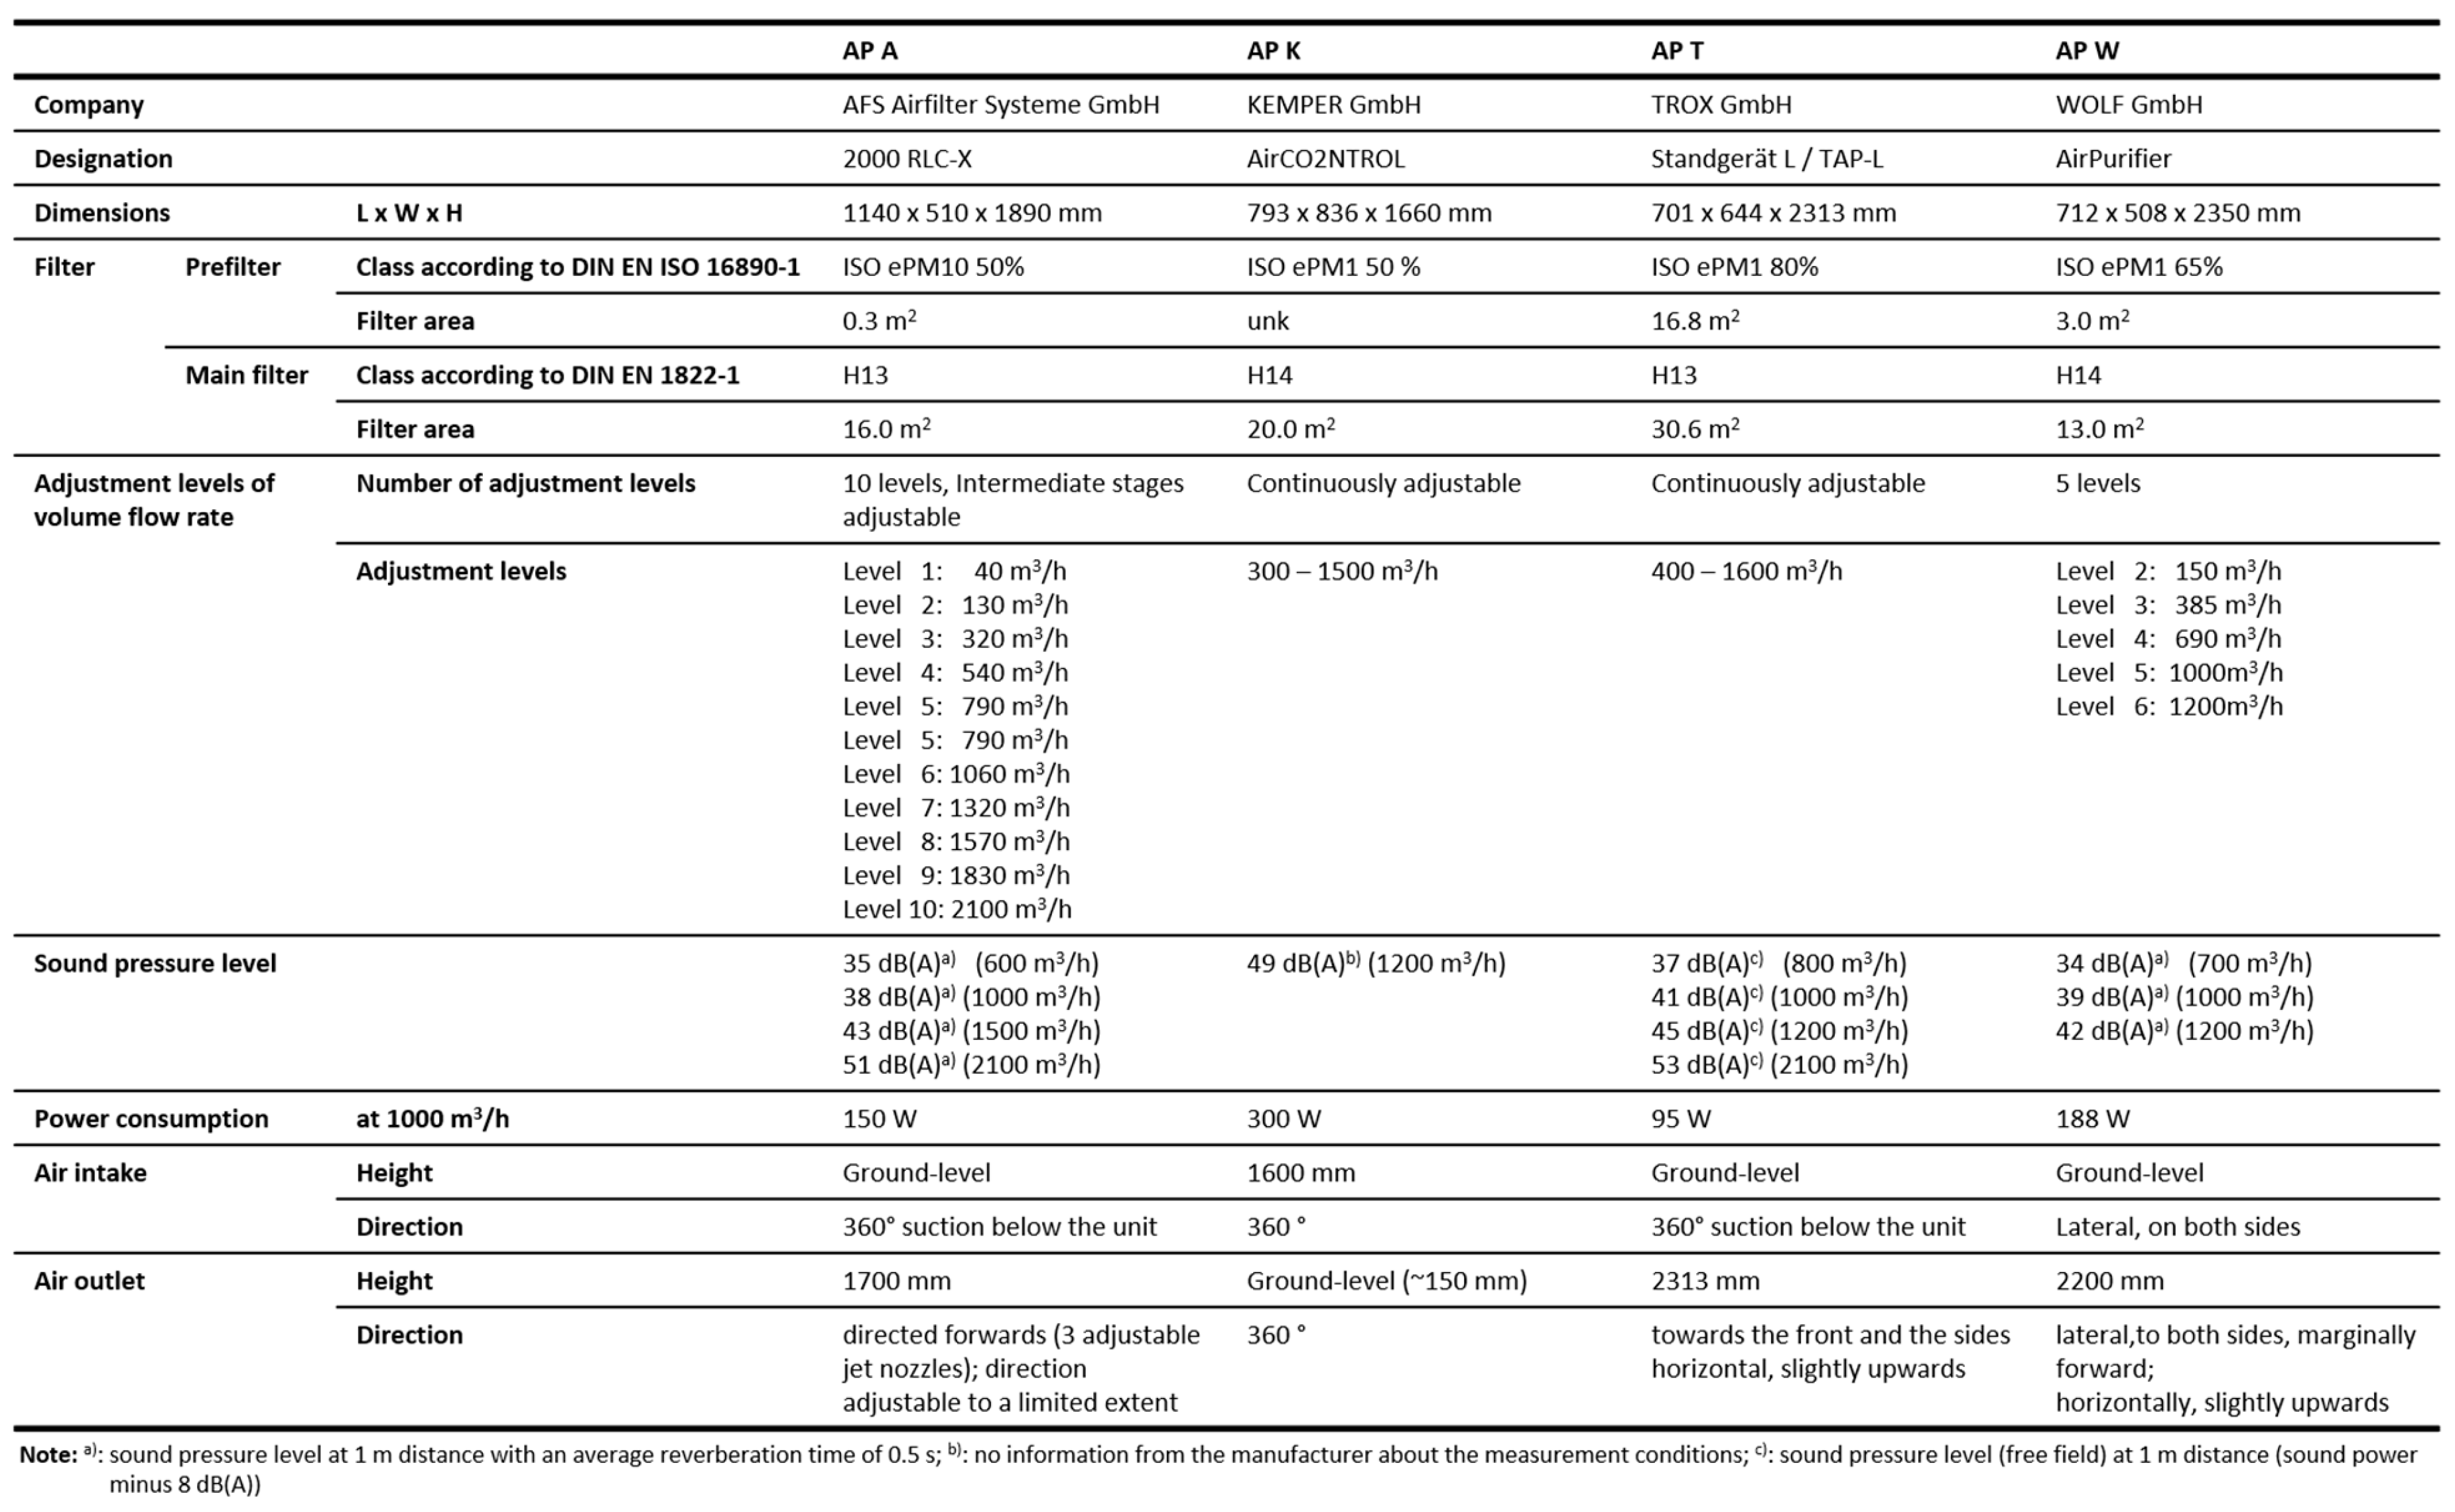
2.1.2. Large and Mobile Air Cleaners
2.2. Measurement Equipment
2.2.1. Aerosol Spectrometer and Generator
2.2.2. Sound Analyzer and Power Meter
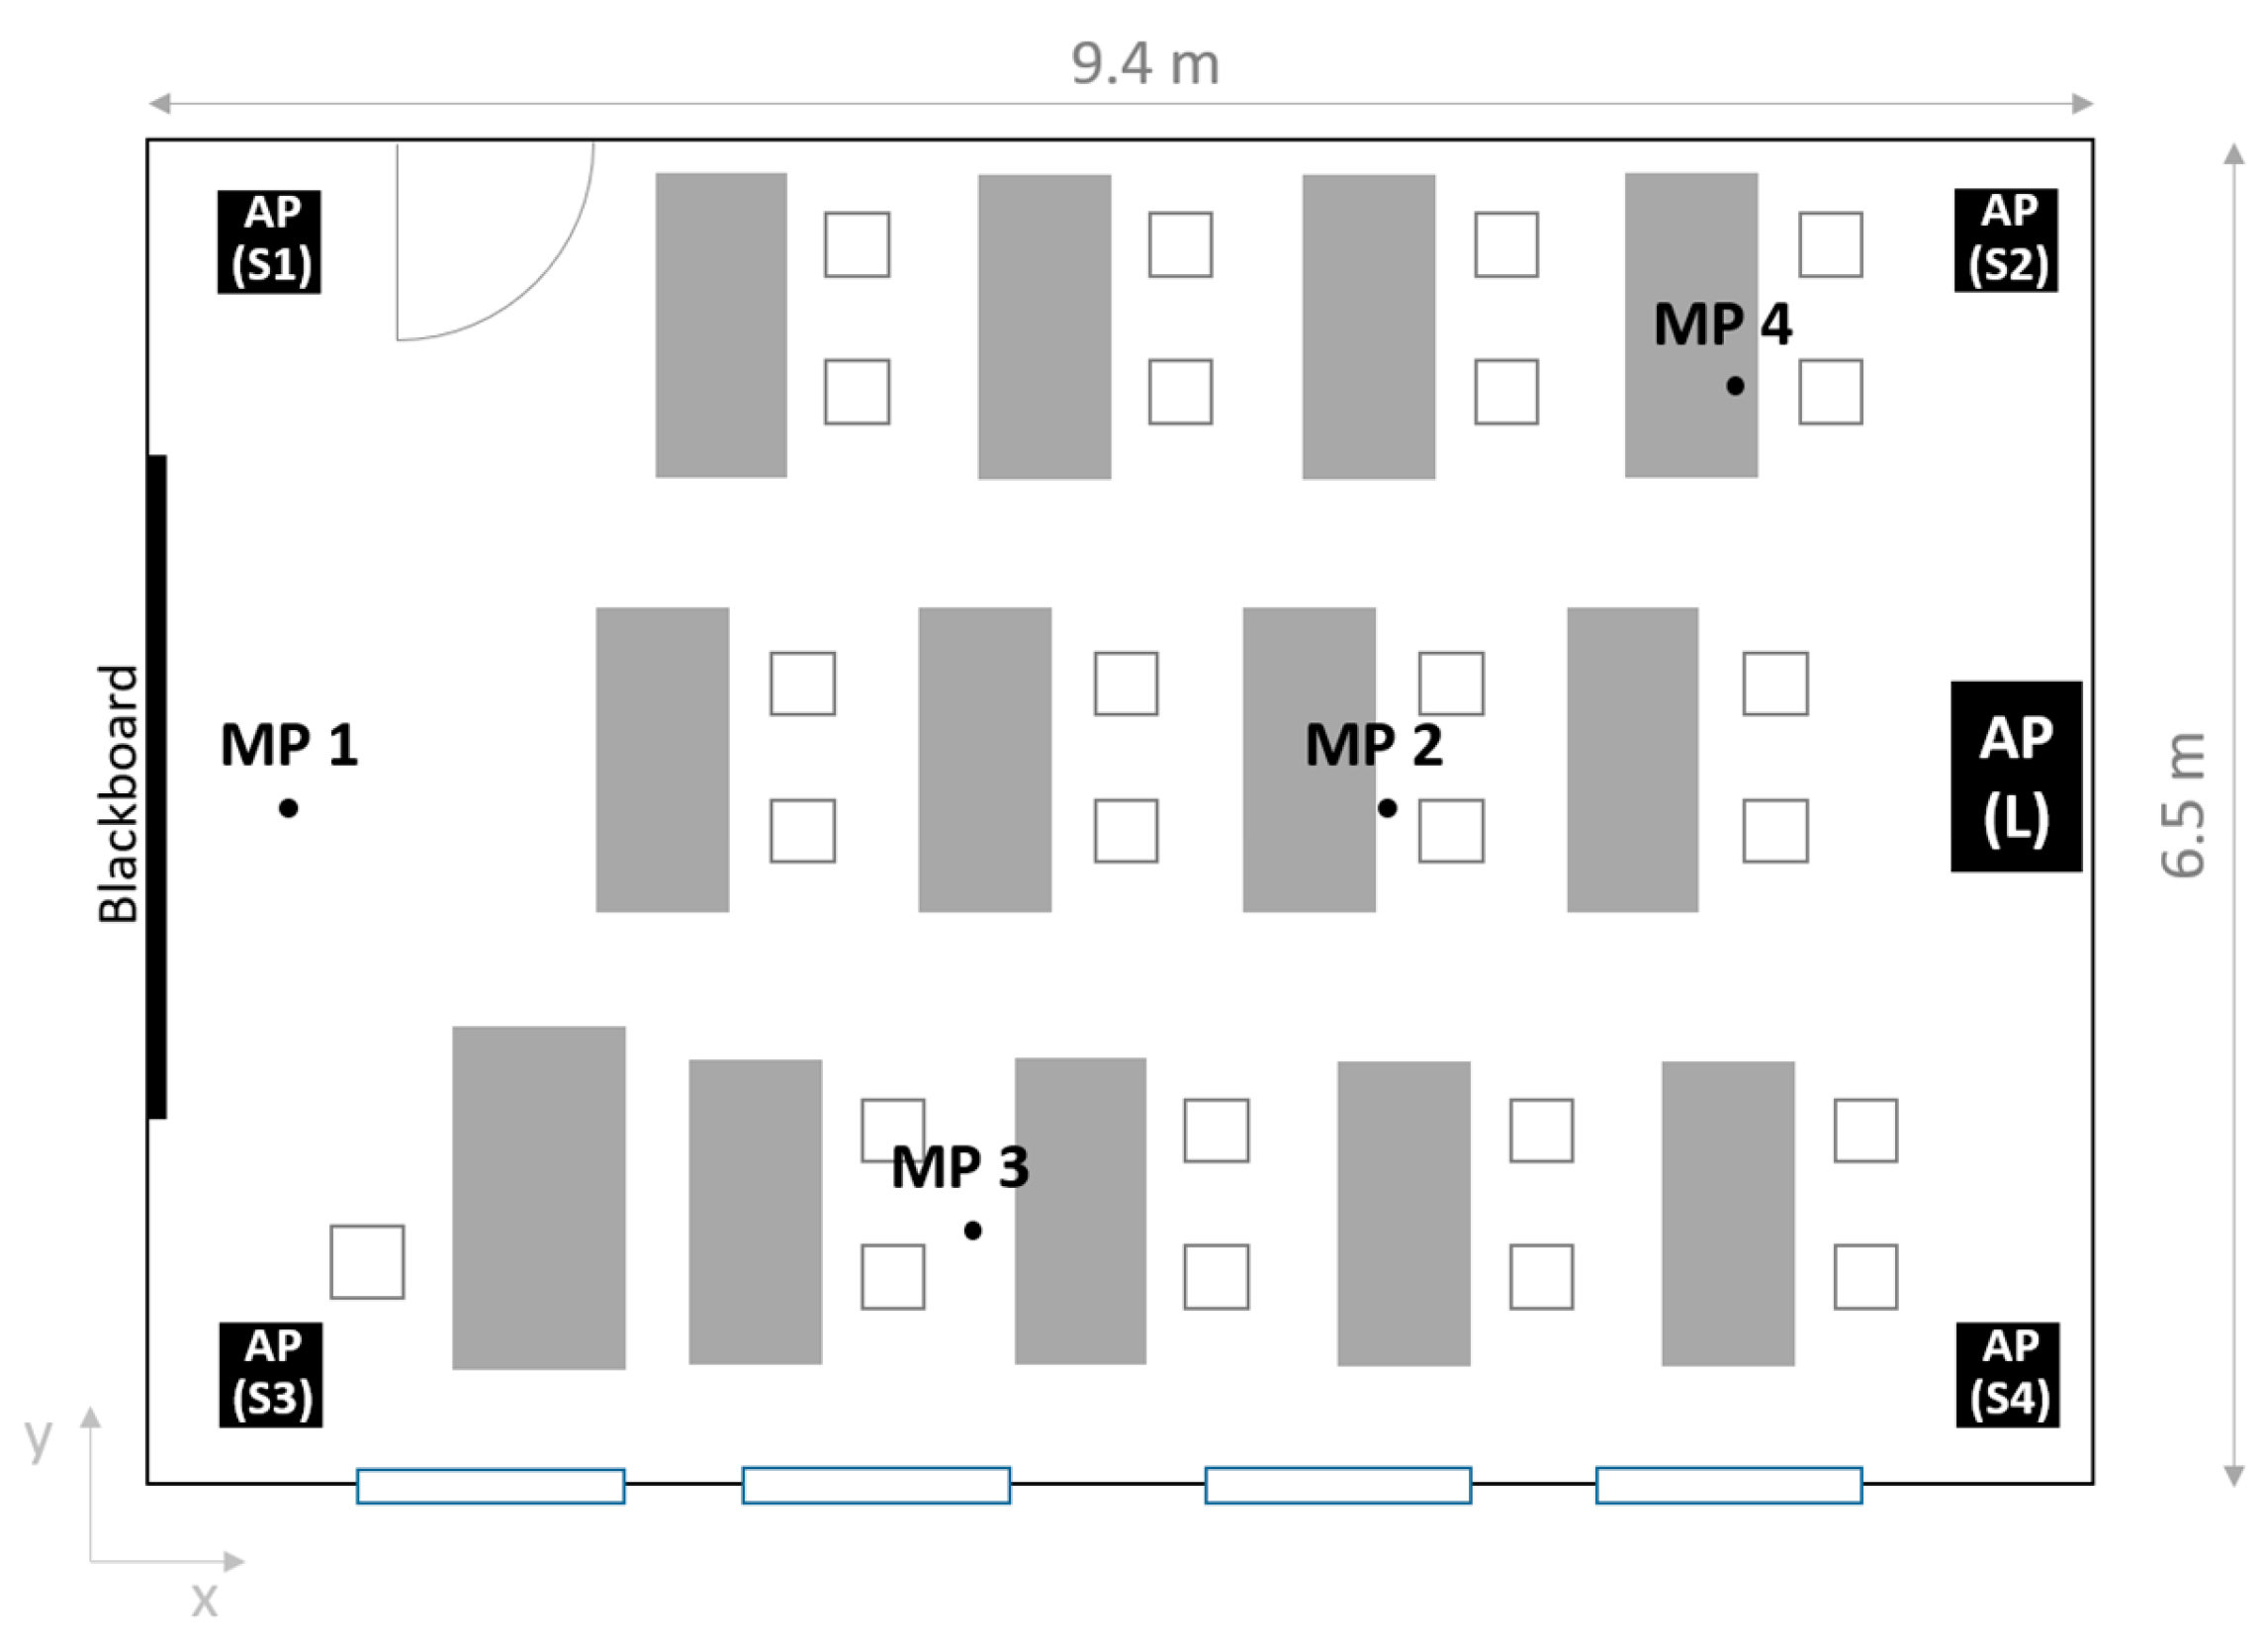
2.3. Setup of the Test Series
2.4. Experimental Procedure and Scenarios Investigated
3. Results and Discussion
3.1. Evaluation of the Spatial Homogeneity of the PNC in a Classroom (Scenario 1)
3.2. Verification of the Manufacturer’s Specifications Regarding the Volume Flow Rates
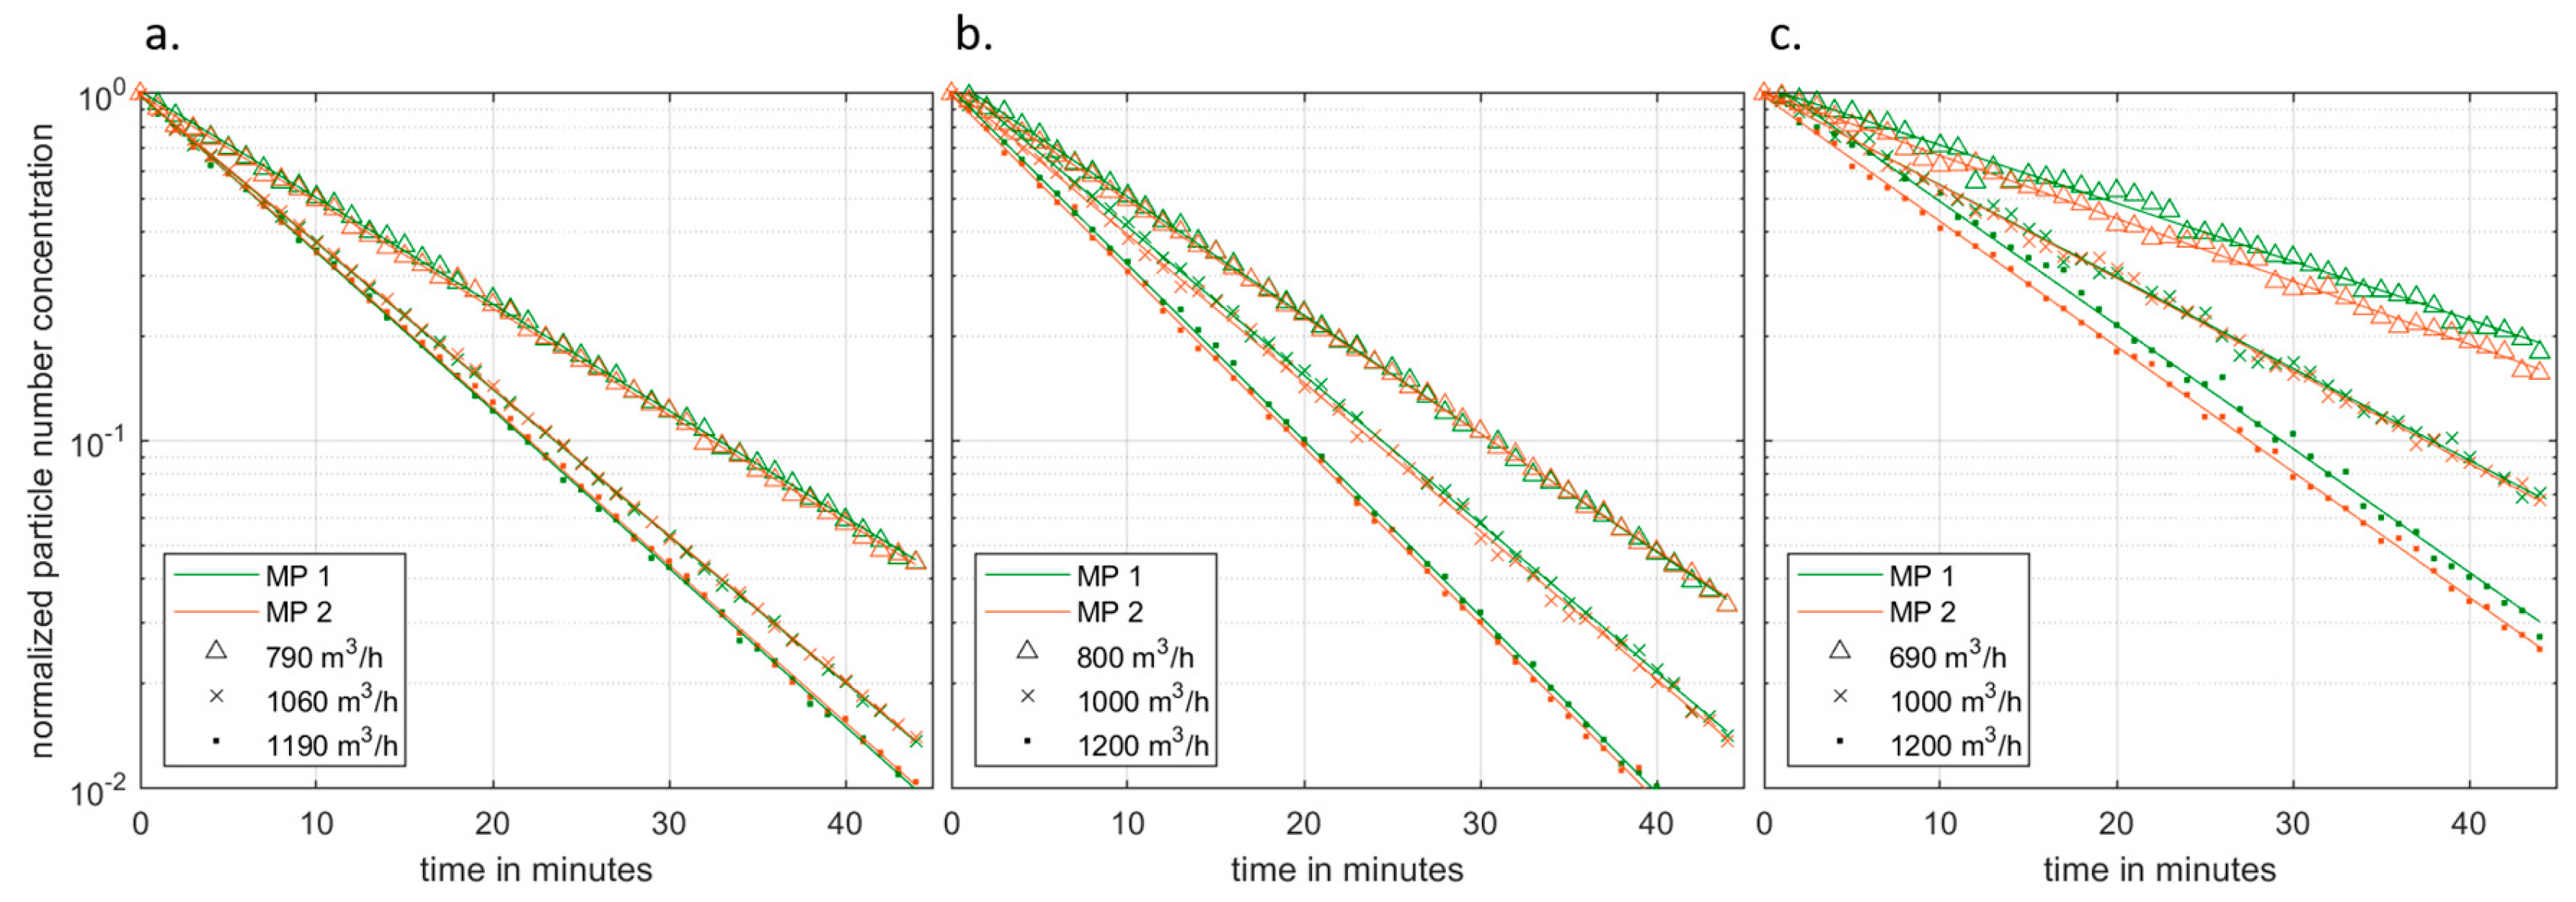
3.3. Decay Rates of Investigated APs at Different Set Volume Flows (Scenario 2)
- I.
- Large APs
- II.
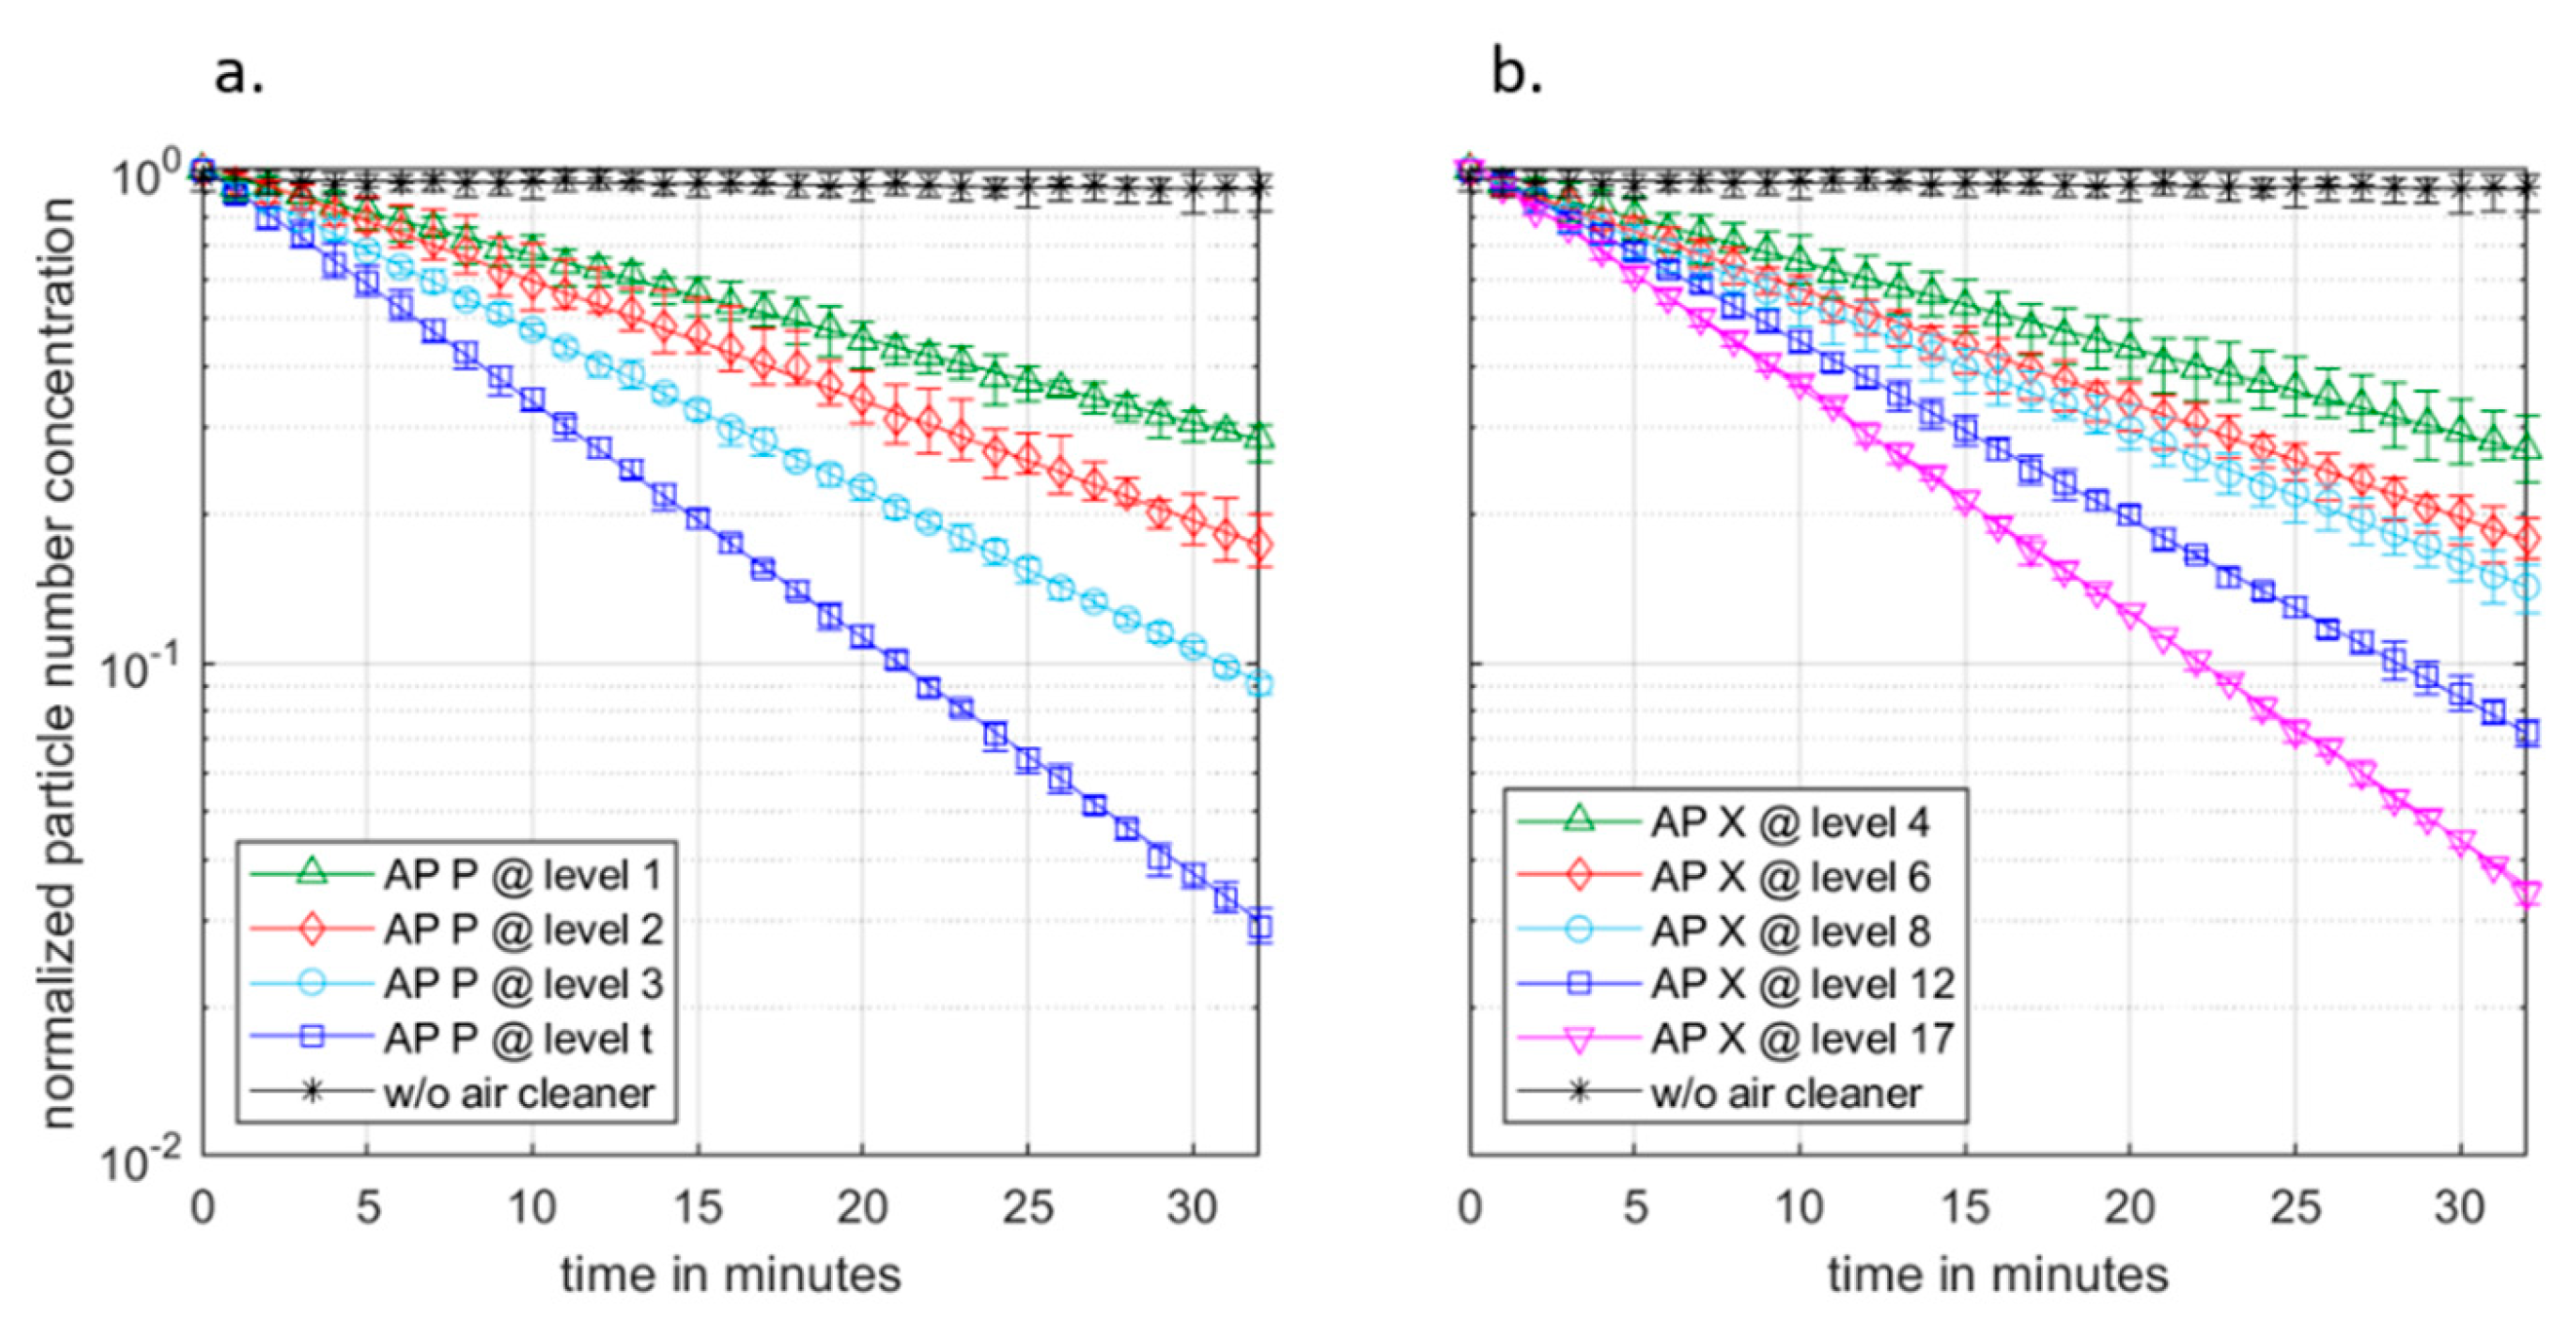
- Portable APs
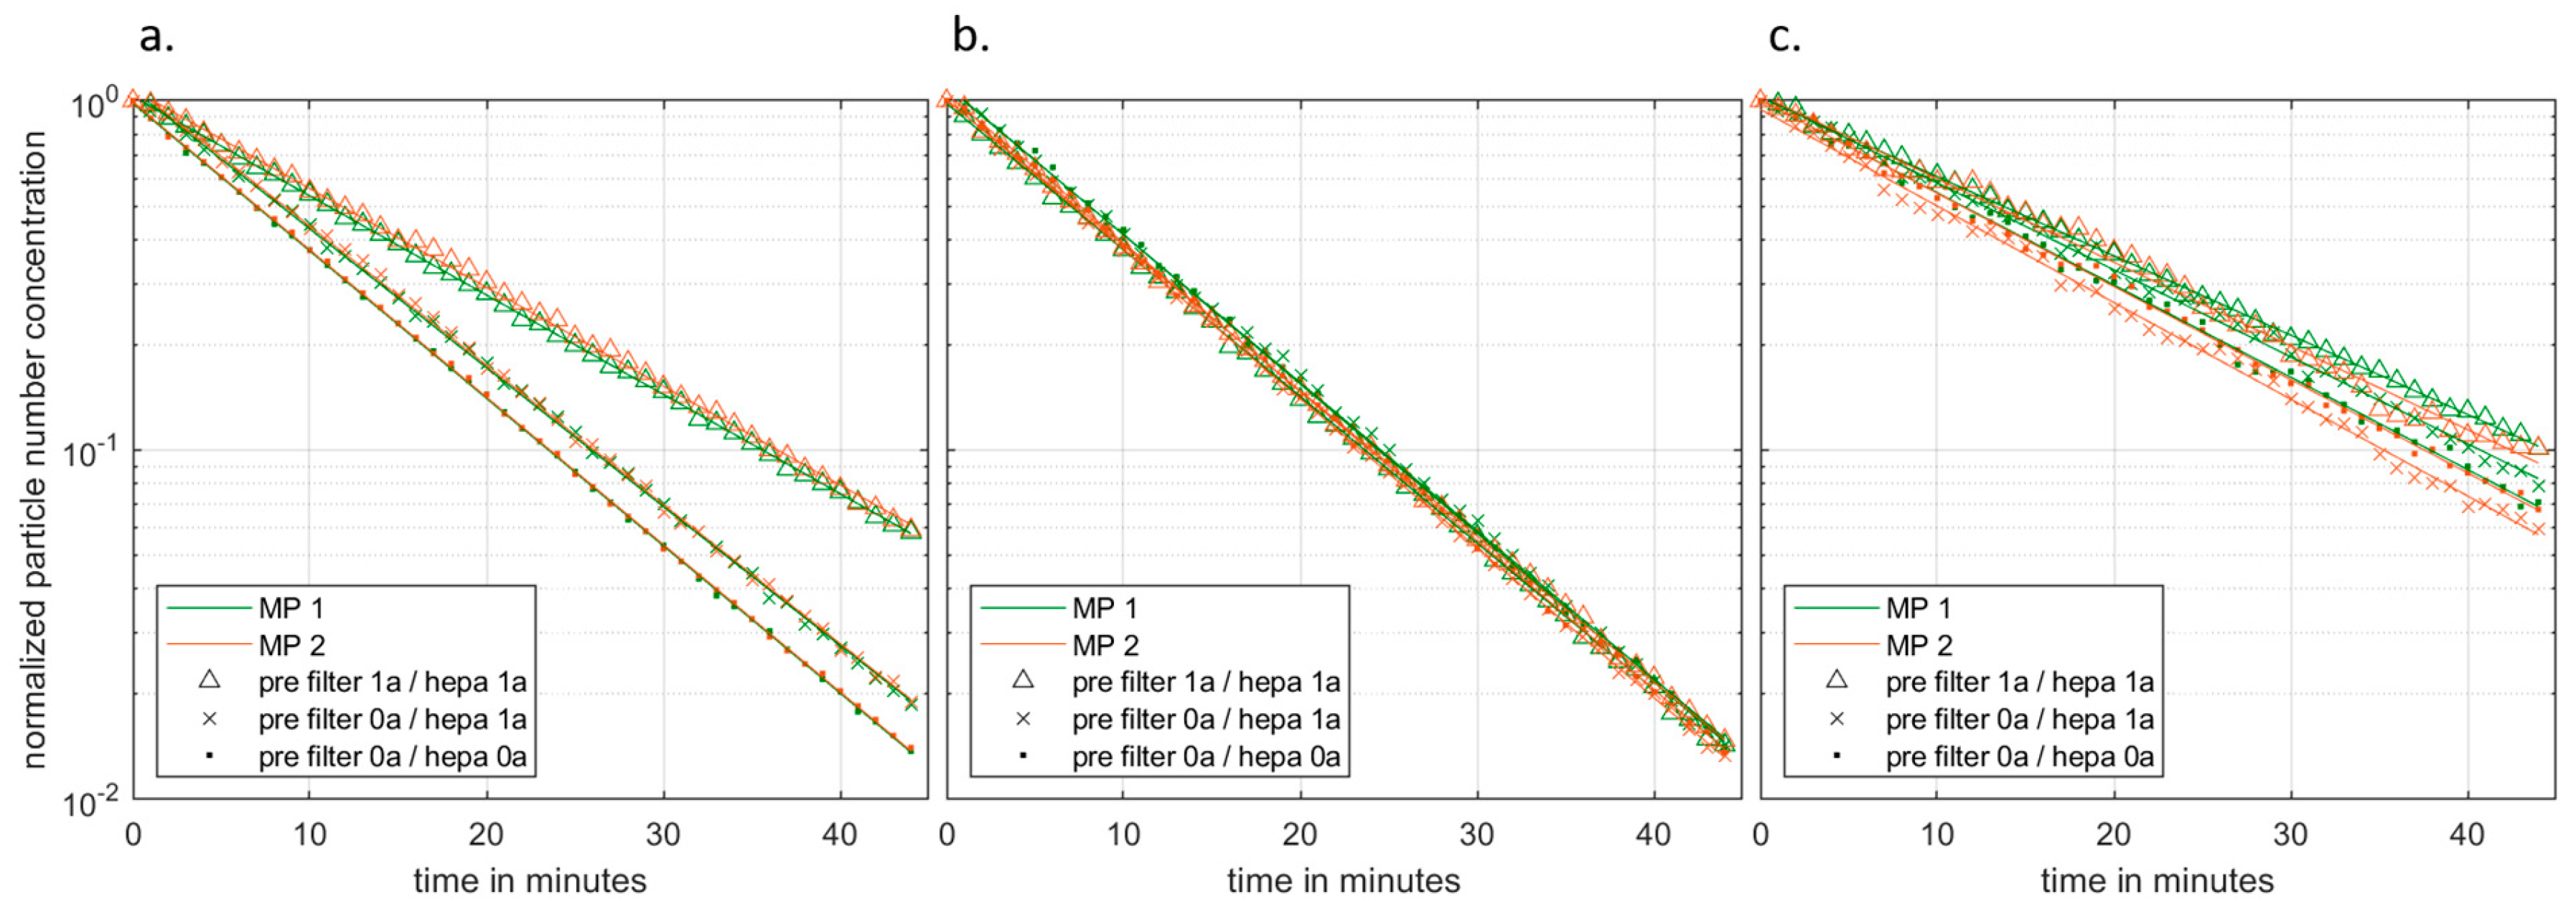
3.4. Influence of the Filter Loading Level after an Operating Period of One Year (190 Days of 8 h) (Scenario 3)
3.5. Limitations of This Study
4. Conclusions
Author Contributions
Funding
Institutional Review Board Statement
Informed Consent Statement
Data Availability Statement
Acknowledgments
Conflicts of Interest
Appendix A


| x in m | y in m | z in m | |
|---|---|---|---|
| MP 1 | 0.70 | 3.25 | 1.10 |
| MP 2 | 6.00 | 3.25 | 1.10 |
| MP 3 | 4.00 | 1.20 | 1.10 |
| MP 4 | 7.70 | 5.30 | 1.10 |
References
- Platto, S.; Wang, Y.; Zhou, J.; Carafoli, E. History of the COVID-19 pandemic: Origin, explosion, worldwide spreading. Biochem. Biophys. Res. Commun. 2021, 538, 14–23. [Google Scholar] [CrossRef] [PubMed]
- Ma, J.; Qi, X.; Chen, H.; Li, X.; Zhang, Z.; Wang, H.; Sun, L.; Zhang, L.; Guo, J.; Morawska, L.; et al. Exhaled breath is a significant source of SARS-CoV-2 emission. medRxiv 2020. [Google Scholar] [CrossRef]
- Ma, J.; Qi, X.; Chen, H.; Li, X.; Zhang, Z.; Wang, H.; Sun, L.; Zhang, L.; Guo, J.; Morawska, L.; et al. Coronavirus Disease 2019 Patients in Earlier Stages Exhaled Millions of Severe Acute Respiratory Syndrome Coronavirus 2 Per Hour. Clin. Infect. Dis. 2021, 72, e652–e654. [Google Scholar] [CrossRef] [PubMed]
- Zhang, R.; Li, Y.; Zhang, A.L.; Wang, Y.; Molina, M.J. Identifying airborne transmission as the dominant route for the spread of COVID-19. Proc. Natl. Acad. Sci. USA 2020, 117, 14857–14863. [Google Scholar] [CrossRef]
- Tan, Z.P.; Silwal, L.; Bhatt, S.P.; Raghav, V. Experimental characterization of speech aerosol dispersion dynamics. Sci. Rep. 2021, 11, 3953. [Google Scholar] [CrossRef]
- Morawska, L.; Milton, D.K. It is time to address airborne transmission of coronavirus disease 2019 (COVID-19). Clin. Infect. Dis. 2020, 71, 2311–2313. [Google Scholar] [CrossRef]
- Rocha, A.L.S.; Pinheiro, J.R.; Nakamura, T.C.; da Silva, J.D.S.; Rocha, B.G.S.; Klein, R.C.; Birbrair, A.; Amorim, J.H. Fomites and the environment did not have an important role in COVID-19 transmission in a Brazilian mid-sized city. Sci. Rep. 2021, 11, 15960. [Google Scholar] [CrossRef]
- Cheng, P.; Luo, K.; Xiao, S.; Yang, H.; Hang, J.; Ou, C.; Cowling, B.J.; Yen, H.-L.; Hui, D.S.; Hu, S.; et al. Predominant airborne transmission and insignificant fomite transmission of SARS-CoV-2 in a two-bus COVID-19 outbreak originating from the same pre-symptomatic index case. J. Hazard. Mater. 2022, 425, 128051. [Google Scholar] [CrossRef]
- Meyerowitz, E.A.; Richterman, A.; Gandhi, R.T.; Sax, P.E. Transmission of SARS-CoV-2: A Review of Viral, Host, and Environmental Factors. Ann. Intern. Med. 2021, 174, 69–79. [Google Scholar] [CrossRef]
- Marcenac, P.; Park, G.W.; Duca, L.M.; Lewis, N.M.; Dietrich, E.A.; Barclay, L.; Tamin, A.; Harcourt, J.L.; Thornburg, N.J.; Rispens, J.; et al. Detection of SARS-CoV-2 on Surfaces in Households of Persons with COVID-19. Int. J. Environ. Res. Public Health 2021, 18, 8184. [Google Scholar] [CrossRef]
- DIN CEN/TS 16976; Ambient Air—Determination of the Particle Number Concentration of Atmospheric Aerosol. Beuth: Berlin, Germany, 2016; p. 58. Available online: https://www.beuth.de/de/technische-regel/din-cen-ts-16976/247880828 (accessed on 23 August 2023).
- Fennelly, K.P. Particle sizes of infectious aerosols: Implications for infection control. Lancet Respir. Med. 2020, 8, 914–924. [Google Scholar] [CrossRef] [PubMed]
- Hartmann, A.; Kriegel, M. Risikobewertung von Virenbeladenen Aerosolen Anhand der CO2-Konzentration; Technical University Berlin, Hermann-Rietschel-Institut: Berlin, Germany, 2020; pp. 1–9. [Google Scholar] [CrossRef]
- Johnson, G.R.; Morawska, L. The Mechanism of Breath Aerosol Formation. J. Aerosol Med. Pulm. Drug Deliv. 2009, 22, 229–237. [Google Scholar] [CrossRef] [PubMed]
- Poydenot, F.; Abdourahamane, I.; Caplain, E.; Der, S.; Haiech, J.; Jallon, A.; Khoutami, I.; Loucif, A.; Marinov, E.; Andreotti, B. Risk assessment for long- and short-range airborne transmission of SARS-CoV-2, indoors and outdoors. PNAS Nexus 2022, 1, pgac223. [Google Scholar] [CrossRef]
- Fairchild, C.; Stampfer, J. Particle Concentration in Exhaled Breath. Am. Ind. Hyg. Assoc. J. 1987, 48, 948–949. [Google Scholar] [CrossRef]
- Papineni, R.S.; Rosenthal, F.S. The size distribution of droplets in the exhaled breath of healthy human subjects. J. Aerosol Med. 1997, 10, 105–116. [Google Scholar] [CrossRef] [PubMed]
- Asadi, S.; Wexler, A.S.; Cappa, C.D.; Barreda, S.; Bouvier, N.M.; Ristenpart, W.D. Aerosol emission and superemission during human speech increase with voice loudness. Sci. Rep. 2019, 9, 2348. [Google Scholar] [CrossRef] [PubMed]
- Merhi, T.; Atasi, O.; Coetsier, C.; Lalanne, B.; Roger, K. Assessing suspension and infectivity times of virus-loaded aerosols involved in airborne transmission. Proc. Natl. Acad. Sci. USA 2022, 119, e2204593119. [Google Scholar] [CrossRef]
- Fears, A.C.; Klimstra, W.B.; Duprex, P.; Hartman, A.; Weaver, S.C.; Plante, K.; Mirchandani, D.; Plante, J.; Aguilar, P.V.; Fernandez, D. Comparative dynamic aerosol efficiencies of three emergent coronaviruses and the unusual persistence of SARS-CoV-2 in aerosol suspensions. medRxiv 2020. [Google Scholar] [CrossRef]
- Jamriska, M.; Morawska, L. Quantitative Assessment of the Effect of Surface Deposition and Coagulation on the Dynamics of Submicrometer Particles Indoors. Aerosol Sci. Technol. 2003, 37, 425–436. [Google Scholar] [CrossRef]
- van Beest, M.; Arpino, F.; Hlinka, O.; Sauret, E.; van Beest, N.; Humphries, R.; Buonanno, G.; Morawska, L.; Governatori, G.; Motta, N. Influence of indoor airflow on particle spread of a single breath and cough in enclosures: Does opening a window really ‘help’? Atmos. Pollut. Res. 2022, 13, 101473. [Google Scholar] [CrossRef]
- van Doremalen, N.; Bushmaker, T.; Morris, D.H. Aerosol and Surface Stability of SARS-CoV-2 as Compared with SARS-CoV-1. N. Engl. J. Med. 2020, 382, 1564–1567. [Google Scholar] [CrossRef] [PubMed]
- Wang, C.C.; Prather, K.A.; Sznitman, J.; Jimenez, J.L.; Lakdawala, S.S.; Tufekci, Z.; Marr, L.C. Airborne transmission of respiratory viruses. Science 2021, 373, eabd9149. [Google Scholar] [CrossRef] [PubMed]
- Hyde, Z. COVID-19, children and schools: Overlooked and at risk. Med. J. Aust. 2020, 213, 444–446. [Google Scholar] [CrossRef] [PubMed]
- Torres, J.P.; Piñera, C.; De La Maza, V.; Lagomarcino, A.J.; Simian, D.; Torres, B.; Urquidi, C.; Valenzuela, M.T.; O’ryan, M. Severe Acute Respiratory Syndrome Coronavirus 2 Antibody Prevalence in Blood in a Large School Community Subject to a Coronavirus Disease 2019 Outbreak: A Cross-sectional Study. Clin. Infect. Dis. 2021, 73, e458–e465. [Google Scholar] [CrossRef]
- Stein-Zamir, C.; Abramson, N.; Shoob, H.; Libal, E.; Bitan, M.; Cardash, T.; Cayam, R.; Miskin, I. A large COVID-19 outbreak in a high school 10 days after schools’ reopening, Israel, May 2020. Eurosurveillance 2020, 25, 2001352. [Google Scholar] [CrossRef]
- Kampe, E.O.I.; Lehfeld, A.-S.; Buda, S.; Buchholz, U.; Haas, W. Surveillance of COVID-19 school outbreaks, Germany, March to August 2020. Eurosurveillance 2020, 25, 2001645. [Google Scholar] [CrossRef]
- Larsen, T.S.; Heiselberg, P. Single-sided natural ventilation driven by wind pressure and temperature difference. Energy Build. 2008, 40, 1031–1040. [Google Scholar] [CrossRef]
- Villers, J.; Henriques, A.; Calarco, S.; Rognlien, M.; Mounet, N.; Devine, J. SARS-CoV-2 aerosol transmission in schools: The effectiveness of different interventions. Swiss Med. Wkly. 2022, 152, w30178. [Google Scholar] [CrossRef]
- Duarte, R.; Gomes, M.d.G.; Rodrigues, A.M. Classroom ventilation with manual opening of windows: Findings from a two-year-long experimental study of a Portuguese secondary school. Build. Environ. 2017, 124, 118–129. [Google Scholar] [CrossRef]
- Umweltbundesamt. Richtig Lüften in Schulen. 2020. Available online: https://www.umweltbundesamt.de/richtig-lueften-in-schulen#warum-ist-ein-regelmassiger-luftaustausch-in-klassenzimmern-grundsatzlich-wichtig-und-in-der-pandemie-umso-mehr (accessed on 12 April 2023).
- Schwarzbauer, C. Studie zu Luftqualität und Ansteckungsrisiken in Deutschen Klassenzimmern. 2021. Available online: https://sci.hm.edu/startseite/newsdetail_102848.de.html (accessed on 12 April 2023).
- DIN EN 1822-1; Schwebstofffilter (EPA, HEPA und ULPA)–Teil 1: Klassifikation, Leistungsprüfung, Kennzeichnung. Beuth: Berlin, Germany, 2019.
- Mata, T.M.; Martins, A.A.; Calheiros, C.S.C.; Villanueva, F.; Alonso-Cuevilla, N.P.; Gabriel, M.F.; Silva, G.V. Indoor Air Quality: A Review of Cleaning Technologies. Environments 2022, 9, 118. [Google Scholar] [CrossRef]
- Jain, A.; Duill, F.F.; Schulz, F.; Beyrau, F.; van Wachem, B. Numerical Study on the Impact of Large Air Purifiers, Physical Distancing, and Mask Wearing in Classrooms. Atmosphere 2023, 14, 716. [Google Scholar] [CrossRef]
- Jhun, I.; Gaffin, J.M.; Coull, B.A.; Huffaker, M.F.; Petty, C.R.; Sheehan, W.J.; Baxi, S.N.; Lai, P.S.; Kang, C.-M.; Wolfson, J.M.; et al. School Environmental Intervention to Reduce Particulate Pollutant Exposures for Children with Asthma. J. Allergy Clin. Immunol. Pract. 2016, 5, 154–159.e3. [Google Scholar] [CrossRef] [PubMed]
- Park, J.-H.; Lee, T.J.; Park, M.J.; Oh, H.; Jo, Y.M. Effects of air cleaners and school characteristics on classroom concentrations of particulate matter in 34 elementary schools in Korea. Build. Environ. 2020, 167, 106437. [Google Scholar] [CrossRef] [PubMed]
- Burgmann, S.; Janoske, U. Transmission and reduction of aerosols in classrooms using air purifier systems. Phys. Fluids 2021, 33, 033321. [Google Scholar] [CrossRef] [PubMed]
- Curtius, J.; Granzin, M.; Schrod, J. Testing mobile air purifiers in a school classroom: Reducing the airborne transmission risk for SARS-CoV-2. Aerosol Sci. Technol. 2021, 55, 586–599. [Google Scholar] [CrossRef]
- Duill, F.F.; Schulz, F.; Jain, A.; Krieger, L.; van Wachem, B.; Beyrau, F. The impact of large mobile air purifiers on aerosol concentration in classrooms and the reduction of airborne transmission of SARS-CoV-2. Int. J. Environ. Res. Public Health 2021, 18, 11523. [Google Scholar] [CrossRef]
- Kähler, C.J.; Hain, R.; Fuchs, T. Assessment of Mobile Air Cleaners to Reduce the Concentration of Infectious Aerosol Particles Indoors. Atmosphere 2023, 14, 698. [Google Scholar] [CrossRef]
- VDI-EE 4300-14; Measurement of Indoor Pollution—Requirements for Mobile Air Purifiers to Reduce Aerosol-Borne Transmission of Infectious Diseases. VDI: Düsseldorf, Germany, 2021; p. 14. Available online: https://www.vdi.de/richtlinien/details/vdi-ee-4300-blatt-14-messen-von-innenraumluftverunreinigungen-anforderungen-an-mobile-luftreiniger-zur-reduktion-der-aerosolgebundenen-uebertragung-von-infektionskrankheiten (accessed on 5 January 2023).
- DIN EN 13779; Ventilation for Non-Residential Buildings—Performance Requirements for Ventilation and Room-Conditioning Systems. European Committee for Standardization: Brussels, Belgium, 2007.
- Küpper, M.; Asbach, C.; Schneiderwind, U.; Finger, H.; Spiegelhoff, D.; Schumacher, S. Testing of an Indoor Air Cleaner for Particulate Pollutants under Realistic Conditions in an Office Room. Aerosol Air Qual. Res. 2019, 19, 1655–1665. [Google Scholar] [CrossRef]
- VDI 6022-1; Ventilation and Indoor-Air Quality—Hygiene Requirements for Ventilation and Air-Conditioning Systems and Units (VDI Ventilation Code of Practice). Beuth: Berlin, Germany, 2018. Available online: https://www.beuth.de/de/technische-regel/vdi-6022-blatt-1/279023701 (accessed on 4 January 2023).
- Stiftung Warentest. Test Luftreiniger 03/2020. 2020. Available online: https://www.test.de/Luftreiniger-im-Test-5579439-0/ (accessed on 15 June 2023).
- Stiftung Warentest. Test Luftreiniger 01/2022. 2022. Available online: https://www.test.de/Luftreiniger-im-Test-5579439-0/ (accessed on 15 June 2023).
- AFS. AFS Airfilter Systeme GmbH. 2022. Available online: https://www.afs-airfilter.de/luftreiniger-gegen-keime-viren-und-bakterien/afs-2000-rlc-x.html (accessed on 2 January 2023).
- KEMPER. KEMPER GmbH. 2022. Available online: https://www.kemper.eu/de/produkte/luftreiniger-airco2ntrol_kp74708 (accessed on 2 January 2023).
- TROX. TROX GmbH. 2022. Available online: https://www.trox.de/trox-luftreiniger-67abc6362ac52506 (accessed on 2 January 2023).
- WOLF. WOLF GmbH. 2022. Available online: https://www.wolf.eu/de-de/professional/produkte-rlt/kompaktgeraete/airpurifier (accessed on 2 January 2023).
- Philips. Philips AC 2889/10. 2022. Available online: https://www.philips.de/c-p/AC2889_10R1/air-purifier-luftreiniger-generalueberholt?origin=7_700000002273300_71700000100655504__&gclid=CjwKCAiAhKycBhAQEiwAgf19euofHIdZr4hD4Hbi8eENt7hYDXuS7q1gh9myd2BHuJvqcQMBuPwIhBoC97UQAvD_BwE&gclsrc=aw.ds (accessed on 4 January 2023).
- Xiaomi. Xiaomi Air Purifier Pro. 2022. Available online: https://www.mi.com/de/product/xiaomi-air-purifier-pro/ (accessed on 4 January 2023).
- Koninklijke Philips, N.V. Unbeschwertes Lernen und Lehren. 2021. Available online: https://www.philips.com/c-dam/b2c/de_DE/experience/household/humidifier-purifier/schulen_und_universitaeten-unbeschwertes_lernen_und_lehren_an_der_ishr_in_hannover.pdf?_ga=2.55922219.1280234651.1679919520-943000547.1679919520 (accessed on 5 January 2023).
- MIL-STD-282; Filter Units, Protective Clothing, Gas-Mask Components and Related Products: Performance-Test Methods. American National Standards Institute: Washington, DC, USA, 2016. Available online: https://webstore.ansi.org/standards/dod/milstd282 (accessed on 8 June 2023).
- ISO 29463-1; High Efficiency Filters and Filter Media for Removing Particles from Air—Part 1: Classification, Performance, Testing and Marking. Beuth: Berlin, Germany, 2011. Available online: https://www.beuth.de/de/norm/iso-29463-1/280934362 (accessed on 5 February 2023).
- von Böckh, P.; Saumweber, C. Fluidmechanik A.L; Springer: Berlin/Heidelberg, Germany, 2013. [Google Scholar] [CrossRef]
- ASR A3.7. Technische Regeln für Arbeitsstätten: Lärm; Ausschuss für Arbeitsstätten: Dresden, Germany, 2018; Available online: www.baua.de (accessed on 13 March 2023).
- VDI 2081; Air-Conditioning—Noise Generation and Noise Reduction. Beuth: Düsseldorf, Germany, 2022. Available online: https://www.beuth.de/de/technische-regel/vdi-2081-blatt-1/352122916 (accessed on 4 January 2023).
- ANSI S12.60; Acoustical Performance Criteria, Design Requirements, and Guidelines for Schools. American National Standards Institute: Washington, DC, USA, 2002.
- IRK. Einsatz Mobiler Luftreiniger als Lüftungsunterstützende Maßnahme in Schulen Während der SARS-CoV-2 Pandemie Vorbemerkung Lüftungsanlagen und Lüften an Schulen. 2020. Available online: https://www.umweltbundesamt.de/sites/default/files/medien/2546/dokumente/201116_irk_stellungnahme_luftreiniger.pdf (accessed on 3 April 2023).
- DIN EN ISO 16890-1; Air Filters for General Ventilation—Part 1: Technical Specifications, Requirements and Classification System Based upon Particulate Matter Efficiency (ePM) (ISO 16890-1:2016). Beuth: Berlin, Germany, 2017. Available online: https://www.beuth.de/de/norm/din-en-iso-16890-1/254385558 (accessed on 3 January 2023).


| Source/Year | Type of AP | Country | Measurement Results |
|---|---|---|---|
| [37], 2017 | portable AP (HEPA) | US | PM2.5, black carbon (BC), noise level |
| [38], 2020 | not specified | Korea | PM2.5, PM10, CO2 |
| [39], 2021 | large AP (HEPA) | Germany | particle number concentration, particle size distribution |
| [40], 2021 | portable AP (HEPA) | Germany | particle number concentration, particle size distribution, PM10, CO2, noise level |
| [41], 2021 | 3 large APs (HEPA) | Germany | particle number concentration, particle size distribution, noise level |
| [42], 2023 | mobile AP (HEPA) | Germany | particle number concentration, air velocity, noise level |
| Type of AP | Position of Air Cleaners | ||||
|---|---|---|---|---|---|
| (L) | (S1) | (S2) | (S3) | (S4) | |
| AP A | x | ||||
| AP K | x | ||||
| AP T | x | ||||
| AP W | x | ||||
| AP P | x | x | x | x | |
| AP X | x | x | x | ||
| Manufacturer’s Information | Measured Values | ||||||||
|---|---|---|---|---|---|---|---|---|---|
| AP | Level | Volume Flow (m3/h) | Decay Rate (λAP) in 1/h | t(Ct/C0 = 0.1) in min | CADRm in m3/h | LAeq in dB(A) | P in W | ACEFs | |
| MP1 | MP2 | ||||||||
| AP A | 5 | 790 | 4.28 | 4.25 | 32.4 | 776.4 | 33.5 | 85.80 | 0.98 |
| 6 | 1060 | 5.83 | 5.83 | 23.7 | 1068.1 | 39.7 | 158.70 | 1.01 | |
| 6.5 | 1190 | 6.28 | 6.23 | 22.1 | 1147.3 | - | - | 0.97 | |
| AP K | 1000 | 1000 | 4.12 | 4.13 | 33.5 | 752.7 | 48.7 | 248.30 | 0.75 |
| AP T | 800 | 800 | 4.72 | 4.66 | 29.5 | 855.6 | 35.1 | 67.30 | 1.07 |
| 1000 | 1000 | 5.89 | 5.89 | 23.5 | 1079.3 | 40.7 | 106.15 | 1.08 | |
| 1200 | 1200 | 6.98 | 7.00 | 19.8 | 1284.3 | - | - | 1.07 | |
| AP W | 4 | 690 | 2.30 | 2.51 | 57.4 | 429.7 | 38.7 | 81.20 | 0.62 |
| 5 | 1000 | 3.61 | 3.71 | 37.7 | 663.6 | 43.2 | 162.15 | 0.67 | |
| 6 | 1200 | 4.94 | 4.97 | 27.9 | 905.0 | - | - | 0.76 | |
| Level | Decay Rate in 1/h (Range in 1/h) | t(Ct/C0 = 0.1) in min | CADRm in m3/h | in m3/h | LAeq,n = 1 in dB(A) | LAeq,n in dB(A) | Power Consumption (Pn) in W | ACEFm | |
|---|---|---|---|---|---|---|---|---|---|
| MP 1 | MP2 | ||||||||
| AP P (n = 4) | |||||||||
| 1 | 2.35 (0.01) | 2.38 (0.13) | 58.4 | 423.7 | - | <30.0 | 32.1 | 22.4 | - |
| 2 | 3.36 (0.08) | 3.45 (0.05) | 40.6 | 617.5 | 614 | 38.7 | 41.1 | 39.8 | 1.01 |
| 3 | 4.48 (0.18) | 4.53 (0.06) | 30.7 | 822.6 | 857 | 45.2 | 47.9 | 70.0 | 0.96 |
| t | 6.58 (0.01) | 6.59 (0.08) | 21.0 | 1210.3 | 1289 | 53.9 | 56.4 | 174.9 | 0.94 |
| AP X (n = 3) | |||||||||
| 4 | 2.36 (0.23) | 2.49 (0.09) | 57.0 | 434.9 | - | 32.4 | 35.2 | 22.2 | - |
| 6 | 3.12 (0.02) | 3.31 (0.03) | 43.0 | 582.1 | - | 40.2 | 43.2 | 36.1 | - |
| 8 | 3.55 (0.10) | 3.71 (0.02) | 38.1 | 659.5 | 606 | 42.1 | 45.1 | 48.2 | 1.09 |
| 12 | 4.94 (0.04) | 5.03 (0.03) | 27.7 | 912.1 | 885 | 49.6 | 52.5 | 96.5 | 1.03 |
| 17 | 6.31 (0.02) | 6.38 (0.01) | 21.8 | 1165.6 | 1138 | 55.3 | 58.0 | 168.4 | 1.02 |
| Usage Period in a | Measured Values | ||||||||
|---|---|---|---|---|---|---|---|---|---|
| AP | Prefilter | HEPA Filter | Decay Rate (λAP) in 1/h | t(Ct/C0 = 0.1) in min | CADRm in m3/h | LAeq in dB(A) | P in W | ACEFs | |
| MP1 | MP2 | ||||||||
| AP A | 0 a | 0 a | 5.80 | 5.75 | 23.9 | 1058.6 | 38.7 | 158.7 | 1.00 |
| 0 a | 1 a | 5.50 | 5.50 | 25.1 | 1007.6 | - | - | 0.95 | |
| 1 a | 1 a | 3.86 | 3.88 | 35.7 | 703.9 | 38.6 (a) | 156.2 (a) | 0.66 | |
| AP T | 0 a | 0 a | 5.90 | 5.87 | 23.5 | 1079.5 | 40.7 | 106.2 | 1.08 |
| 0 a | 1 a | 5.94 | 5.84 | 23.5 | 1080.9 | 40.6 | 109.0 | 1.08 | |
| 1 a | 1 a | 5.77 | 5.73 | 24.0 | 1053.9 | 40.5 | 122.0 | 1.05 | |
| AP W | 0 a | 0 a | 3.64 | 3.70 | 37.6 | 667.4 | 43.2 | 162.2 | 0.67 |
| 0 a | 1 a | 3.42 | 3.85 | 38.0 | 660.2 | - | - | 0.66 | |
| 1 a | 1 a | 3.14 | 3.35 | 42.6 | 587.4 | 44.6 | 151.7 | 0.59 | |
Disclaimer/Publisher’s Note: The statements, opinions and data contained in all publications are solely those of the individual author(s) and contributor(s) and not of MDPI and/or the editor(s). MDPI and/or the editor(s) disclaim responsibility for any injury to people or property resulting from any ideas, methods, instructions or products referred to in the content. |
© 2023 by the authors. Licensee MDPI, Basel, Switzerland. This article is an open access article distributed under the terms and conditions of the Creative Commons Attribution (CC BY) license (https://creativecommons.org/licenses/by/4.0/).
Share and Cite
Duill, F.F.; Schulz, F.; Jain, A.; van Wachem, B.; Beyrau, F. Comparison of Portable and Large Mobile Air Cleaners for Use in Classrooms and the Effect of Increasing Filter Loading on Particle Number Concentration Reduction Efficiency. Atmosphere 2023, 14, 1437. https://doi.org/10.3390/atmos14091437
Duill FF, Schulz F, Jain A, van Wachem B, Beyrau F. Comparison of Portable and Large Mobile Air Cleaners for Use in Classrooms and the Effect of Increasing Filter Loading on Particle Number Concentration Reduction Efficiency. Atmosphere. 2023; 14(9):1437. https://doi.org/10.3390/atmos14091437
Chicago/Turabian StyleDuill, Finn Felix, Florian Schulz, Aman Jain, Berend van Wachem, and Frank Beyrau. 2023. "Comparison of Portable and Large Mobile Air Cleaners for Use in Classrooms and the Effect of Increasing Filter Loading on Particle Number Concentration Reduction Efficiency" Atmosphere 14, no. 9: 1437. https://doi.org/10.3390/atmos14091437