
Air Temperature Variability of the Northern Mountains in the Czech Republic


1
Department of Geography, Masaryk University, 611 37 Brno, Czech Republic
2
Global Change Research Institute, Czech Academy of Sciences, 603 00 Brno, Czech Republic
3
Czech Hydrometeorological Institute, 616 67 Brno, Czech Republic
*
Author to whom correspondence should be addressed.
Atmosphere 2023, 14(7), 1063; https://doi.org/10.3390/atmos14071063
Submission received: 16 May 2023
/
Revised: 12 June 2023
/
Accepted: 20 June 2023
/
Published: 23 June 2023
(This article belongs to the Special Issue Climate Variability and Human Impacts in Central Europe Based on Documentary and Instrumental Data)
Abstract
:Analysis of a long-term temperature variability of mountains has been neglected for a long time. Here we homogenised and reconstructed four temperature series (1961–2020) of selected mountain stations situated above 1000 m representing the area of northern Moravian mountain ridges (the Czech Republic) and their spatiotemporal variability was examined. A statistically significant increase of 10-year linear trends of annual (0.26–0.38), summer/winter half-year and seasonal mean temperatures were found at most stations. Summer (JJA) was detected as the season with the highest mean temperature increase between 1961–1990 and 1991–2020 normal periods (1.5 °C). From the spatial point of view, the climate conditions were becoming warmer faster in higher elevations compared to the lower ones. At all stations, a statistically significant decrease in ice and frost days was observed (−9.1–19.9 and −9.5–16.3, respectively). Moreover, it was proved that the temperature series of a newly established Vysoká hole station are representative enough and comparable with measurements of other meteorological stations in the studied region. This research provided valuable insight into the temperature variability of mountain ridges and the results completed our sparse knowledge about temperature changes in the mountain regions in Central Europe.
1. Introduction
Air temperature is one of the most significant meteorological variables affecting both environmental processes [1,2,3] and human activities and health [4,5,6]. During human-induced climate change [7], the global mean temperature in 2022 was estimated to be about 1.15 °C above the referenced preindustrial 1850–1900 period [8]. However, the rate of increasing temperatures differs from the global mean as well as regionally and for various altitudes [9]. Increasing air temperature might have a direct effect on, for instance, mountain ecosystems [10], changes in upper timberline [11] or snow cover extent and duration [12]. Therefore, despite the lower density of meteorological stations, the higher altitudes represented by high mountains are a good indicator of recent global warming because the summit locations avoid lower-elevation noise [13].
So far, insufficient attention has been paid to the analysis of temperature variability on mountain ridges and their differences compared to the surrounding lowlands. For instance, temperature variability in the mountain regions of the North Caucasus (1961–2013) was analyzed by Tashilova et al. [14]. Navarro-Serrano et al. [15] studied elevation effects on air temperature in a Mountain Valley in the Pyrenees from September 2016 to June 2019. Increasing linear trends of long-term daily minimum and maximum air temperatures at the 29 low-lying and mountain stations in Central Europe in the 1901–1990 period were detected by Weber et al. [16]. Finally, Jurczak and Kędzia [17] analyzed air temperature patterns of the alpine zone in the Polish part of the Tatra Mountains (hereafter Mts.) during 2004–2009.
In the Czech Republic, research on air temperature variability has been frequently conducted from a long-term perspective, primarily based on measurements of lowland stations. For instance, Brázdil et al. [18] detected a statistically significant rise in air temperature trends for spring (0.34 °C/10 years), summer (0.36 °C/10 years) and the years (0.27 °C/10 years) between 1961–2005. Spatial temperature variability in the CR during 1961–1990 was studied by Křížová [19], who proved the enhanced influence of elevation on air temperature. Zahradníček et al. [20] revealed a decrease in the recent warming rate in the seasonal and annual temperature series with increasing altitude as they demonstrated, e.g., for the trends of annual series at the lowland (<300 m, 0.37 °C/10 years) and mountain (>900 m, 0.27 °C/10 years) stations in the 1961–2019 period. A continuous increase in air temperature between 1.5–2 °C (in 2050, with respect to 1981–2010) is also expected in the CR depending on applied emission scenarios (RCP4.5 and RCP8.5, respectively) [21].
On the other hand, analyses of air temperature variability at the Czech mountain stations are relatively scarce. Based on measurements in the Bohemian borderland mountains, Jůza et al. [22] presented the temperature minima recorded in the frost hollows in the 1983–2010 period. In a similar fashion, Jůza [23] compared daily minimum air temperatures and their accompanying weather characteristics between two selected meteorological stations in the Jizera Mountains in 1984–2010. Prevailing general climate conditions of the Giant Mts. (the Krkonoše Mountains) were analyzed by Coufal and Šebek [24], and Kliegrová et al. [25] were one of the first to turn attention to changing climate in the Giant Mts. based on changes in the relationship between elevation and mean temperature in 1961–2007. In the following study, an increase in mean annual temperature of about 1 °C in the Giant Mts. between 2001–2016 (compared to 1961–2000) was detected by Kliegrová and Kašičková [26].
In comparison with other mountain regions, only a few recent studies have paid attention to the northern Moravian mountain ridges, represented by the Hrubý Jeseník and Králický Sněžník Mts. The climate conditions of the highest Hrubý Jeseník Mts. peak, Praděd, in the 1951–1960 period were described by Tejnská and Tejnský [27]. Similarly, Lednický et al. [28] and Lednický [29,30] analyzed the climate conditions of the Hrubý Jeseník summits using Praděd as the example. More recently, Zahradník et al. [31] studied the climate characteristics of the alpine environment in the summits of the Hrubý Jeseník and Králický Sněžník Mts. Increasing temperatures at four meteorological stations in the Jeseníky region since the 1960s were verified by Kliment et al. [1]. Despite the availability of a relatively short series of air temperatures from various mountain stations in this region over the last decades, a detailed analysis of air temperature variability in the studied region has not been conducted yet.
This paper aims to homogenize, reconstruct, and analyze the spatiotemporal variability of air temperature in the mountain stations above 1000 m a.s.l. in the Hrubý Jeseník and Králický Sněžník Mts. between 1961–2020. The second aim of the study is to introduce the newly constructed Vysoká hole station (1464 m a.s.l.) as the highest-situated running station in the studied area and validate its temperature series in comparison with measurements with other stations. Section 2 briefly describes the study area of particular meteorological stations. Applied data and methods employed for air temperature reconstruction are presented together with a short description of the history of these meteorological measurements and the instruments used in Section 3. Section 4 provides the results of the air temperature reconstruction based on measurements from four meteorological stations in the 1961–2020 period and validates the temperature series of the new station at Vysoká hole. Section 5 discusses data uncertainty and the relation of geographical characteristics to temperature variability and concludes with some closing remarks.
2. Materials and Methods
2.1. The study Area
The area studied is situated on the borderland of northern Moravia and Czech Silesia (the Hrubý Jeseník Mts.) and eastern Bohemia (the Králický Sněžník Mts.) in the CR (Figure 1). The Hrubý Jeseník Mts., the second-highest mountain range in the CR, extends around 523 km2 with the highest point, Praděd (1492 m a.s.l.) and a mean elevation of 887 m. In total, 56 main peaks in the Hrubý Jeseník Mts. exceed the elevation of 1000 m [32]. The three main ridges divided by deep valleys are oriented in the northeastern–southwestern and northwestern–southeastern directions [33].
The climatic conditions in the northern Moravian mountains are determined by multiple atmospheric and geographical factors. On a regional level, their position within the transitional zone between oceanic and continental temperate climate zones puts them into the pathways of weather systems (highs, lows and fronts) with various origins (the Atlantic Ocean, the Mediterranean or Eurasia) [34]. However, when focusing on a more local level, the location of a given place with respect to the airflow and the orography (altitude and windward/leeward effects) is particularly important, especially in the case of precipitation [35]. The mean annual precipitation totals during the 1961–2020 period fluctuated around 1050 mm and windward/leeward effects experienced an annual course with a maximum during winter and a minimum in summer as the only season with a slight predominance of convective precipitation [36]. The mountain summits are among the coldest areas in the CR with the mean annual temperatures ranging between 4–5 °C at an altitude of around 1000 m and 1–2 °C at the highest peaks. The vertical gradient of temperatures experiences a distinctive minimum (approx. 0.3 °C/100 m) during late autumn and winter, caused mostly by frequent inversion situations and a steady maximum (approx. 0.7 °C/100 m) during late spring and summer [37]. Dissected relief and high altitudinal differences are the main factors of considerable local climate contrasts between the summits and lowlands represented by frequent inversion situations [33]. Because of the high altitudinal range, various vegetation zones exist here, from deciduous forests to alpine grassland. Most slopes are afforested mainly by beech (Fagus sylvatica) and spruce (Picea abies), reaching the upper timberline between 1100–1430 m a.s.l.
The neighboring Králický Sněžník Mts. (86.3 km2) with the eponymous highest point (1423 m a.s.l.) have similar physical–geographical conditions as the Hrubý Jeseník Mts. (i.e., cryogenic forms, climate and vegetation characteristics). The northern–southern-oriented ridges of the third highest mountain range in the CR (mean elevation 930.9 m) stretch to Poland.
2.2. Meteorological Stations
The beginning of meteorological measurements in the Hrubý Jeseník Mts. summits dates back to the 1897–1913 period at the Šerák cottage (1328 m a.s.l.) followed by precipitation measurements at the Ovčárna cottage (1306 m a.s.l.) since 1933. The first recorded temperature measurements came from the Praděd station (1941–1945), which became the base for one of the highest situated (1492 m a.s.l.) meteorological stations in Czechoslovakia (and subsequently the CR) in the 1954–1997 period. Measurements made at the Šerák station, the highest-situated meteorological station in the CR [38], have been made since 2004 upon the substitution of the Praděd station in 1997. Despite the end of the measurements, the Praděd air temperature series (1946–1997) are the longest continuously available series representing the temperature conditions of northern Moravian mountain peaks [39,40].
However, air temperature measurements at synoptic and climatological meteorological stations at the Hrubý Jeseník Mts. in the second half of the 20th century were characterized by their inconsistency and spatiotemporal variability [38]. In the Králický Sněžník Mts. (Figure 1), the oldest meteorological measurements situated above 1000 m a.s.l. come only from 2010 (Paprsek station, 1006 m a.s.l.).
Lipina [41] proposed defining a mountain meteorological station as a location situated at altitudes above 1000 m a.s.l. and requested higher demands for the operation. In 2017, only 25 running meteorological stations of the Czech Hydrometeorological Institute (CHMI) network met these requirements, and just three of these mountain stations were situated in the studied area. For the purpose of this study, only stations situated above 1000 m a.s.l. and supplemented by meteorological stations outside of the current CHMI network were considered adequate to represent the temperature conditions of mountain ridges. Finally, five stations complying with the conditions were selected for further analysis (see Figure 1, Table 1).
Three of these stations represent the Hrubý Jeseník Mts. and two of them are the Králický Sněžník Mts. Except for the Praděd station, all other stations still provide the continual measurements of mean, maximum and minimum temperature in 5–15-min intervals depending on the period of the measurements. Apart from the Vysoká hole station (1464 m a.s.l.), all stations are part of the CHMI network. Concerning the broader surroundings of selected stations, areas up to an altitude of approx. 1350 m are mostly forested, but the vicinity of stations above this altitude is without forests and, therefore, more exposed to wind.
The Vysoká hole station (1464 m a.s.l.) was the only one built by Masaryk University (Brno, Czech Republic) and put into operation on the 7th of October 2017 (see Figure 2). The station was situated at the top of the mountain Vysoká hole (the Hrubý Jeseník Mts.) above the timberline surrounded by alpine grassland and a small dwarf pine plantation. This plantation has now disappeared, and the station is surrounded only by alpine grassland. One of the purposes of the station was to obtain relevant microclimate data representing the alpine grassland area within the ECOPOLARIS research project. The station measures mean, maximum and minimum temperatures (°C) at 2 m’ height in 10-min intervals using an EMS33R sensor (EMS Brno, Czech Republic) with an accuracy of ±0.15 °C. The temperature sensor was placed in a naturally ventilated radiation shield and calibrated regularly every year. The station fulfills the same technical demands as the stations within the CHMI network. Moreover, according to the World Meteorological Organization’s (WMO) Guide to Meteorological Instruments and Methods of Observation [43], the station meets most WMO requirements. Therefore, the station appropriately complements the relatively sparse meteorological station network above 1000 m a.s.l. both in the northern Moravian region and the Czech mountains generally.
2.3. Data and Methods
The meteorological measurements used in this study include daily mean, maximal and minimal air temperature data of five meteorological stations in the Hrubý Jeseník and Králický Sněžník Mts. representing the mountain ridge conditions. The original temperature series are of various lengths ranging between 52 years (Praděd) and five years (Vysoká hole). The time series of four selected stations (Paprsek, Slaměnka, Šerák, Praděd) were homogenised and reconstructed into a technical series covering the entire 1961–2020 period.
The data process was part of the broad homogenization and interpolation of the Czech time series of multiple meteorological variables. The original time series underwent thorough quality control, homogenization and filling of missing data (to have a consistent input dataset both in time and space), according to Štěpánek et al. [39,40,44]. The daily data were interpolated for the area of the whole CR by a regression-kriging method using geographical coordinates, elevation, and other terrain characteristics as predictors into gridded data with a spatial resolution of 500 m. To ensure that the maps preserve measured values at the station locations, another layer with interpolated residuals (at station locations) was added to the interpolation model. The relationship between predictors and a predictand was estimated individually for each meteorological variable and each day. Only predictors significant for the regression were used for the final estimates. For each of the cases, the best type of semi-variogram was assessed. Within the area of the CR, the technical series for 268 climatological stations was applied, with the average minimum distance between two neighboring stations being approx. 10 km. For a more detailed description, see Štěpánek et al. [39].
Spatial variability was based on interpolated layers with 500-m spatial resolution. The studied area above 1000 m a.s.l. consisted of 736 grids and for the next analysis of changes in temperature gradient between two normal periods, the studied area was divided into five levels (1000–1099 m a.s.l., 1100–1199 m a.s.l., etc.). In the next step, temperature variability of the studied area above 1000 m a.s.l. was assessed within the whole area of the northern Moravian Mts. (i.e., from 200 m to 999 m a.s.l.). For the purpose of smoother visualization in the presented maps, gridded layers were further interpolated via the Inverse Distance Weighting (IDW) method into 25 m × 25 m resolution in the ArcGIS ArcMap 10.4 software.
Long-term variability of the analyzed time series and vertical temperature gradient was assessed using a linear regression model and calculating 10-year linear trends and 100-m gradients, respectively. Their statistical significance was tested at a significance level of 0.05. Similarly, temperature differences between normal periods were tested at a significance level of 0.05 via paired t-tests.
To reveal temperature variability, a 60-year-long study period was divided into two climate normals (1961–1990 and 1991–2020) and selected characteristic days were analyzed. An arctic day was considered such a day when the maximum daily air temperature achieved maximally −10.0 °C. An ice day was defined as a day on which the maximum air temperature did not reach 0.0 °C, and in the case of a frost day, the minimum air temperature fell below 0 °C. Finally, during summer days, the maximum air temperature reached 25.0 °C [45].
In order to investigate the seasonal course of temperature variability and its changes between the 1961–1990 and 1991–2020 periods, daily anomalies of mean, maximum and minimum temperature and temperature amplitude were calculated for four selected stations (Paprsek, Slaměnka, Šerák, Praděd) for the whole 1961–2020 period, using anomalies from the running mean within the 21-day window for each day of the year and each station.
To compare the reconstructed temperature series (1961–2020) of four selected stations (Paprsek, Slaměnka, Šerák, Praděd) representing the northern Moravian Mountain ridges with other Czech mountains, 20-year moving trends of annual and seasonal (spring—MAM, summer—JJA, autumn—SON, winter—DJF) mean (TAVG), maximum (TMAX) and minimum (TMIN) temperatures between the studied region and the Giant Mts. and the Bohemian Forest in the 1980–2020 period were calculated. Both the Giant Mts. and the Bohemian Forest are border mountain ranges in northern and southwestern Bohemia, respectively. In each compared mountain range, four meteorological stations included in the CHMI network were selected. All selected stations are situated in similar climatic conditions to be comparable with the stations in the Hrubý Jeseník and Králický Sněžník Mts., i.e., similar altitudes, location near the mostly forested mountain ridge, out of the frost hollows and having the longest possible time series. For the next analysis, in total, eight stations were selected (for more details, see Appendix B).
3. Results
3.1. Mean, Maximal and Minimal Air Temperatures
Decadal linear trends of mean monthly, seasonal, annual and summer/winter half-year TAVG at the Paprsek, Praděd, Slaměnka and Šerák stations in the 1961–2020 period were calculated and their statistical significance at a level of 0.05 was tested (see Table 2). A statistically significant 10-year increase of linear trends of annual TAVG at all analyzed stations ranged from 0.26 °C (the Šerák station) to 0.38 °C (the Praděd station). Unexpectedly, the lowest increase was recorded at the second highest-situated station of all analyzed stations (Figure 3).
Concerning the seasonal 10-year trends (Figure 4), all stations showed a statistically significant increase for the spring (MAM), summer (JJA) and winter (DJF) seasons (from 0.28 in DJF at the Šerák station to 0.52 in JJA at the Slaměnka station). Statistically significant increasing trends in autumn (SON) were recorded only for the Praděd (0.29°C/10 years) and Slaměnka (0.18 °C/10 years) stations. The highest temperature 10-year trend was the most noticeable in JJA (0.39–0.52 °C), followed by MAM (0.28–0.39 °C) and DJF (0.28–0.40 °C).
Except for the decreasing (statically insignificant) 10-year linear trend in October at the Šerák station, all other decadal monthly trends were increasing, and two-thirds (66%) were also statistically significant. Statistical significance at all stations was registered from April to August and from November to December. On the other hand, February, September and October did not show any statistically significant trends at any station. The temperature increase of 0.57 °C/10 years in August at the Slaměnka station represented the highest trend and the lowest temperature increase per 10 years was detected in October at the Paprsek station (0.01 °C).
Higher increasing trends were detected for all stations in the summer half-year compared to the winter half-year (all trends for half-years were statistically significant), caused mainly by the April–August period with significantly increasing trends present for all stations and individual months, while September showed only minor statistically insignificant increases. Despite an almost 400-metre elevation difference, nearly identical increasing trends in the summer half-year appeared at the Slaměnka (0.42 °C/10 years) and Praděd (0.41 °C/10 years) stations. The Praděd station was also the station with the most rapidly growing decadal trend in the winter half-year (0.37 °C), opposite the lowest increasing trend at the Šerák station (0.23 °C).
3.2. Comparison of Normal Periods
Annual TAVG, TMAX and TMIN at the four studied stations were compared between two normal periods (1961–1990 and 1991–2020). As Table 3 shows, annual TAVG, TMAX and TMIN statistically significantly increased between both periods. The most pronounced mean temperature differences between the normal periods were recorded for TMAX (1.17°C) followed by TMIN (0.94 °C) and TAVG (0.91 °C). Specifically, the highest differences were registered at the Praděd (TMAX 1.33 °C) and Slaměnka (TMAX 1.29 °C) stations, i.e., at the highest situated and, respectively, the third-highest situated station. Similarly, at the same stations, the highest temperature differences of TMIN (identically 1.06 °C) and TAVG (Slaměnka 1.03 °C, Praděd 1.01 °C) were recorded. On the other side, the lowest differences for TAVG, TMAX and TMIN always appeared at the Šerák station (1328 m a.s.l.). As can be seen from the results, the highest recorded temperature increase between both periods did not directly coincide with the actual station altitude (i.e., the highest increase did not occur at the lowest situated station and vice versa, as can be assumed).
Regarding the mean seasonal temperature differences of TAVG, TMAX and TMIN between both periods, temperature increase in the 1991–2020 period was detected in all seasons (see Table 4). Temperature differences were statistically significant for all three characteristics in MAM, JJA and summer/winter half-year. The highest temperature differences were detected for TMAX in all seasons (except for SON), followed by TAVG (particularly in MAM, JJA) and TMIN (SON, DJF). In the seasonal pattern, the most intensive warming happened in JJA at all stations (especially TMAX: 1.97 °C, the mean of all stations), followed by MAM, DJF and SON (only 0.44 °C increase in the case of TAVG for all stations but statistically insignificant). The only statistically significant temperature difference between both periods in SON was recorded for TMIN (0.62 °C). Looking at the summer/winter half-year mean temperature differences between normal periods, except for the Šerák station (TAVG, TMIN) in the winter half-year, all differences were statistically significant. However, the summer half-year warmed more rapidly in 1991–2020 compared to 1961–1990 (1.2 °C/TAVG, 1.61 °C/TMAX, 1.15 °C/TMIN) and more intensively than in the winter half-year.
Mean monthly temperature differences of TAVG, TMAX and TMIN between the 1961–1990 and 1991–2020 periods show the temperature increase in the second period in all months except for October (not shown). July, August and April were among the most rapidly warming months. On the other hand, statistically insignificant cooling in October was recorded for TAVG and TMAX at the Slaměnka (−0.12 °C and −0.31 °C, respectively), Paprsek (−0.18 °C and −0.39 °C) and Šerák (−0.36 °C and −0.31 °C) stations. Šerák was also the only station with a negative temperature difference in October in the case of TMIN (−0.16 °C). Positive monthly differences are in line with increasing decadal linear trends of mean monthly temperatures (see Table 2).
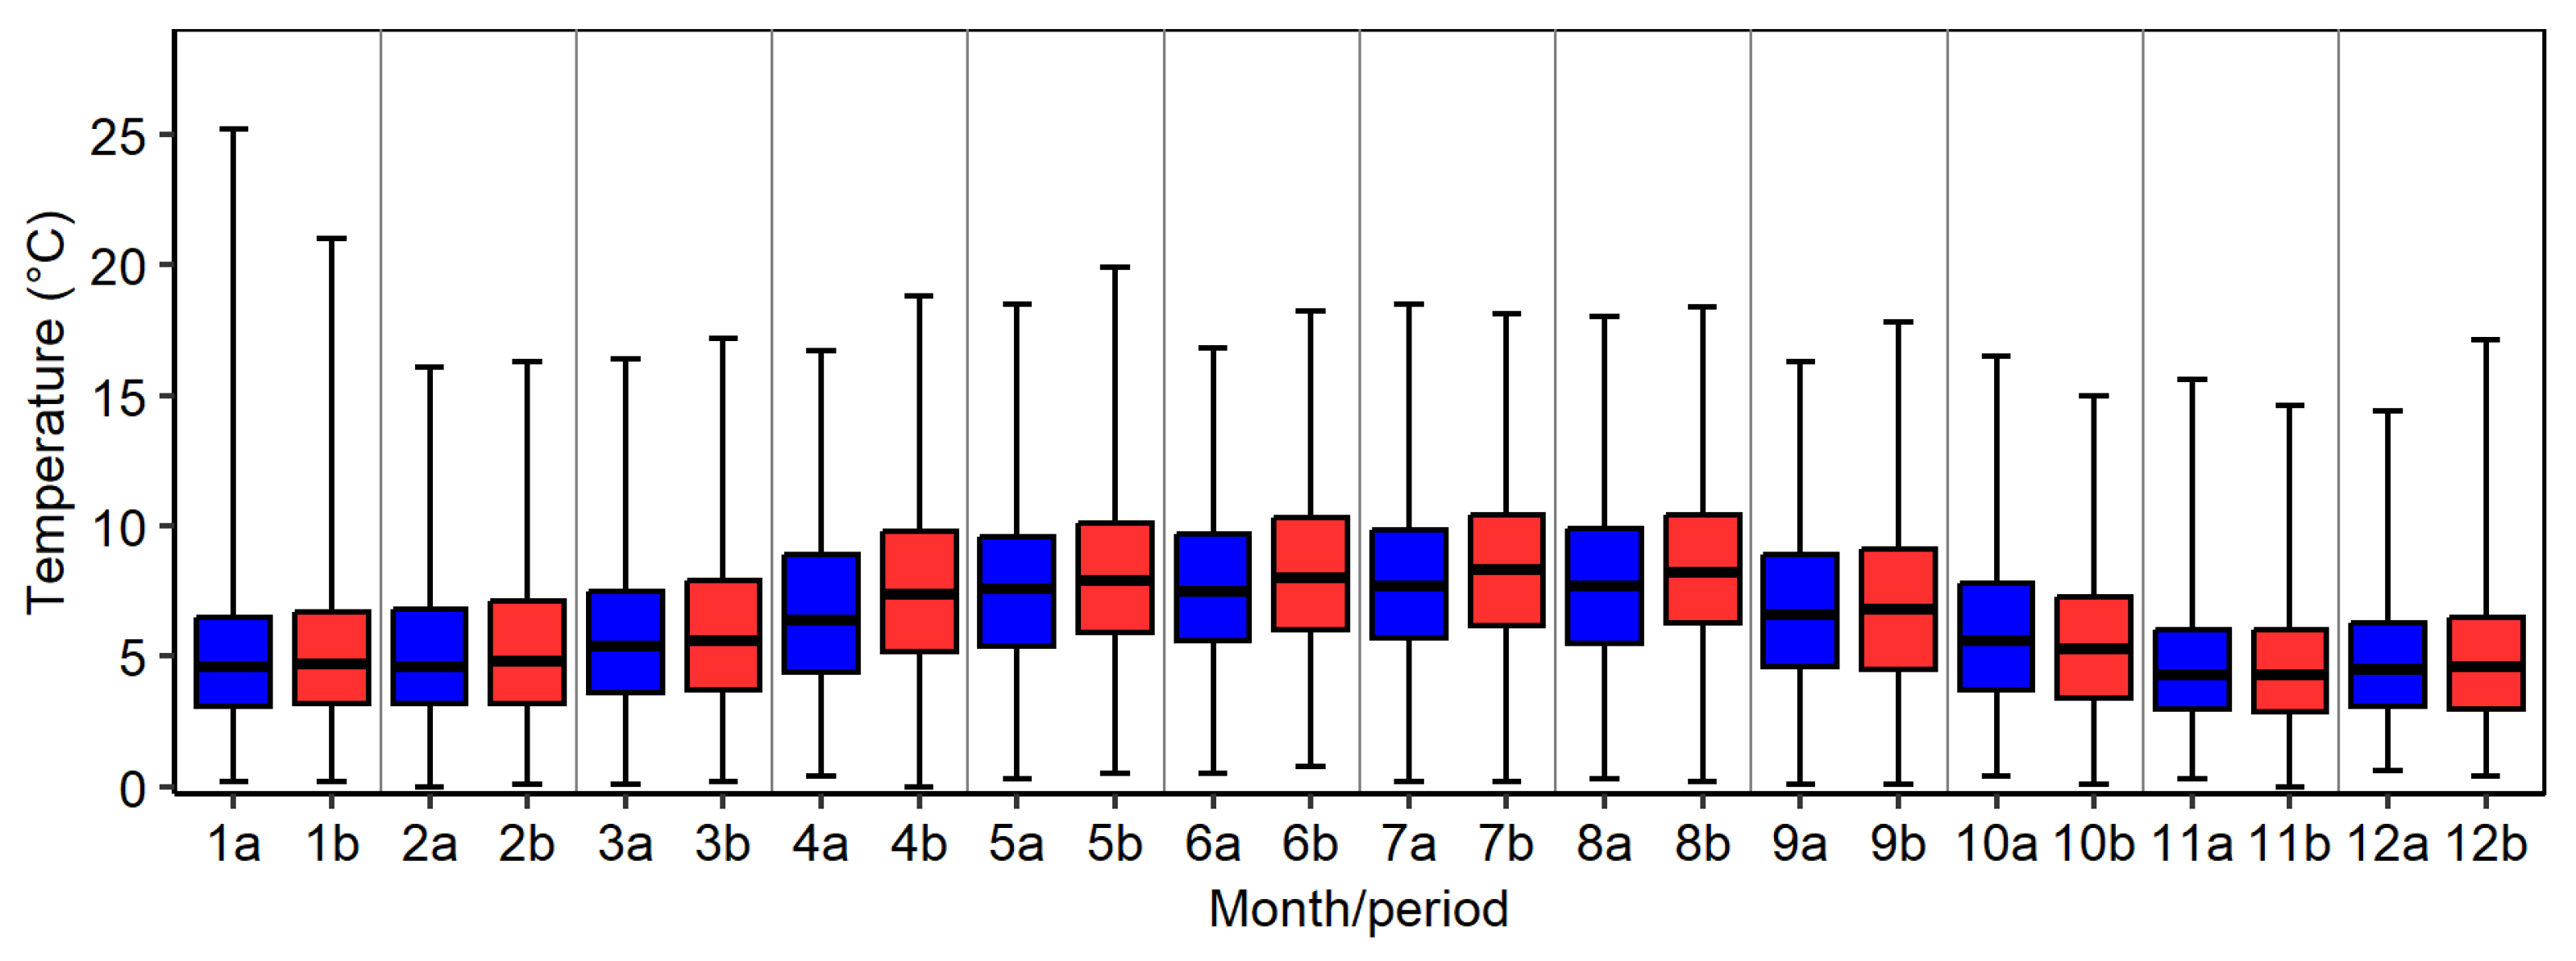
In order to compare the variability of daily temperature amplitudes between individual months and the 1961–1990 and 1991–2020 periods, daily amplitudes based on means for each day of the year for the whole 1961–2020 period smoothed by a 21-day window for each station were calculated and visualized using box plots, which include data for the four stations altogether (Figure 5). Every month is represented by boxplots for both 30-year periods (e.g., January of 1961–1990 and January of 1991–2020), enabling their direct comparison in the context of annual variations of included variables. Higher median temperature amplitudes were recorded in the 1991–2020 period, particularly in the summer half-year, but there is no clear pattern in amplitude variability changes.
Similarly, daily mean, maximum and minimum temperature anomalies were visualized in the same way (Appendix A). Median temperature anomalies were higher in all months in the second period compared to the first, while there were no significant changes in variability. The annual course of the variability shows a decline during the summer months in the case of mean and maximum and particularly minimum temperature anomalies.
Valuable insights into temperature variability can be gained by studying the mean annual number of selected characteristic days as defined in Section 2.3. (Table 5). In general, the number of the arctic, ice and frost days at the individual stations increased in both periods with the increasing elevation of the stations studied (and decreased in the case of summer days). Comparing both periods, the mean annual number of arctic, ice and frost days decreased in 1991–2020, but only a decrease in the number of ice and frost days was statistically significant at all stations. In this sense, the highest differences between both periods were recorded for the highest Praděd station (−19.9 days) and the lowest for the Šerák station (−9.1 days; the second-highest placed station). A statistically significant decrease in arctic days was reported only at the Praděd station (−5.2 days). In contrast, an increase in summer days was detected at the Paprsek, Slaměnka and Šerák stations (statistically significant). At all stations, one tropical day in 1961–1990 and 11 tropical days and even three tropical nights were recorded in 1991–2020.
Taking into account the differences between both periods, the most enhanced decrease occurred in the number of ice and frost days at the Praděd station (−19.9 and −16.3, respectively), followed by lower decreases at the Slaměnka and Šerák stations (statistically significant). Moreover, a notable increase was typical for summer days at the Paprsek (6.2), Slaměnka (5.3) and Šerák (1.0) stations. However, considering the small sample size of summer and arctic days, these values should be approached cautiously.
3.3. Spatial Temperature Variability
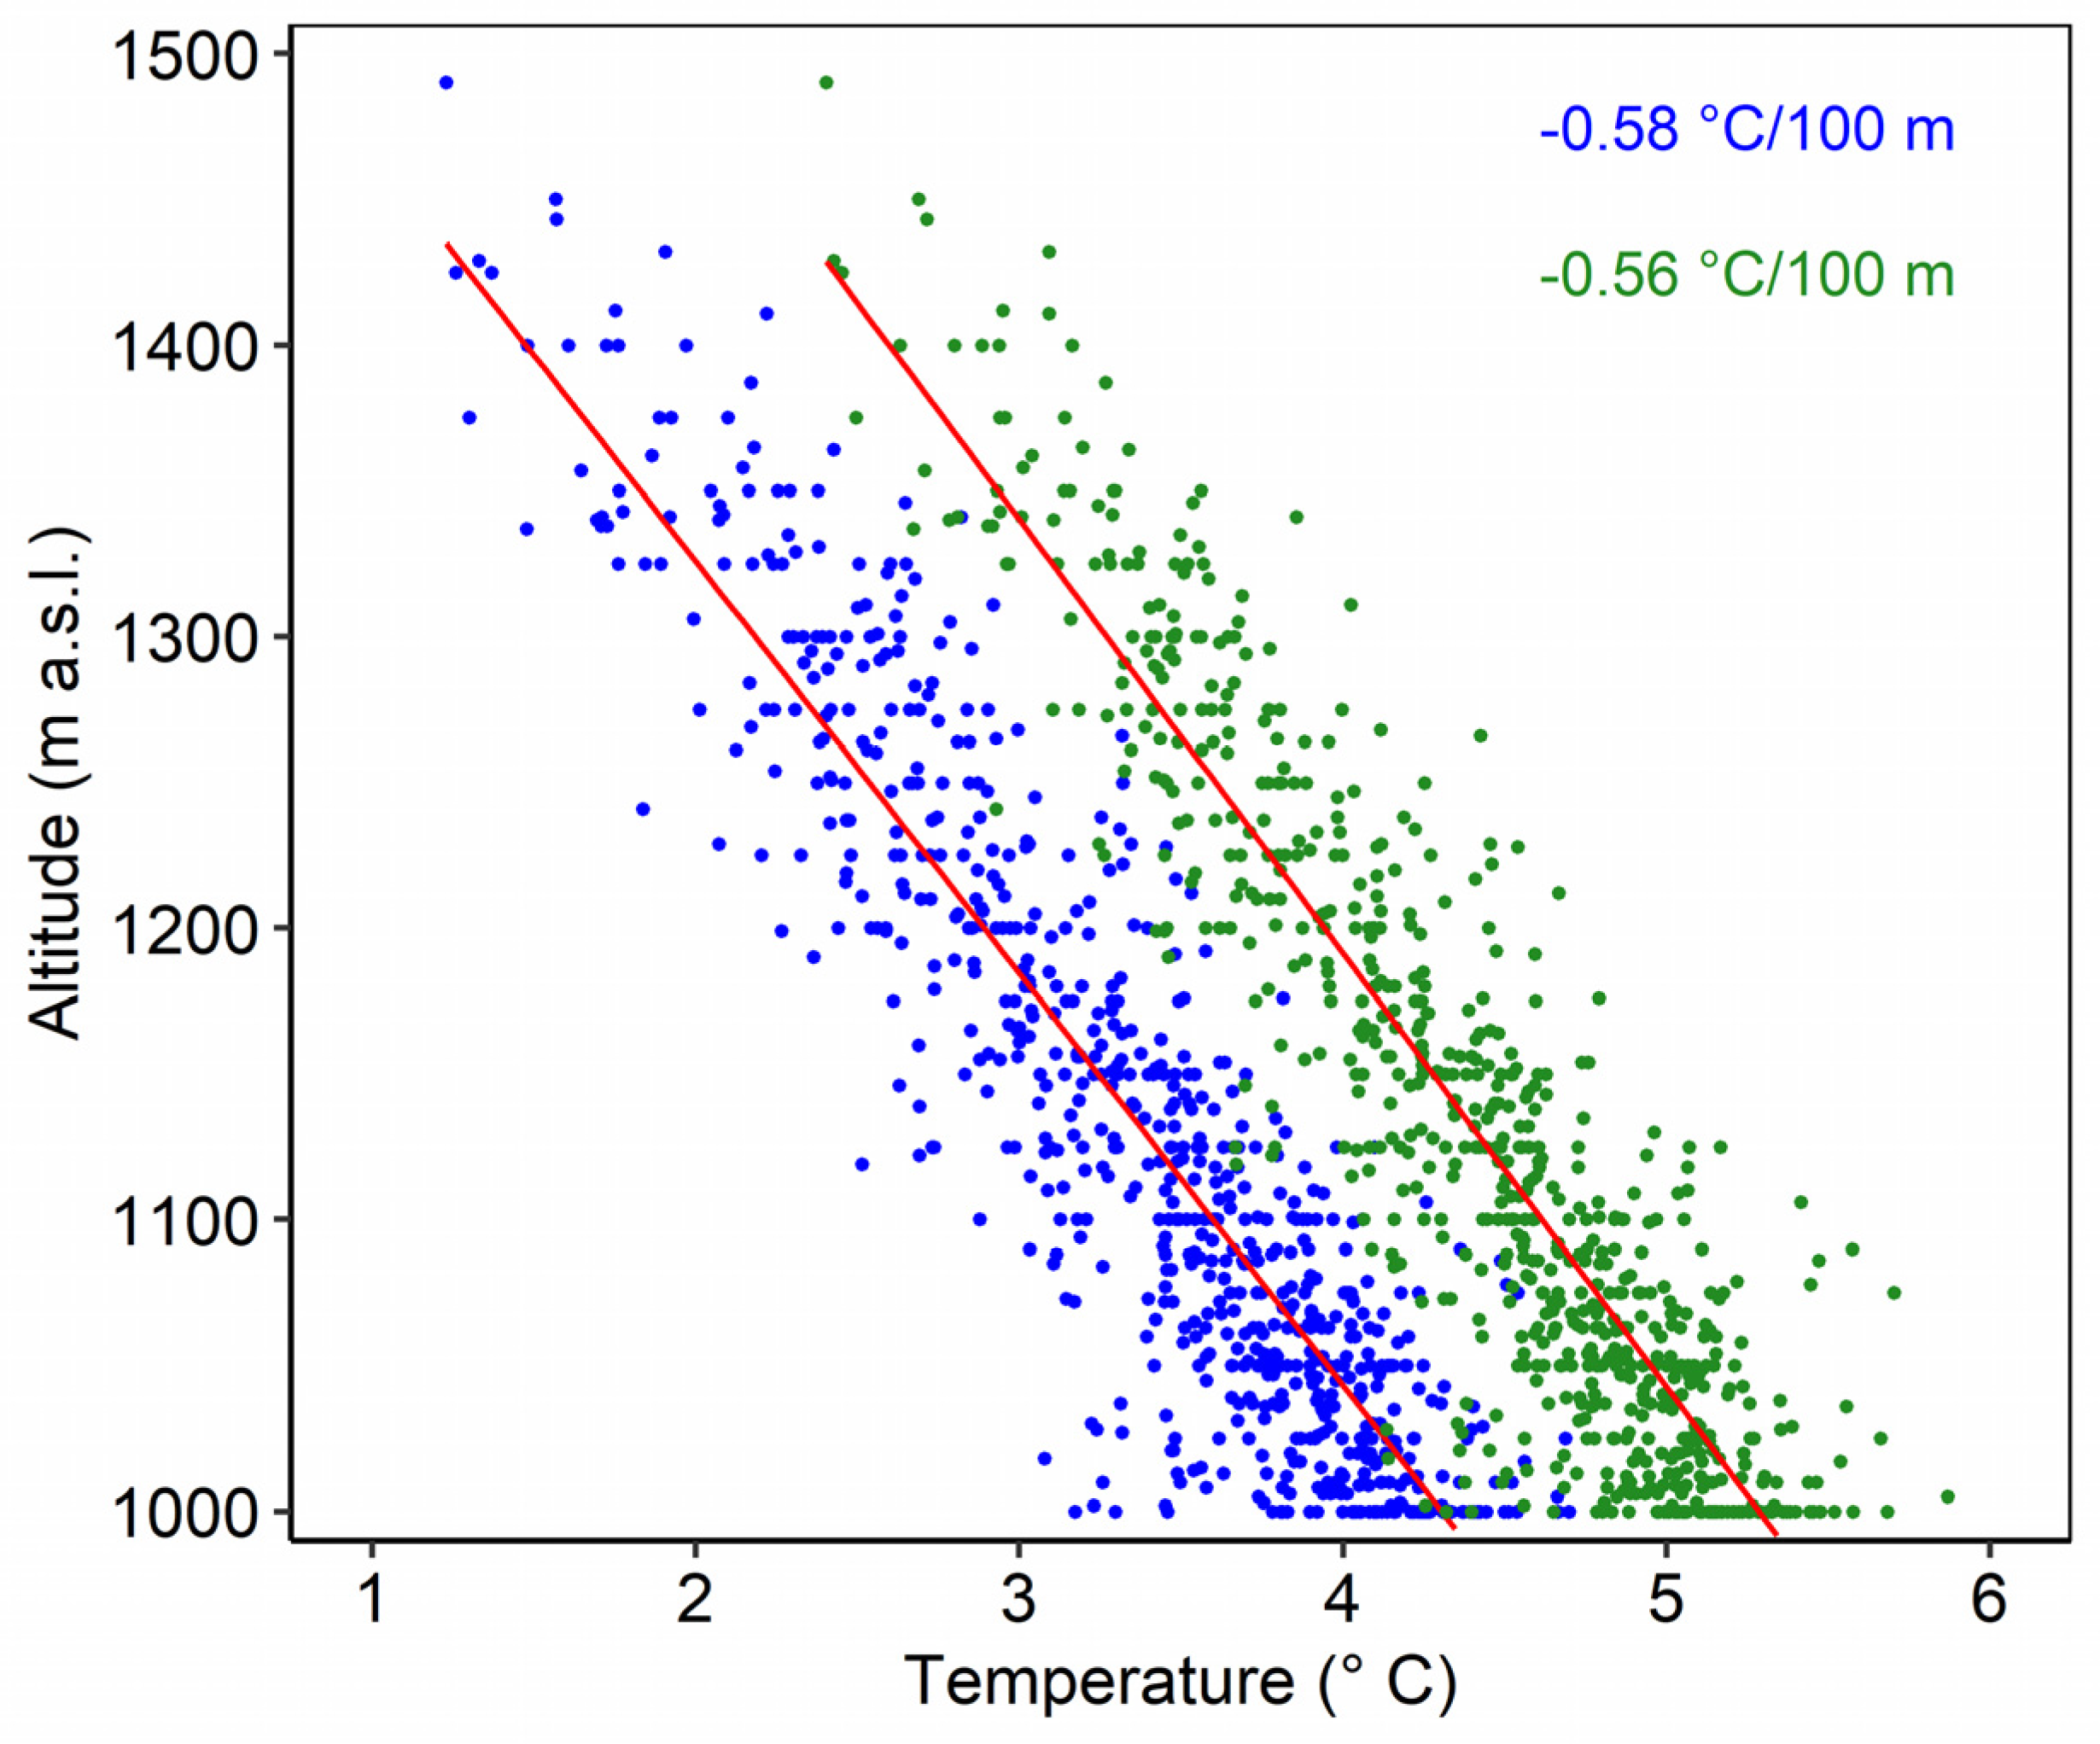
Substantial changes arose in the case of the mean annual temperature gradient per 100 m (at the level of 1000–1492 m a.s.l.) between both normal periods (Figure 6), derived from the interpolated grid layers. During the 1961–1990 period, the mean temperature gradient was −0.58 °C/100 m and decreased to −0.56 °C/100 m in the more recent period. Nevertheless, temperature differences between the same altitudes were statistically significant, and higher differences were recorded mostly at higher elevations. For instance, the largest positive difference was recorded at an elevation of 1325 m a.s.l. (1.23 °C) and the lowest at 1000 m a.s.l. (0.83 °C). Dividing the study area into five levels (1000–1099, 1100–1199 m a.s.l., etc.) confirms the highest statistically significant differences of positive temperature in the highest elevations, i.e., in the levels of 1400–1492 and 1300–1399 m a.s.l. (1.1 °C). The lowest warming between both periods was recorded in 1000–1099 m a.s.l. level (1.00 °C).
From the point of view of the whole northern Moravian Mts. region also including foothills, noticeable changes in vertical temperature distribution were observed between the 1961–1990 and 1991–2020 periods, both in annual and seasonal resolution. The whole region was divided into 13 levels (200–299 m, 300–399 m a.s.l., etc.) and temperature differences of mean annual and seasonal TAVG, TMAX and TMIN were calculated for the individual levels (see Appendix C) from the gridded layers. A statistically significant temperature increase in all characteristics at all levels was evident between both normal periods.
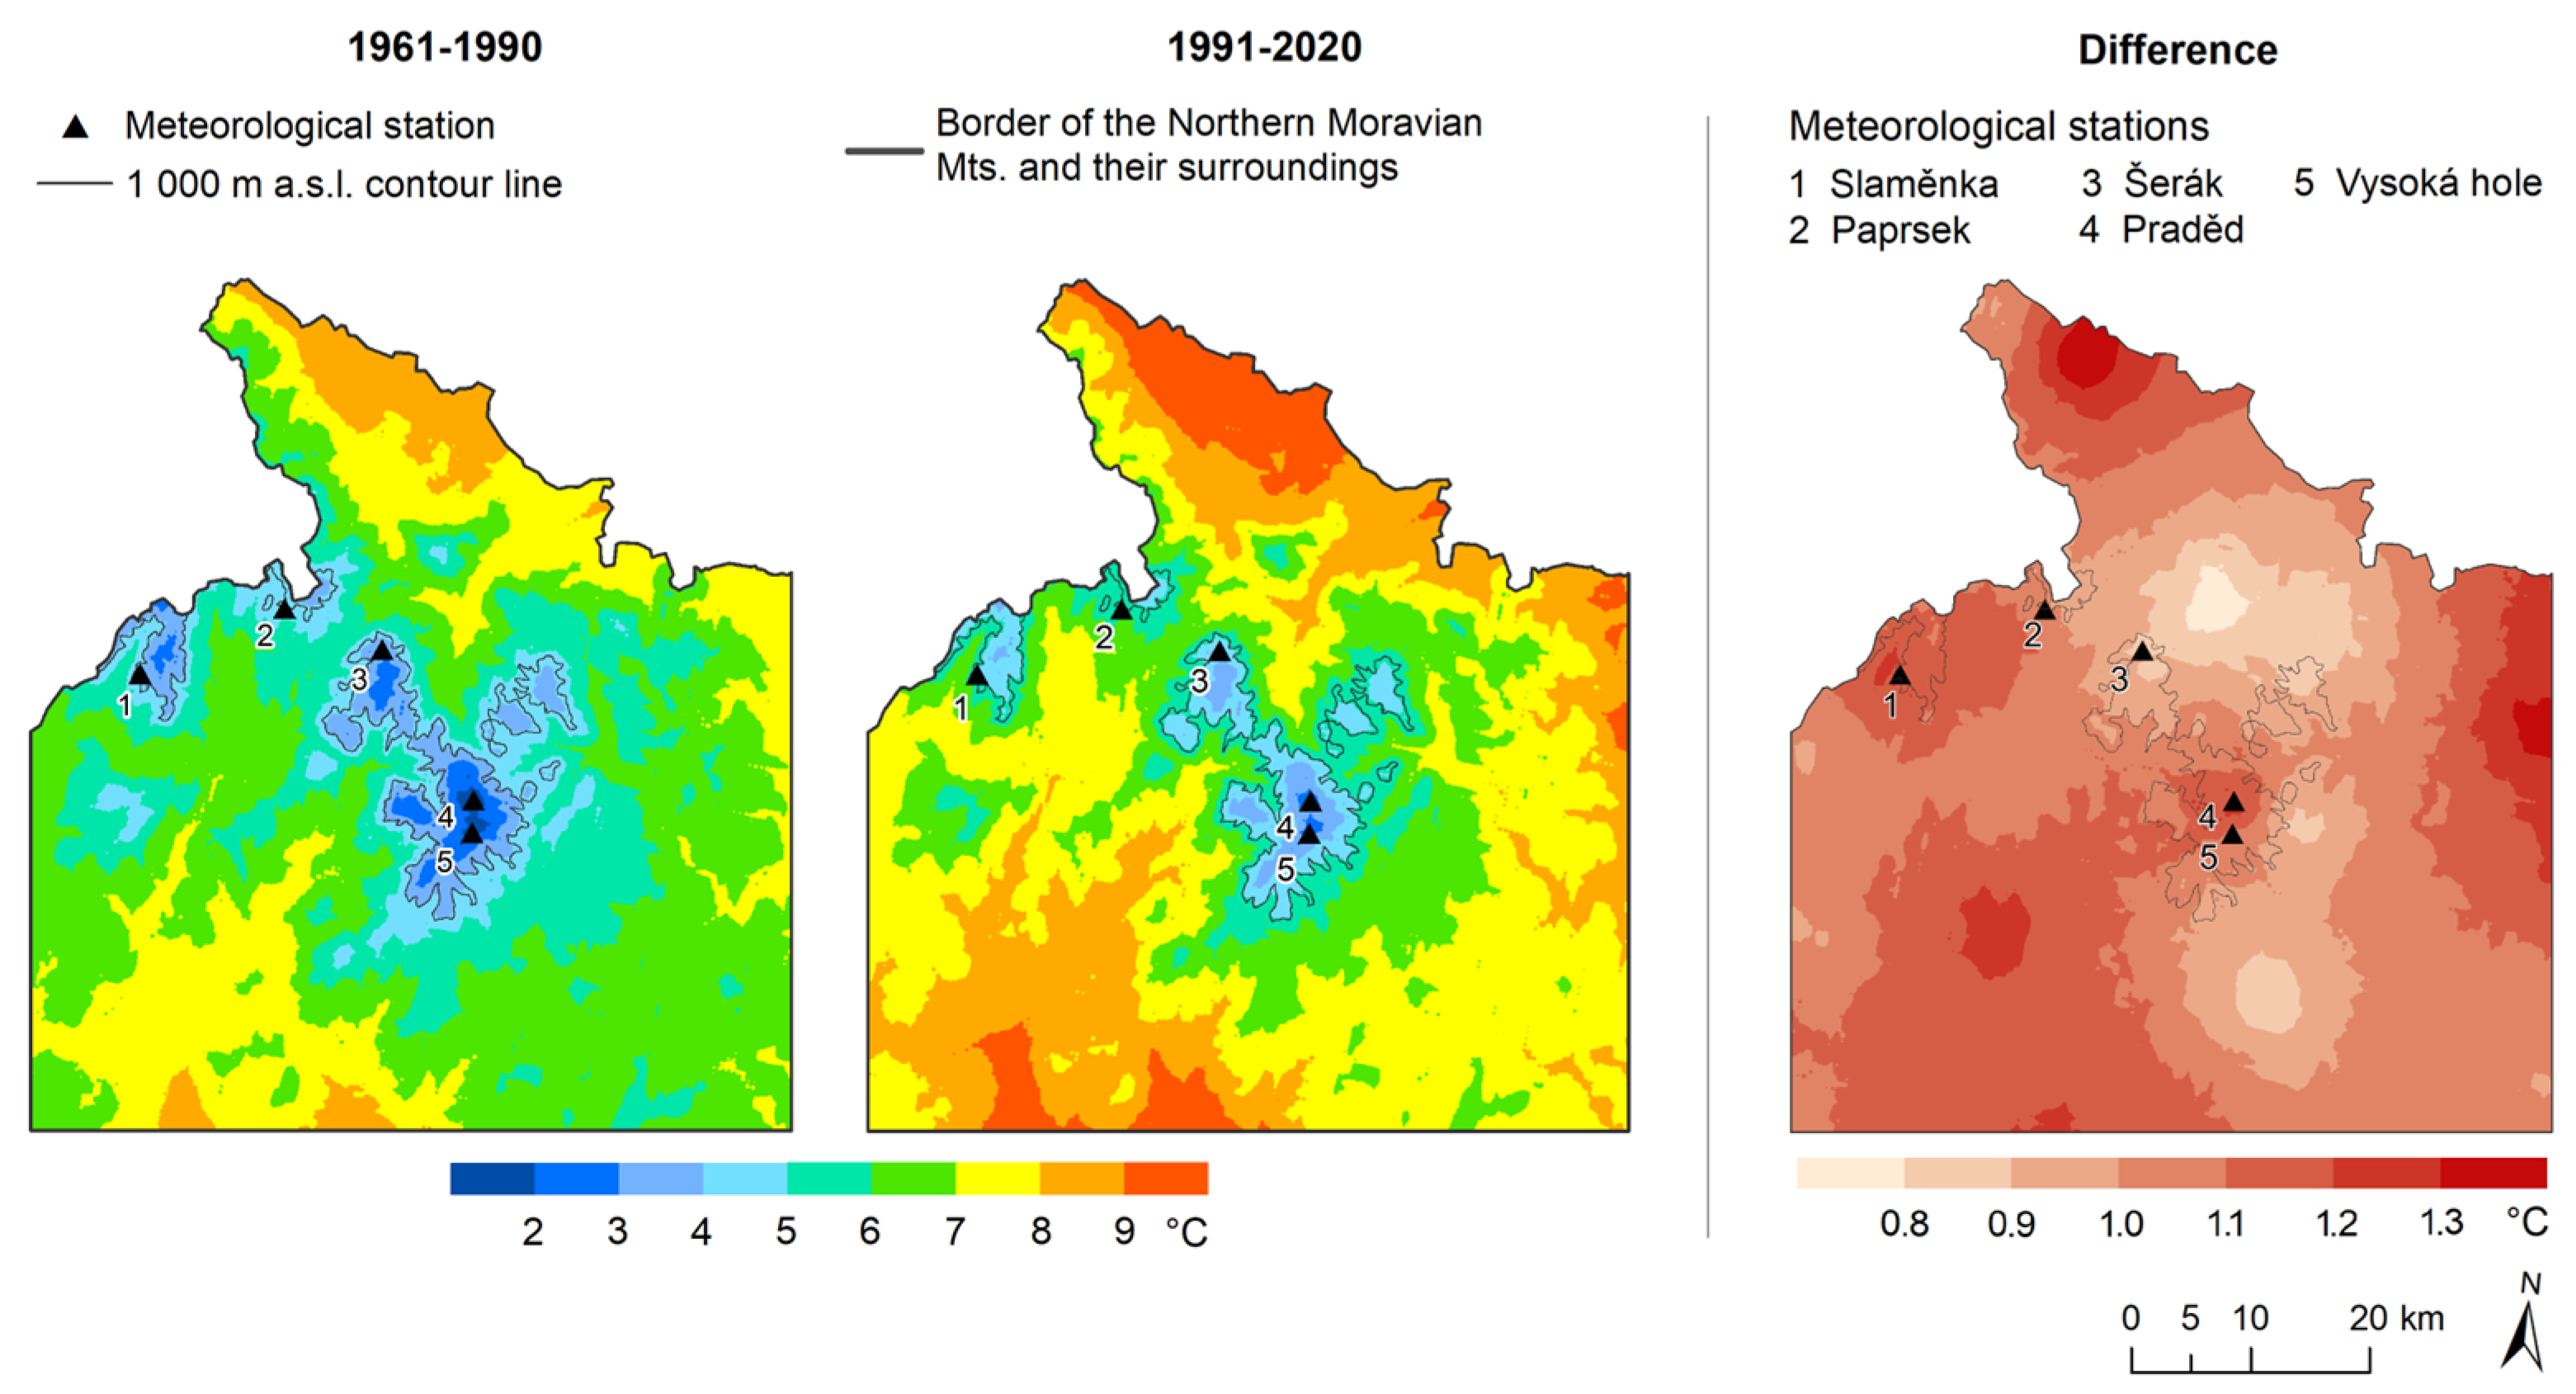
Looking at the spatial temperature variability, annual TAVG in the whole northern Moravian Mts. region was 6.3°C in 1961–1990 (ranging between 1.2–8.6 °C) and 7.4 °C in 1991–2020 (2.4–9.9 °C) (Figure 7). The temperature increased between both periods by about 1.1 °C on average. The lowest annual TAVG differences between both periods were recorded in the lower–middle altitudes around the town Jeseník (see Figure 1) and in the southern foothills of the Hrubý Jeseník Mts. (0.7–0.9 °C). On the other side, the most pronounced warming was detected especially in the lowlands in the north (between the towns Javorník and Vidnava), east and southwest (surroundings of the town Šumperk, 1.2–1.4 °C) and also at the Praděd (1.2–1.3 °C). From the point of view of the largest spatial changes of annual TAVG differences between both periods, the most significant change occurred at 40.0% of the northern Moravian Mts. region (temperature increase between 1.0–1.1 °C), followed by an increase of 1.1–1.2 °C at 32.1 % and 0.9–1.1 °C at 16.04 % of the region.
Regarding annual TAVG, the highest differences were recorded in the lowlands and highlands, specifically between 200–599 m a.s.l. (1.2 °C) and in the level of 1400–1492 m a.s.l. (1.1 °C). On the other hand, the lowest temperature increase was observed at the elevation of 600–1199 m a.s.l. (only 1.0 °C). Nearly the same vertical changes of annual temperature were detected in the case of TMAX (i.e., the highest warming in lower and then in the highest elevations). However, the highest warming between both periods within TMIN was distributed more equally between lower and higher elevations (200–399 m a.s.l. and 1200–1492 m a.s.l., respectively).
Concerning the vertical changes of seasonal TAVG, the highest variance in temperature differences was recorded in DJF (1.5–2.5 °C) and the lowest one in JJA (1.6–1.8 °C). Moreover, there was an apparent gradual shift in the vertical changes of the lowest temperature differences between both normal periods with increasing elevation within seasonal TAVG from MAM (minima in the levels between 400–1099 m a.s.l.) to DJF (900–1,492 m a.s.l.). Vice versa, the gradual shift of the lowest differences with decreasing elevation was observed for TMAX, i.e., from MAM (1000–1492 m a.s.l.) towards DJF (700–1299 m a.s.l.). On the other hand, no similar shift was detected for TMIN (for more details, see Appendix C).
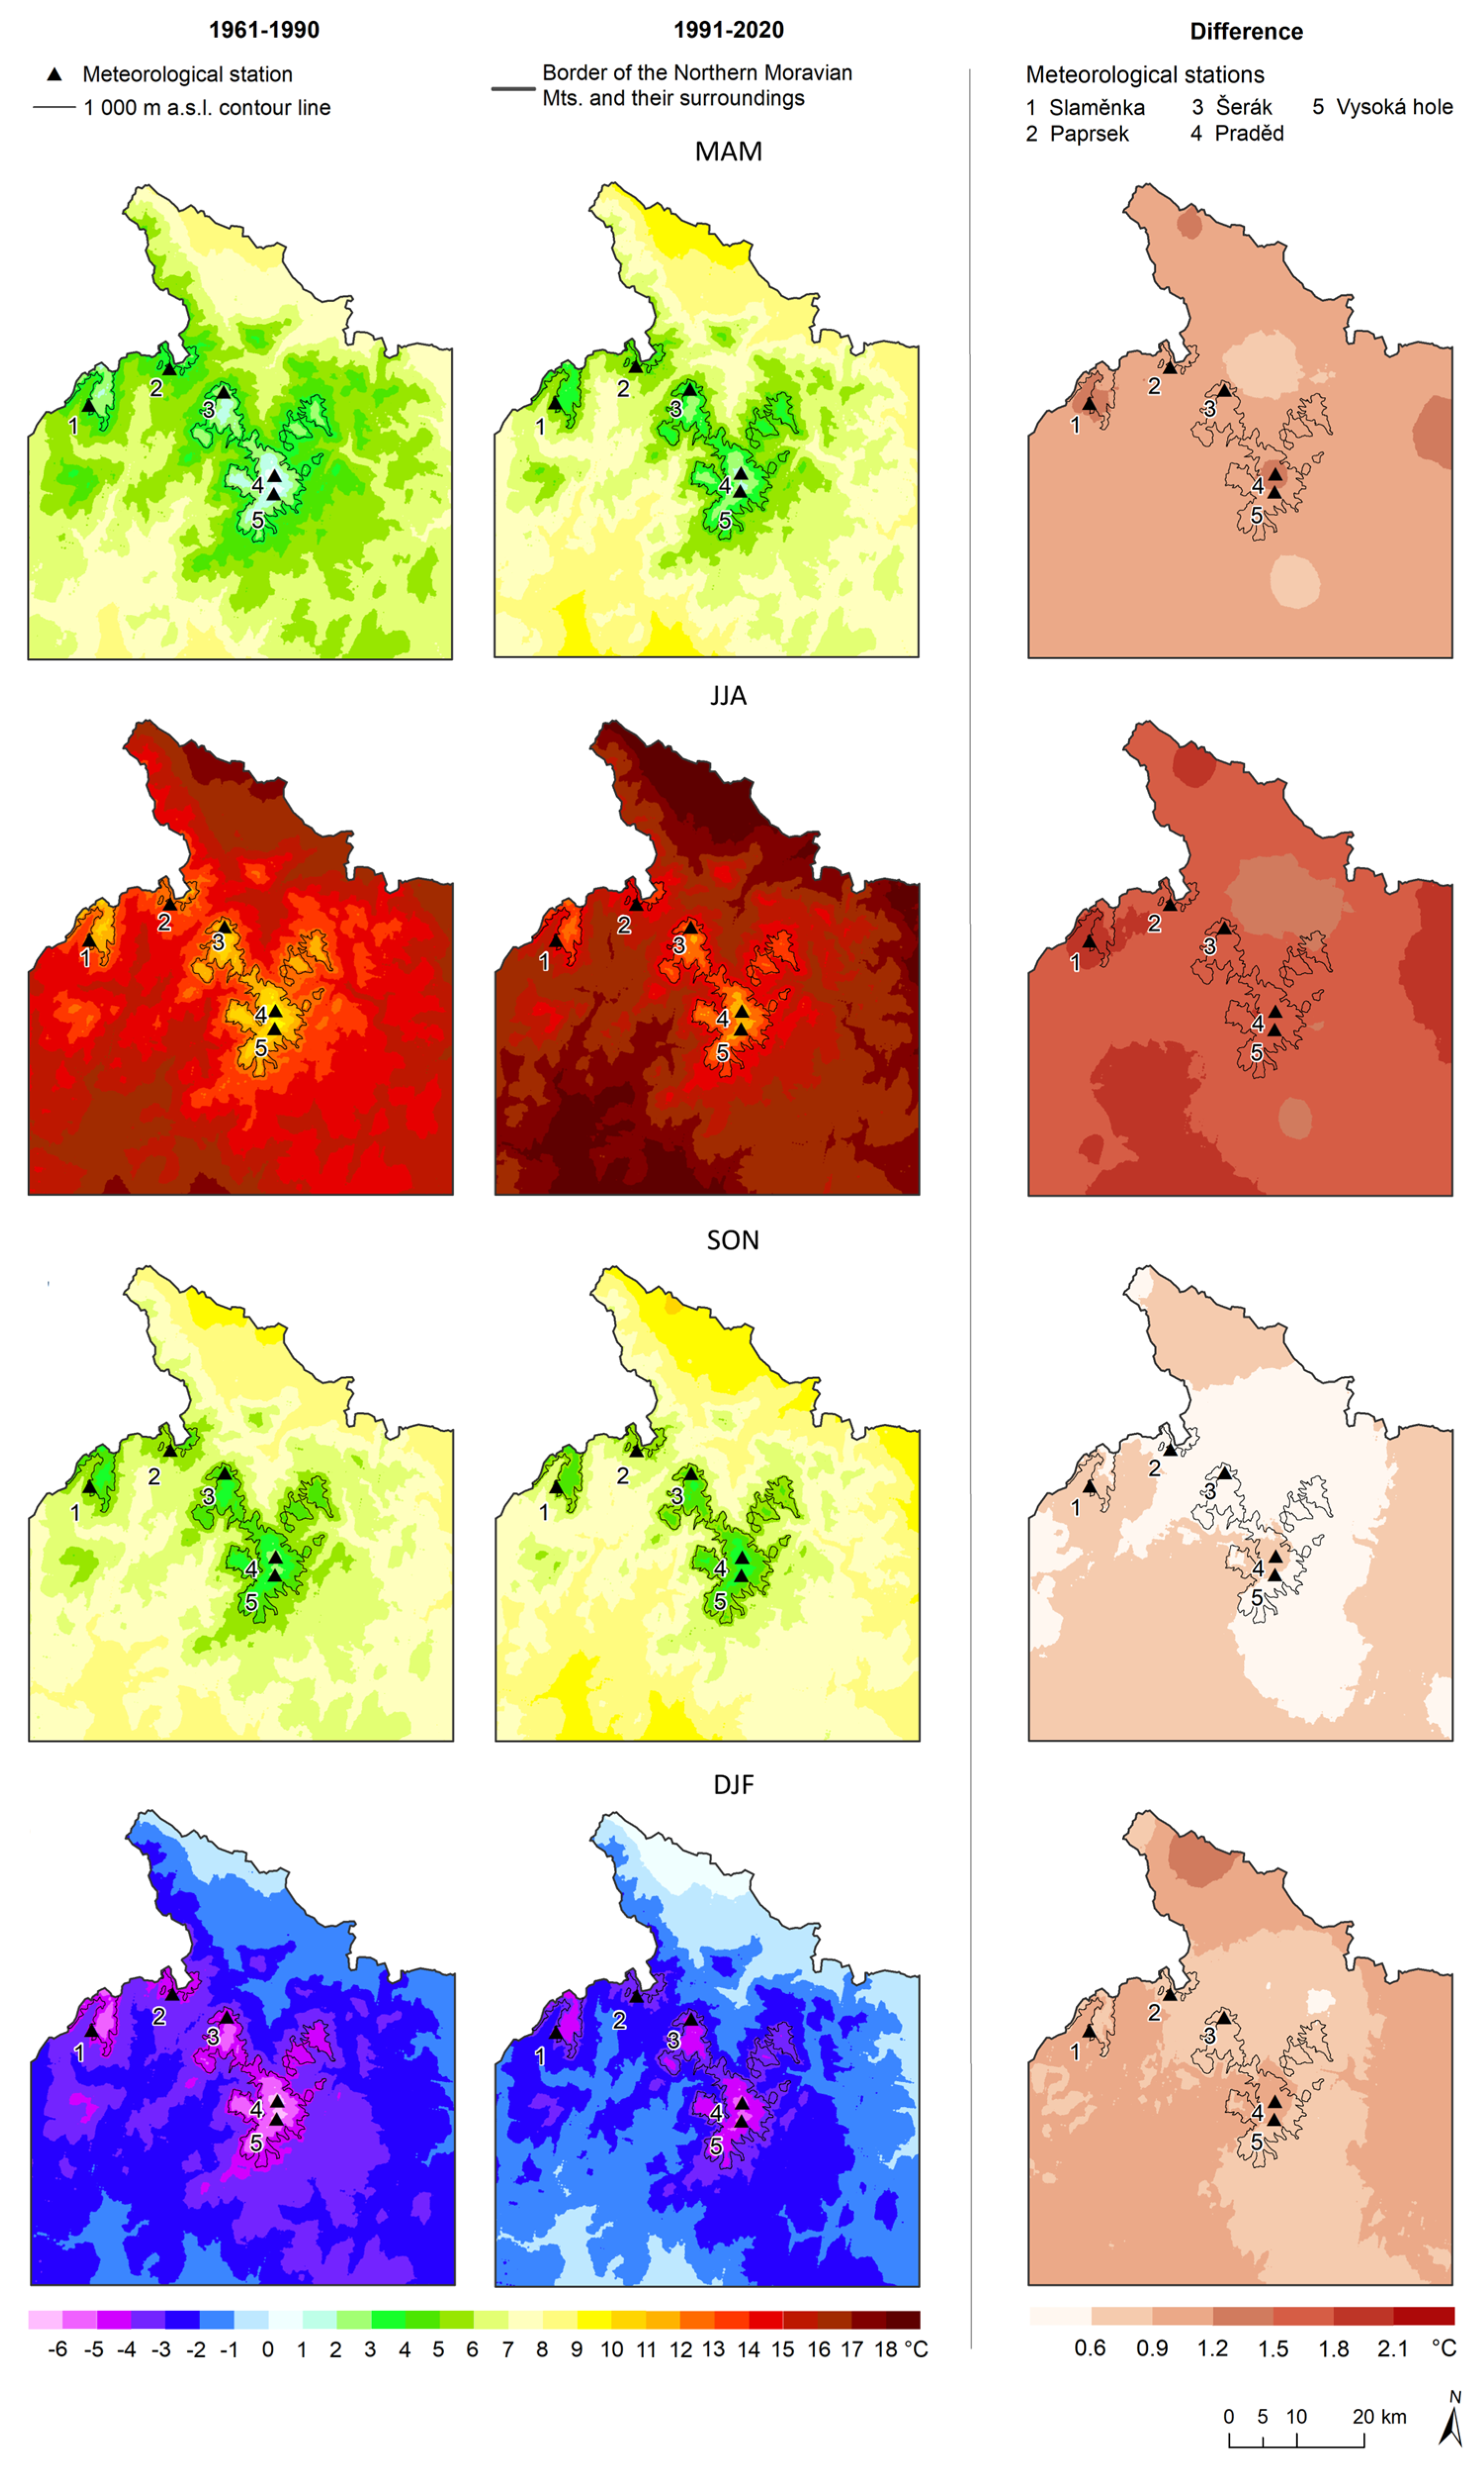
Figure 8 represents the spatial temperature variability of seasonal TAVG in the whole northern Moravian Mts. region in both periods and their differences. The highest increase in mean temperature between both normal periods was detected in JJA (1.7 °C), followed by MMA (1.0 °C), DJF (0.9 °C) and SON (0.6 °C). Similarly, the highest differences in maximal and minimal seasonal temperatures between both normal periods were recorded in JJA (1.8 °C and 1.8 °C, respectively) and the lowest in SON (0.7 °C and 0.8 °C, respectively). Differences in the amplitudes between TMAX and TMIN and both normal periods were minimal; however, they were growing from MAM (−0.1 °C) to DJF (0.2 °C). The difference in amplitude in MAM was also the only negative change in amplitude between the 1961–1990 and 1991–2020 periods. Temperature differences were well expressed in JJA and DJF. The most evident temperature changes were clearly visible, especially in the lowlands and the Králický Sněžník Mts. (JJA) and in the lowlands in the north near the towns of Vidnava and Javorník.
3.4. Vysoká Hole Station
In order to validate the temperature measurement at the recently built meteorological station at Vysoká hole (from November 2017 to December 2021), the acquired series were compared with the measurements at other stations. As Figure 9 shows, the lowest differences were recorded between Vysoká hole and Praděd (mean monthly temperature difference 0.4 °C) and Šerák (0.8 °C) because these stations are situated at similar elevations (see Table 1). Presumably, the highest differences appeared between the Vysoká hole and the two remaining lowest-situated stations (2.6 °C for Paprsek, 2.5 °C for Slaměnka). The highest monthly difference between compared stations was recorded in April 2020 at the Paprsek and Slaměnka stations (congruently 3.8 °C).
The same situation between compared stations was also verified for all four seasons, summer/winter half-year and the entire year. The sum of mean seasonal temperature differences indicated a decrease from the highest differences in MAM to the lowest ones in DJF (not shown). No temperature difference appeared between the Vysoká hole and Praděd stations in JJA. Concerning the summer/winter half-year, no trend between stations could be observed. In general, the temperature series of the Praděd station showed the lowest differences (0.36 °C) to the closest Vysoká hole time series.
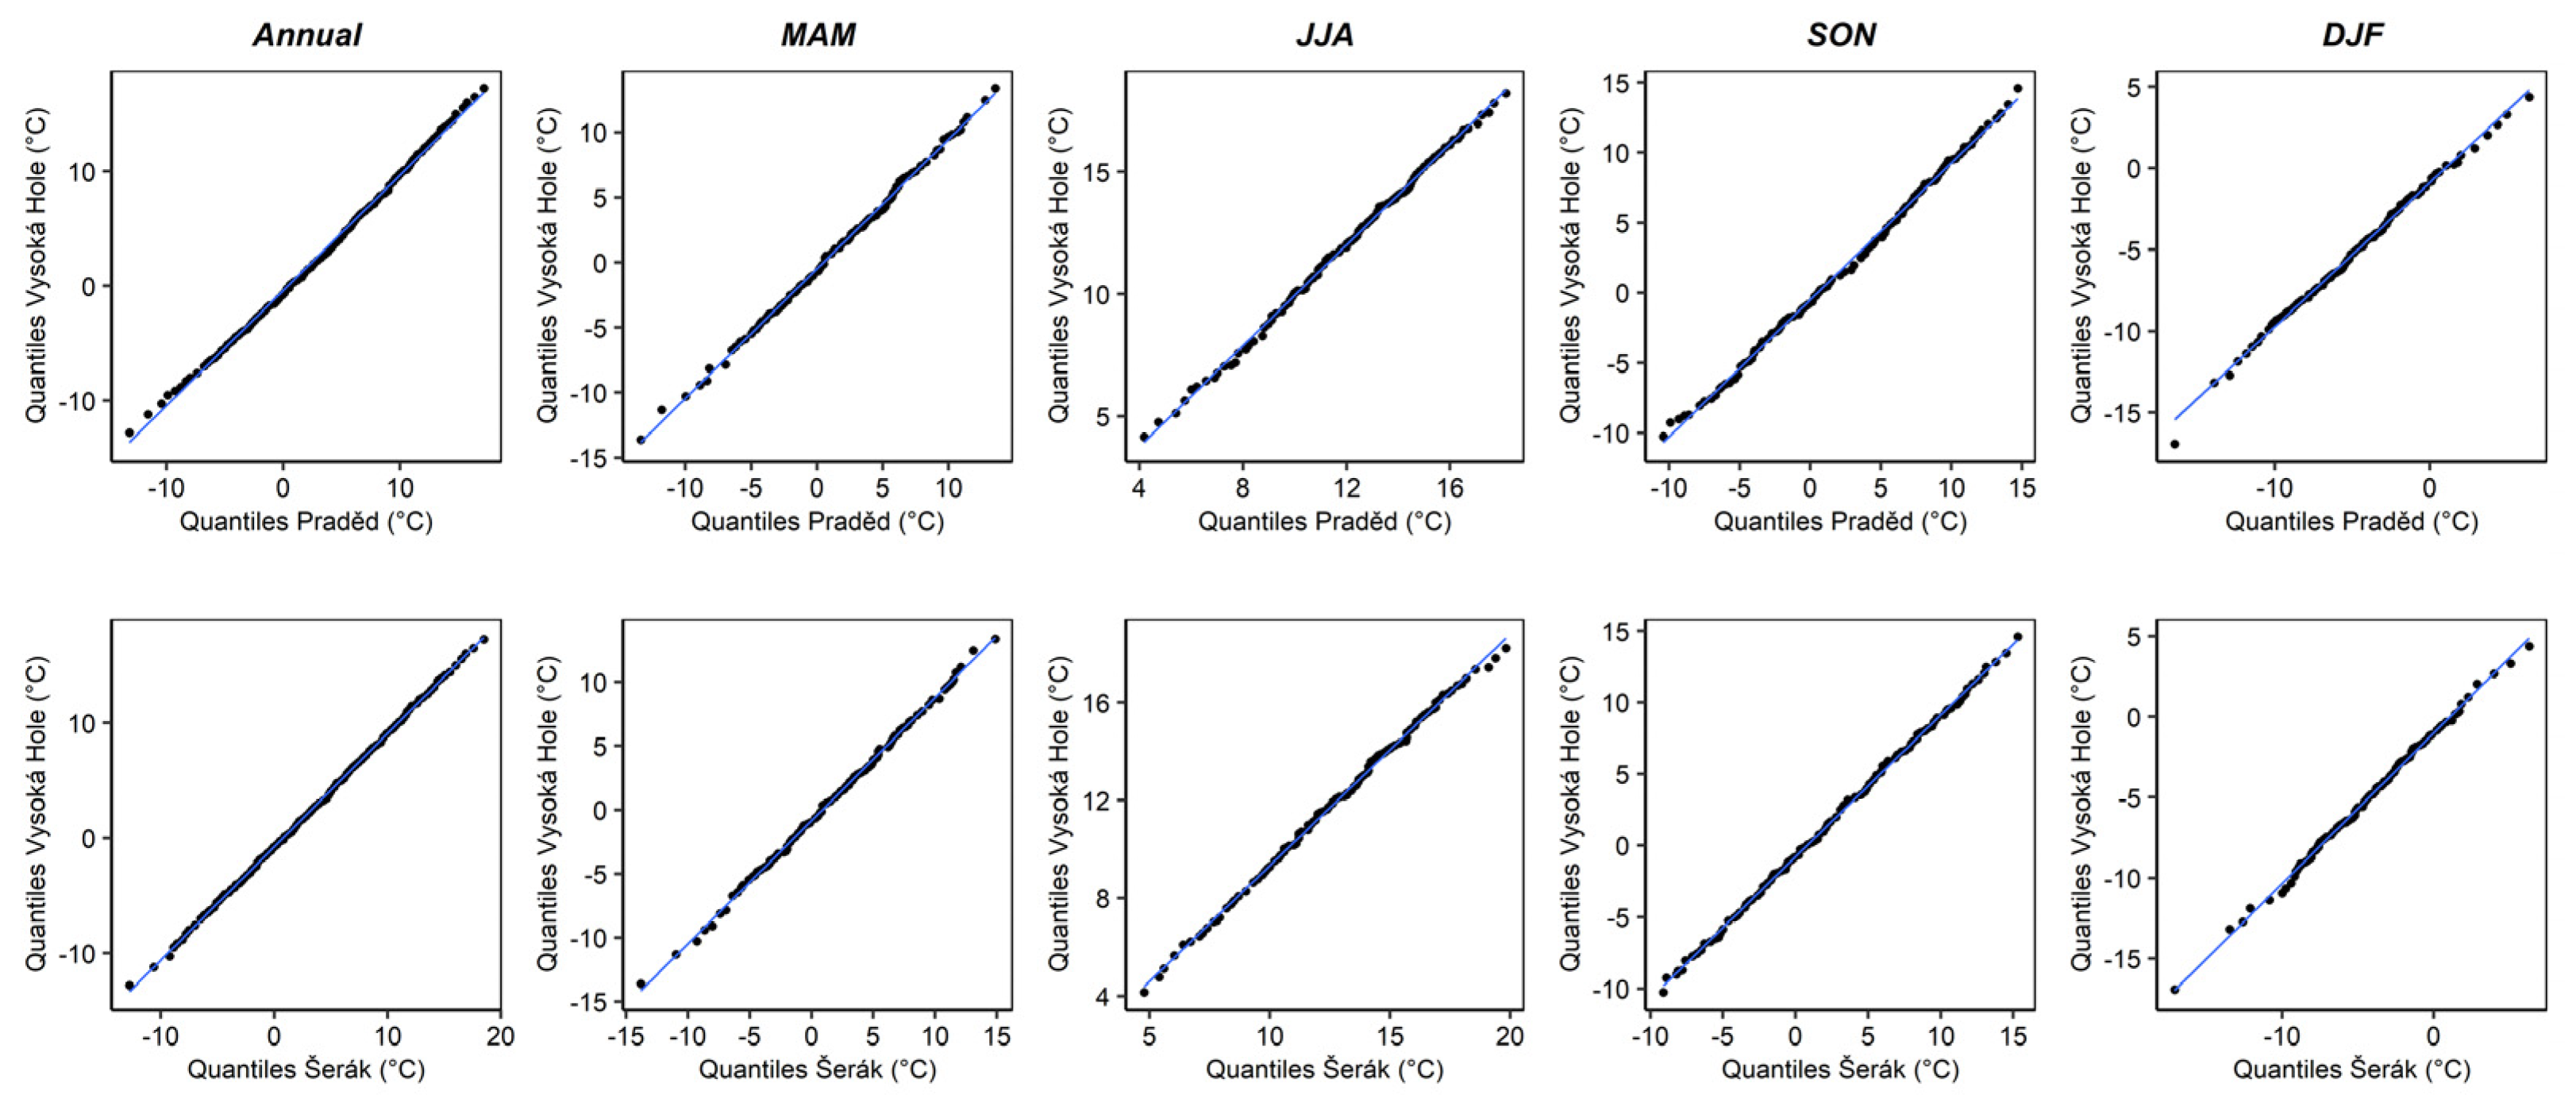
To validate the temperature series of the Vysoká hole station; a quantile–quantile plot (Q-Q plot) was used (Appendix D). Two temperature series of the stations situated in similar elevations were selected (Praděd; Šerák) and their sets of quantiles of daily mean temperature; including both annual and seasonal data covering the period from November 2017 to December 2021; were plotted together with the Vysoká hole station. The general agreement of quantiles distribution expressed by straight line both in the case of annual and seasonal data confirms a very similar statistical distribution of daily mean temperatures at the Vysoká hole compared to the Praděd and Šerák stations. Therefore, the temperature series from the recently established Vysoká hole station can be considered representative enough and comparable with measurements of meteorological stations included in the CHMI network.
4. Discussion
4.1. Comparison with Other Mountain Ranges
Analysis of annual and summer/winter half-year TAVG series of the four selected stations representing the northern Moravian mountain ridges revealed statistically significant increasing annual trends in 1961–2020 from 0.26 to 0.38 °C/10 years. A significant temperature increase in the European mountain ridges in the last decades was also declared by several other studies [16,46,47,48]. The strongest trend prevailed in most cases at the highest analyzed station (Praděd) and the summer half-year was becoming warmer faster than the winter half-year. Such a temperature increase is in agreement with the impacts of recent climate change, especially global warming, as several studies have confirmed [47,49,50]. Nevertheless, the last IPPC report warned that the rate of warming in mountain areas differs with elevation, and such a pattern is not globally uniform [9]. An increase in temperature also leads to higher potential evapotranspiration, which, together with stable precipitation [34], means a shift towards warmer and drier climatic conditions. A significant impact is therefore expected on forest management (tree species composition, more frequent bark beetle outbreaks), water resources, agriculture production, and land management.
Nevertheless, an analysis of temperature measurements at the Praděd station conducted by Tolasz [51] showed an increasing TAVG trend of only 0.25 °C in the 1951–2016 period contrary to 0.38 °C/10 years in this study. A substantially lower 10-year trend could be influenced by including temperature measurements from the warmer 1950s in the calculation and, on the other hand, excluding extraordinarily warm years after 2016. According to our results, annual absolute TAVG ranged between 2.73 °C (2017) to 3.87 °C (2019) during 2017–2020, while annual TAVG in the 1991–2020 period was only 2.02 °C. Various studies prove changes in annual absolute TAVG at the Praděd station, giving the following mean TAVGs for different periods: 0.9 °C (before 1950) [52], 1.1 °C (1971–1980), 1.3 °C (1961–2000) and finally 1.8 °C during 2006–2010 [1]. Despite the annual TAVG increase of about 1.0 °C at the Praděd station between 1961–1990 and 1991–2020, Praděd still became the coldest place in the northern Moravian mountain ridges, corresponding with Culek [53].
As mentioned above, the first meteorological measurements already began at the Praděd station on the 1st of September, 1941, but only until the 31st of January, 1945. The next measurements began on the 1st of November, 1946 and continued until the 15th of September, 1997 [38]. Nevertheless, data before 1961 were not included in the final analysis. During 1946–1960, the Praděd station was the only meteorological station in operation in the northern Moravian mountain ridges. Therefore, comparing the measurements from 1946–1960 with other temperature series was impossible. Moreover, in 1961 reorganization of the meteorological station network took place and meteorological measurements before 1961 from the Praděd station became inapplicable [54].
Similarly, statistically significant increasing trends were discovered in the case of seasonal TAVG (except for SON at the Paprsek and Šerák stations), being strongest for JJA and MAM and weakest for SON. Strong JJA and MMA trends of the northern Moravian mountain ridges correspond to increasing statistically significant linear trends of TAVG in MAM (0.33 °C/10 years) and JJA (0.38 °C/10 years) of selected mountain stations above 900 m a.s.l. in the CR over 1961–2019 [20]. The most pronounced warming in JJA and MAM was also consistent with the highest temperature increase reported for the same seasons in the Hrubý Jeseník Mts. during 1961–2010 [55], the Giant Mountains in the 1961–2016 period [26] or the Carpathian mountain region over 1961–2010 [56].
Except for a very low decrease in temperature in October (statistically insignificant), increasing trends were revealed in all other months. The most notable monthly 10-year trends were revealed for August, July and June, which coincide well with CR trends [20].
Annual TAVG, TMAX and TMIN increased (statistically significantly) between the 1961–1990 and 1991–2020 periods. The highest differences between both normal periods were recorded for TMAX, followed by TMIN and TAVG. However, the highest annual differences did not always correspond to the actual station altitude, as could be seen at the Šerák station (1328 m a.s.l.), where the lowest differences for TAVG, TMAX and TMIN were disclosed. Kliegrová and Kašičková [26] compared annual TAVG at the mountain stations in the Giant Mts. between the 1961–2000 and 2001–2016 periods. They revealed a temperature increase of about 1.0 °C, which is very close to the average increase (about 0.92 °C) at all four analyzed stations in the studied region. Although they found that changes in TMIN varied with season and elevation, no such trend was observed both in the northern Moravian mountain ridges and in the northern Moravian Mts. region as well.
Comparing the results from Zahradníček et al. [20], the northern Moravian mountain ridges, along with surrounding areas and the other mountain ranges investigated, show a slightly lower temperature trend compared to large lowland regions, e.g., in South Moravia or Central Bohemia. These lowlands are characterized by different geographical conditions compared to the lowlands of the northern Moravian region. Moreover, this also relates to continentality (which is lower at higher altitudes) and its link to current warming trends in temperate Europe.
4.2. Czech Mountains in the Light of 20-Year Moving Trends
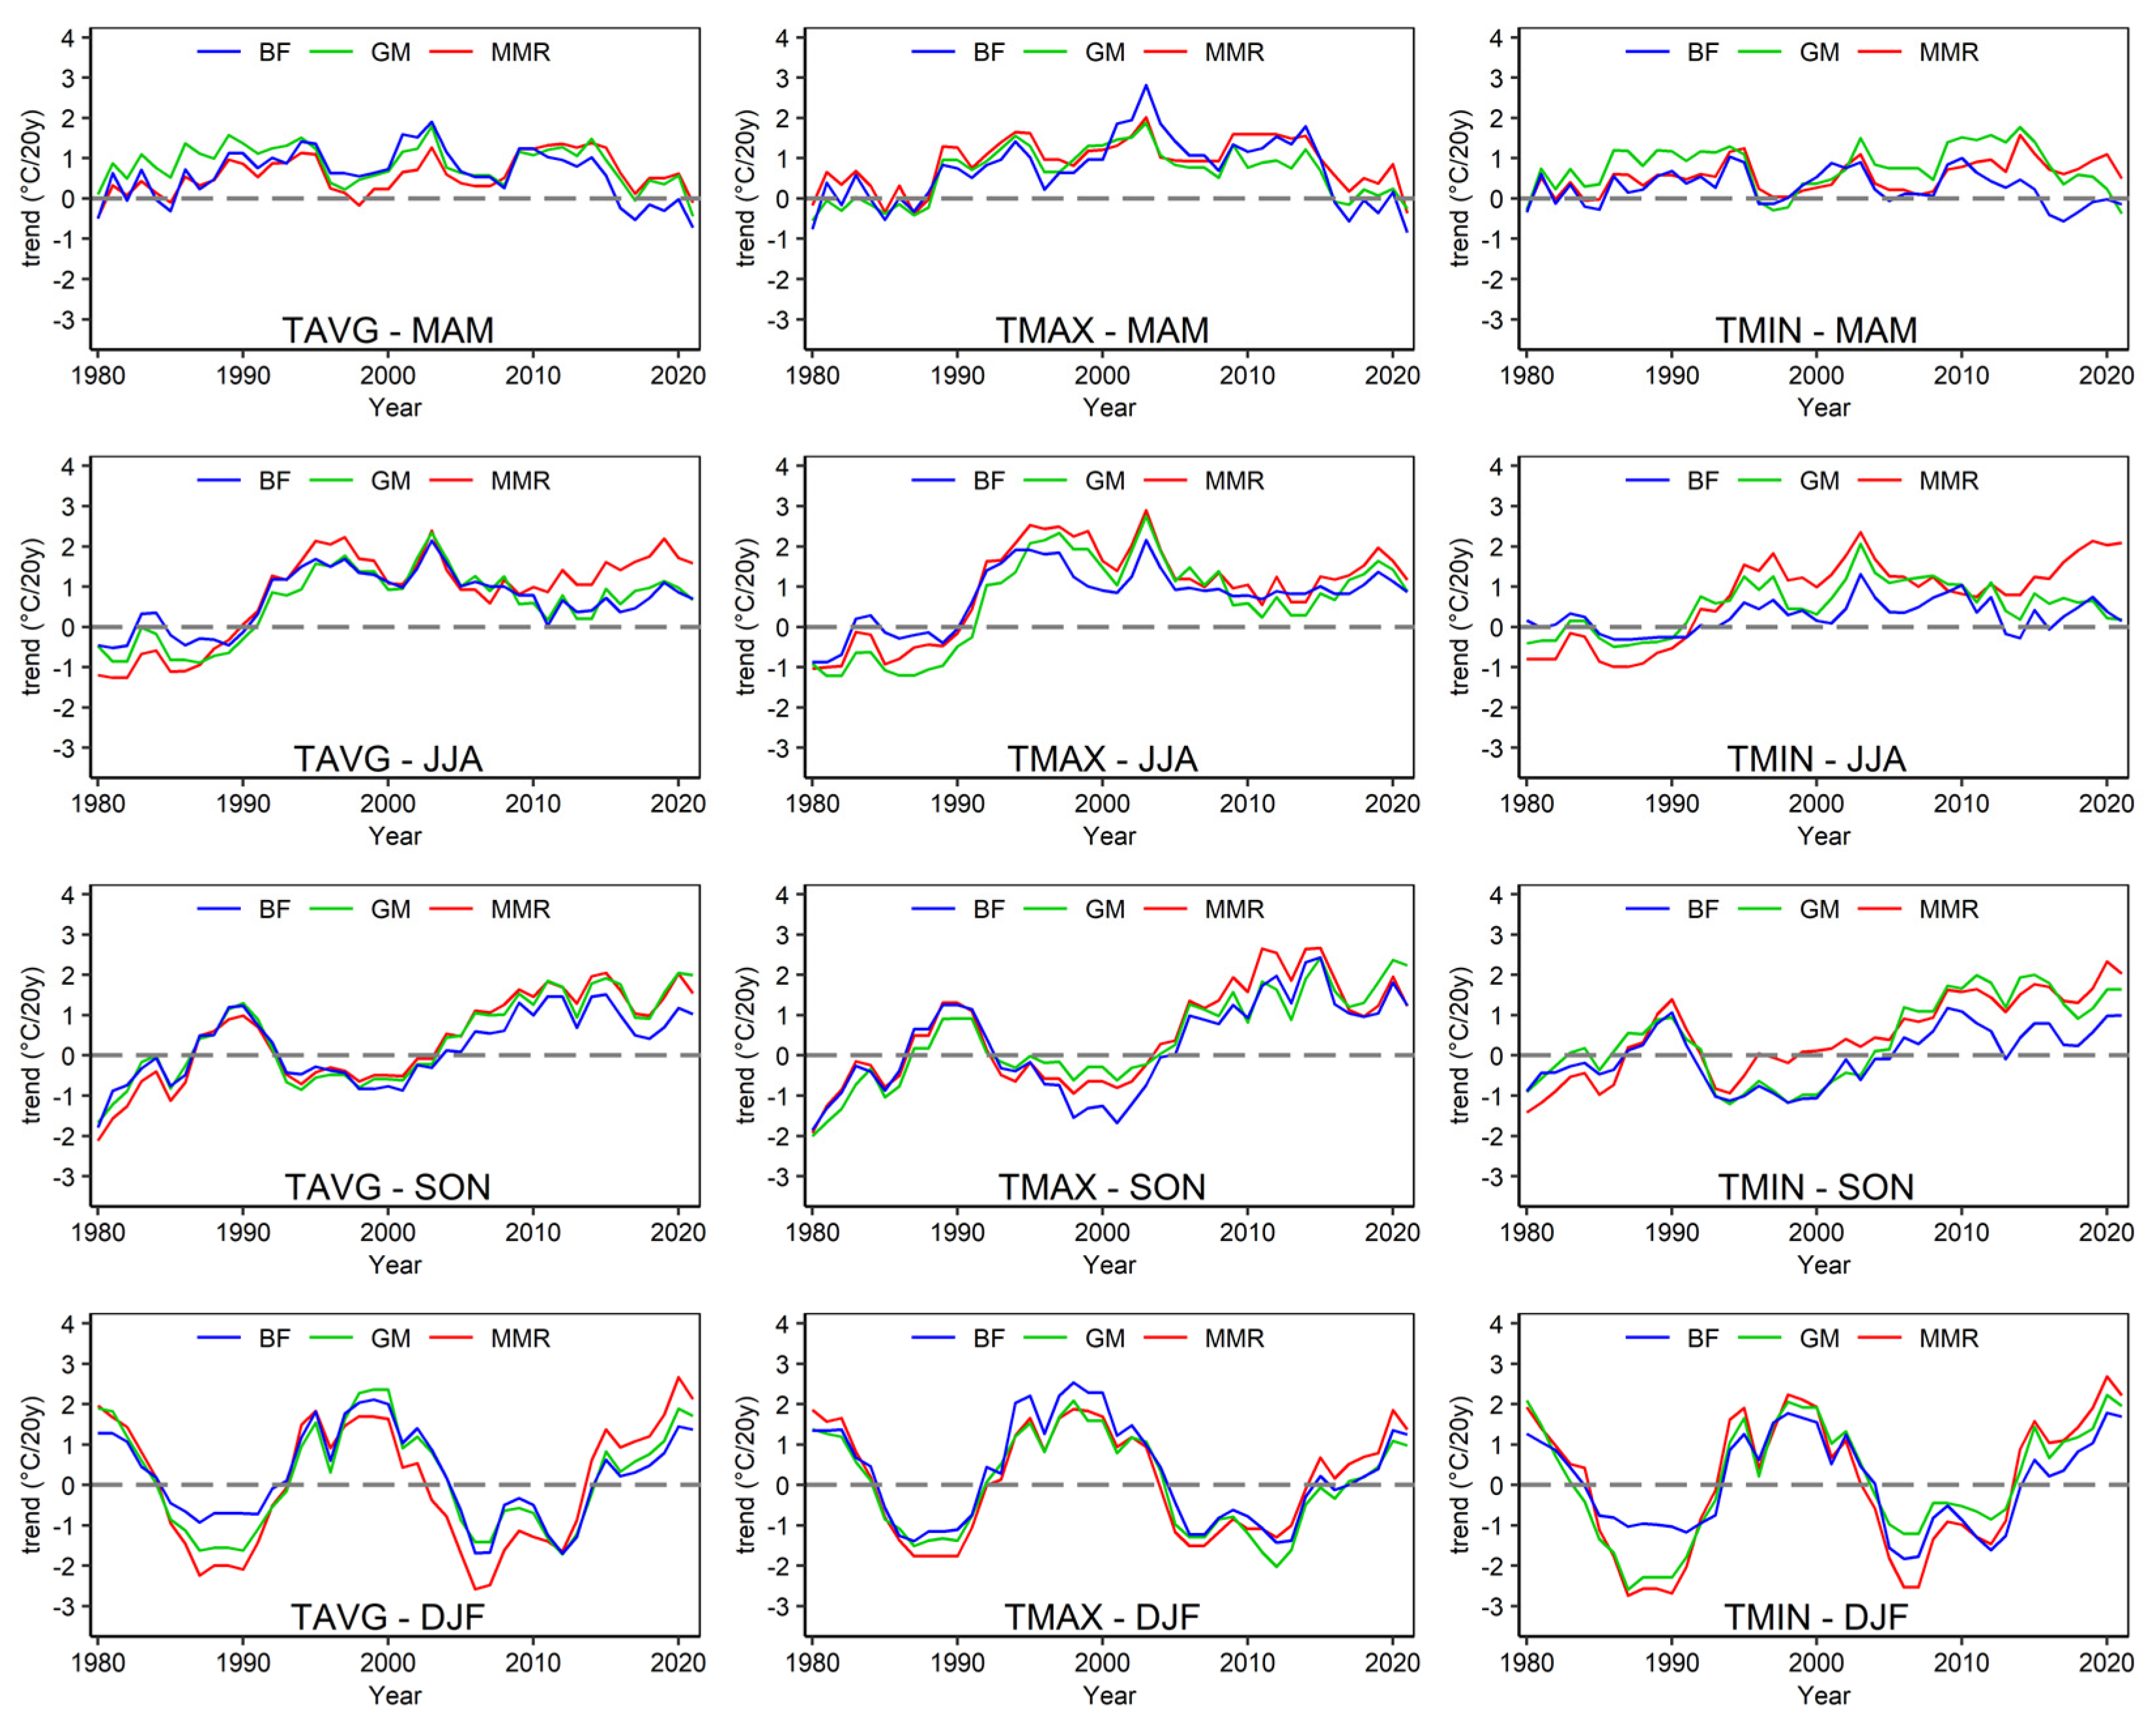
The 20-year moving trends of annual and seasonal TAVG, TMAX and TMIN between the studied region and the Giant Mts. and the Bohemian Forest in the 1980–2020 period were applied to compare the reconstructed temperature series (1961–2020) of the four selected stations (Paprsek, Slaměnka, Šerák, Praděd) representing the northern Moravian mountain ridges with other Czech mountains (see Figure 10, Appendix E).
As Figure 10 shows, increasing annual TAVG, TMAX and TMIN trends have been evident in all three mountain regions since the middle of the 1980s and the temperature increase was the highest in the northern Moravian mountain ridges. A temperature increase from the mid-1980s was also detected in other Czech mountains (the Bohemian Forest and the Krušné hory Mts.) [1] as well as in the Alps [47] or the Tatra Mts. [16]. A significant increase in temperatures in the mountains of Slovakia in the April to August season after 1990 was detected by Lapin et al. [57].
Temperature conditions evaluated in the studied mountain ranges (Appendix D) are consistent with the results of Tolasz [51], who analyzed the climate of the Czech mountain regions during 1951–2016. Except for the apparent discrepancy in JJA (TMIN), seasonal temperature trends of all three analyzed mountain ranges showed a similar fluctuation. The increasing trend of the northern Moravian mountain ridges in JJA (TMIN) after 2015, contrary to the decreasing trends of the Giant Mts. and the Bohemian Forest, does not have an obvious cause; however, a parallel could be drawn with the increase in southwestern airflow direction frequency in recent decades in the summer half-year in Central Europe [58], because the northern Moravian mountain ranges are leeward from the southwest. Seasonal temperature trends of the northern Moravian mountain ridges were characterized, in comparison with the trends of the other two mountain ranges, by the highest temperature increases for TAVG, TMIN and TMAX in most cases. That is not surprising, considering their more eastern location and well-known west–east gradient of slower–faster warming across temperate Central Europe [9], but the differences are not that extensive. The temperature series representing the northern Moravian mountain ridges coincided predominantly with the Bohemian Forest series. One possible reason for this analogy is the selection of stations in the Bohemian Forest situated at lower altitudes than the stations situated higher in the Giant Mts. The lower similarity was found with the Giant Mts., which could be connected to their lower continentality, which increases in eastern and southeastern directions over Central Europe [37], therefore being lowest in the Giant Mts.
The comparison of the highest peaks, Hrubý Jeseník with Praděd (1492 m a.s.l.) and the Giant Mts. with Sněžka (1602 m a.s.l.) showed that the January mean TAVG at Praděd is lower than at Sněžka despite the lower elevation of Praděd [19]. According to Tolasz [37], this disparity is caused by more frequent penetration of warm oceanic air to Bohemia (including the Giant Mts.) and, on the other hand, the frequent spreading of continental arctic air to Moravia. However, despite the position of Praděd being more to the east compared to Sněžka, Praděd is still influenced by an oceanic climate [19]. Comparing the temperature 20-year trends of individual seasons, there is an apparent increasing variability of trends from MAM towards DJF.
4.3. Context of Temperature Variability to Local Factors
Emphasis was given to the comparison of temperature variability between two normal periods (1961–1990 and 1991–2020). Even though some temperature series went back before 1961 (e.g., the Praděd station—1941–1945, 1946) [38] and data for all stations were available up to 2021, we decided to pay attention to only two standard normal periods. Such an approach allowed us to compare the results with other studies analyzing (nearly) the same periods, for instance, Kliegrová and Kašičková [26], Zahradníček et al. [20] or Brázdil et al. [59].
In all seasons, positive temperature differences were revealed (i.e., warming in the more recent period) of TAVG, TMAX and TMIN, but only at MAM and JJA were the differences statistically significant at all stations. This was caused by a higher variability of monthly data, leading to only the steepest trends being statistically significant.
Possible uncertainty is related, particularly, to applied methods for homogenization of temperature series and reconstruction of their missing parts. Further uncertainty can be attributed to the interpolation process, which predicts temperature based on the selected predictors list.
A particular uncertainty may be evident in the results of the mean annual temperature gradient analysis between both normal periods. The studied area above 1000 m a.s.l. consisted of 736 grids containing spatially interpolated values, which, even in the case of our complex, state-of-the-art interpolation methods, can lead to inaccuracies. Also, the number of grids decreased with increasing elevation and shrinking area, leading to a smaller sample-size for the highest elevations. For those reasons, temperature gradients in both normal periods could be burdened with a certain error.
In general, the relatively cold northern Moravian region, compared to the rest of the CR, is influenced by pronounced cloudiness and substantial frontal disturbances [19]. The northern Moravian mountain ridges and summits are characterized by significantly pronounced cloudiness in the summer half-year, opposite to lowlands and, on the other hand, more frequent sunshine in the winter half-year [55]. However, according to Błaś and Sobik [60], the number of foggy days at Praděd in November is probably the third highest in Europe (except for the Scandinavian seacoast and Atlantic islands).
Analysis of the vertical temperature distribution in the whole northern Moravian Mts. region between the 1961–1990 and 1991–2020 periods (see Appendix C) revealed an evident gradual temperature shift of the lowest temperature differences of seasonal TAVG with increasing elevation from MAM towards DJF. Such a shift can be explained by the changes in air circulation and advection in MAM [58,61]. On the other hand, lower temperature differences in DJF in higher elevations (above 1000 m) contrary to higher differences in lowlands, i.e., greater warming in the lowlands than in higher elevations in 1991–2020, could be caused by a major increase in circulation types with western airflow and a considerable decrease in types with prevailing southeastern or eastern airflow directions in DJF [59]. Western airflow directions generally bring more dynamic oceanic air masses with much higher vertical temperature gradient, especially within frontal zones, often reaching into Central Europe, while southeastern directions are in DJF, usually characterized by continental anticyclonic airmasses with a low-temperature gradient, sometimes even temperature inversion. Therefore, lower elevations are much warmer compared to the higher ones during western airflow compared to the southeastern airflow, which is amplified by frequent leeward effect-caused cloud cover and precipitation in higher altitudes during western airflow directions [35], compared to frequent low-level cloud cover during southeastern ones, bringing more sunshine hours into the highest elevations. A substantial influence on temperature shift in MAM/JJA could also have a statistically significant increase in the annual frequencies of anticyclonic circulation types in the CR during 1991–2020, contrary to 1961–1990, as Brázdil et al. [59] proved.
We have found that the temperature conditions of the Vysoká hole station (annual, summer/winter half-year, seasonal and monthly TAVG) matched well to the meteorological measurements conducted at higher altitudes (i.e., the Šerák and Praděd stations). Comparison of the Vysoká hole with the measured (Šerák) and reconstructed (Praděd, since 1997) series showed that the Vysoká hole measurements are representative enough and, at the same time, comparable with measurements of stations included in the CHMI network. Thus, the Vysoká hole station might be used as a verified and substitute meteorological station for the Praděd station, which is no longer in operation.
5. Conclusions
This paper presented a spatiotemporal analysis of homogenised and reconstructed temperature series of selected meteorological stations above 1000 m a.s.l. in the Hrubý Jeseník and Králický Sněžník Mts. between 1961–2020. Moreover, the study introduced the temperature observations, which were compared with other temperature series, from the newly built meteorological station at Vysoká hole. The basic results can be summarised as follows:
- The annual and summer/winter half-year TAVG series revealed a statistically significant increase in 10-year trends in 1961–2020. The strongest trend prevailed in most cases at the highest analyzed station (Praděd) and the summer half-year was becoming warmer faster than the winter half-year.
- Statistically significant increasing trends of seasonal TAVG (except for SON at the Paprsek and Šerák stations) were found, strongest for JJA and weakest for SON. Except for a very low increase or even decrease in temperature in October (statistically insignificant), increasing temperature trends were revealed in all other months.
- Annual TAVG, TMAX and TMIN increased (statistically significantly) between the 1961–1990 and 1991–2020 periods. The highest differences between both normal periods were recorded for TMAX, followed by TMIN and TAVG. Nevertheless, the highest annual differences did not always correspond to the station altitude.
- Climate conditions were becoming warmer more in the higher elevations of the investigated region than in the lower ones in the 1991–2020 period, opposite the 1961–1990 period. That differs from previous studies concerning the CR, indicating slower temperature increase at higher elevations.
- The mean annual number of arctic, ice and frost days decreased in 1991–2020 at all stations (statistically significant decline in the number of ice and frost days). The highest decrease was always observed at the highest altitudes and downsized with decreasing elevation.
- The temperature conditions of the Vysoká hole station were comparable to the stations at similar altitudes. The Vysoká hole station temperature series are representative enough and comparable with measurements of meteorological stations included in the CHMI network.
The outcomes of this study contributed to filling the research gap relating to our sparse knowledge about the temperature variability of central European mountain ridges. They might be applied as the basis for subsequent research on recent global warming impacts on mountain ecosystems, upper timberline changes, or selected snow characteristics. Particularly, the rapid rate of warming in JJA might cause significant changes in suitable tree species distribution, which can be used in forest management or mitigation of alpine grassland degradation.
Author Contributions
Conceptualisation, L.D.; methodology, L.D., J.Ř., K.L., P.Š. and P.Z.; formal analysis, L.D. and J.Ř.; data curation, L.D., J.Ř., K.L. and P.Š.; writing—original draft preparation, L.D.; writing, review and editing, L.D., J.Ř., K.L., P.Š. and P.Z.; visualisation, L.D. and J.Ř.; funding acquisition, L.D. and P.Š. All authors have read and agreed to the published version of the manuscript.
Funding
This research was funded by the Ministry of Education, Youth and Sports of the Czech Republic for SustES—Adaptation strategies for sustainable ecosystem services and food security under adverse environmental conditions project ref. CZ.02.1.01/0.0/0.0/16_019/0000797. J. Ř. also received funding from Masaryk University within the MUNI/A/1323/2022. K. L. was funded by the project ECOPOLARIS (CZ.02.1.01/0.0/0.0/16_013/0001708) and The APC was funded by the Ministry of Education, Youth and Sports of the Czech Republic for SustES—Adaptation strategies for sustainable ecosystem services and food security under adverse environmental conditions project ref. CZ.02.1.01/0.0/0.0/16_019/0000797.
Data Availability Statement
Data used in this study are available from the corresponding author.
Acknowledgments
We thank Marek Lahoda (Masaryk University, Global Change Research Institute, CAS) for his help in data collection from the Vysoká hole station and Jan Balek (Global Change Research Institute, CAS) for providing temperature measurements from the Hrubý Jeseník and Králický Sněžník. The long-term support of EMS Brno (Czech Republic) on instrumentation and measuring devices is very much appreciated.
Conflicts of Interest
The authors declare no conflict of interest.
Appendix A
Figure A1.
Box plots (median, lower and upper quartile, minimum and maximum) of the (a) daily mean, (b) maximum and (c) minimum temperature anomalies (from the 1961–2020 means for respective days of year smoothed by the 21-day window) at the selected meteorological stations Paprsek, Slaměnka, Šerák and Praděd for individual months and the 1961–1990 (blue) and 1991–2020 (red) periods.

Appendix B

Table A1.
Characteristics of selected meteorological stations in the Giant Mts. and the Bohemian Forest.
Table A1.
Characteristics of selected meteorological stations in the Giant Mts. and the Bohemian Forest.
| Station | Altitude (m a.s.l.) | Coordinates | Surface Characteristics | Mountains |
|---|---|---|---|---|
| Rýchory | 1.002 | 50°39′38″, 15°51′01″ | forest | Giant Mts. |
| Churáňov | 1.117 | 49°04′05″, 13°36′55″ | forest | Bohemian Forest |
| Bučina | 1.152 | 48°58′02″, 13°35′33″ | forest | Bohemian Forest |
| Vysoký Stolec | 1.250 | 48°59′14″, 13°36′33″ | forest | Bohemian Forest |
| Labská bouda | 1.320 | 50°46′11″, 15°32′41″ | alpine grassland | Giant Mts. |
| Plechý | 1.344 | 48°46′16″, 13°51 05″ | alpine grassland | Bohemian Forest |
| Luční bouda | 1.413 | 50°44′07″, 15°41′52″ | alpine grassland | Giant Mts. |
| Sněžka | 1.602 | 50°44′08″, 15°44′25″ | alpine grassland | Giant Mts. |
Appendix C
Figure A2.
Temperature differences of mean annual and seasonal (MAM, JJA, SON, DJF) temperatures for the mean (TAVG), maximum (TMAX) and minimum (TMIN) temperatures (°C) for individual elevation levels (m a.s.l.) in the northern Moravian Mts. region between the 1961–1990 and 1991–2020 periods (All differences are statistically significant).

Appendix D
Figure A3.
Q-Q plots of daily mean temperatures for the whole year and seasons comparing the Vysoká hole to the selected meteorological stations Praděd (upper) and Šerák (lower) from November 2017 to December 2021.
Figure A3.
Q-Q plots of daily mean temperatures for the whole year and seasons comparing the Vysoká hole to the selected meteorological stations Praděd (upper) and Šerák (lower) from November 2017 to December 2021.

Appendix E
Figure A4.
20-year moving trends of seasonal (MAM, JJA, SON, DJF) TAVG, TMAX and TMIN between the northern Moravian mountain ridges (MMR) and the Giant Mts. (GM) and the Bohemian Forest (BF) in the 1980–2020 period.
Figure A4.
20-year moving trends of seasonal (MAM, JJA, SON, DJF) TAVG, TMAX and TMIN between the northern Moravian mountain ridges (MMR) and the Giant Mts. (GM) and the Bohemian Forest (BF) in the 1980–2020 period.

References
- Kliment, Z.; Matoušková, M.; Ledvinka, O.; Královec, V. Hodnocení trendů v hydro-klimatických řadách na příkladu vybraných horských povodí (Evaluation of trends in hydro-climatic long-term data series for selected mountains catchments). In Proceedings of the Mikroklima a Mezoklima Krajinných Struktur a Antropogenních Prostředí, Skalní mlýn, Blansko, Česká republika, 2–4 February 2011; Volume 2, p. 52. [Google Scholar]
- Čermák, P.; Mikita, T.; Kadavý, J.; Trnka, M. Evaluating Recent and Future Climatic Suitability for the Cultivation of Norway Spruce in the Czech Republic in Comparison with Observed Tree Cover Loss between 2001 and 2020. Forests 2021, 12, 1687. [Google Scholar] [CrossRef]
- Trnka, M.; Balek, J.; Brázdil, R.; Dubrovský, M.; Eitzinger, J.; Hlavinka, P.; Chuchma, F.; Možný, M.; Prášil, I.; Růžek, P.; et al. Observed changes in the agroclimatic zones in the Czech Republic between 1961 and 2019. Plant Soil Environ. 2021, 67, 154–163. [Google Scholar] [CrossRef]
- Krug, A.; Fenner, D.; Mücke, H.-G.; Scherer, D. The contribution of air temperature and ozone to mortality rates during hot weather episodes in eight German cities during the years 2000 and 2017. Nat. Hazards Earth Syst. Sci. 2020, 20, 3083–3097. [Google Scholar] [CrossRef]
- Vicedo-Cabrera, A.M.; Scovronick, N.; Sera, F.; Royé, D.; Schneider, R.; Tobias, A.; Astrom, C.; Guo, Y.; Honda, Y.; Hondula, D.M.; et al. The burden of heat-related mortality attributable to recent human-induced climate change. Nat. Clim. Chang. 2021, 11, 492–500. [Google Scholar] [CrossRef] [PubMed]
- Petkova, E.P.; Dimitrova, L.K.; Sera, F.; Gasparrini, A. Mortality attributable to heat and cold among the elderly in Sofia, Bulgaria. Int. J. Biometeorol. 2021, 65, 865–872. [Google Scholar] [CrossRef]
- Lynas, M.; Houlton, B.Z.; Perry, S. Greater than 99% consensus on human caused climate change in the peer-reviewed scientific literature. Environ. Res. Lett. 2021, 16, 114005. [Google Scholar] [CrossRef]
- World Meteorological Organization. State of the Global Climate 2021 (WMO-No.1290). Available online: https://library.wmo.int/doc_num.php?explnum_id=11178 (accessed on 13 June 2022).
- Masson-Delmotte, V.; Zhai, P.; Pirani, A.; Connors, S.L.; Péan, C.; Berger, S.; Caud, N.; Chen, Y.; Goldfarb, L.; Gomis, M.I.; et al. IPCC, 2021: Climate Change 2021: The Physical Science Basis. Contribution of Working Group I to the Sixth Assessment Report of the Intergovernmental Panel on Climate Change; Cambridge University Press: Cambridge, UK, 2021; p. 3949. [Google Scholar]
- Viterbi, R.; Cerrato, C.; Bionda, R.; Provenzale, A. Effects of Temperature Rise on Multi-Taxa Distributions in Mountain Ecosystems. Diversity 2020, 12, 210. [Google Scholar] [CrossRef]
- Mihăilă, D.; Bistricean, P.-I.; Horodnic, V.-D. Drivers of Timberline Dynamics in Rodna Montains, Northern Carpathians, Romania, Over the Last 131 Years. Sustainability 2021, 13, 2089. [Google Scholar] [CrossRef]
- Notarnicola, C. Hotspots of snow cover changes in global mountain regions over 2000–2018. Remote. Sens. Environ. 2020, 243. [Google Scholar] [CrossRef]
- Pepin, N.C.; Lundquist, J.D. Temperature trends at high elevations: Patterns across the globe. Geophys. Res. Lett. 2008, 35, L14701. [Google Scholar] [CrossRef] [Green Version]
- Tashilova, A.A.; Kesheva, L.A.; Teunova, N.V.; Taubekova, Z.A. Analysis of temperature variability in the mountain regions of the North Caucasus in 1961–2013. Russ. Meteorol. Hydrol. 2016, 41, 601–609. [Google Scholar] [CrossRef]
- Navarro-Serrano, F.; López-Moreno, J.I.; Azorin-Molina, C.; Alonso-González, E.; Aznarez-Balta, M.; Buisán, S.T.; Revuelto, J. Elevation Effects on Air Temperature in a Topographically Complex Mountain Valley in the Spanish Pyrenees. Atmosphere 2020, 11, 656. [Google Scholar] [CrossRef]
- Weber, R.O.; Talkner, P.; Auer, I.; Böhm, R.; Gajič-Čapka, M.; Zaninovič, K.; Brázdil, R.; Faško, P. 20th-century changes on temperature in the mountain regions of central Europe. Clim. Change 1997, 36, 327–344. [Google Scholar] [CrossRef]
- Jurczak, K.; Kedzia, S. Air temperature in high-altitude areas as exemplified by the Tatra Mountains. Meteorol. Hydrol. Water Manag. 2021, 9, 13. [Google Scholar] [CrossRef]
- Brázdil, R.; Chromá, K.; Dobrovolný, P.; Tolasz, R. Climate fluctuations in the Czech Republic during the period 1961–2005. Int. J. Clim 2009, 29, 223–242. [Google Scholar] [CrossRef]
- Křížová, M. Anomálie Teploty Vzduchu na Území Česka (Air Temperature Anomalies in Czechia). Geogr.-Sb. CGS 2016, 121, 79–98. [Google Scholar]
- Zahradníček, P.; Brázdil, R.; Štěpánek, P.; Trnka, M. Reflections of global warming in trends of temperature characteristics in the Czech Republic, 1961–2019. Int. J. Clim. 2021, 41, 1211–1229. [Google Scholar] [CrossRef]
- Štěpánek, P.; Trnka, M.; Meitner, J.; Dubrovský, M.; Zahradníček, P.; Lhotka, O.; Skalák, P.; Kyselý, J.; Farda, A.; Semerádová, D. Očekávané Klimatické Podmínky v České Republice Část I. Změna Základních Parametrů (Expected Climatic Conditions in the Czech Republic Part I. Change in Basic Parameters); Ústav výzkumu globální změny AV ČR, v.v.i.: Brno, Czech Republic, 2019. [Google Scholar]
- Jůza, P.; Starostová, M.; Sklenář, K. Nameřená minima teploty vzduchu na vybraných horských stanicíh v Čechách (Minimal air temperatures at some mountain stations in Bohemia). Meteorol. Zprávy 2011, 64, 10–17. [Google Scholar]
- Jůza, P. Denní minima teploty vzduchu v Jizerských horách (Daily minimum air temperatures in Jizerské hory). Meteorol. Zprávy 2012, 65, 121–126. [Google Scholar]
- Coufal, L.; Šebek, O. Příroda Krkonošského národního parku (Nature of the Giant Mountains National Park). In Příroda Krkonošského Národního Parku; Fanta, J., Ed.; Státní Zemědělské Nakladatelství: Praha, Czech Republic, 1969; Volume 1, pp. 88–101. [Google Scholar]
- Kliegrová, S.; Metelka, L.; Materna, J. Mění se klima Krkonoš? (Is the climate of the Giant Mountains changing?). Krkonoše-Jizerské Hory 2009, 42, 24–25. [Google Scholar]
- Kliegrová, S.; Kašičková, L. Změny teploty vzduchu a úhrnů srážek v období 1961–2016 v Krkonoších (Changes in air temperature and precipitation in the period 1961–2016 in the Giant Mountains). Meteorol. Zprávy 2019, 72, 88–93. [Google Scholar]
- Tejnská, S.; Tejnský, J. Klimatické poměry Pradědu (Climatic conditions of Praděd). Campanula 1972, 3, 53–60. [Google Scholar]
- Lednický, V.; Pivoňová, E.; Ujházy, F. Teplota vzduchu na Pradědu (Air temperature at Praděd). Campanula 1973, 4, 175–202. [Google Scholar]
- Lednický, V. Zhodnocení klimatických poměrů vrcholových partií Hrubého Jeseníku na příkladu Pradědu pro potřeby rekreace (Evaluation of climatic conditions of the summit parts of the Hrubý Jeseník Mountains on the example of Praděd for recreational purposes). In Proceedings of the Sborník Referátů z Vědecké Pracovní Konference Člověk a Horská Příroda ve 20. stol., Špindlerův mlýn-Svatý Petr, Česká republika; 1977; pp. 175–184. [Google Scholar]
- Lednický, V. Podnebí Pradědu (Climate of Praděd). Sev. Morava 1985, 44–48. [Google Scholar]
- Zahradník, D.; Banaš, M.; Zeidler, M.; Misiaček, R. Klimatická charakteristika alpínského prostředí v nejvyšších partiích Vysokých Sudet (Climatic characteristics of the alpine environment in the highest parts of the High Sudetes). In Proceedings of the Konference ke 40. Výročí Chráněné Krajinné Oblasti Jeseníky (1969–2009), Karlova Studánka, Czech Republic, 11–12 November 2010; pp. 123–126. [Google Scholar]
- Formánek, T. Tisícovky. Hrubý Jeseník (Thousands. The Hrubý Jeseník Mountains). Available online: http://www.tisicovky.cz/cs/hory/hruby-jesenik/ (accessed on 20 August 2021).
- Demek, J.; Mackovčin, P.; Balatka, B.; Buček, A.; Cibulková, P.; Culek, M.; Čermák, P.; Dobiáš, D.; Havlíček, M.; Hrádek, M.; et al. Hory a Nížiny. Zeměpisný Lexikon ČR (Mountains and Lowlands. Geographical Lexicon of the Czech Republic); AOPK ČR: Brno, Czech Republic, 2006; Volume 2, p. 544. [Google Scholar]
- Brázdil, R.; Zahradníček, P.; Dobrovolný, P.; Štěpánek, P.; Trnka, M. Observed changes in precipitation during recent warming: The Czech Republic, 1961–2019. Int. J. Clim. 2021, 41, 3881–3902. [Google Scholar] [CrossRef]
- Řehoř, J.; Brázdil, R.; Lhotka, O.; Trnka, M.; Balek, J.; Štěpánek, P.; Zahradníček, P. Precipitation in the Czech Republic in Light of Subjective and Objective Classifications of Circulation Types. Atmosphere 2021, 12, 1536. [Google Scholar] [CrossRef]
- Rulfová, Z.; Beranová, R.; Kyselý, J. Charakteristiky konvekčních a vrstevnatých srážek na stanicích v České republice v letech 1982–2016 (Characteristics of convective and stratiform precipitation at stations in the Czech Republic over 1982–2016 period). Meteorol. Zprávy 2019, 72, 11–18. [Google Scholar]
- Tolasz, R.; Brázdil, R.; Bulíř, O.; Dobrovolný, P.; Dubrovský, M.; Hájková, L.; Halásová, O.; Hostýnek, J.; Janouch, M.; Kohut, M.; et al. Atlas Podnebí Česka (Climate Atlas of Czechia), 1st ed.; Český Hydrometeorologický Ústav; Univerzita Palackého v Olomouci: Praha, Olomouc, 2007; p. 255. [Google Scholar]
- Lipina, P. Synoptické a klimatologické meteorologické stanice a měření ve vrcholových partiích Jeseníků (Synoptic and climatological stations and measurements on the peaks of the Jeseníky Mountains). Meteorol. Zprávy 2017, 70, 149–155. [Google Scholar]
- Štěpánek, P.; Zahradníček, P.; Brázdil, R.; Tolasz, R. Metodologie Kontroly a Homogenizace Časových Řad v Klimatologii (Methodology of Data Quality Control and Homogenization of Time Series in Climatology); Český Hydrometeorologický Ústav: Praha, Czech Republic, 2011; p. 118. [Google Scholar]
- Štěpánek, P.; Zahradníček, P.; Farda, A. Experiences with data quality control and homogenization of daily records of various meteorological elements in the Czech Republic in the period 1961−2010. Idojárás 2013, 117, 123–141. [Google Scholar]
- Lipina, P. Členění meteorologické staniční sítě ČHMÚ a horské meteorologické stanice v Česku (Classification of the CHMI station network and mountain meteorological stations in the Czech Republic). Meteorol. Zprávy 2017, 70, 134–142. [Google Scholar]
- Coufal, L.; Tolasz, R. Klimatologická databáze CLIDATA—Datový model a jeho aplikace (Climatological database CLIDATA–Data model and its application). Meteorol. Zprávy 2001, 54, 83–93. [Google Scholar]
- World Meteorological Organization. Guide to Meteorological Instruments and Methods of Observation; World Meteorological Organization: Geneva, Switzerland, 2008; Volume 7, p. 681.
- Štěpánek, P.; Zahradníček, P.; Huth, R. Interpolation techniques used for data quality control and calculation of technical series: An example of Central European daily time series. Idojárás 2011, 115, 87–98. [Google Scholar]
- Czech Meteorological Society. Electronic Meteorological Glosary (eMS). Available online: http://slovnik.cmes.cz/ (accessed on 30 June 2022).
- Csagoly, P. Carpathians’ Environment Outlook 2007; United Nations Environment Programme, Division of Early Warning and Assessment–Europe: Geneva, Switzerland, 2007; pp. 89–188. [Google Scholar]
- Ohmura, A. Enhanced temperature variability in high-altitude climate change. Theor. Appl. Clim. 2012, 110, 499–508. [Google Scholar] [CrossRef]
- Micu, D.M.; Dumitrescu, A.; Cheval, S.; Nita, I.A.; Birsan, M.V. Temperature changes and elevation-warming relationships in the Carpathian Mountains. Int. J. Clim. 2021, 41, 2154–2172. [Google Scholar] [CrossRef]
- Casty, C.; Wanner, H.; Luterbacher, J.; Esper, J.; Bohm, R. Temperature and precipitation variability in the european Alps since 1500. Int. J. Clim. 2005, 25, 1855–1880. [Google Scholar] [CrossRef]
- Pepin, N.; Bradley, R.S.; Diaz, H.F.; Baraer, M.; Caceres, E.B.; Forsythe, N.; Fowler, H.; Greenwood, G.; Hashmi, M.Z.; Liu, X.D.; et al. Elevation-dependent warming in mountain regions of the world. Nat. Clim. Chang. 2015, 5, 424–430. [Google Scholar] [CrossRef] [Green Version]
- Tolasz, R. Klima horských oblastí v Česku (Climate of mountain regions in the Czech Republic). In Proceedings of the 120 Let Meteorologických Měření a Pozorování na Lysé Hoře. Sborník Příspěvků z Konference Pořádané Českým Hydrometeorologickým Ústavem a Českou Meteorologickou Společností Konané na Lysá Hoře ve Dnech, Lysá hora, Czech Republic, 14–15 June 2017; pp. 145–149. [Google Scholar]
- Průša, J. Atlas Podnebí ČSR. Textová A Tabulková Část (Atlas of the Climate of the Czechoslovakia. Text and Tabular Part); Ústřední správa Geodézie a Kartografie: Praha, Czech Republic, 1958. [Google Scholar]
- Culek, M. Vliv borovice kleče na klima, hydrické a nivální procesy (Influence of dwarf pine on climate, hydric and alluvial processes). In Kleč v horské krajině Hrubého Jeseníku. Geobiocenologické spisy, svazek č. 16; Ústav lesnické botaniky, dendrologie a geobiocenologie, Lesnická a dřevařská fakulta Mendelovy univerzity v Brně. Akademické nakladatelství CERM: Brno, Czech Republic, 2012; pp. 69–168. [Google Scholar]
- Krška, K.; Šamaj, M. Dějiny Meteorologie v Českých Zemích a na Slovensku (The History of Meteolrology in the Czech Lands and in Slovakia); Karolinum: Praha, Czech Republic, 2001. [Google Scholar]
- Šenfeldr, M.; Maděra, P.; Buček, A.; Roštínský, P.; Špinlerová, Z.; Culek, M.; Friedl, M.; Štykar, J.; Vavříček, D.; Pecháček, J.; et al. Kleč v Horské Krajině Hrubého Jeseníku (Dwarf Pine in the Mountain Landscape of the Hrubý Jeseník Mountains). Geobiocenologické Spisy, Svazek č. 16; Ústav Lesnické Botaniky, Dendrologie a Geobiocenologie, Lesnická a Dřevařská Fakulta Mendelovy Univerzity v Brně. Akademické Nakladatelství CERM: Brno, Czech Republic, 2012; p. 236. [Google Scholar]
- Cheval, S.; Birsan, M.-V.; Dumitrescu, A. Climate variability in the Carpathian Mountains Region over 1961–2010. Glob. Planet. Chang. 2014, 118, 85–96. [Google Scholar] [CrossRef]
- Lapin, M.; Štastný, P.; Chmelík, M. Detection of climate change in the Slovak mountains. Hrvat. Meteoroloski Cas. 2005, 40, 101–104. [Google Scholar]
- Řehoř, J.; Brázdil, R.; Trnka, M.; Lhotka, O.; Balek, J.; Možný, M.; Štěpánek, P.; Zahradníček, P.; Mikulová, K.; Turňa, M. Soil drought and circulation types in a longitudinal transect over central Europe. Int. J. Clim. 2021, 41, E2834–E2850. [Google Scholar] [CrossRef]
- Brázdil, R.; Zahradníček, P.; Dobrovolný, P.; Řehoř, J.; Trnka, M.; Lhotka, O.; Štěpánek, P. Circulation and Climate Variability in the Czech Republic between 1961 and 2020: A Comparison of Changes for Two Normal Periods. Atmosphere 2022, 13, 137. [Google Scholar] [CrossRef]
- Błaś, M.; Sobik, M. Mgla w Karkonoszach i wybranych masivach górskich Europy. Opera Corcon. 2000, 37, 35–46. [Google Scholar]
- Lhotka, O.; Trnka, M.; Kyselý, J.; Markonis, Y.; Balek, J.; Možný, M. Atmospheric Circulation as a Factor Contributing to Increasing Drought Severity in Central Europe. J. Geophys. Res. Atmos. 2020, 125, e2019JD032269. [Google Scholar] [CrossRef]
Figure 1.
The Hrubý Jeseník and Králický Sněžník Mts. with highlighted analysed meteorological stations (Data source: Global Digital Elevation Model Version 3).
Figure 1.
The Hrubý Jeseník and Králický Sněžník Mts. with highlighted analysed meteorological stations (Data source: Global Digital Elevation Model Version 3).

Figure 2.
Automatic weather station at Vysoká hole (1464 m a.s.l.) in the Hrubý Jeseník Mts. (photo by K. Láska, 2022).
Figure 2.
Automatic weather station at Vysoká hole (1464 m a.s.l.) in the Hrubý Jeseník Mts. (photo by K. Láska, 2022).

Figure 3.
Annual temperature variability and linear trends (dashed) at the selected meteorological stations Paprsek, Praděd, Slaměnka and Šerák in the 1961–2020 period.
Figure 3.
Annual temperature variability and linear trends (dashed) at the selected meteorological stations Paprsek, Praděd, Slaměnka and Šerák in the 1961–2020 period.

Figure 4.
Seasonal temperature variability and linear trends (dashed) at the selected meteorological stations Paprsek, Praděd, Slaměnka and Šerák in (a) MAM, (b) JJA, (c) SON and (d) DJF in the 1961–2020 period (A timeline in DJF corresponds to the individual winter seasons).
Figure 4.
Seasonal temperature variability and linear trends (dashed) at the selected meteorological stations Paprsek, Praděd, Slaměnka and Šerák in (a) MAM, (b) JJA, (c) SON and (d) DJF in the 1961–2020 period (A timeline in DJF corresponds to the individual winter seasons).

Figure 5.
Daily temperature amplitude (°C) at the selected meteorological stations Paprsek, Slaměnka, Šerák and Praděd for individual months and the 1961–1990 (blue, a) and 1991–2020 (red, b) periods.
Figure 5.
Daily temperature amplitude (°C) at the selected meteorological stations Paprsek, Slaměnka, Šerák and Praděd for individual months and the 1961–1990 (blue, a) and 1991–2020 (red, b) periods.

Figure 6.
Mean annual temperature gradient in the studied area between the 1961–1990 (blue) and 1991–2020 (green) periods, described by individual grid-point values and linear regression fit.
Figure 6.
Mean annual temperature gradient in the studied area between the 1961–1990 (blue) and 1991–2020 (green) periods, described by individual grid-point values and linear regression fit.

Figure 7.
Spatial variability of mean annual temperature (°C) in the northern Moravian Mts. region between the 1961–1990 and 1991–2020 periods and its difference.
Figure 7.
Spatial variability of mean annual temperature (°C) in the northern Moravian Mts. region between the 1961–1990 and 1991–2020 periods and its difference.

Figure 8.
Spatial variability of mean seasonal (MAM, JJA, SON, DJF) temperatures (°C) in the northern Moravian Mts. region in the 1961–1990 and 1991–2020 periods and their difference.
Figure 8.
Spatial variability of mean seasonal (MAM, JJA, SON, DJF) temperatures (°C) in the northern Moravian Mts. region in the 1961–1990 and 1991–2020 periods and their difference.

Figure 9.
Differences in mean monthly temperature between the selected meteorological stations Paprsek, Slaměnka, Šerák and Praděd and the Vysoká hole station from November 2017 to December 2021.
Figure 9.
Differences in mean monthly temperature between the selected meteorological stations Paprsek, Slaměnka, Šerák and Praděd and the Vysoká hole station from November 2017 to December 2021.

Figure 10.
20-year moving trends of annual TAVG, TMAX, and TMIN between the northern Moravian mountain ridges (MMR) and the Giant Mts. (GM) and the Bohemian Forest (BF) in the 1980–2020 period.
Figure 10.
20-year moving trends of annual TAVG, TMAX, and TMIN between the northern Moravian mountain ridges (MMR) and the Giant Mts. (GM) and the Bohemian Forest (BF) in the 1980–2020 period.

Table 1.
Characteristics of selected meteorological stations in the Hrubý Jeseník and Králický Sněžník Mts. (data based on CLIDATA database [42]).
Table 1.
Characteristics of selected meteorological stations in the Hrubý Jeseník and Králický Sněžník Mts. (data based on CLIDATA database [42]).
| Station | Period (Original/ Reconstructed Series) | Altitude (m a.s.l.) | Coordinates | Surface Characteristics | Mountains |
|---|---|---|---|---|---|
| Paprsek | 2010–2021/1961–2009 | 1.006 | 50°12′33″, 16°59′20″ | forest | Králický Sněžník |
| Slaměnka | 2011–2021/1961–2010 | 1.100 | 50°09′04″, 16°49′58″ | forest | Králický Sněžník |
| Šerák | 2004–2021/1961–2003 | 1.328 | 50°11′15″, 17°06′29″ | forest | Hrubý Jeseník |
| Vysoká hole | 2017–2021/- | 1.464 | 50°03′35″, 17°13′53″ | alpine grassland | Hrubý Jeseník |
| Praděd | 1961–1997/1998–2021 | 1.492 | 50°04′59″, 17°13′55″ | alpine grassland | Hrubý Jeseník |
Table 2.
Decadal linear trends of mean monthly, seasonal (MAM, JJA, SON, DJF), annual and summer/winter-half year temperatures at the selected meteorological stations Paprsek, Praděd, Slaměnka and Šerák in the 1961–2020 period (Bold numbers mean statistically significant at 5% (p < 0.05)).
Table 2.
Decadal linear trends of mean monthly, seasonal (MAM, JJA, SON, DJF), annual and summer/winter-half year temperatures at the selected meteorological stations Paprsek, Praděd, Slaměnka and Šerák in the 1961–2020 period (Bold numbers mean statistically significant at 5% (p < 0.05)).
| Station | Paprsek | Slaměnka | Šerák | Praděd |
|---|---|---|---|---|
| Month | ||||
| January | 0.28 | 0.33 | 0.24 | 0.38 |
| February | 0.19 | 0.24 | 0.17 | 0.27 |
| March | 0.24 | 0.29 | 0.22 | 0.35 |
| April | 0.37 | 0.45 | 0.35 | 0.46 |
| May | 0.29 | 0.38 | 0.27 | 0.37 |
| June | 0.34 | 0.43 | 0.32 | 0.40 |
| July | 0.46 | 0.56 | 0.42 | 0.50 |
| August | 0.49 | 0.57 | 0.42 | 0.51 |
| September | 0.08 | 0.14 | 0.03 | 0.19 |
| October | 0.01 | 0.03 | −0.04 | 0.17 |
| November | 0.31 | 0.38 | 0.34 | 0.52 |
| December | 0.35 | 0.41 | 0.38 | 0.48 |
| Season | ||||
| MAM | 0.30 | 0.37 | 0.28 | 0.39 |
| JJA | 0.43 | 0.52 | 0.39 | 0.47 |
| SON | 0.13 | 0.18 | 0.11 | 0.29 |
| DJF | 0.29 | 0.34 | 0.28 | 0.40 |
| Summer half-year | 0.34 | 0.42 | 0.30 | 0.41 |
| Winter half-year | 0.24 | 0.29 | 0.23 | 0.37 |
| Year | 0.28 | 0.35 | 0.26 | 0.38 |
Table 3.
Mean annual temperatures (TAVG), mean annual maximum temperatures (TMAX) and mean annual minimum temperatures (TMIN) (°C) at the selected meteorological stations Paprsek, Praděd, Slaměnka and Šerák in the 1961–1990 and 1991–2020 periods and their differences (diff) (Bold numbers mean statistically significant at 5% (p < 0.05)).
| Station | Paprsek | Slaměnka | Šerák | Praděd | ||
|---|---|---|---|---|---|---|
| Temp. Char. | Period | Mean of All Stations | ||||
| 1961–1990 | 4.09 | 3.49 | 2.39 | 1.02 | 2.75 | |
| TAVG | 1991–2020 | 4.95 | 4.52 | 3.16 | 2.02 | 3.66 |
| diff | 0.86 | 1.03 | 0.77 | 1.00 | 0.92 | |
| 1961–1990 | 7.98 | 6.99 | 5.56 | 3.95 | 6.12 | |
| TMAX | 1991–2020 | 9.08 | 8.29 | 6.53 | 5.28 | 7.29 |
| diff | 1.10 | 1.29 | 0.97 | 1.33 | 1.17 | |
| 1961–1990 | 0.62 | 0.35 | −0.39 | −1.44 | −0.22 | |
| TMIN | 1991–2020 | 1.55 | 1.41 | 0.32 | −0.38 | 0.73 |
| diff | 0.93 | 1.06 | 0.71 | 1.06 | 0.95 |
Table 4.
Differences (diff) in mean seasonal (MAM, JJA, SON, DJF) and summer/winter half-year temperatures for mean (TAVG), maximum (TMAX) and minimum (TMIN) temperatures (°C) at the selected meteorological stations Paprsek, Slaměnka, Šerák and Praděd between the 1961–1990 and 1991–2020 periods (Bold numbers mean statistically significant at 5% (p < 0.05)).
| Station | Paprsek | Slaměnka | Šerák | Praděd | ||
|---|---|---|---|---|---|---|
| Temp. Char. | Season/Half-Year Diff | Mean of All Stations | ||||
| MAM | 0.90 | 1.07 | 0.84 | 1.04 | 0.96 | |
| JJA | 1.54 | 1.77 | 1.37 | 1.46 | 1.53 | |
| SON | 0.33 | 0.46 | 0.24 | 0.71 | 0.44 | |
| TAVG | DJF | 0.66 | 0.81 | 0.63 | 0.83 | 0.73 |
| Summer half-year | 1.17 | 1.38 | 1.04 | 1.20 | 1.20 | |
| Winter half-year | 0.54 | 0.68 | 0.50 | 0.82 | 0.64 | |
| MAM | 1.34 | 1.52 | 1.15 | 1.46 | 1.37 | |
| JJA | 1.90 | 2.15 | 1.74 | 2.08 | 1.97 | |
| SON | 0.40 | 0.60 | 0.36 | 0.61 | 0.49 | |
| TMAX | DJF | 0.77 | 0.90 | 0.63 | 1.17 | 0.87 |
| Summer half-year | 1.56 | 1.80 | 1.40 | 1.67 | 1.61 | |
| Winter half-year | 0.64 | 0.79 | 0.54 | 0.99 | 0.74 | |
| MAM | 0.85 | 0.97 | 0.66 | 1.11 | 0.90 | |
| JJA | 1.50 | 1.69 | 1.25 | 1.45 | 1.47 | |
| SON | 0.64 | 0.72 | 0.37 | 0.77 | 0.62 | |
| TMIN | DJF | 0.76 | 0.87 | 0.57 | 0.91 | 0.78 |
| Summer half-year | 1.16 | 1.32 | 0.91 | 1.22 | 1.15 | |
| Winter half-year | 0.72 | 0.80 | 0.51 | 0.90 | 0.73 |
Table 5.
Mean annual number of selected characteristic days (arctic, ice, frost, summer) at the selected meteorological stations Paprsek, Slaměnka, Šerák and Praděd between the 1961–1990 and 1991–2020 periods (NP) and their differences (diff) (Bold numbers mean statistically significant at 5% (p < 0.05)).
| Station | Paprsek | Slaměnka | Šerák | Praděd | |
|---|---|---|---|---|---|
| Day | Period | ||||
| 1961–1990 | 2.9 | 3.2 | 5.3 | 13.1 | |
| Arctic | 1991–2020 | 1.4 | 1.6 | 4.2 | 7.9 |
| diff | −1.4 | −1.6 | −1.1 | −5.2 | |
| 1961–1990 | 78.5 | 91.2 | 103.3 | 128.4 | |
| Ice | 1991–2020 | 68.6 | 78.1 | 94.2 | 108.5 |
| diff | −9.9 | −13.1 | −9.1 | −19.9 | |
| 1961–1990 | 163.8 | 168.9 | 181.7 | 198.7 | |
| Frost | 1991–2020 | 153.1 | 156.2 | 172.2 | 182.4 |
| diff | −10.7 | −12.7 | −9.5 | −16.3 | |
| 1961–1990 | 3.1 | 1.2 | 0.2 | 0.0 | |
| Summer | 1991–2020 | 9.2 | 6.6 | 1.2 | 0.3 |
| diff | 6.2 | 5.3 | 1.0 | 0.2 |
Disclaimer/Publisher’s Note: The statements, opinions and data contained in all publications are solely those of the individual author(s) and contributor(s) and not of MDPI and/or the editor(s). MDPI and/or the editor(s) disclaim responsibility for any injury to people or property resulting from any ideas, methods, instructions or products referred to in the content. |
© 2023 by the authors. Licensee MDPI, Basel, Switzerland. This article is an open access article distributed under the terms and conditions of the Creative Commons Attribution (CC BY) license (https://creativecommons.org/licenses/by/4.0/).
Share and Cite
MDPI and ACS Style
Dolák, L.; Řehoř, J.; Láska, K.; Štěpánek, P.; Zahradníček, P. Air Temperature Variability of the Northern Mountains in the Czech Republic. Atmosphere 2023, 14, 1063. https://doi.org/10.3390/atmos14071063
AMA Style
Dolák L, Řehoř J, Láska K, Štěpánek P, Zahradníček P. Air Temperature Variability of the Northern Mountains in the Czech Republic. Atmosphere. 2023; 14(7):1063. https://doi.org/10.3390/atmos14071063
Chicago/Turabian StyleDolák, Lukáš, Jan Řehoř, Kamil Láska, Petr Štěpánek, and Pavel Zahradníček. 2023. "Air Temperature Variability of the Northern Mountains in the Czech Republic" Atmosphere 14, no. 7: 1063. https://doi.org/10.3390/atmos14071063
Note that from the first issue of 2016, this journal uses article numbers instead of page numbers. See further details here.