
Modelling of Wildfire Susceptibility in Different Climate Zones in Montenegro Using GIS-MCDA
by
 , , and
Gojko Nikolić
1,
Filip Vujović
1,
Jelena Golijanin
2,
Ante Šiljeg
3 and
and
Aleksandar Valjarević
4,* 1
Department of Geography, Faculty of Philosophy, University of Montenegro, Danila Bojovića bb, 81400 Nikšić, Montenegro
2
Department of Geography, Faculty of Philosophy, University of East Sarajevo, Vuka Karadzića 30, 71126 Istočno Sarajevo, Bosnia and Herzegovina
3
Department of Geography, University of Zadar, Trg kneza Višeslava 9, 23000 Zadar, Croatia
4
Faculty of Geography, University of Belgrade, Studentski Trg 3/III, 11000 Belgrade, Serbia
*
Author to whom correspondence should be addressed.
Atmosphere 2023, 14(6), 929; https://doi.org/10.3390/atmos14060929
Submission received: 27 April 2023
/
Revised: 16 May 2023
/
Accepted: 23 May 2023
/
Published: 25 May 2023
(This article belongs to the Special Issue Cloudiness, Weather Modification and Their Effects on Populations, Environment and Land)
Abstract
:Montenegro has different influences on the weather and climate; in general, according to Köppen’s classification, there are two climate zones: warm temperate (C) and cold temperate (D). The aim of this study is to determine the susceptibility to wildfires in the Montenegrin coastal municipality of Budva and the northern municipality of Rožaje, which are located in different climatic conditions, using multicriteria GIS decision analysis (GIS-MCDA). Nine natural and anthropogenic criteria were used for the analysis. Open geospatial data were used as input data for all criteria. The assignment of weighting coefficients for the criteria in relation to wildfire susceptibility importance was based on the Analytic Hierarchy Process (AHP) and Fuzzy Analytic Hierarchy Process (F-AHP) procedures. The results for the AHP and F-AHP models were obtained using the Weighted Linear Combination (WLC) method. According to the AHP model, the very high and high category covers 80.93% of the total area in Budva and 80.65% in Rožaje. According to the F-AHP model, the very high and high category occupies 80.71% of the total area in Budva and 82.30% in Rožaje. The validation shows that the models of GIS-MCDA perform fair in both climatic zones. The proposed models, especially in the absence of geospatial data, can be a strategic and operational advantage in the development of plans and strategies for protection against wildfires.
1. Introduction
Forests, shrublands, and other wilderness areas perform outstanding ecological functions. By regulating climate, reducing soil erosion, and, of course, producing oxygen, they play an important role in maintaining public health while providing a wealth of opportunities for tourism and recreation [1].
Wildfires burn uncontrollably in a natural environment where vegetation is the main and primary fuel. They belong to a group of large-scale natural disasters that increase the intensity of devastation and destruction of forests, shrublands, and wilderness areas. Because they are a global phenomenon, they pose numerous forms of threat to many countries around the world. Every year, hundreds of millions of hectares of these areas are destroyed in this way [2]. Their impact on the physical and biological environment is difficult to assess; they affect land use, land cover, ecosystems, biodiversity, and current climate changes. As such, they determine to some extent the socioeconomic system of the areas where they occur [3].
Higher susceptibility to wildfires is associated with anthropogenic influences and current climate change [4,5]. Given that humans are the main cause of almost all fires, the situation will worsen and lead to conflicts in the future, given the projected increase in the human population and the increasing change in land use [6]. The climate change scenario predicts an average temperature increase of 4–6 °C by the end of this century in Europe and a decrease in total precipitation with an uneven distribution over the year. Wildfires are also expected to become more frequent due to more temperature extremes and droughts. The greatest changes are expected in the transition between the Mediterranean and Euro-Siberian regions [7], where the territory of southeastern Europe is located. The predominant deciduous forests of oak and beech may be replaced by evergreen Mediterranean vegetation, which is more susceptible to wildfires. Therefore, a further increase in susceptibility is expected due to changes in the type of vegetation fuel [8,9].
The analysis of wildfire events in the last decade is an important task in many countries. Knowledge of spatial future events in the environment is essential for appropriate spatial management [10]. Geospatial technologies provide accurate information about time and space. Therefore, geographic information systems (GIS) and remote sensing (RS) are effective tools for spatial analysis, which has been proven in the past [11,12,13,14,15].
The European Forest Fire Information System (EFFIS) was established by the European Commission and supported by the European Union (https://effis.jrc.ec.europa.eu (accessed 10 April 2023)). This system is useful to determine the present, but it does not succeed in storing all past wildfires. The proposed mathematical framework was developed to use an ensemble strategy to simulate wildfire dynamics under given sequences of fire spread control measures and updated data-driven information. This system is also used for precise satellite imagery and web maps for a better analysis of wildfire characteristics [16].
GIS and multicriteria decision analysis (GIS-MCDA) are integrated and are becoming an increasingly popular method for developing models in various application areas [17], such as: Environmental Planning and Management [18,19,20,21,22]; Natural Hazards, Vulnerabilities, and Risks Modeling [23,24,25]; Hydrology and Water Resources [26,27]; Agriculture and Forestry [28,29].
In many studies in countries around the world, GIS-MCDA is used to model wildfire risks, hazards, and vulnerability. The analytical hierarchy process (AHP) is most often used as a method to determine the weighting coefficients [3,13,30,31,32,33,34,35,36,37,38,39,40,41], and the fuzzy AHP (F-AHP) is still in use [41,42,43,44,45,46]. In addition to the GIS-MCDA, other approaches are also used for wildfire modelling, such as the frequency ratio (FR) [37,47], analytical network process (ANP) and fuzzy logic [48], logistic regression (LR) [49,50] and various machine learning (ML) approaches [50,51,52,53,54]. Although machine learning performs better as an approach after validation, allows for non-linear relationships between criteria and wildfire occurrence, and faster data processing [54], GIS-MCDA is the most commonly used approach because it is easier for statistical processing, models the problem in a natural way, can use open geospatial data with the support of kinematics in a minimal domain, and the results are easy to interpret [42,55]. Nevertheless, it is important to say that the main sources of GIS-MCDA uncertainty are in the selection of criteria and later in their standardization and specification, which is a consequence of variability in model selection, weighting factors, system understanding, and human judgment [13,41,42].
This study aims to determine the susceptibility to wildfires from open geospatial data in two Montenegrin municipalities in different climatic zones using the GIS-MCDA weighting coefficient methods AHP and F-AHP. In addition, the study aims to compare the accuracy between AHP and F-AHP after validation.
2. Study Area
2.1. General Characteristics of Montenegro
Montenegro is a country located in southeastern Europe, i.e., on the Balkan Peninsula, between latitudes 41°52′–43°32′ N and longitudes 18°26′–20°21′ E (Figure 1). It covers a total area of 13 883 km2 with a population of about 620 000 inhabitants [56]. Administratively, it is divided into 24 municipalities. The country has a 293.5 km coastline on the Adriatic Sea. In terms of relief, Montenegro is a mountainous country, formed by the mountain systems of the Dinaric Mountains and Prokletije. The classification of the terrain is in the range of 0–2534 m a.s.l. The hypsometric category up to 200 m in relation to the area it occupies is involved with 10%, the category between 200 and 1000 m with 35%, the category between 1000 and 1500 m with 40% and above 1500 m with 15%. In terms of landforms, there is a great diversity, ranging from sandy and rocky coasts, karst fields and plateaus, canyons and high mountains with periglacial character in a small area. According to the natural geographic and sociogeographic features, three regional units can be distinguished: Coastal, Central and Northern Montenegro [57,58].
Geographical position, air circulation in the context of cyclonic and anticyclonic activity (Genoa cyclone, Adriatic cyclone, Icelandic depression, Black Sea depression, Azores anticyclone, Siberian anticyclone, Central European anticyclone, arctic cold front from the north and tropical warm front from the south), the geomorphological features and the proximity to the sea are the most important factors affecting the climate and weather in Montenegro [59,60].
According to Köppen’s classification, two climatic zones are distinguished: warm temperate climate (C) and cold temperate climate (D). A moderately warm climate is widespread in hypsometric lower areas, while climate D is represented in the higher mountainous regions in the interior of Montenegro towards the north, mostly in the hypsometric zone over 1000 m. Within these two climates, there are three types (Cs, Cf and Df) and five subtypes (Csa, Csb, Cfb, Dfb and Dfc) [60,61,62].
The vegetation is very complex. In addition to zonal vegetation types, which are conditioned by general climatic conditions, there are various azonal, intrazonal and extrazonal vegetation types, which are conditioned by specific ecological factors in a given habitat [63]. Of the total area, forests occupy about 59.5% and ‘other’ occupies 9.9% of the forest land. Both classes cover almost 70% (964,262 ha) of the total territory. High forests account for 51.1% (with 253.1 m3/ha), and the remaining 48.9% (with 62.6 m3/ha) of the forest area belongs to coppice cover. A total of 68 tree species were registered, of which 57 belong to deciduous species, while the remaining 11 species were conifers [64].
From 2005 to 2015, there were about 800 large wildfires in Montenegro, which damaged or destroyed more than 18,000 ha of forest and over 800,000 m3 of wood. In the record year 2012, fires covered 7% of the forest area. The fire season in Montenegro was the worst in 2017. In that year, 124 wildfires larger than 30 ha were registered, affecting a total of 51,661 ha, which is six times more than the area registered in 2016 [65].
2.2. Characteristics of the Coastal Montenegrin Municipality of Budva
The municipality of Budva is located in the southern, coastal part of Montenegro. The coastal part has all the typical geographical features of the Mediterranean. It is located between the geographical longitudes 18°47′–18°49′ E and latitudes 42°15′–42°21′ N (Figure 1a). The area of the municipality is about 120 km2. There are about 19,000 inhabitants living in the municipality [66]. The location of Budva is extremely favorable, and it is called one of the most important tourist destinations in this part of the Adriatic. This is also confirmed by Milošević’s analysis [67]. In terms of morphological characteristics, three vertical elevation zones are distinguished in the territory of the Municipality of Budva: the coastal zone up to 100 m; the coastal zone of flysch from 100 m to 500 m; and the Lovćen barrier, slopes and areas of Lovćen from 500 m to 1400 m [66].
According to the Köppen classification, the area is characterized by the following climate subtypes: Csa—Mediterranean climate with a hot summer; Cs/s”/b—a transitional variant of Etesic climate with a hot summer; and Cfb—a moderately warm and wavy climate with a hot summer [62]. On the territory of the Municipality of Budva, there is a Eumediterranean evergreen vegetation with a contact zone of thermophilic sub-Mediterranean deciduous forests [66]. According to the planning document Disaster Risk Assessment of Montenegro [65], Budva is classified in the first, second and third degree of vulnerability, i.e., in the range of very high, high and moderate vulnerability to wildfires.
2.3. Characteristics of the Northern Montenegrin Municipality of Rožaje
Rožaje is located in the northeast of Montenegro on the upper reaches of the Ibar River and belongs to its northern region, which lies between latitudes 42°44′–42°59′ N and longitudes 20°00′–20°21′ E (Figure 1b). It covers an area of 431 km2. About 22,000 inhabitants live in the municipality [56,68].
The hypsometric curve clearly shows that the Rožaje area belongs to the mountainous landscapes. Its fragmented character can be seen in the unevenness of 1643 m, the lowest topographic point of which is 760 m a.s.l. in the bed of the river Ibar in the direction of Špiljani, and the highest on the top of the mountain Hajla at 2403 m a.s.l. The following are distinguished as geomorphological units: a mountainous area on the right bank of the Ibar River, a hilly and middle mountainous area on the left bank of the Ibar River and Baraka Valley [68].
According to the Köppen classification, the area is classified as cold temperate D climate. This is the climate characteristic of the higher regions, mostly above 1000 m a.s.l., with type Df and two subtypes. Thus, the Rožaje are a typical representative of the Dfwby subtype, i.e., a variant of the temperate cold climate [62].
Forests are the most important type of plant communities and vegetation cover. Due to the large differences in elevation, the vegetation is zonally distributed. The different types of vegetation change from the foothills to the peaks, ranging from sub-Mediterranean xerothermic thickets to subnival vegetation around the snowfields on Hajla and other mountains [69]. The degree of forest cover in the Rožaje is high and well above the national average. According to the planning document Disaster Risk Assessment of Montenegro [65], Rožaje is classified in the second and third degree of vulnerability, i.e., in the area of high and medium vulnerability to wildfires.
3. Materials and Methods
Multicriteria decision analysis (MCDA) can be defined as a set of formal procedures that focus on the most important decision criteria [70]. A particular form of multicriteria analysis is its integration with GIS. Thus, multicriteria GIS decision analysis (GIS-MCDA) can be defined as a process of transforming and combining geospatial data to obtain new information of value for decision making. By comparing each other and evaluating the effects of several different criteria, the suitability or susceptibility of a particular space to a phenomenon or process was determined [71]. The modeling of wildfire susceptibility in this study was based on the method GIS-MCDA. The entire process of GIS-MCDA modeling was implemented in the open-source software QGIS (https://www.qgis.org/en/site/forusers/download.html (accessed 10 April 2023)). The AHP was implemented in the LibreOffice software (https://www.libreoffice.org/download/download-libreoffice/ (accessed 10 April 2023)), which is also open source.
The procedure of GIS-MCDA for the purpose of modeling wildfire susceptibility in this study is based on six steps (Figure 2): setting the goal or problem definition; determination of criteria; standardization of criteria values; determination of criteria weights; analysis results (standardization of standardized values and weight of criteria); and validation of results [71,72,73,74].
3.1. Multicriteria Analysis Goal Setting/Problem Definition
The basis of any GIS-MCDA is the setting of a goal: the determination of the problem in space that the performance of the analysis will attempt to solve. The goal set, to be achievable, must be SMART, which means that it must be specific (S), measurable (M), achievable (A), relevant (R), and time-bound (T) [72]. Increasingly, wildfires are the result of anthropogenic influences and modern climatic changes. Wildfires and burned areas are increasing [6]. For this reason, it is crucial to develop optimal methods and models that contribute to the better planning and organization of forest protection. In accordance with the above, this multicriteria analysis aims to model wildfire susceptibility.
3.2. Determination of Criteria
For the method GIS-MCDA to be applied, it was necessary to select criteria and constraints that were not necessary and relevant to the analysis [74]. Both types of criteria were established based on a combination of the characteristics of the studied area, a review of the professional literature [30,31,32,33,34,35,36,37,38,39,40,41,42,43,44,45,46] and the opinion of experts from the Budva Municipality Rescue Service and the Environmental Protection Agency of Montenegro.
The second type of criteria represents exclusion criteria that were not necessary and relevant for the analysis. Nine natural and anthropogenic criteria were used for the analysis: (C1) land cover, (C2) aspect, (C3) slope, (C4) elevation, (C5) temperature, (C6) precipitation, (C7) distance from road, (C8) distance from settlement, (C9) exclusion criteria. Open geospatial data were used to determine the criteria, which were converted to a 25 m resolution grid and re-projected to the Mercator Universal Transverse Projection (UTM 34N) coordinate system on a WGS 84 rotating ellipsoid (EPSG: 32634). The list of criteria, data sources, resolutions and formats used can be found in Table 1.
3.2.1. Criterion Land Cover
For land cover analysis, open satellite imagery is mostly used for Earth observations [79]. One of the most important and widely used geodatabases in Europe that can be used to monitor land cover changes is the CORINE Land Cover (CLC) geodatabase developed by the European Environmental Protection Agency. The inventory includes 44 land cover classes. The geometric accuracy is 100 m. The minimum mapping unit is 25 hectares for polygons and the minimum line width for line objects is 100 m. Thematic accuracy is ≥85% (https://land.copernicus.eu/pan-european/corine-land-cover (accessed on 10 March 2023)).
Vegetation types and their characteristics were given based on CORINE Land Cover 2018. The main criteria affecting wildfire spread are vegetation type and characteristics. In general, coniferous species are more flammable than deciduous species due to gums and resins in the cambium and leaves. There is a great difference in susceptibility to ignition and burning between these two groups, but also between different species within the same tree group [80]. Another important factor that increases susceptibility to wildfire is the age of forest trees. Susceptibility is much higher in young trees in young stands because the crowns have not yet closed and the soil is exposed to sunlight and heat for a longer period of time. This allows for the development of grassy and shrubby vegetation, which is excellent fuel when dry [81].
3.2.2. Topographic Group of Criteria (Aspect, Slope and Elevation)
The occurrence of fires depends on the topographic group of criteria [39]. As elevation increases, the composition of the substrate changes and the average temperature decreases. The slope also affects the spread of fire. On steep slopes, fire spreads faster and up to four times faster than on flat land. The slope affects the formation of forest stands. Fire susceptibility is greater in south and southwest-facing areas, where solar radiation lasts longer. The northern and northeastern regions are among the categories least susceptible to wildfire outbreaks [39,80].
The model EU-DEM was used to determine the criteria. EU-DEM is a model of the European Environmental Protection Agency that covers the territory of 27 member states of the European Union and 6 cooperating countries [82]. The model is of medium quality, with a spatial resolution of 25 m. It has similar characteristics to the medium resolution models ASTER and SRTM. The validation of EU-DEM based on the vertical properties and using SRTM and ASTER data by radio shows that this model has higher vertical accuracy and better hydrological parameters. The accuracy of EU-DEM was evaluated using various reference values such as trigonometric points, LIDAR data, and NEXTmap data. The approximate value of the squared error for the vertical accuracy of EU-DEM is about 7 m [83]. The analysis of the topographic criteria was performed using the slope and aspect tools of the QGIS software.
3.2.3. Climatic Group of Criteria (Temperature and Precipitation)
High-resolution geospatial data on climate conditions are essential for applications in the environment and ecological sciences [84]. Increased air temperature as well as its durability causes vegetation to dry out, so it becomes sensitive to fires. Precipitation damages the fuel material and increases the percentage of moisture in it, and if the precipitation is evenly distributed throughout the year, then the susceptibility to fire is reduced [32].
In order to develop a model of temperature and precipitation, data on the average annual values of the Institute for Hydrometeorology and Seismology of Montenegro from 17 meteorological stations in Montenegro, in the period 1961–2015, were used. SAGA GIS modules and geostatistics tools in QGIS were used for the purposes of modeling and obtaining raster bases. The temperature model was obtained using the universal kriging method in combination with the EU-DEM model, while ordinary kriging was used to create the precipitation model.
3.2.4. Anthropogenic Group of Criteria (Distance from Road and Distance from Settlements)
The group of anthropogenic criteria includes distance from the road and distance from settlements. These two criteria are important for two main reasons. First, they can serve as firebreaks or escape routes. In this sense, they are a factor in reducing fire susceptibility. Second, they are potential sources of everyday human activity, tourism and recreation. In this context, they increase the susceptibility to wildfires due to more intense human activities [80]. The distance to roads was processed with a Euclidean analysis and the distance to settlements with a buffer analysis. Both analyzes were performed in QGIS.
3.2.5. Exclusion Criterion
Based on the 2018 CLC classification, artificial areas are excluded from wildfire susceptibility modelling based on the Boolean logical principle with values of 0 [74].
3.3. Standardization of Criteria Values
The normalization of the values for all criteria was carried out according to the evaluation method in a numerical interval from 1 (very low) to 5 (very high), with the ranges of values for each class being determined separately. As with the determination of the criteria, the normalization of the values was based on a combination of the characteristics of the study area, expert opinions and a review of the reference literature [30,31,32,33,34,35,36,37,38,39,40,41,42,43,44,45,46]. The standardized values for all criteria are shown in Table 2.
3.4. Determining the Weights of the Criteria
The allocation of weighting coefficients for the criteria regarding the importance of wildfire susceptibility is based on the Analytic Hierarchy Process (AHP) and Fuzzy Analytic Hierarchy Process (F-AHP) procedure. In the same way as for the delimitation of the criteria and the normalization of the values, a comparison matrix was created.
3.4.1. AHP
Various methods are used to determine the weighting coefficients, but the most commonly used is Saaty’s Analytical Hierarchy Process (AHP) [85]. AHP divides the complex components of GIS-MCDA into smaller components and arranges them in a hierarchy. These components represent implicit criteria compared with others, where a matrix comparison of pairs of criteria is performed, and the result of this comparison is a set of priority criteria [86]. The numerical interval 1–9 was chosen for the comparison criteria, indicating how often a criterion is more important or dominant in relation to another criterion (Table 3).
CR is the consistency ratio; CI is the consistency index. RI is the random consistency index (Table 4). The largest value in the average division of the sum of the weights is λmax, and n is the number of criteria. The random consistency index depends on the number of criteria in the constructed matrix and is different for each number of criteria. If the value of the consistency coefficient is ≤0.1, the inconsistency is acceptable, and if it is >0.1, a revision should be made because the consistency is not good [85].
3.4.2. F-AHP
In some cases, it may be difficult for the expert to compare certain pairs of criteria. In this case, it would be more realistic for the expert to provide not only data in the form of real numbers, but also fuzzy numbers. There are several methods that use fuzzy elements in the form of pairwise comparison matrices. For the purpose of this analysis, the approach of Ramík [87], implemented in an online software (https://fuzzyahp.holecekp.eu/ (accessed on 12 April 2023)), was chosen [88]. This approach is based on the pairwise comparison of triangular fuzzy elements. Such a matrix à has the following form [87]:
where for all i, j = 1,…, n
- are real numbers such that for a chosen fixed .
- implies that (reciprocity).
Besides the introduction of the fuzzy triangular elements, another difference compared to the classical AHP is that the preference intensities provided by the expert are not limited to the interval , but can be taken more generally form for a chosen value .
Fuzzy weights are derived according to the following procedure [87]:
The numerical values for the index range from 0 to 1, where 0 means that the matrix is completely consistent.
3.5. Analysis Results (Combination of Standardized Values and Weight of Criteria)
The modeling results were produced by the AHP and F-AHP methods using the weighted linear combination method at 25 m resolution. In this method, standardized values and weighting coefficients are combined, and the analysis is performed in a raster calculator according to the following formula [74]:
WFSI is the wildfire susceptibility index in the case of this models, is the weighting coefficient of the criteria, is the value of the standardized criteria, and is the exclusion criterion estimated on the basis of the Boolean logical principle with a value of 0.
The WFSI values for both models are in the same evaluation range as criteria 1 to 5. The scores obtained are categorized as very low (1), low (2), moderate (3), high (4) and very high (5) susceptibility.
3.6. Validation of Results
Validation of the obtained results is an important step in the modeling process, without which it is not possible to determine the relevance and scientific basis of the created model [89]. During the GIS-MCDA process, sensitivity analysis is recommended as a tool to check the stability of the results in order to determine subjectivity [90].
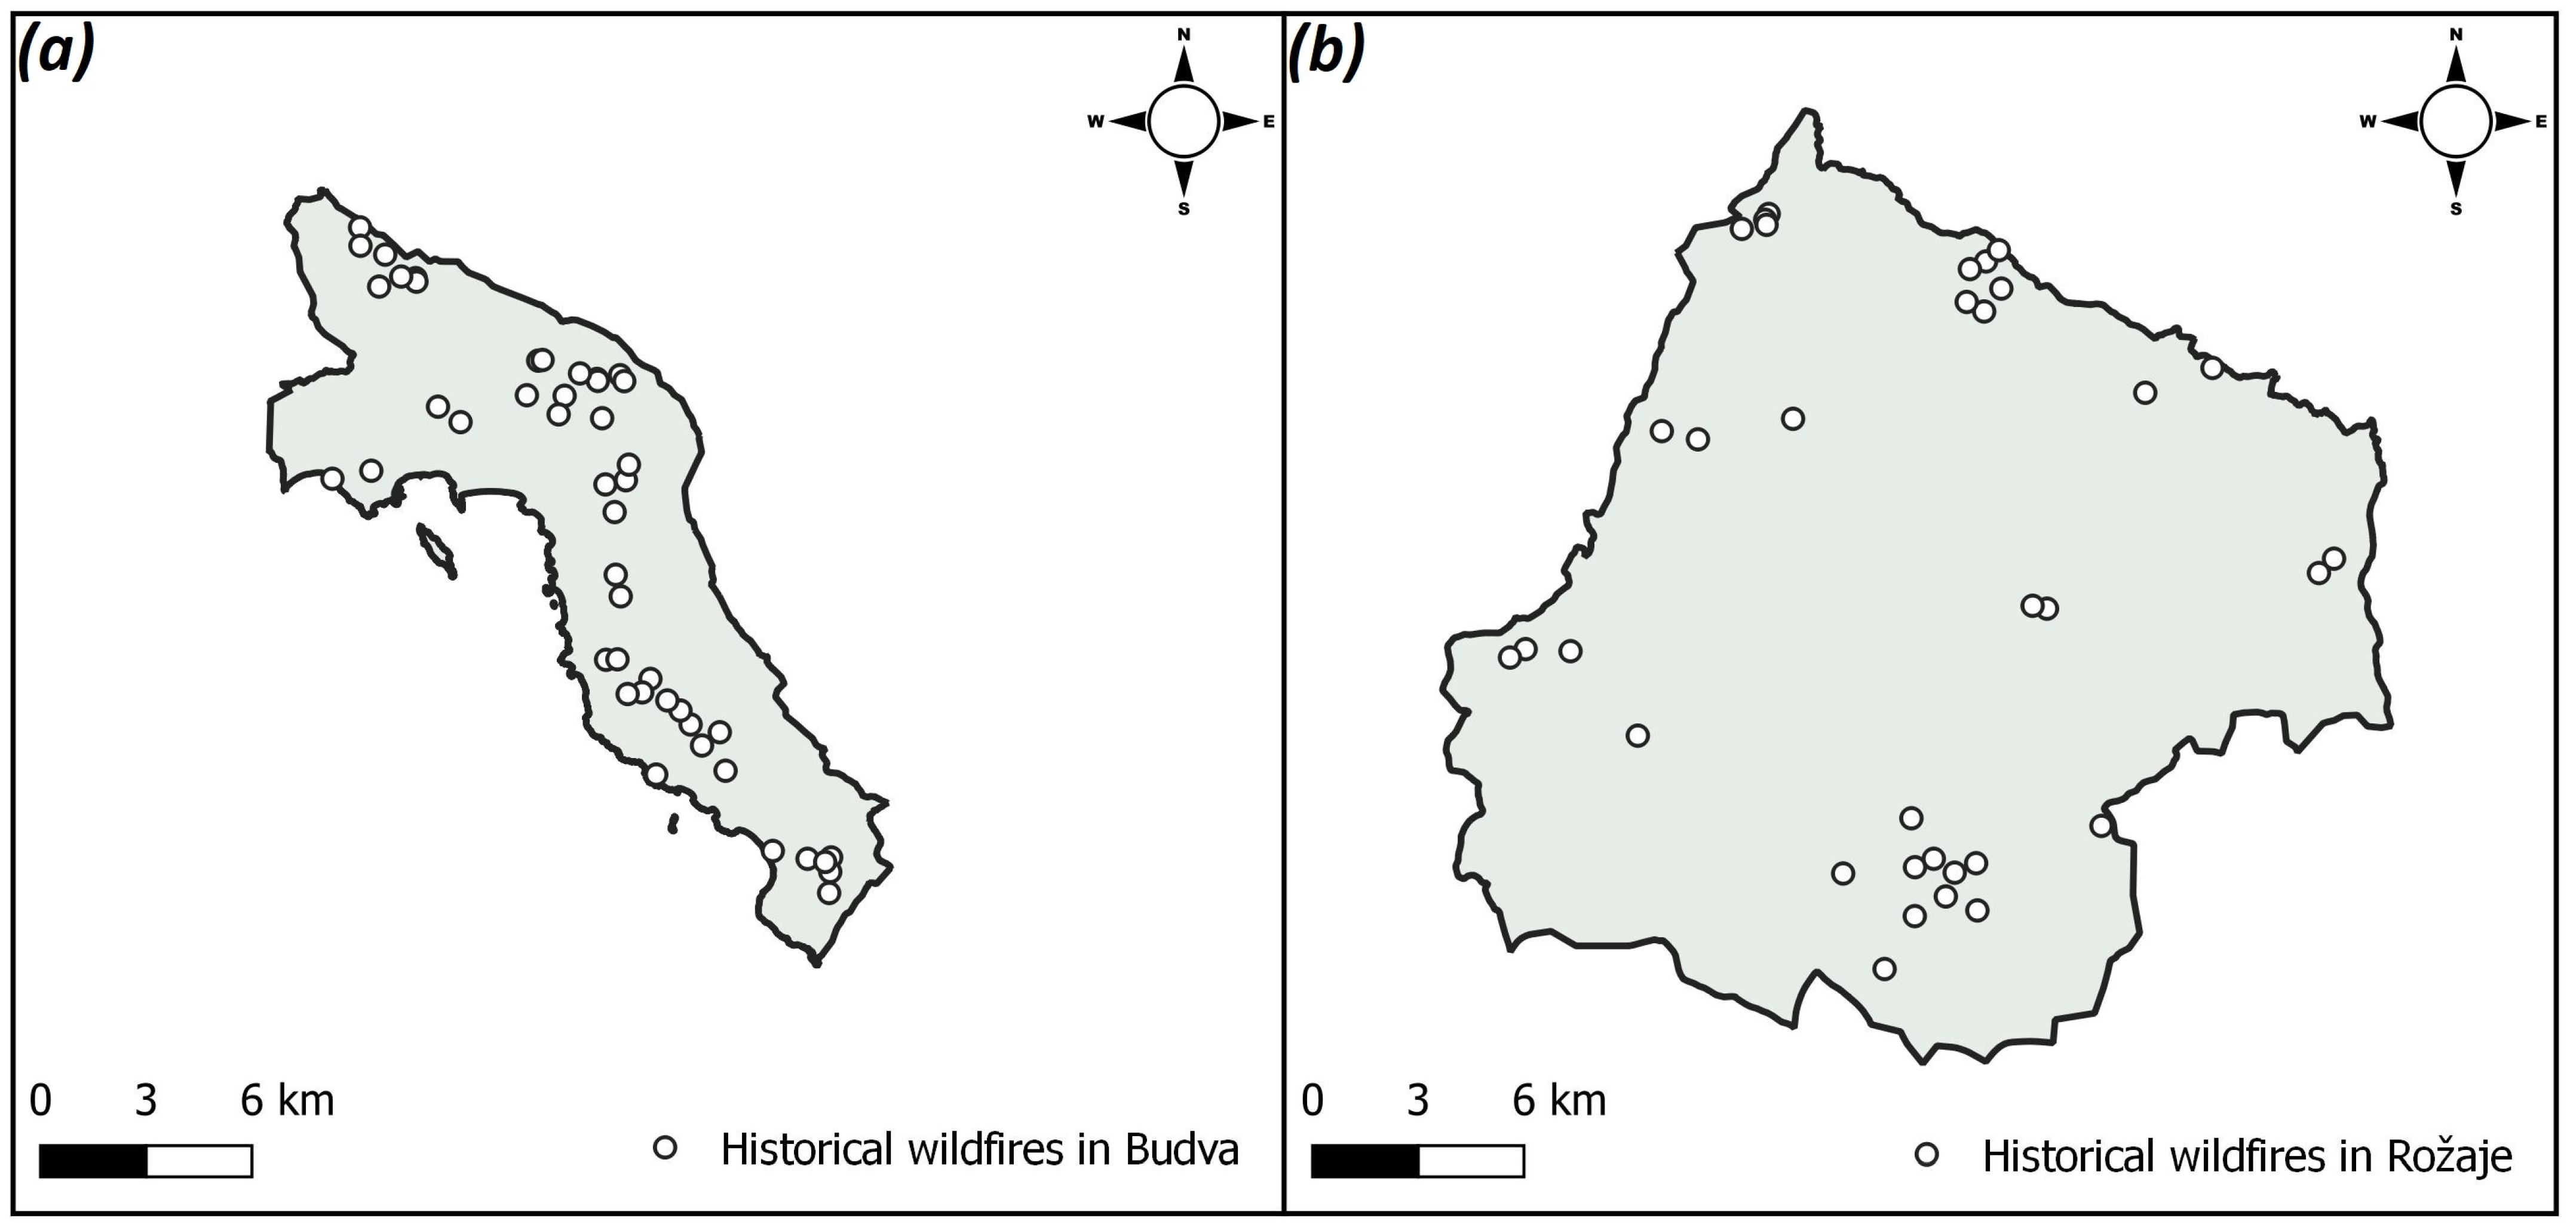
To validate the accuracy of the results, reference data on historical wildfires during 2001–2022 were selected from the MODIS product MCD14DL to validate the accuracy of the results (Figure 3) [91]. Geospatial data were downloaded on demand in ESRI shapefile vector point format from the Geoportal archive FIRMS (https://firms.modaps.eosdis.nasa.gov/download/ (accessed on 12 April 2023)). Each vector point represents the centroid of a 1 km × 1 km pixel where one or more wildfires were detected by the algorithm, from both Aqua and Terra MODIS satellites [92]. For validation purposes, only points with a confidence value greater than 40% were selected from the attribute table.
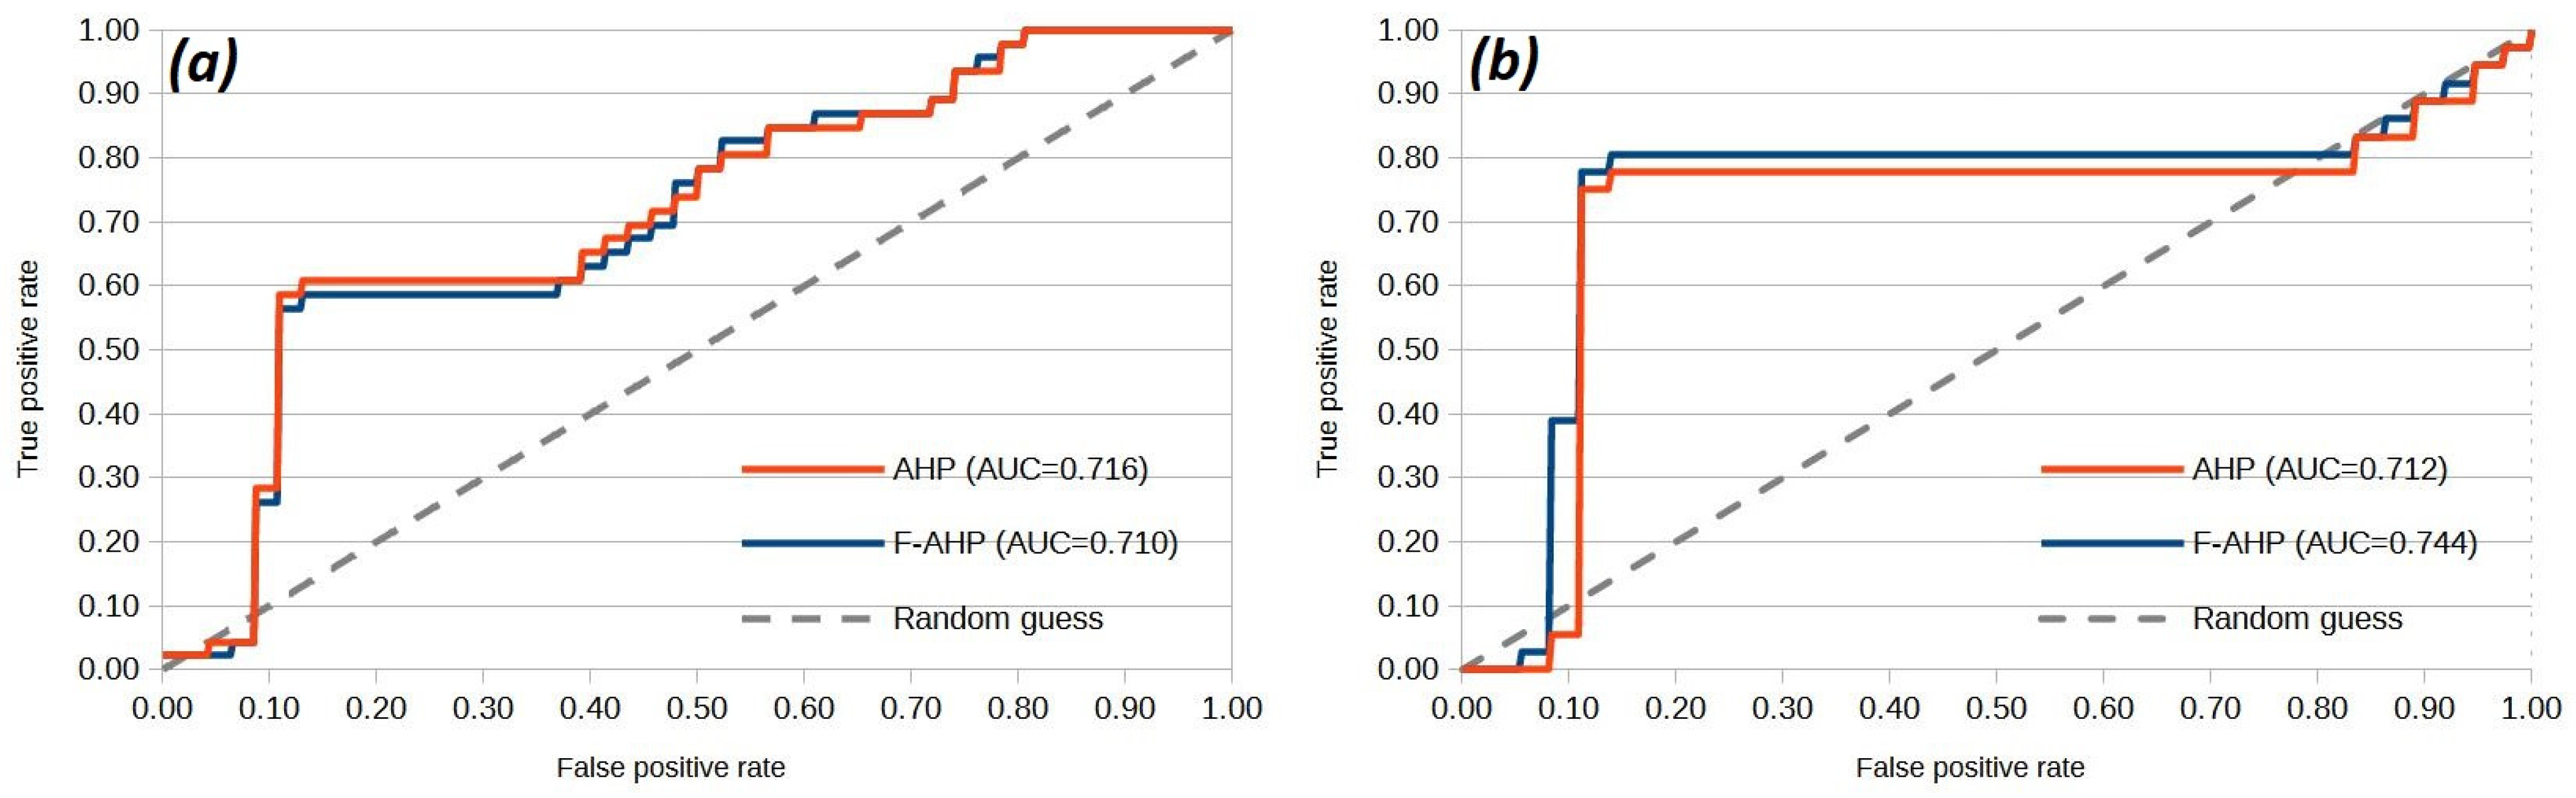
The ROC method (receiver operating characteristics curve—ROC) [93] was chosen as the method for validation analysis in LibreOffice Calc. The ROC curve is a plot comparing the true positive rate (TPR) values on the Y-axis with the false positive rate (FPR) values on the X-axis of the plot. Additionally, for validation purposes, an automatically calculated area under curvature (AUC) was created at ROC. The AUC values indicate the success and accuracy of a given model with respect to the reference data, with excellent (AUC = 0.9–1), good (AUC = 0.8–0.9), fair (AUC = 0.7–0.8), poor (AUC = 0.6–0.7) and failed models (AUC = 0.5–0.6) [94].
4. Results
4.1. Results for Determinated Criteria According to Standardized Values for Budva
4.1.1. Land Cover
According to the land cover, based on the third level of the CLC nomenclature 2018 [95], species and characteristics of vegetation were identified (Figure 4a). The class of deciduous forests (3.1.1.) has the largest proportion, 35%. This forest class is placed in the category of moderate susceptibility to wildfire with complex cropping patterns of the agricultural class (2.4.2.). In this category, the above classes are represented in 36% of the area. Classes such as pastures (2.3.1.)—mainly agricultural land with significant areas of natural vegetation (2.4.3.), coniferous forests (3.1.2.), mixed forests (3.1.3.), natural grassland (3.2.1.), transitional forests/shrubs (3.2.4.), and bare rocks with low vegetation (3.3.2.)—are classified in the category of high susceptibility to wildfire, which occupies 41% of the area. Sclerophilous vegetation (3.2.3.) and areas with sparse vegetation (3.3.3.) are placed in the category of very high susceptibility, occupying 14% of the area.
4.1.2. Topographic Group of Criteria (Aspect, Slope and Elevation)
In the context of aspect (Figure 4b), the most widespread class is the category of very high susceptibility to wildfire, which occupies 51% of the area. The predominant orientation of the slopes is south and southwest, and is especially pronounced in parallel exposures in the slope profile. Therefore, the intensity of solar radiation (e.g., in the formation of forest stands) on these slopes affects the development of wildfires. This is followed by the medium susceptibility category, which accounts for 21% and refers to the eastern and western slopes. The northeastern and northwestern slopes occupy 13% of the area and are classified as low susceptibility. This is followed by the flat and southeastern slopes, which occupy 10% of the area and are classified as highly susceptible. Finally, the northern slopes, which are the least represented with 5% of the area, are classified as very low susceptibility.
The most common slope class is above 20° and occupies 38% of the area classified as very high fire susceptibility (Figure 4c). The next class with a slope of 15–20° occupies 17% of the area and belongs to the group of very high susceptibility. The slope class 10–15° occupies 18% of the area and is classified as moderate susceptibility. The slope class 5–10° occupies 15% of the area and is classified in the low susceptibility category. The least represented is the slope class below 5°, which occupies 12% of the area and is classified as very low susceptibility.
The Eumediterranean zone extends deeper inland at higher elevations. The lower sub-Mediterranean vegetation belt extends 3 to 4 km deep into the land, rising hypsometrically from 400 to 500 m. The higher Mediterranean vegetation belt extends 5 to 6 km inland and rises from 800 to 900 m [66]. The most common hypsometric class is 500–750 m and occupies 27% of the area. It is classified as moderately susceptible to wildfires. It is followed by the 0–200 m class, which occupies 26% of the area and is classified as a very high category. The 200–500 m class, classified as high susceptibility, occupies 22% of the area. The hypsometry class of 750–1000 m is represented in 15% of the area and is classified in the low susceptibility category. The least represented class is above 1000 m, occupies 10% of the area, and is classified in the very low susceptibility category to wildfire (Figure 4d).
4.1.3. Climatic Group of Criteria (Temperature and Precipitation)
High summer temperatures prevail in this area, and most wildfires break out during these hottest months [65]. However, due to data availability, the criterion was standardized using annual model-based temperature values (Figure 4e). The most widespread temperature class is >12 °C, which occupies 51% of the area and is classified in the category of very high susceptibility to wildfire. The 9–12 °C temperature class occupies 40% of the area and falls into the high fire hazard category. The least represented temperature class 7–9 °C occupies 9% of the area and is classified in the category of moderate susceptibility to wildfires.
In this area, precipitation is quite uneven and varies by season (Figure 4f). Most precipitation occurs in the fall, much less in the winter, and there is almost no precipitation in the summer when most fires occur [65]. However, as with temperature, the criterion is normalized to annual values due to data availability. In the context of precipitation, the category of high susceptibility to wildfire, with a precipitation class of 1700–2000 mm, occupies 52% of the area. The category of very high susceptibility with a precipitation class of less than 1700 mm occupies 48% of the area.
4.1.4. Anthropogenic Group of Criteria (Distance from Road and Distance from Settlements)
The tourist importance of this area is confirmed by Milošević (2017) [67], which further increases the anthropogenic impact on the susceptibility from a wildfire. This area is dominated by two transport and communication routes. The first is from the northwest to the southeast, which is determined by the terrain morphology, i.e., the direction of the mountain hinterland and the coastal belt. The main road in this direction is the Jadranska magistrala, which stretches along the entire coast. The second is the northeast–southwest direction, towards the hinterland in the form of a transport connection with the capital Podgorica. This area is one of the most important tourist destinations in this part of the Adriatic, which further influences the triggering of fires [66].
An important criterion for fire outbreak is the distance from the road (Figure 4g), where the most represented class, 0–200 m, occupying 52% of the area, belongs to a category with very high susceptibility. The 200–400 m class occupies 21% of the area and is classified as a high susceptibility category. Class 400–600 m occupies 13% of the area and is classified as moderate susceptibility. Class 600–800 m occupies 7% of the area and is classified as low susceptibility. The >800 m class occupies the same 7% area as the previous class and is classified in the very low susceptibility category for wildfires.
An important feature of the spatial arrangement is that most of the settlements are located in the zone that is not in direct contact with main roads. Thus, 23 settlements are located within 500 m from the main road, and only 10 settlements are located at a greater distance [66]. The last criterion processed is the distance from the settlement (Figure 4h), where the most represented class 500–1000 m occupies 35% of the area and belongs to the category of high susceptibility to wildfires. Class 1000–1500 m occupies 24% and is classified as moderate susceptibility. Class 0–500 m, occupying 19% of the area, is classified as very high susceptibility. Class 1500–2000 m occupies 13% of the area and is classified as low susceptibility. The least represented class is >2000 m, which occupies 9% of the area and falls into the category of very low susceptibility to wildfire.
4.1.5. Exclusion Criterion (Distance from Road and Distance from Settlements)
4.2. Results for the Determinated Criteria According to Standardized Values for Rožaje
4.2.1. Land Cover
As in Budva, vegetation types and characteristics were identified in Rožaje, based on the third level of the 2018 CLC nomenclature [95] (Figure 5a). The contiguous forest class (3.1.2.) has the largest percentage of 39%. This is followed by the mixed forest class (3.1.3.), which occupies 15% of the area. This forest class is classified in the category of high susceptibility to wildfire with the classes of pastures (2.3.1.), predominantly agricultural land with significant areas of natural vegetation (2.4.3.), natural grassland (3.2.1.), transitional forest/shrub (3.2.4.), and bare rock with little vegetation (3.3.2.). In this category, the above classes are represented in 93% of the area. The class complex cropping pattern (2.4.2.) occupies 6% of the area and is assigned to the category of moderate susceptibility. Areas with sparse vegetation (3.3.3.) are classified in the category of very high susceptibility, which occupies a negligible share of the area.
4.2.2. Topographic Group of Criteria (Aspect, Slope and Elevation)
In the context of aspect (Figure 5b), the most widespread class is the low susceptibility category from wildfire, which occupies 30% of the area—this includes the northwestern and northeastern hillslopes. The moderate susceptibility category then follows, which occupies 22%, and refers to the eastern and western hillslopes. The southern and southwestern hillslopes occupy 21% of the area and are classified as very high susceptibility. The very low susceptibility category then follows, which occupies 16%, and refers to the northern hillslopes. Finally, the southweast hillslopes and flat terrains, with the smallest representation area of 11%, are classified as high susceptibility.
Slope affects wildfire behavior. The most common slope class is above 20° and occupies 27% of the area classified as very high susceptibility to wildfire (Figure 5c). Forests for protective purposes mostly include areas with a slope of more than 20° and mainly serve to protect the soil from leaching and erosion. The next class of slope 10–15° occupies 24% of the area and is in the moderate susceptibility category. The 15–20° slope class occupies 22% of the area and is classified as in the high susceptibility category. The slope class 5–10° occupies 19% and is classified as in the low susceptibility category. The least represented is the slope class below 5°, which occupies 8% of the area and is classified as in the very low susceptibility category.
The area of Rožaje belongs to the mountain and high mountain areas according to the landscape types of area [68]. The most common hypsometry class below 1000 m occupies 97% of the area. It is classified as very low susceptibility from a wildfire. With 3% of the area, it is followed by the 750–1000 m class, which is placed in the low category (Figure 5d).
4.2.3. Climatic Group of Criteria (Temperature and Precipitation)
The most widespread temperature class is 4–7 °C, which occupies 54% of the area and is classified in the category of low susceptibility to wildfires. The <4 °C class occupies 46% of the area and falls into the high wildfire susceptibility category. The least represented class, with temperatures of 7–9 °C, does not occupy a significant percentage of the area (Figure 5e). As far as precipitation is concerned, the entire area is highly susceptible to fire with a precipitation class of <1700 mm (Figure 5f). In Rožaje, the relatively warm and dry season lasts 4 months (June–September), when there is the greatest susceptibility to wildfires, and the relatively cold and wet season lasts 8 months (October–April) [69].
4.2.4. Anthropogenic Group of Criteria (Distance from Road and Distance from Settlements)
The municipality of Rožaje is located in the extreme northeast of the country of Montenegro, where road routes to Serbia and Kosovo cross; so, during the year, a large number of tourists pass through the municipality on their way to other destinations in Montenegro [68,69], which somewhat increases the susceptibility to wildfire. Distance from the road (Figure 5g), with the most represented class, 0–200 m, occupying 46% of the area, belongs to the very high susceptibility category. The 200–400 m class occupies 24% of the area and is classified as a high susceptibility category. Class 400–600 m occupies 13% of the area and is classified as moderately susceptible. The >800 m class occupies the same 7% area as the previous class and is classified as in the very low susceptibility category to wildfire. The 600–800 m class occupies 10% of the area and is classified in the low susceptibility category.
The last criterion processed is the distance from the settlement (Figure 5h), where the most represented class 500–1000 m occupies 35% of the area and belongs to the category of high susceptibility to wildfires. The 1000–1500 m class occupies 24% and is classified as moderately susceptible. Class 0–500 m, occupying 19% of the area, is classified as in the very high susceptibility category. Class 1500–2000 m occupies 13% of the area and is classified as low susceptibility. The least represented class is >2000 m, which occupies 9% of the area and falls into the category of very low susceptibility to wildfire.
4.2.5. Exclusion Criterion (Distance from Road and Distance from Settlements)
As in Budva, urban areas in Rožaje are irrelevant to wildfire susceptibility analysis, falling into the CLC 2018 classes of discontinuous urban fabric (1.1.2.), industrial or commercial units (1.2.1.), and mineral extraction sites (1.3.1.), which occupy 1% of the area (Figure 5i).
4.3. Results for Determinated Criteria Weights
After entering the values from Satty’s basic scale into the comparison matrix, the weights of the criteria for the AHP are calculated (Table 5). The inconsistency of the matrix according to the CI value is acceptable. The highest weight coefficient was assigned to the land cover criterion. This is followed by the anthropogenic criteria group with the criteria distance to road and distance to settlements. The anthropogenic criteria group is followed by the climatic criteria group, which includes temperature and precipitation. Finally, the lowest weighting coefficient has the topographic criteria group, which includes aspect, slope and elevation.
The F-AHP method was calculated in a web software solution by entering fuzzy numbers into the matrix. The inconsistency of the matrix based on the NI value is acceptable. Depending on the order, the weighting coefficients of the criteria are the same as in the AHP method, but the values of the weighting coefficients are slightly different (Figure 6).
4.4. Results of GIS-MCDA
4.4.1. Results Analysis for Budva
The results of the AHP and F-AHP models by area in hectares and percent of total area by wildfire susceptibility categories are shown in Table 6. There are no significant differences in the percent area values in either model. The analysis of the results of both models shows that the high and very high categories of susceptibility are mainly found in the hilly, upstream and mountainous hinterland of the highly urbanized tourist areas (Budva, Petrovac, Bečići, Sveti Stefan, Reževići, Buljarica, Miločer, Pobori, Prijevor, etc.) with diverse vegetation. The mountainous area at higher altitudes with less anthropogenic and climatic influence and with mainly deciduous vegetation belongs to the moderate category (Figure 7).
4.4.2. Results Analysis for Rožaje
The results for Rožaje, as well as for Budva, show slight differences in percentages between the AHP and F-AHP models (Table 7). From the results of both models, it appears that a large part of the area falls into the categories of high and very high susceptibility due to forest cover and anthropogenic influence in the Ibar Valley and in the foothills of its tributaries, where major settlements are located. Areas of moderate susceptibility are located mainly in the mountainous regions of Hajla, Štedim, Mokra, Žljeb, Suva and Rusolija, as well as on the low mountains on the left side of the Ibar River, where anthropogenic influence is lower (Figure 8).
4.5. Validation of GIS-MCDA Results
For validation, 46 reference sites for historical wildfire incidence locations in Budva were selected. According to the AHP model, 18 fires were classified in the high susceptibility category and 28 in the very high susceptibility category. According to the F-AHP model, 19 fires were identified in the high susceptibility category and 27 in the very high susceptibility category. In Budva, the ROC curve analysis showed fair AUC values for the AHP and F-AHP models. The AHP model did not perform significantly better compared to the F-AHP model, with a higher AUC value of 0.006 (Figure 9a). In Rožaje, 34 historical reference sites for wildfires were selected. According to the AHP model, 8 fires were identified in the moderate susceptibility” category and 26 in the “high susceptibility” category. According to the F-AHP model, 7 fires were identified in the moderate susceptibility category and 27 in the high susceptibility category. The results in Rožaje are different: the F-AHP model provides better AUC values than the AHP model, and both models also provide reasonable performance (Figure 9b).
5. Discussion
Different climates were selected in Montenegro in order to determine the susceptibility to wildfires. GIS-MCDA supports this study and uses natural and anthropogenic criteria that influence wildfire occurrence. It is important to mention that the aim of the research was not to analyze a large number of climatic criteria, which have rarely been used in previous studies [30,31,32,33,34,35,36,37,38,39,40,41,42,43,44,45,46], but to evaluate how the standardized criteria and their weighting coefficients using AHP and F-AHP methods performed in modeling wildfire susceptibility under different climatic conditions. In the study, the land cover criterion, topographic group of criteria (aspect, slope, elevation), climatic group of criteria (temperature and precipitation), and anthropogenic group of criteria (distance from road and distance from settlement) were used for the analysis. The exclusion criterion is based on Boolean logic and was determined based on land cover by excluding urban areas. The input data for the criteria are based on open geospatial data downloaded from global and European geoportals. Resolution and quality may be questionable when using these data [13,39]. Commercial LiDAR technology has found its application in creating land cover criteria and topographic criteria groups [13,38], but open geospatial data from global satellites are still more commonly used [31,32,39,41]. In some studies, climate criteria have not been analyzed [3,34,41,80], while there are cases where the results are more relevant, for example, climate analysis as a criterion used the so-called Fire Weather Index (FWI) [33,38]. An advanced GIS method of kriging in this study was used to obtain the climatic group of criteria temperature and precipitation. Due to the availability of data and the complexity of processing in raster format, the criteria were derived using annual averages. However, for a better analysis, it is necessary to include other climatic elements (e.g., wind, solar radiation, humidity and cloudiness) [38,96,97,98]. In addition, it is necessary to perform an analysis of climatic extremes and a projection of climatic changes [99].
Coefficients differ somewhat. This situation is similar in other studies, where AHP and F-AHP have been compared [41,45]. The largest weighting coefficient is assigned to the land cover criterion, then to the anthropogenic, then to the climatic, and finally to the topographic criteria group. The results of the GIS-MCDA models AHP and F-AHP show negligible percentage differences between the categories of susceptibility to wildfires in Budva, which is located in a warm temperate climate (C), and Rožaje, which is located in a cold temperate climate (D). This shows and confirms the methodological similarity of these two procedures.
The established criteria, standardization and weighting coefficients of the developed models are more suitable for Budva, as there are no historical wildfires of the highest category in Rožaje. The validation results based on the AUC values show that the AHP and F-AHP models perform fair in both climatic zones. Non-significantly better results are obtained by the AHP model compared to the F-AHP model with a higher AUC value in Budva. The situation is different in Rožaje, where the F-AHP model gives better AUC values than the AHP model. In previous studies, the F-AHP model has been shown to achieve slightly better AUC values in validation than the AHP model, which usually has fair-to-good performance in both models [41,45]. In this study using Budva as an example, it is a little different as the AHP model performs better than the F-AHP model, but with a very small difference in AUC values. One possible reason for the worse AUC values than in previous studies is that the models in this study were adjusted to fit both climates. However, in the study by Hysa and Spalević [31], conducted for the whole of Montenegro using the AHP model, there was a worse AUC value of 0.55 in the case of WSCI_ESP index and 0.33 for WSCI.
6. Conclusions
It has been shown that the standardization and determination of weighting coefficients for natural and anthropogenic criteria can be the same in Budva, which is located in a warm temperate climate (C), and Rožaje, which is located in a cold temperate climate (D). Although the results for Budva provide better results, the results of the AHP and F-AHP models yield identical percentages for the categories of wildfire susceptibility in both climates, confirming the similarity of these two methods. The validation in this study with AHP and F-AHP models shows fair results. The main advantage of the approach GIS-MCDA, even if it provides worse results than machine learning approaches (ML) [54], is the ease of statistical data processing, the possibility of using open geospatial data that are free and have no additional constraints, and the ease of interpreting the results in an open-source environment GIS. Like any approach, this one has its shortcomings in determining, standardizing and setting weighting coefficients for criteria, which is a consequence of variability in model selection and human judgment. In addition, as in most previous studies, the models in this study do not account for some of the most important climate criteria. Therefore, it would be desirable to enrich these models with more criteria, supplement them with better geospatial data, and test them in climates with very low and low fire susceptibility categories to obtain more relevant results.
The priority of decision makers should be protection from wildfires, especially because of the tourist recognition of Budva. Rožaje has potential for winter tourism development, so it is important to protect the forests. The application of this and similar models in the surroundings of GIS can be crucial for the sustainable and ecological management of the forest, which is constantly threatened by strong wildfires in these regions. In addition, the approach taken in this study, especially in the case of the absence of geospatial data (with certain modifications for different geographic conditions), can provide a strategic and operational advantage in the development of wildfire protection plans and strategies.
Author Contributions
Conceptualization, G.N., F.V. and A.V.; methodology, G.N., F.V., A.Š. and A.V.; software, F.V. and A.V.; validation, G.N. and J.G.; formal analysis, G.N. and F.V.; investigation, G.N. and F.V.; writing—original draft preparation, G.N., F.V. and A.V.; writing—review and editing, F.V., J.G. and A.V.; visualization, F.V. and A.V.; supervision, G.N., A.V. and A.Š. All authors have read and agreed to the published version of the manuscript.
Funding
This research received no external funding.
Institutional Review Board Statement
Not applicable.
Informed Consent Statement
Not applicable.
Data Availability Statement
To obtain the data for this study, please contact the authors via email.
Acknowledgments
The study was supported by the Ministry of Education, Science and Technological Development of the Republic of Serbia (contract number 451-03-68/2022-14/200091).
Conflicts of Interest
The authors declare no conflict of interest.
References
- Goldammer, J.; Mitsopoulos, I.; Mallinis, G.; Woolf, M. Wildfire Hazard and Risk Assessment. In Words into Action Guidelines National Disaster Risk Assessment; United Nations Office for Disaster Risk Reduction: Geneva, Switzerland, 2017. [Google Scholar]
- FAO. Global Forest Resources Assessment 2005: Progress Towards Sustainable Forest Management; Food and Agriculture Organization of the United Nations: Rome, Italy, 2006. [Google Scholar]
- Adaktylou, N.; Stratoulias, D.; Landenberger, R. Wildfire Risk Assessment Based on Geospatial Open Data: Application on Chios, Greece. ISPRS Int. J. Geo-Inf. 2020, 9, 516. [Google Scholar] [CrossRef]
- Carvalho, A.; Monteiro, A.; Flannigan, M.; Solman, S.; Miranda, A.I.; Borrego, C. Forest fires in a changing climate and their impacts on air quality. Atmos. Environ. 2011, 45, 5545–5553. [Google Scholar] [CrossRef]
- Tomašević, I.Č.; Cheung, K.K.W.; Vučetić, V.; Fox-Hughes, P. Comparison of Wildfire Meteorology and Climate at the Adriatic Coast and Southeast Australia. Atmosphere 2022, 13, 755. [Google Scholar] [CrossRef]
- Pausas, J.G.; Keeley, J.E. Wildfires and global change. Front. Ecol. Environ. 2021, 19, 387–395. [Google Scholar] [CrossRef]
- Thuiller, W.; Lavorel, S.; Araújo, M.B.; Sykes, M.T.; Prentice, I.C. Climate change threats to plant diversity in Europe. Proc. Natl. Acad. Sci. USA 2005, 102, 8245–8250. [Google Scholar] [CrossRef] [PubMed]
- Brewer, S.; Cheddadi, R.; de Beaulieu, J.L.; Reille, M. The spread of deciduous Quercus throughout Europe since the last glacial period. For. Ecol. Manag. 2002, 156, 27–48. [Google Scholar] [CrossRef]
- Hernández, L.; Sánchez de Dios, R.; Montes, F.; Sainz-Ollero, H.; Cañellas, I. Exploring range shifts of contrasting tree species across a bioclimatic transition zone. Eur. J. For. Res. 2017, 136, 481–492. [Google Scholar] [CrossRef]
- Xie, H.L.; Yao, G.R.; Liu, G.Y. Spatial evaluation of ecological importance based on GIS for environmental management: A case study in Xingguo County of China. Ecol. Indic. 2015, 51, 3–12. [Google Scholar] [CrossRef]
- Valjarević, A.; Filipović, D.; Valjarević, D.; Milanović, M.; Milošević, S.; Živić, N.; Lukić, T. GIS and remote sensing techniques for the estimation of dew volume in the Republic of Serbia. Meteorol. Appl. 2020, 27, 1930. [Google Scholar] [CrossRef]
- Pavlek, K.; Bišćević, F.; Furčić, P.; Grđan, A.; Gugić, V.; Malešić, N.; Moharić, P.; Vragović, V.; Fuerst-Bjeliš, B.; Cvitanović, M. Spatial patterns and drivers of fire occurrence in a Mediterranean environment: A case study of southern Croatia. Geogr. Tidsskr-Dan. J. Geogr. 2017, 117, 22–35. [Google Scholar] [CrossRef]
- Marić, I.; Šiljeg, A.; Domazetović, F. Derivation of Wildfire Ignition Index using GIS-MCDA from High-Resolution UAV Imagery Data and Perception Analysis in Settlement Sali, Dugi Otok Island (Croatia). In Proceedings of the GISTAM 2021—7th International Conference on Geographical Information Systems Theory, Applications and Management, Prague, Czech Republic, 23–25 April 2021; pp. 90–97. [Google Scholar]
- Šiljeg, A.; Marić, I.; Jurišić, M.; Plaščak, I. Viewshed model as a strategy for prevention of forest fires–case study of Zadar county. Šumarski List. 2017, 141, 339–349. [Google Scholar] [CrossRef]
- Valjarević, A.; Algarni, S.; Morar, C.; Grama, V.; Stupariu, M.; Tiba, A.; Lukić, T. The coastal fog and ecological balance for plants in the Jizan region, Saudi Arabia. Saudi J. Biol. Sci. 2022, 30, 103494. [Google Scholar] [CrossRef] [PubMed]
- Tedim, F.; Leone, V.; Xanthopoulos, G. A wildfire risk management concept based on a social-ecological approach in the European Union: Fire Smart Territory. Int. J. Disaster Risk Reduct. 2016, 18, 138–153. [Google Scholar] [CrossRef]
- Malczewski, J. GIS-based multicriteria decision analysis: A survey of the literature. Int. J. Geogr. Inf. Sci. 2006, 20, 703–726. [Google Scholar] [CrossRef]
- Šušnjar, S.; Golijanin, J.; Pecelj, M.; Lukić Tanović, M.; Valjarević, A. Environmental suitability of the city of East Sarajevo for the location of municipal solid waste disposal site using a GIS based multi-criteria analysis. Pol. J. Environ. Stud. 2022, 31, 857–870. [Google Scholar] [CrossRef]
- Durlević, U.; Novković, I.; Carević, I.; Valjarević, D.; Marjanović, A.; Batoćanin, N.; Krstić, F.; Stojanović, L.; Valjarević, A. Sanitary landfill site selection using GIS-based on a fuzzy multi-criteria evaluation technique: A case study of the City of Kraljevo, Serbia. Env. Sci Pollut Res Int. 2023, 30, 37961–37980. [Google Scholar] [CrossRef]
- Bojórquez-Tapia, L.A.; Luna-González, L.; Cruz-Bello, G.M.; Gómez-Priego, P.; Juárez-Marusich, L.; Rosas-Pérez, I. Regional Environmental Assessment for Multiagency Policy Making: Implementing an Environmental Ontology through GIS-MCDA. Environ. Plan. B 2011, 38, 539–563. [Google Scholar] [CrossRef]
- Šiljeg, A.; Marić, I.; Cukrov, N.; Domazetović, F.; Roland, V. Multiscale Framework for Sustainable Management of Tufa-Forming Watercourses: A Case Study of National Park “Krka”, Croatia. Water 2020, 12, 3096. [Google Scholar] [CrossRef]
- Durlević, U.; Valjarević, A.; Novković, I.; Ćurčić, N.B.; Smiljić, M.; Morar, C.; Stoica, A.; Barišić, D.; Lukić, T. GIS-Based Spatial Modeling of Snow Avalanches Using Analytic Hierarchy Process. A Case Study of the Šar Mountains, Serbia. Atmosphere 2022, 13, 1229. [Google Scholar] [CrossRef]
- Gigović, L.; Drobnjak, S.; Pamučar, D. The Application of the Hybrid GIS Spatial Multi-Criteria Decision Analysis Best–Worst Methodology for Landslide Susceptibility Mapping. ISPRS Int. J. Geo-Inf. 2019, 8, 79. [Google Scholar] [CrossRef]
- Milevski, I.; Dragićević, S.; Zorn, M. Statistical and Expert-Based Landslide Susceptibility Modeling on a National Scale Applied to North Macedonia. Open Geosci. 2019, 11, 750–764. [Google Scholar] [CrossRef]
- Darvishi Boloorani, A.; Soleimani, M.; Neysani Samany, N.; Bakhtiari, M.; Qareqani, M.; Papi, R.; Mirzaei, S. Assessment of Rural Vulnerability to Sand and Dust Storms in Iran. Atmosphere 2023, 14, 281. [Google Scholar] [CrossRef]
- Gigović, L.; Pamučar, D.; Bajić, Z.; Drobnjak, S. Application of GIS-Interval Rough AHP Methodology for Flood Hazard Mapping in Urban Areas. Water 2017, 9, 360. [Google Scholar] [CrossRef]
- Ajjur, S.B.; Mogheir, Y. Flood hazard mapping using a multi-criteria decision analysis and GIS (case study Gaza Governorate, Palestine). Arab. J. Geosci. 2020, 13, 44. [Google Scholar] [CrossRef]
- Akay, A.E.; Acar, H.H.; Kalkan, B. Korištenje GIS tehnika za modeliranje širenja antropogene buke koju stvara motorna pila prilikom sječe šuma. Šumarski List 2022, 146, 333–344. [Google Scholar] [CrossRef]
- Musakwa, W.J.E. Identifying land suitable for agricultural land reform using GIS-MCDA in South Africa. Dev. Sustain. 2018, 20, 2281–2299. [Google Scholar] [CrossRef]
- Setiawan, I.; Mahmud, A.R.; Mansor, S.; Shariff, A.R.M.; Nuruddin, A.A. GIS-grid-based and multi-criteria analysis for I dentifying and mapping peat swamp forest fire hazard in Pahang, Malaysia. Disaster Prev. Manag. Int. J. 2004, 13, 379–386. [Google Scholar]
- Hysa, A.; Spalevic, V. Testing NDVI, tree cover density and land cover type as fuel indicators in the wildfire spread capacity index (WSCI): Case of Montenegro. Not. Bot. Horti Agrobot. Cluj-Napoca 2020, 48, 2368–2384. [Google Scholar] [CrossRef]
- Gigović, L.; Jakovljević, G.; Sekulović, D.; Regodić, M. GIS multi-criteria analysis for identifying and mapping forest fire hazard: Nevesinje, Bosnia and Herzegovina. Teh. Vjesn. 2018, 25, 891–897. [Google Scholar]
- Akbulak, C.; Tatlı, H.; Aygün, G.; Sağlam, B. Forest fire risk analysis via integration of GIS, RS and AHP: The Case of Çanakkale, Turkey. J. Hum. Sci. 2018, 15, 2127–2143. [Google Scholar] [CrossRef]
- Akay, A.E.; Şahin, H. Forest Fire Risk Mapping by using GIS Techniques and AHP Method: A Case Study in Bodrum (Turkey). Eur. J. For. Eng. 2019, 5, 25–35. [Google Scholar] [CrossRef]
- Nuthammachot, N.; Stratoulias, D. Multi-criteria decision analysis for forest fire risk assessment by coupling AHP and GIS: Method and case study. Environ. Dev. Sustain. 2021, 23, 17443–17458. [Google Scholar] [CrossRef]
- Van Hoang, T.; Chou, T.Y.; Fang, Y.M.; Nguyen, N.T.; Nguyen, Q.H.; Xuan Canh, P.; Ngo Bao Toan, D.; Nguyen, X.L.; Meadows, M.E. Mapping forest fire risk and development of early warning system for NW Vietnam using AHP and MCA/GIS methods. Appl. Sci. 2020, 10, 4348. [Google Scholar] [CrossRef]
- Abdo, H.G.; Almohamad, H.; Al Dughairi, A.A.; Al-Mutiry, M. GIS-Based Frequency Ratio and Analytic Hierarchy Process for Forest Fire Susceptibility Mapping in the Western Region of Syria. Sustainability 2022, 14, 4668. [Google Scholar] [CrossRef]
- Novo, A.; Fariñas-Álvarez, N.; Martínez-Sánchez, J.; González-Jorge, H.; Fernández-Alonso, J.M.; Lorenzo, H. Mapping Forest Fire Risk—A Case Study in Galicia (Spain). Remote Sens. 2020, 12, 3705. [Google Scholar] [CrossRef]
- Šiljeg, A.; Milošević, R.; Marić, I. Primjena višekriterijskih GIS analiza u izvođenju indeksa rizika izbijanja otvorenih požara i optimizacija vatrogasnih intervencija na području NP Krka. Geod. Glas. 2021, 2, 87–108. [Google Scholar]
- Çoban, H.O.; Erdin, C. Forest fire risk assessment using GIS and AHP integration in Bucak forest enterprise, Turkey. Appl. Ecol. Environ. Res. 2020, 18, 1567–1583. [Google Scholar] [CrossRef]
- Sinha, A.; Nikhil, S.; Ajin, R.S.; Danumah, J.H.; Saha, S.; Costache, R.; Rajaneesh, A.; Sajinkumar, K.S.; Amrutha, K.; Johny, A.; et al. Wildfire Risk Zone Mapping in Contrasting Climatic Conditions: An Approach Employing AHP and F-AHP Models. Fire 2023, 6, 44. [Google Scholar] [CrossRef]
- Kumi-Boateng, B.; Peprah, M.S.; Larbi, E.K. Prioritization of forest fire hazard risk simulation using hybrid grey relativity analysis (HGRA) and fuzzy analytical hierarchy process (FAHP) coupled with multicriteria decision analysis (MCDA) techniques—A comparative study analysis. Geod. Cartogr. 2021, 47, 147–161. [Google Scholar]
- Eskandari, S.; Miesel, J.R. Comparison of the fuzzy AHP method, the spatial correlation method, and the Dong model to predict the fire high-risk areas in Hyrcanian forests of Iran. Geomat. Nat. Hazards Risk 2017, 8, 933–949. [Google Scholar] [CrossRef]
- Eskandari, S. A new approach for forest fire risk modeling using fuzzy AHP and GIS in Hyrcanian forests of Iran. Arab. J. Geosci. 2017, 10, 190. [Google Scholar] [CrossRef]
- Tiwari, A.; Shoab, M.; Dixit, A. GIS-based forest fire susceptibility modeling in Pauri Garhwal, India: A comparative assessment of frequency ratio, analytic hierarchy process and fuzzy modeling techniques. Nat. Hazards 2021, 105, 1189–1230. [Google Scholar] [CrossRef]
- Sharma, L.K.; Kanga, S.; Nathawat, M.S.; Sinha, S.; Pandey, P.C. Fuzzy AHP for forest fire risk modeling. Disaster Prev. Manag. 2012, 21, 160–171. [Google Scholar] [CrossRef]
- Pradeep, G.S.; Danumah, J.H.; Nikhil, S.; Prasad, M.K.; Patel, N.; Mammen, P.C.; Rajaneesh, A.; Oniga, V.E.; Ajin, R.S.; Kuriakose, S.L. Forest fire risk zone mapping of Eravikulam National Park in India: A comparison between frequency ratio and analytic hierarchy process methods. Croat. Croat. J. For. Eng. 2022, 43, 199–217. [Google Scholar] [CrossRef]
- Gheshlaghi, H.A.; Feizizadeh, B.; Blaschke, T. GIS-based forest fire risk mapping using the analytical network process and fuzzy logic. J. Environ. Plan. Manag. 2020, 63, 481–499. [Google Scholar] [CrossRef]
- Mohammadi, F.; Bavaghar, M.P.; Shabanian, N. Forest Fire Risk Zone Modeling Using Logistic Regression and GIS: An Iranian Case Study. Small-Scale 2014, 13, 117–125. [Google Scholar] [CrossRef]
- Milanović, S.; Marković, N.; Pamučar, D.; Gigović, L.; Kostić, P.; Milanović, S.D. Forest Fire Probability Mapping in Eastern Serbia: Logistic Regression versus Random Forest Method. Forests 2021, 12, 5. [Google Scholar] [CrossRef]
- Tan, C.; Feng, Z. Mapping Forest Fire Risk Zones Using Machine Learning Algorithms in Hunan Province, China. Sustainability 2023, 15, 6292. [Google Scholar] [CrossRef]
- Kalantar, B.; Ueda, N.; Idrees, M.O.; Janizadeh, S.; Ahmadi, K.; Shabani, F. Forest Fire Susceptibility Prediction Based on Machine Learning Models with Resampling Algorithms on Remote Sensing Data. Remote Sens. 2020, 12, 3682. [Google Scholar] [CrossRef]
- Achu, A.; Thomas, J.; Aju, C.; Gopinath, G.; Kumar, S.; Reghunath, R. Machine-learning modelling of fire susceptibility in a forest-agriculture mosaic landscape of southern India. Ecol. Inform. 2021, 64, 101348. [Google Scholar] [CrossRef]
- Iban, M.C.; Sekertekin, A. Machine learning based wildfire susceptibility mapping using remotely sensed fire data and GIS: A case study of Adana and Mersin provinces, Turkey. Ecol. Inform. 2022, 69, 101647. [Google Scholar] [CrossRef]
- Pileggi, S.F. Is the World Becoming a Better or a Worse Place? A Data-Driven Analysis. Sustainability 2020, 12, 88. [Google Scholar] [CrossRef]
- MONSTAT. Statistical Yearbook. 2022. Available online: http://www.monstat.org/uploads/files/publikacije/godisnjak%202022/Godisnjak%202022_za%20web_print.pdf (accessed on 11 April 2023).
- Ministry of Economic Development. Spatial Plan of Montenegro until 2020. Available online: https://wapi.gov.me/download-preview/b57f5f50-6f9c-4c27-ba86-122f5166b126?version=1.0 (accessed on 11 April 2023).
- Frankl, A.; Lenaerts, T.; Radusinovic, S.; Spalevic, V.; Nyssen, J. The regional geomorphology of Montenegro mapped using land surface parameters. Z. Für Geomorphol. 2016, 60, 21–34. [Google Scholar] [CrossRef]
- Burić, D.; Ducić, V.; Mihajlović, J. The climate of Montenegro: Modificators and types—Part one. Bull. Serb. Geogr. Soc. 2013, 93, 83–102. [Google Scholar]
- Burić, M.; Micev, B.; Mitrović, L. Climate Atlas of Montenegro; Montenegrin Academy of Sciences and Arts: Podgorica, Montenegro, 2012. [Google Scholar]
- Kottek, M.; Grieser, J.; Beck, C.; Rudolf, B.; Rubel, F. World Map of Köppen-Geiger climate classification updated. Meteorol. Z. 2006, 15, 259–263. [Google Scholar] [CrossRef]
- Burić, D.; Ducić, V.; Mihajlović, J. The climate of Montenegro: Modificators and types—Part two. Bull. Serb. Geogr. Soc. 2014, 94, 73–90. [Google Scholar]
- Ministry of Ecology, Spatial Planning and Urbanism of Montenegro. Concept of the Spatial Plan of Montenegro until 2040. Available online: https://wapi.gov.me/download/ac56f1c6-26f1-4216-af5b-5e22dd483076?version=1.0 (accessed on 11 April 2023).
- Ministry of Agriculture and Rural Development of Montenegro. The First National Forest Inventory of Montenegro—Final Report. Available online: https://www.researchgate.net/publication/296561640_The_First_National_Forest_Inventory_of_Montenegro_-_Final_Report (accessed on 12 April 2023).
- Ministry of interior of Montenegro. Disaster Risk Assessment of Montenegro. 2022. Available online: https://media.gov.me/media/gov/2021/mup/nacionalna-procjena-rizika-elektronska-publikacija.pdf (accessed on 12 April 2023).
- AG Infoplan. Spatial Plan of the Municipality of Budva. Available online: https://budva.me/sites/default/files/planovi/00a%20-%20PPO%20Budva/Izmjene%20i%20dopune%20PPOB.pdf (accessed on 12 April 2023).
- Milošević, S.M. Analysis of objective indicators of tourism development in Montenegro. TIMS. Acta 2017, 11, 31–43. [Google Scholar] [CrossRef]
- Municipality of Rožaje. Strategic Development Plan of the Municipality of Rožaje for the Period 2021–2025—Draft. Available online: https://www.rozaje.me/wp-content/uploads/2021/09/Strateski-plan-razvoja-Rozaje-2021-2025.pdf (accessed on 12 April 2023).
- Ministry of Agriculture and Rural Development. Draft Forest Development Plan for the Rožaje Forest Area 2020–2029. Available online: http://www.upravazasume.me/razni_fajlovi/1583142721.pdf (accessed on 12 April 2023).
- Greene, R.; Devillers, R.; Luther, J.E.; Eddy, B.G. GIS-Based Multiple-Criteria Decision Analysis. Geogr. Compass 2011, 5, 412–432. [Google Scholar] [CrossRef]
- Malczewski, J.; Rinner, C. Multicriteria Decision Analysis in Geographic Information Science; Springer: New York, NY, USA, 2016. [Google Scholar]
- Domazetović, F.; Šiljeg, A.; Lončar, N.; Marić, I. GIS automated multicriteria analysis (GAMA) method for susceptibility modelling. MethodsX 2019, 6, 2553–2561. [Google Scholar] [CrossRef]
- Domazetović, F.; Šiljeg, A.; Lončar, N.; Marić, I. Development of automated multicriteria GIS analysis of gully erosion susceptibility. Appl. Geogr. 2019, 112, 102083. [Google Scholar] [CrossRef]
- Eastman, J.R. Multi-criteria evaluation and GIS. Geogr. Inf. Syst. 2012, 1, 493–502. [Google Scholar]
- European Environmental Protection Agency. Available online: https://land.copernicus.eu/pan-european/corine-land-cover/clc2018 (accessed on 10 March 2023).
- European Environmental Protection Agency. Available online: https://land.copernicus.eu/imagery-in-situ/eu-dem/eu-dem-v1.1 (accessed on 10 March 2023).
- Institute of Hydrometeorology and Seismology of Montenegro. Available online: http://www.meteo.co.me/ (accessed on 10 March 2023).
- Geofabrik. Available online: http://www.meteo.co.me/ (accessed on 10 March 2023).
- Valjarević, A.; Filipović, D.; Živković, D.; Ristić, N.; Božović, J.; Božović, R. Spatial Analysis of the Possible First Serbian Conurbation. Appl. Spat. Anal. Policy 2020, 14, 113–134. [Google Scholar] [CrossRef]
- Chuvieco, E.; Congalton, R.G. Application of remote sensing and geographic information systems to forest fire hazard mapping. Remote Sens. Environ. 1989, 29, 147–159. [Google Scholar] [CrossRef]
- Dragićević, S.; Filipović, D. Natural Conditions and Disasters in Planning and Protection of Space, 2nd ed.; University of Belgrade-Faculty of Geography: Belgrade, Serbia, 2016. [Google Scholar]
- Bashfield, A.; Keim, A. Continent-wide DEM creation for the European Union. In Proceedings of the 34th International Symposium on Remote Sensing of Environment, The GEOSS Era: Towards Operational Environmental Monitoring, Sydney, Australia, 10–15 April 2011; pp. 10–15. [Google Scholar]
- Mouratidis, A.; Ampatzidis, D. European Digital Elevation Model Validation against Extensive Global Navigation Satellite Systems Data and Comparison with SRTM DEM and ASTER GDEM in Central Macedonia (Greece). ISPRS Int. J. Geo-Inf. 2019, 8, 108. [Google Scholar] [CrossRef]
- Karger, D.N.; Conrad, O.; Böhner, J.; Kawohl, T.; Kreft, H.; Soria-Auza, R.W.; Zimmermann, N.E.; Linder, H.P.; Kessler, M. Climatologies at high resolution for the earth’s land surface areas. Sci. Data 2017, 4, 170122. [Google Scholar] [CrossRef] [PubMed]
- Saaty, T.L. How to make a decision: The analytic hierarchy process. Eur. J. Oper. Res. 1990, 48, 9–26. [Google Scholar] [CrossRef]
- Saaty, T.L. Decision making with the analytic hierarchy process. Int. J. Serv. Sci. 2008, 1, 83–98. [Google Scholar] [CrossRef]
- Ramík, J.; Korviny, P. Inconsistency of pair-wise comparison matrix with fuzzy elements based on geometric mean. Fuzzy Sets Syst. 2010, 161, 1604–1613. [Google Scholar] [CrossRef]
- Holeček, P.; Talašová, J. A free software tool implementing the fuzzy AHP method. In Proceedings of the 34th International Conference on Mathematical Methods in Economics 2016, Liberec, Czech Republic, 6–9 September 2016; pp. 266–271. [Google Scholar]
- Feizizadeh, B.; Roodposhti, M.S.; Jankowski, P.; Blaschke, T. A GIS-based extended fuzzy multi-criteria evaluation for landslide susceptibility mapping. Comput. Geosci. 2014, 73, 208–221. [Google Scholar] [CrossRef]
- Gigović, L.; Pamučar, D.; Lukić, D.; Marković, S. GIS-Fuzzy DEMATEL MCDA model for the evaluation of the sites for ecotourism development: A case study of “Dunavski ključ” region, Serbia. Land Use Policy 2016, 58, 348–365. [Google Scholar] [CrossRef]
- Giglio, L.; Boschetti, L.; Roy, D.P.; Humber, M.L.; Justice, C.O. The collection 6 MODIS burned area mapping algorithm and product. Remote Sens. Environ. 2018, 217, 72–85. [Google Scholar] [CrossRef]
- Silveira, M.V.F.; Petri, C.A.; Broggio, I.S.; Chagas, G.O.; Macul, M.S.; Leite, C.C.S.S.; Ferrari, E.M.M.; Amim, C.G.V.; Freitas, A.L.R.; Motta, A.Z.V.; et al. Drivers of Fire Anomalies in the Brazilian Amazon: Lessons Learned from the 2019 Fire Crisis. Land 2020, 9, 516. [Google Scholar] [CrossRef]
- Melo, F. Receiver operating characteristic (ROC) curve. In Encyclopedia of Systems Biology; Dubitzky, W., Wolkenhauer, O., Cho, K.H., Yokota, H., Eds.; Springer: New York, NY, USA, 2013. [Google Scholar]
- Li, F.; He, H. Assessing the accuracy of diagnostic tests. Shanghai Arch. Psychiatry 2018, 30, 207–212. [Google Scholar] [PubMed]
- CORINE Land Cover 2018 classes. Available online: https://land.copernicus.eu/user-corner/technical-library/corine-land-cover-nomenclature-guidelines/docs/pdf/CLC2018_Nomenclature_illustrated_guide_20190510.pdf (accessed on 12 April 2023).
- Lukić, T.; Gavrilov, M.B.; Marković, S.B.; Komac, B.; Zorn, M.; Mlađan, D.; Đorđević, J.; Milanović, M.; Vasiljević, D.A.; Vujičić, M.D.; et al. Classification of natural disasters between the legislation and application: Experience of the Republic of Serbia. Acta Geogr. Slov. 2013, 53, 150–164. [Google Scholar] [CrossRef]
- Lan, Z.; Su, Z.; Guo, M.; Alvarado, E.C.; Guo, F.; Hu, H.; Wang, G. Are Climate Factors Driving the Contemporary Wildfire Occurrence in China? Forests 2021, 12, 392. [Google Scholar] [CrossRef]
- Valjarević, A.; Popovici, C.; Štilić, A.; Radojković, M. Cloudiness and water from cloud seeding in connection with plants distribution in the Republic of Moldova. Appl. Water Sci. 2022, 12, 262. [Google Scholar] [CrossRef]
- Burić, D.; Doderović, M. Trend of Percentile Climate Indices in Montenegro in the Period 1961–2020. Sustainability 2022, 14, 12519. [Google Scholar] [CrossRef]
Figure 1.
Map of the location of Montenegro. (a) location of Budva; (b) location of Rožaje.

Figure 2.
Methodological framework of wildfire susceptibility using GIS-MCDA.

Figure 3.
Historical wildfires in Budva (a) and Rožaje (b).

Figure 4.
Standardized natural and anthropogenic criteria for Budva. (a) Land cover; (b) aspect; (c) slope; (d) elevation; (e) temperature; (f) precipitation; (g) distance from road; (h) distance from settlements; (i) exclusion criterion.
Figure 4.
Standardized natural and anthropogenic criteria for Budva. (a) Land cover; (b) aspect; (c) slope; (d) elevation; (e) temperature; (f) precipitation; (g) distance from road; (h) distance from settlements; (i) exclusion criterion.

Figure 5.
Standardized natural and anthropogenic criteria for Rožaje. (a) Land cover; (b) aspect; (c) slope; (d) elevation; (e) temperature; (f) precipitation; (g) distance from roads; (h) distance from settlements; (i) exclusion criterion.
Figure 5.
Standardized natural and anthropogenic criteria for Rožaje. (a) Land cover; (b) aspect; (c) slope; (d) elevation; (e) temperature; (f) precipitation; (g) distance from roads; (h) distance from settlements; (i) exclusion criterion.

Figure 6.
F-AHP matrix with weight coefficients for criteria.

Figure 7.
Results of AHP (a) and F-AHP (b) models for Budva.

Figure 8.
Results of AHP (a) and F-AHP (b) models for Rožaje.

Figure 9.
Results of the ROC curve analysis with AUC values. (a) Budva; (b) Rožaje.


Table 1.
Criteria with format and source.
| Code | Criteria | Data Types | Source |
|---|---|---|---|
| C1 | Land Cover | Vector, ESRI Shapefile | European Environmental Protection Agency [75] |
| C2 | Aspect | Raster, GeoTIFF (25 m) | European Environmental Protection Agency [76] |
| C3 | Slope | Raster, GeoTIFF (25 m) | European Environmental Protection Agency [76] |
| C4 | Elevation | Raster, GeoTIFF (25 m) | European Environmental Protection Agency [76] |
| C5 | Temperature | Raster, GeoTIFF (25 m) using interpolation | Institute of Hydrometeorology and Seismology of Montenegro [77] |
| C6 | Precipitation | Raster, GeoTIFF (25 m) using interpolation | Institute of Hydrometeorology and Seismology of Montenegro [77] |
| C7 | Distance from road | Vector, ESRI Shapefile | Geofabrik [78] |
| C8 | Distance from settlements | Vector, ESRI Shapefile | Geofabrik [78] |
| C9 | Exclusion criterion | Vector, ESRI Shapefile | European Environmental Protection Agency [75] |
Table 2.
Standardization of criteria.
| Intensity of Importance | |||||
|---|---|---|---|---|---|
| Criteria Code | Very Low (1) | Low (2) | Moderate (3) | High (4) | Very High (5) |
| C1 * | - | 242, 311 | 231, 243, 312, 313, 321, 324, 332 | 323, 333 | |
| C2 | N | NE, NW | E, W | SE, Flat | S, SW |
| C3 | <5° | 10° | 15° | 20° | >20° |
| C4 | >1000 | 750–1000 m | 500–750 m | 200–500 m | <200 m |
| C5 | <4 °C | 4–7 °C | 7–9 °C | 9–12 °C | >12 °C |
| C6 | >3000 mm | 2500–3000 mm | 2000–2500 mm | 1700–2000 mm | <1700 mm |
| C7 | >1000 m | 1000–800 m | 400–600 m | 200–400 m | <200 m |
| C8 | >2000 m | 1500–2000 m | 1000–1500 m | 500–1000 m | <500 m |
* CLC 2018 third level nomenclature. Available online: https://land.copernicus.eu/user-corner/technical-library/corine-land-cover-nomenclature-guidelines/html (accessed on 12 April 2023).
Table 3.
Fundamental scale [86].
Table 3.
Fundamental scale [86].
| Intensity of Importance | Definition |
|---|---|
| 1 | Equal importance |
| 3 | Moderate importance of one over another |
| 5 | Essential or strong importance |
| 7 | Very strong importance |
| 9 | Extreme importance |
| 2, 4, 6, 8 | Intermediate values |
Table 4.
Values for RI [85].
Table 4.
Values for RI [85].
| Size of Matrix | 1 | 2 | 3 | 4 | 5 | 6 | 7 | 8 | 9 | 10 |
|---|---|---|---|---|---|---|---|---|---|---|
| RI | 0 | 0 | 0.58 | 0.90 | 1.12 | 1.24 | 1.32 | 1.41 | 1.45 | 1.49 |
Table 5.
AHP matrix with weight coefficients for criteria.
| C1 | C2 | C3 | C4 | C5 | C6 | C7 | C8 | Weight | |
|---|---|---|---|---|---|---|---|---|---|
| C1 | 1 | 7 | 7 | 7 | 5 | 5 | 4 | 5 | 0.387 |
| C2 | 1/7 | 1 | 3 | 3 | 1/3 | 1/3 | 1/5 | 1/5 | 0.059 |
| C3 | 1/7 | 1/3 | 1 | 2 | 1/2 | 1/2 | 1/2 | 1/2 | 0.049 |
| C4 | 1/7 | 1/3 | 1/2 | 1 | 1/2 | 1/2 | 1/4 | 1/4 | 0.033 |
| C5 | 1/5 | 3 | 2 | 2 | 1 | 3 | 1/3 | 1/4 | 0.090 |
| C6 | 1/5 | 3 | 2 | 2 | 1/3 | 1 | 1/3 | 1/3 | 0.070 |
| C7 | 1/4 | 5 | 2 | 4 | 3 | 3 | 1 | 2 | 0.164 |
| C8 | 1/5 | 5 | 2 | 4 | 4 | 3 | 1/2 | 1 | 0.148 |
| Count = 8 lambda max = 8.959 CI = 0.137 CR = 0.097 constant = 1.410 | |||||||||
Table 6.
Percentage of susceptibility category for Budva.
| Susceptibility Category | AHP | F-AHP | ||
|---|---|---|---|---|
| ha | % | ha | % | |
| Excluded areas | 1033.06 | 8.56 | 1033.06 | 8.56 |
| Moderate | 1269.75 | 10.52 | 1295.58 | 10.73 |
| High | 5317.31 | 44.04 | 5349.71 | 44.31 |
| Very high | 4453.31 | 36.89 | 4395.08 | 36.40 |
| Total | 12,073.44 | 100 | 12,073.44 | 100 |
Table 7.
Percentage of susceptibility category for Rožaje.
| Susceptibility Category | AHP | F-AHP | ||
|---|---|---|---|---|
| ha | % | ha | % | |
| Excluded areas | 389.94 | 0.91 | 389.94 | 0.91 |
| Moderate | 7915.80 | 18.45 | 7207.02 | 16.80 |
| High | 33,533.14 | 78.15 | 34,070.83 | 79.40 |
| Very high | 1071.20 | 2.50 | 1242.29 | 2.90 |
| Total | 42,910.08 | 100 | 42,910.08 | 100 |
Disclaimer/Publisher’s Note: The statements, opinions and data contained in all publications are solely those of the individual author(s) and contributor(s) and not of MDPI and/or the editor(s). MDPI and/or the editor(s) disclaim responsibility for any injury to people or property resulting from any ideas, methods, instructions or products referred to in the content. |
© 2023 by the authors. Licensee MDPI, Basel, Switzerland. This article is an open access article distributed under the terms and conditions of the Creative Commons Attribution (CC BY) license (https://creativecommons.org/licenses/by/4.0/).
Share and Cite
MDPI and ACS Style
Nikolić, G.; Vujović, F.; Golijanin, J.; Šiljeg, A.; Valjarević, A. Modelling of Wildfire Susceptibility in Different Climate Zones in Montenegro Using GIS-MCDA. Atmosphere 2023, 14, 929. https://doi.org/10.3390/atmos14060929
AMA Style
Nikolić G, Vujović F, Golijanin J, Šiljeg A, Valjarević A. Modelling of Wildfire Susceptibility in Different Climate Zones in Montenegro Using GIS-MCDA. Atmosphere. 2023; 14(6):929. https://doi.org/10.3390/atmos14060929
Chicago/Turabian StyleNikolić, Gojko, Filip Vujović, Jelena Golijanin, Ante Šiljeg, and Aleksandar Valjarević. 2023. "Modelling of Wildfire Susceptibility in Different Climate Zones in Montenegro Using GIS-MCDA" Atmosphere 14, no. 6: 929. https://doi.org/10.3390/atmos14060929
Note that from the first issue of 2016, this journal uses article numbers instead of page numbers. See further details here.